Competitor analysis in Google Ads is the research of advertising strategies used by businesses within your market. By studying their keywords, performance metrics, ad creatives, and more, you can gain valuable insights to optimize your own campaigns. Let’s walk through Google Ads competitor analysis step by step and explore the best practices to follow.
Why analyze Google Ads competitors
Here are the primary reasons to analyze Google Ads competition:
- Spot competitor keywords that you don’t target: Competitors might be bidding on high-performing keywords that you haven’t considered. By identifying these, you’ll expand your keyword list to drive more relevant traffic to your ads and capture potential customers you would have otherwise missed.
- Learn what works and what doesn’t in competitors’ ads: To understand which messaging resonates with your audience, it’s crucial to evaluate competitors’ ad copies and assets. Strong-performing ads often highlight customer pain points, benefits, or unique selling propositions that drive clicks. And vice versa: you’ll discover what to avoid in your campaigns by identifying less successful ads.
- Compare competitors’ ad spending to plan your budget better: Insights into competitors’ ad spending give a clearer view of industry benchmarks. They help you adjust your budget to remain competitive without going overboard.
Now, let’s review the types of Google Ads competitors you can research.
Types of competitors in Google Ads
In Google Ads, competitors fall into several primary types based on their strategies, goals, and relevance to your business. For example, let’s consider Google with its Google Sheets product and look at its competitors.

Direct competitors
The products or services of these businesses provide solutions similar to yours and target the same audience. They compete for keywords aligned with your offerings to attract customers seeking those solutions.
Example: Google Sheets’ direct competitors will be apps such as MobiSheets and Grist.

Indirect competitors
Indirect competitors target the same audience but provide alternative solutions that fulfill a similar need. While their offerings differ from yours, they still can pull traffic away from ads.
Example: Airtable competes with Google Sheets by providing an alternative solution through databases.

Replacement competitors
These competitors offer substitutes for what you provide. They can draw away your audience by solving the same problems differently.
Example: Tableau and Microsoft’s Power BI substitute Googe Sheets for advanced data visualization and analytics.

Niche competitors
Niche competitors are focused on a narrow market segment. They often target long-tail keywords and niche audiences, making their ads highly relevant and cost-effective.
Example: Smartsheet, a niche spreadsheet-like product, competes with Google Sheets in specialized markets such as team collaboration and workflow automation.


New market entrants
These are emerging competitors in your industry. They often bid aggressively to gain quick visibility, driving up CPC.
Example: Row Zero is a relatively new product that competes with Google Sheets.

There are also local competitors who compete for traffic within a specific area, seasonal competitors, and those bidding on your brand terms, among others. With this in mind, let’s proceed to analyze your Google Ads competition step by step.
How to do competitor analysis in Google Ads
Throughout the process, you need to identify your competitors, research the keywords they target, track their ad spend, and analyze their creatives and landing pages.
1. Identify your key competitors
Look for businesses that target the same audience and offer similar products or services. The basic approach is to explore ads on the platforms where they appear, depending on the specific campaign type. A case in point: for paid search ads, simply type in your primary keywords on Google Search and observe the advertisers that consistently appear.
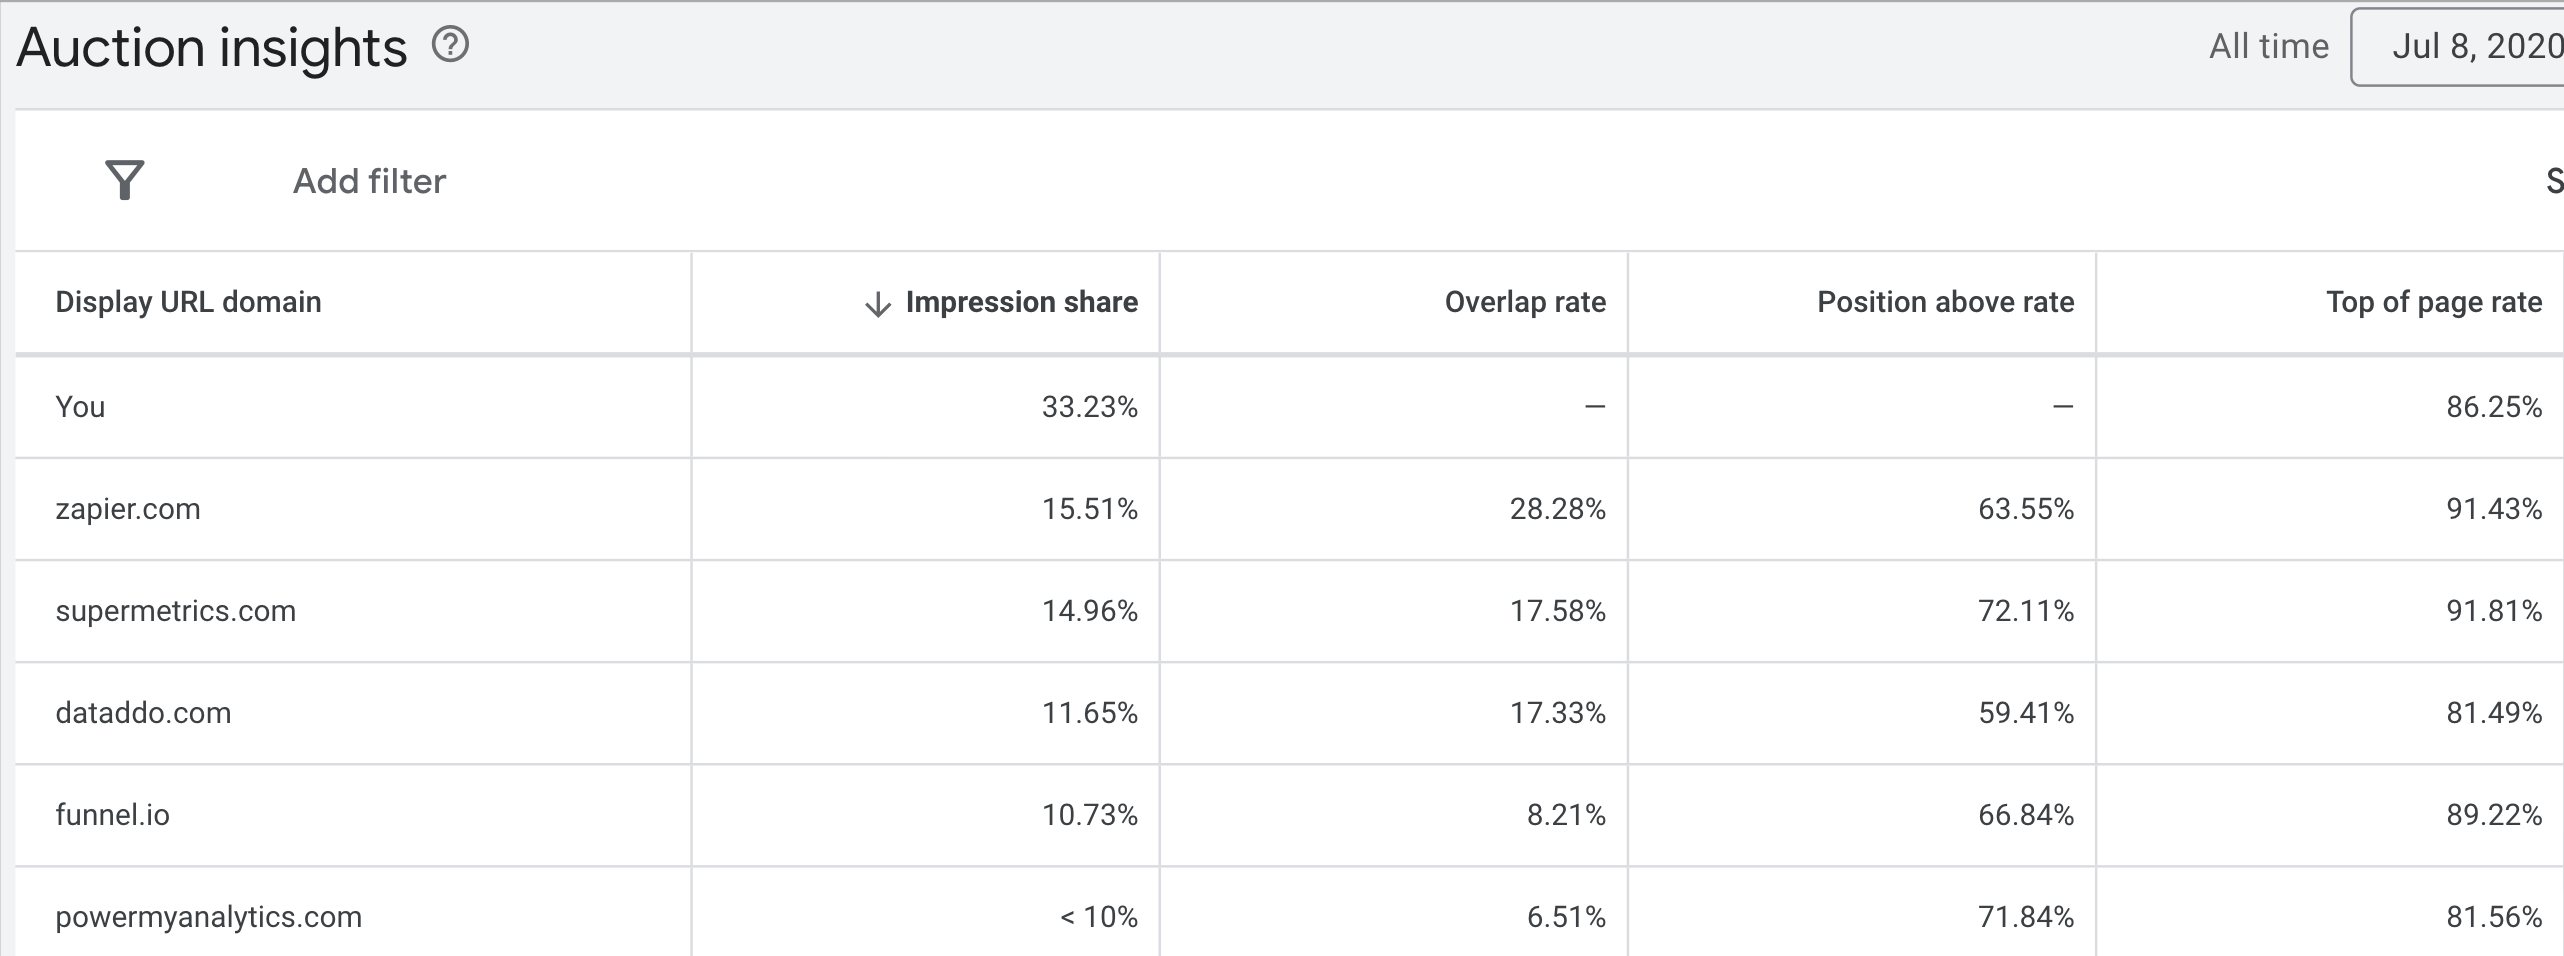
For Search, Shopping, and Performance Max campaigns, you can also use Google Ads’ auction insights. Log in to your account, navigate to the Insights and reports tab, and click Auction insights from the list. Next, select the campaign and review the data to see which competitors bid on the same keywords. Here, you’ll get numbers like impression share, overlap rate, position above rate, top-of-page rate, absolute top-of-page rate, and outranking share.

To research competitors for Shopping campaigns only, use Google’s Merchant Center. Navigate to the Analytics page and click Products. Next, proceed to the Competitors tab. It will help you better understand how you compare to merchants with the highest visibility in a specific category and country. Besides, you’ll learn how you rank against competitors and top market performers over time.
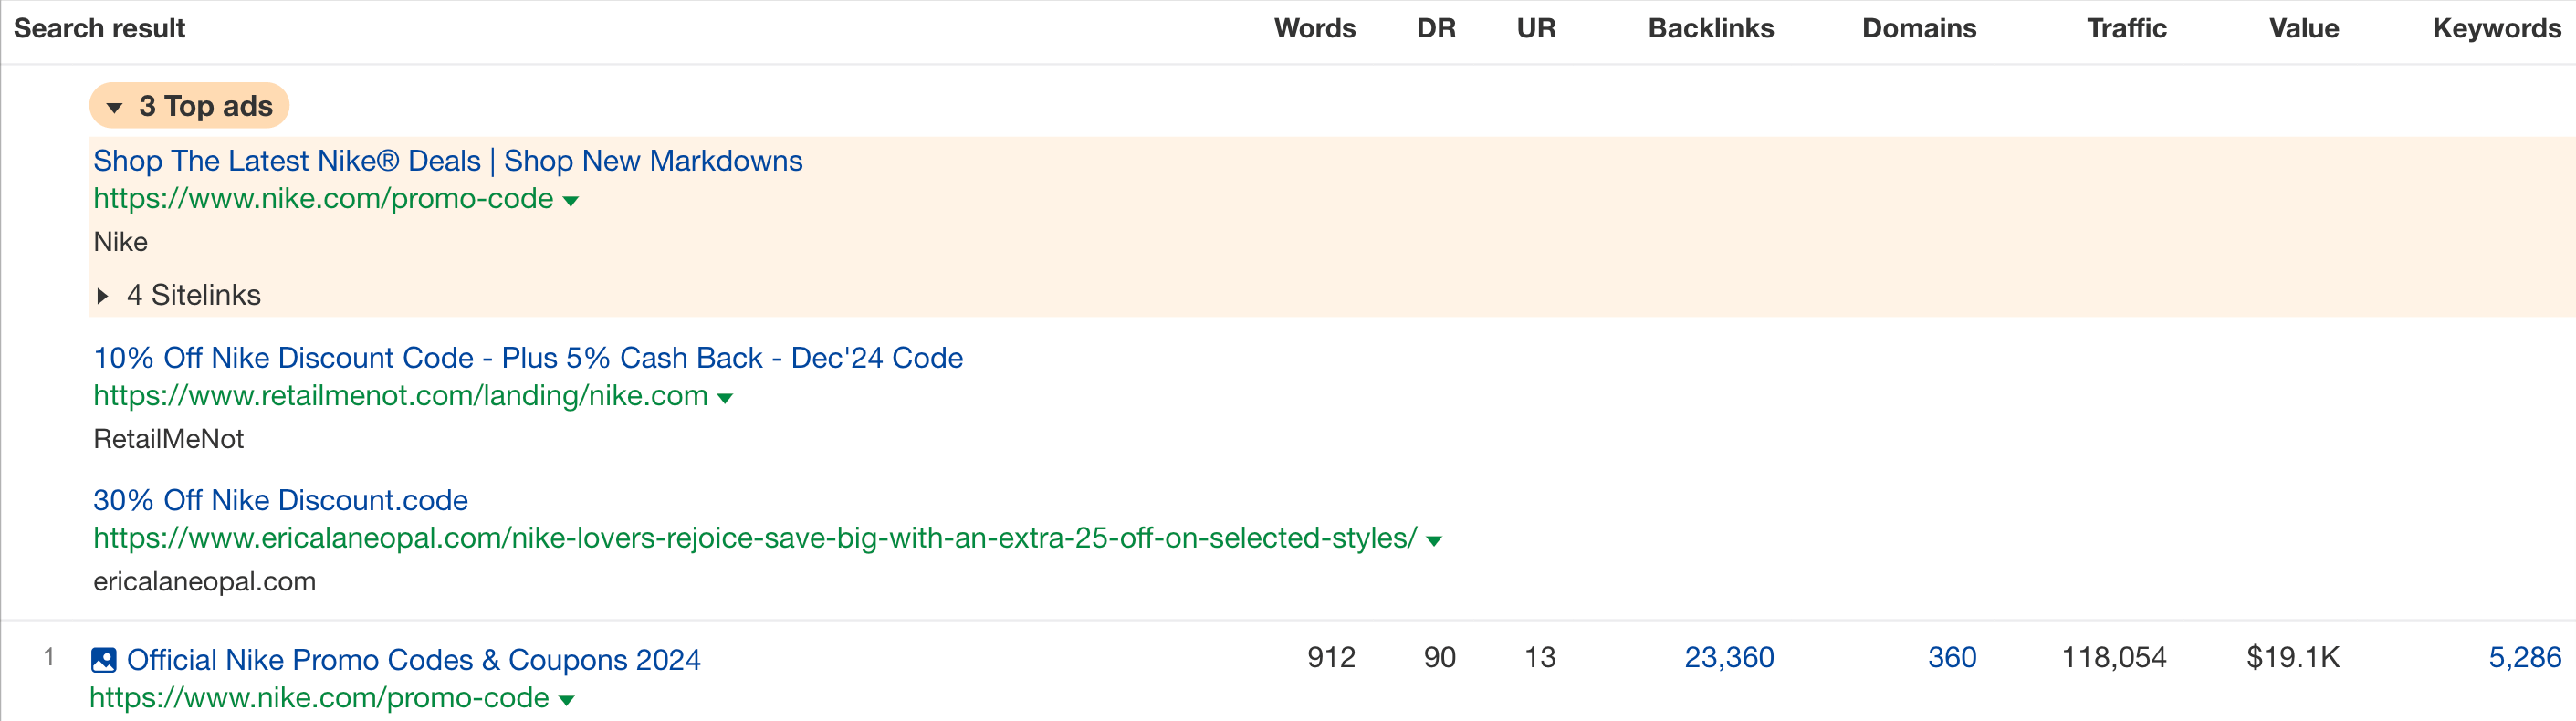
Alternatively, use external tools to identify competitors. For example, with Ahrefs, you can go to Site Explorer, click the Paid keywords tab, and spot competitors’ ads.

When you find your competitors, proceed to the next step.
2. Research the keywords your competitors target
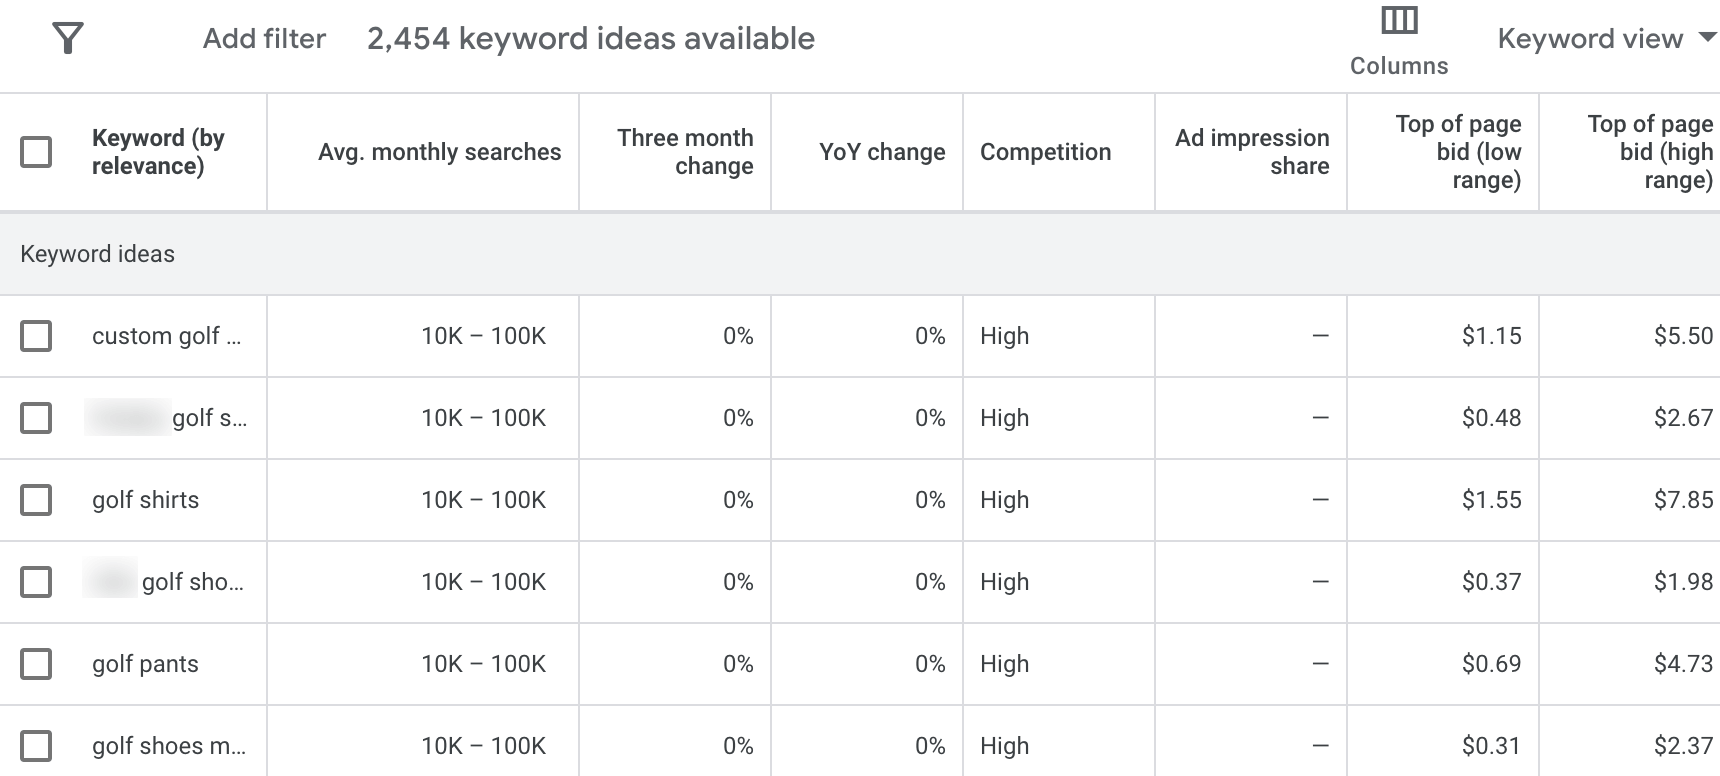
Now it’s time to research competitors’ keywords, which serve as building blocks of their Google Ads campaigns. One way you can do this is by using Google Keyword Planner. You can enter a competitor’s URL or specific keywords. Either way, you’ll get a list of suggested keywords and metrics such as average monthly searches, competition, and top-of-page bids.

To go beyond Google Ads’ native analytics capabilities, you can use external tools. Again, let’s take Ahrefs as an example. Once you’ve found your competitors, navigate to the already mentioned Site Explorer feature to research their keywords in the Paid keywords tab. You’ll access keyword search volume and difficulty, CPC, traffic, and position.

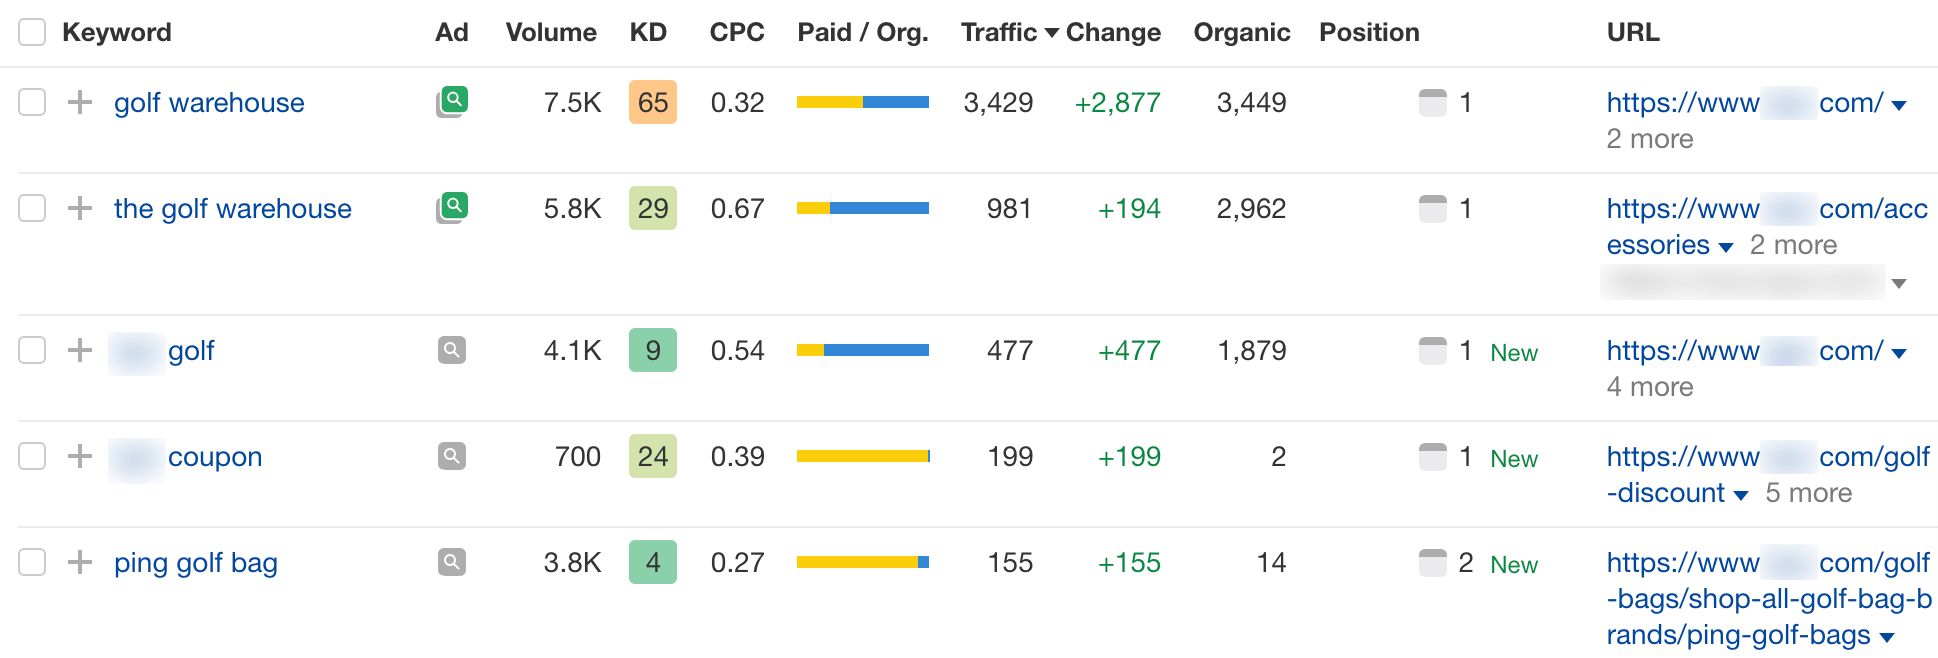
When analyzing your competitors’ keywords, compare them with your own and look for the following:
- Gaps: Keywords your Google Ads competitors rank for that you don’t. These represent opportunities for content creation or ad targeting.
- Overlap: Keywords both you and your competitors target. Analyze how you can improve your rankings or ad performance for these keywords.
- Unique keywords: Keywords you rank for that your competitors don’t. Ensure you make the most of them by optimizing your content and ads further.
After identifying the keywords targeted for Google Ads competitor campaigns, proceed to estimate how much they spend.
3. Track the competitors’ advertising spend
Note that this step is limited in metrics. Except for CPC and traffic cost, which are easy-to-access metrics, other data are typically not public, and exact figures are difficult to obtain. Still, you can find ad spend estimates in tools like Semrush and SpyFu.

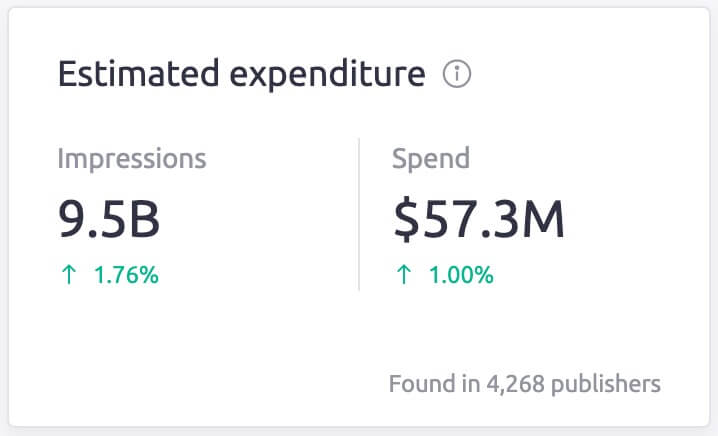
Another option is to research open data on the web that competitors may have revealed or try to find it with AI-powered answer engines like ChatGPT or Perplexity. You also have to analyze Google Ads competitors in terms of their bidding strategies to discover how they allocate their budgets and optimize their campaigns:
- Check out competitors’ ad spend and impression share metrics. This will show how aggressively they compete for keywords. Higher ad spend typically comes with a strong commitment to capturing market share.
- Compare your ad spend with that of your competitors to identify gaps and points for improvement. Assess whether you are investing as much in high-performing keywords, and consider adjusting your budget allocation based on competitor insights.
- Explore opportunities to optimize your bids in response to the actions of your competitors. For example, you can raise bids to compete for high-value keywords better.
Let’s now analyze Google Ads competitors from the perspective of their target audience.
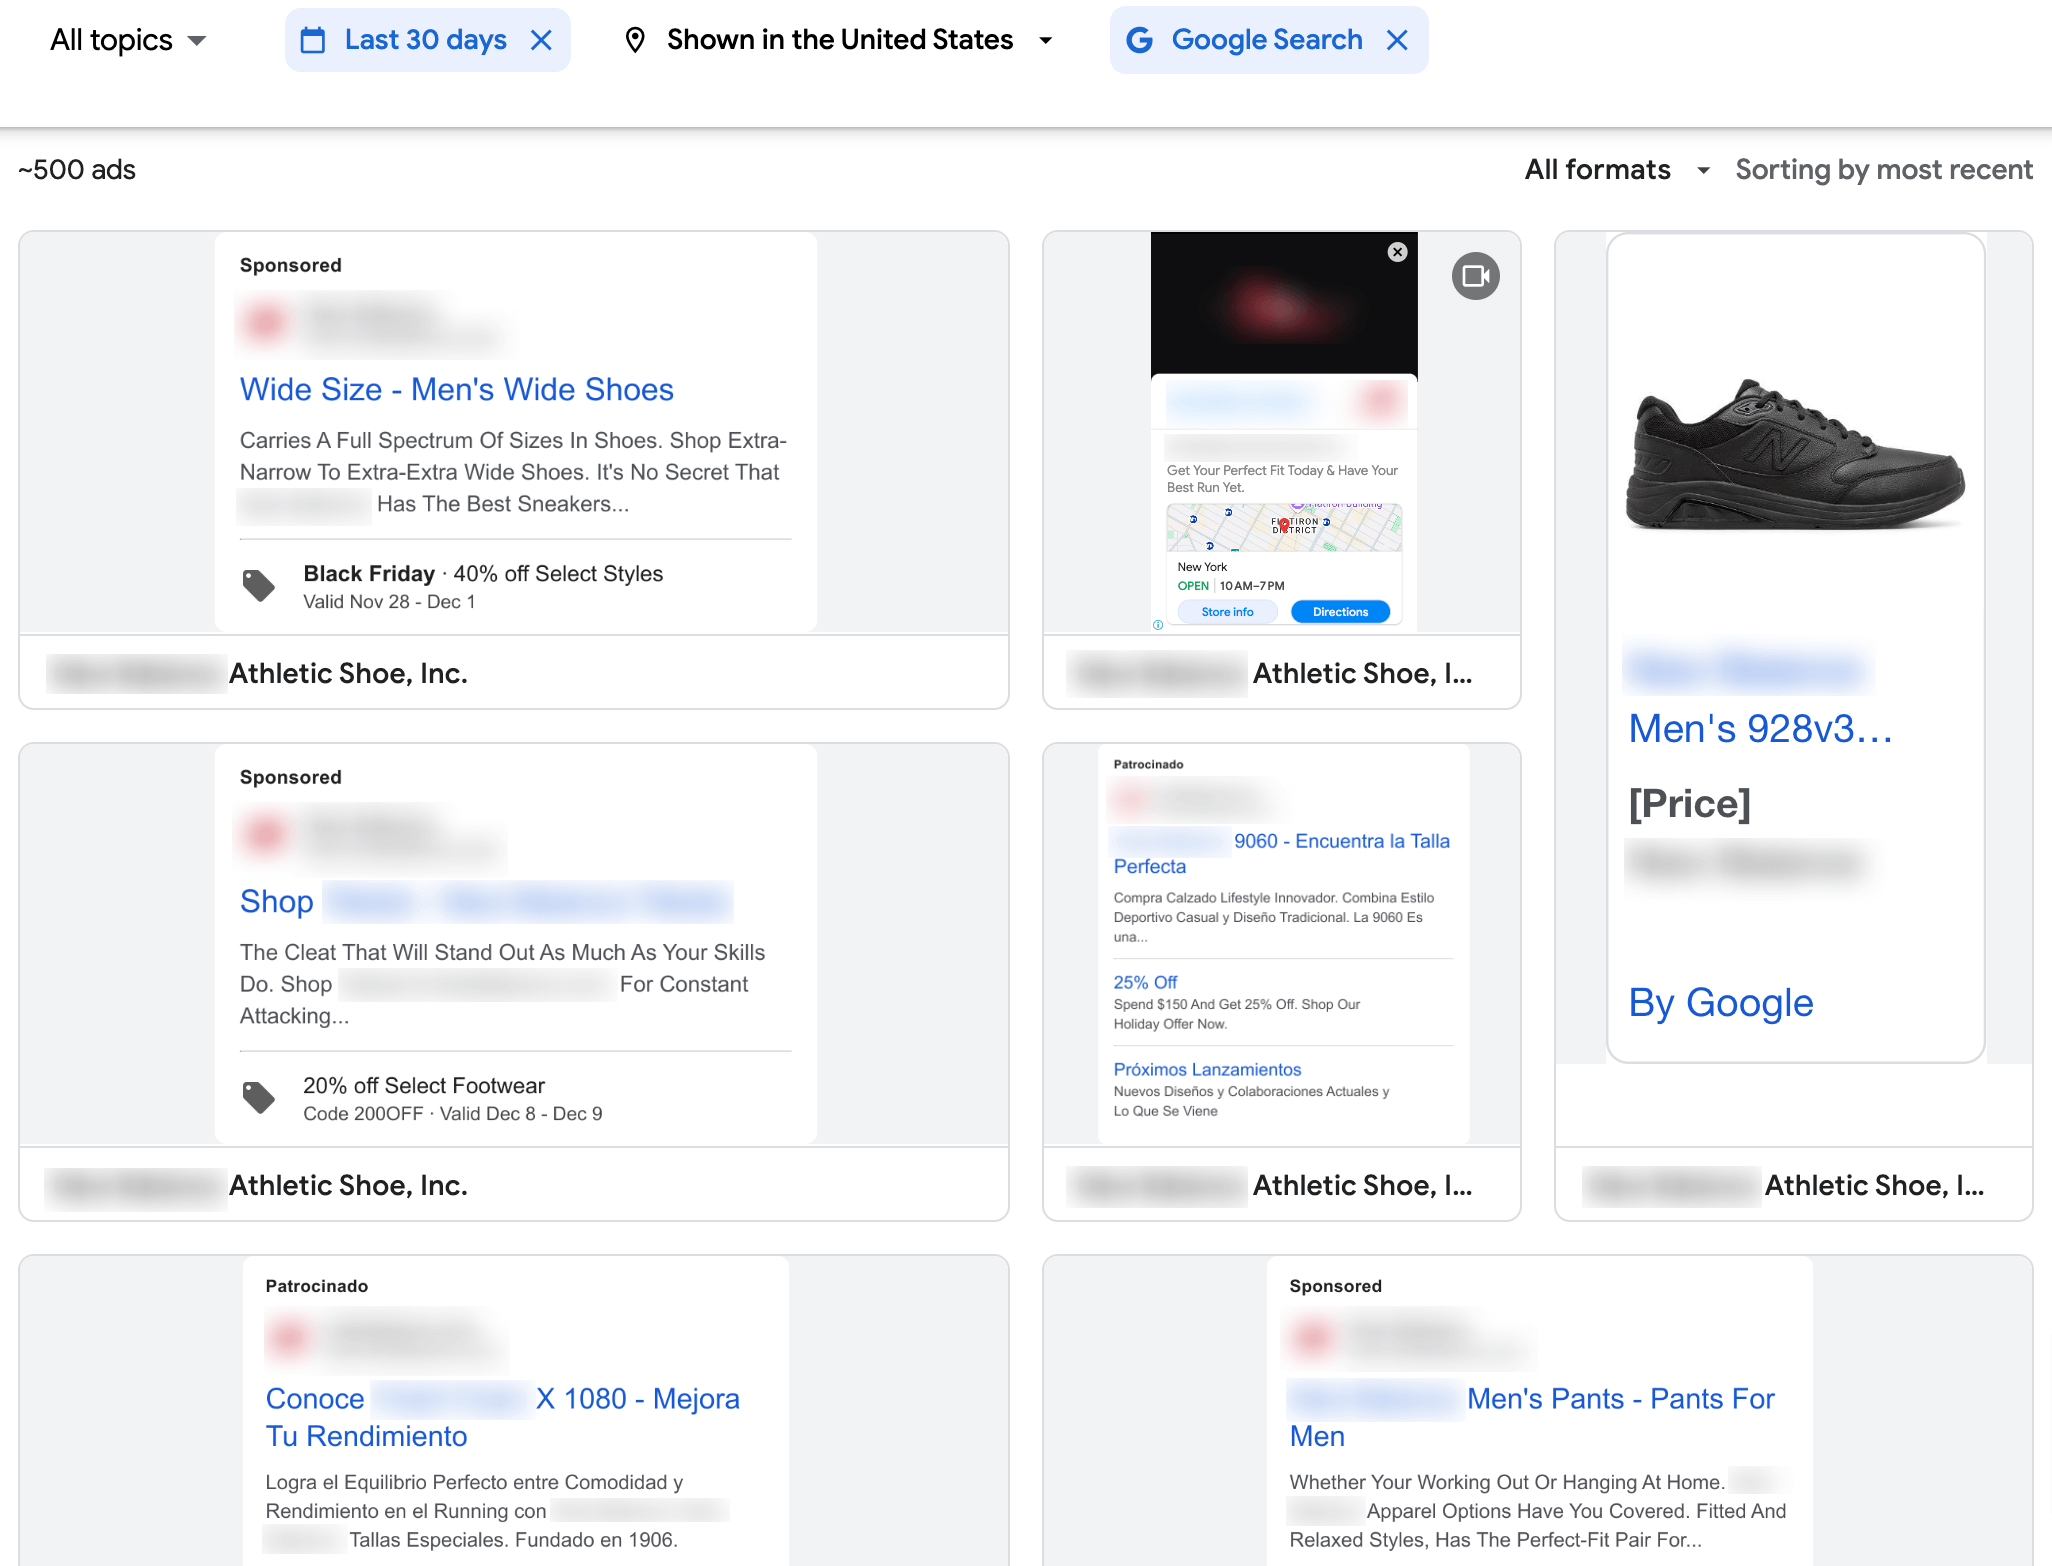
4. Analyze your competitors’ ad creatives
First, you need to select the ad copies you’ll analyze. For more than just active ads on Google’s Search and other platforms, you can visit the Ads Transparency Center. Choose the period, region, and platform, then search for the competitor to access a library of ads for your consideration.

Now, analyze the ad copy elements as explained in the table below:
| Ad copy element | How to analyze |
|---|---|
| Headlines and description | Assess whether headlines and descriptions include pain points, emotional triggers, questions, calls to action, or direct value propositions. Check if a copy is catchy and straight to the point. |
| Value proposition | Examine how competitors highlight their unique selling points. Do they emphasize benefits, discounts, or special features? |
| Tone and style | Is the copy’s tone and style formal, casual, or conversational? How does it align with the brand’s overall voice? |
| Use of keywords | Define how competitors integrate keywords into their ad copy. Do they focus on broad-match, phrase-match, or exact-match keywords? |
| Display URLs | Review the display URLs to see how competitors structure them. Do they use keyword-rich URLs or dynamic URL parameters? |
| Assets | Take note of any ad assets competitors use, such as site links, callouts, structured snippets, or call extensions. |
| Ad creative | Analyze the visual elements of competitors’ ads, including images, videos, and design. Assess how these elements contribute to the overall effectiveness and appeal of the ads. |
| Social proof | Look for testimonials, reviews, and trust badges that add credibility. |
Next, compare your ad copy to that of your Google Ads competitors to pinpoint strengths and weaknesses to address. Determine how well your ads stand out from competitors. Do you offer something unique or provide a more persuasive value proposition?
After answering these questions, evaluate the destinations to which the ad copies direct the audience – the landing pages.
5. Assess the competitors’ landing pages
A well-designed landing page can make or break a customer journey. Evaluate those of your Google Ads competitors to extract the following insights:
| Landing page element | How to analyze |
|---|---|
| Page URL | Note the URL structure and if it includes relevant keywords or parameters. |
| Content and messaging | Check the landing page’s content and messaging in terms of clarity, relevance, and appeal. |
| Design and layout | Analyze visual elements and page organization. Review the design elements, such as color schemes, images, and videos. Are they visually appealing and aligned with the brand’s message? |
| Forms and calls to action | Assess the effectiveness of calls to action and buttons. Are they clear, urgent, visible, and persuasive? Do they prompt users to take the desired action? Do they contain phrases like “Buy now,” “Learn more,” or “Get a free quote”? Are the forms easy to complete, and do they minimize friction for users? |
| Headings | Look how competitors use headlines and subheadings to grab attention and convey their value proposition. Are they clear, compelling, and relevant to the ad copy? |
| Page speed | Consider the general responsiveness and loading speed of the pages. Test the speed using tools like Google PageSpeed Insights or GTmetrix. Faster load times contribute to a better user experience and higher conversion rates. |
| Mobile responsiveness | Explore how the landing page performs on mobile devices and across different screen sizes. |
| Navigation | Estimate the ease of navigation on the landing page. Is it straightforward and intuitive, or does it require users to search for information? |
Key metrics for Google Ads competitor analysis
Below are the essential metrics, along with explanations of how they are calculated and what they reveal:
Impression share represents the percentage of impressions your competitors’ ads received compared to the total number they were eligible for. It lets you measure how visible your competitors are in the auction relative to you. View this metric in the Google Ads’ Auction insights report. The formula to calculate it is:
Impression share (%) = (Impressions ÷ Eligible impressions) × 100
Example calculation: If your competitor’s ad received 8,000 impressions out of 10,000 eligible impressions, the calculation would be:
Impression share = (8,000 ÷ 10,000) × 100 = 80%
That high impression share suggests your competitor has captured a significant portion of the available impressions in the auction. Thus, they effectively reach their target audience and have a strong presence in the market. Conversely, low impression share numbers show the opposite.
Overlap rate
Another metric available in Google Ads’ Auction insights is the overlap rate, which measures how often your competitor’s ad and your ad appeared in the same auctions. The calculation formula is:
Overlap rate (%) = (Shared auctions ÷ Total auctions ) × 100
Example calculation: If you and your competitor appeared in 500 shared auctions out of 1,000 total auctions, the calculation would be:
Overlap rate = (500 ÷ 1,000) × 100 = 50%
A high overlap rate means that you and your competitors frequently bid on similar keywords and target the same audience. This can help you adjust your strategy to focus on niche keywords or improve your ad quality.
Position above rate
The position above rate shows how often your competitor’s ad ranks higher than yours in the same auction when both were displayed at the same time. Again, you’ll find this metric in the Auction insights report. It’s calculated as:
Position above rate (%) = (Times their ad ranked above yours ÷ Shared auctions) × 100
Example calculation: If your competitor’s ad ranked above yours 300 times out of 500 shared auctions, the calculation would be:
Position above rate = (300 ÷ 500 ) × 100 = 60%
This metric reveals areas where your competitors have a stronger ad position. It prompts you to improve your ad rank through higher bids or better-quality creatives.
Top-of-page rate
The top-of-page rate, one more metric from Action insights, pinpoints how often your competitor’s ad appeared in the top positions of search results. It is calculated by:
Top-of-page rate (%) = ( Top-of-page impressions ÷ Total impressions ) × 100
Example calculation: If your competitor’s ad received 4,000 top-of-page impressions out of 10,000 total impressions, the calculation would be:
Top-of-page rate = (4,000 ÷ 10,000 ) × 100 = 40%
A similarly calculated metric is the absolute top-of-page rate, which reflects how often your competitor’s ad ranked first. A high number in both measurements suggests that you need to improve your bids or ad relevance to secure a spot in the top positions.
Outranking share demonstrates how often your competitor’s ad outranked those of other advertisers, including yours, or when their ad was displayed while others were not. It’s provided by Auction insights and calculated as follows:
Outranking share (%) = (Times competitor’s ad outranked yours ÷ Eligible auctions) × 100
Example calculation: If your competitor’s ad outranked yours 200 times out of 1,000 eligible auctions, the calculation would be:
Outranking share = (200 ÷ 1,000) × 100 = 20%
A high value for this metric suggests that your competitor consistently outranks you. In that case, you need to enhance keyword targeting, bids, or ad relevance to increase your chances of outranking them.
Cost per click (CPC)
Cost per click is the average amount your competitor pays for each click on their ad. Although not available natively in Google Ads, you can find this metric in external tools like Ahrefs, Semrush, SpyFu, and others. The formula to calculate CPC is:
CPC = Total spend ÷ Total clicks
Example calculation: If your competitor spent $1,000 on ads and received 500 clicks, the CPC would be:
CPC = 1,000 ÷ 500 = $2.00
If a competitor’s CPC is lower than yours, it means their ads are well-optimized, leading to higher quality scores. It may also suggest that they bid on less competitive keywords or are better at targeting their audience, which reduces their cost per click.
Traffic cost
Paid traffic cost, a metric available in external tools, estimates the total amount a competitor spends on ads. For example, let’s see how Ahrefs calculates it:
Traffic cost = (Monthly paid traffic for keyword 1 × CPC for keyword 1) + (Monthly paid traffic for keyword 2 × CPC for keyword 2)…
Example calculation: Let’s say the target website ranks for three keywords with the following data:
| Keyword | Monthly paid traffic | CPC | Traffic cost |
|---|---|---|---|
| Keyword 1 | 1,000 | $3.50 | 1,000 × $3.50 = $3,500 |
| Keyword 2 | 800 | $4.00 | 800 × $4.00 = $3,200 |
| Keyword 3 | 1,200 | $2.20 | 1,200 × $2.20 = $2,640 |
Total traffic cost = $3,500 + $3,200 + $2,640 = $9,340
Once you understand competitors’ investments, you can benchmark your spending and identify areas that require more assertive or efficient action.
To understand how your metrics compare to industry standards, check out the article on PPC advertising statistics and benchmarks.
After exploring the quantitative metrics for Google Ads competitor analysis, let’s look at it qualitatively through best practices to make the most of this process.
Best practices for researching Google Ads competition
Continuously track competitors’ ad performance
Google Ads competitor research is an ongoing process. Therefore, you must consistently monitor and analyze your competitors’ ad performance to keep yourself informed of their strategies. By engaging in this practice, you stay alert for emerging patterns and trends over time to adapt your campaigns accordingly later.
Stay updated on industry trends
The digital marketing landscape, including Google Ads, is constantly evolving. To stay competitive, you must capture updates on industry changes. For example, subscribe to relevant newsletters, follow dedicated blogs, or engage in forums. By doing so, you’ll be able to forecast shifts in your competitors’ strategies and run your campaigns proactively.
Apply analysis insights to your campaigns
Use the insights derived from Google Ads competitor research to test new strategies. Let’s say you can implement A/B testing to optimize ad messaging, landing page design, and targeting parameters. By iterating campaigns, you can improve performance and gain a competitive edge in the market.
Monitor campaign performance after adjustments
After adjusting your campaigns, it’s necessary to monitor how the changes have impacted their performance. You can do this using free, ready-made dashboard templates from Coupler.io. This way, your Google Ads data will be automatically exported into BI tools like Google Sheets, Looker Studio, or Power BI and turned into actionable insights. Let’s take a look at some of them.
Google Search Ads performance tracker + editor
This Google Sheets dashboard template allows you to review the performance of responsive search ads and make edits to them. This will help you ensure your campaigns are optimized and consistent across platforms.

To set up the dashboard, go to the template’s Readme tab and follow the provided instructions. Then, select the campaign or ad group for which you’ll modify existing ads or create new ones and act upon the short guide in the Ad edit tool tab.
Google Ads creatives dashboard
Google Ads creatives dashboard in Looker Studio displays the performance of your creatives, including impressions, clicks, and conversions. It enables you to evaluate which ads drive the best results.

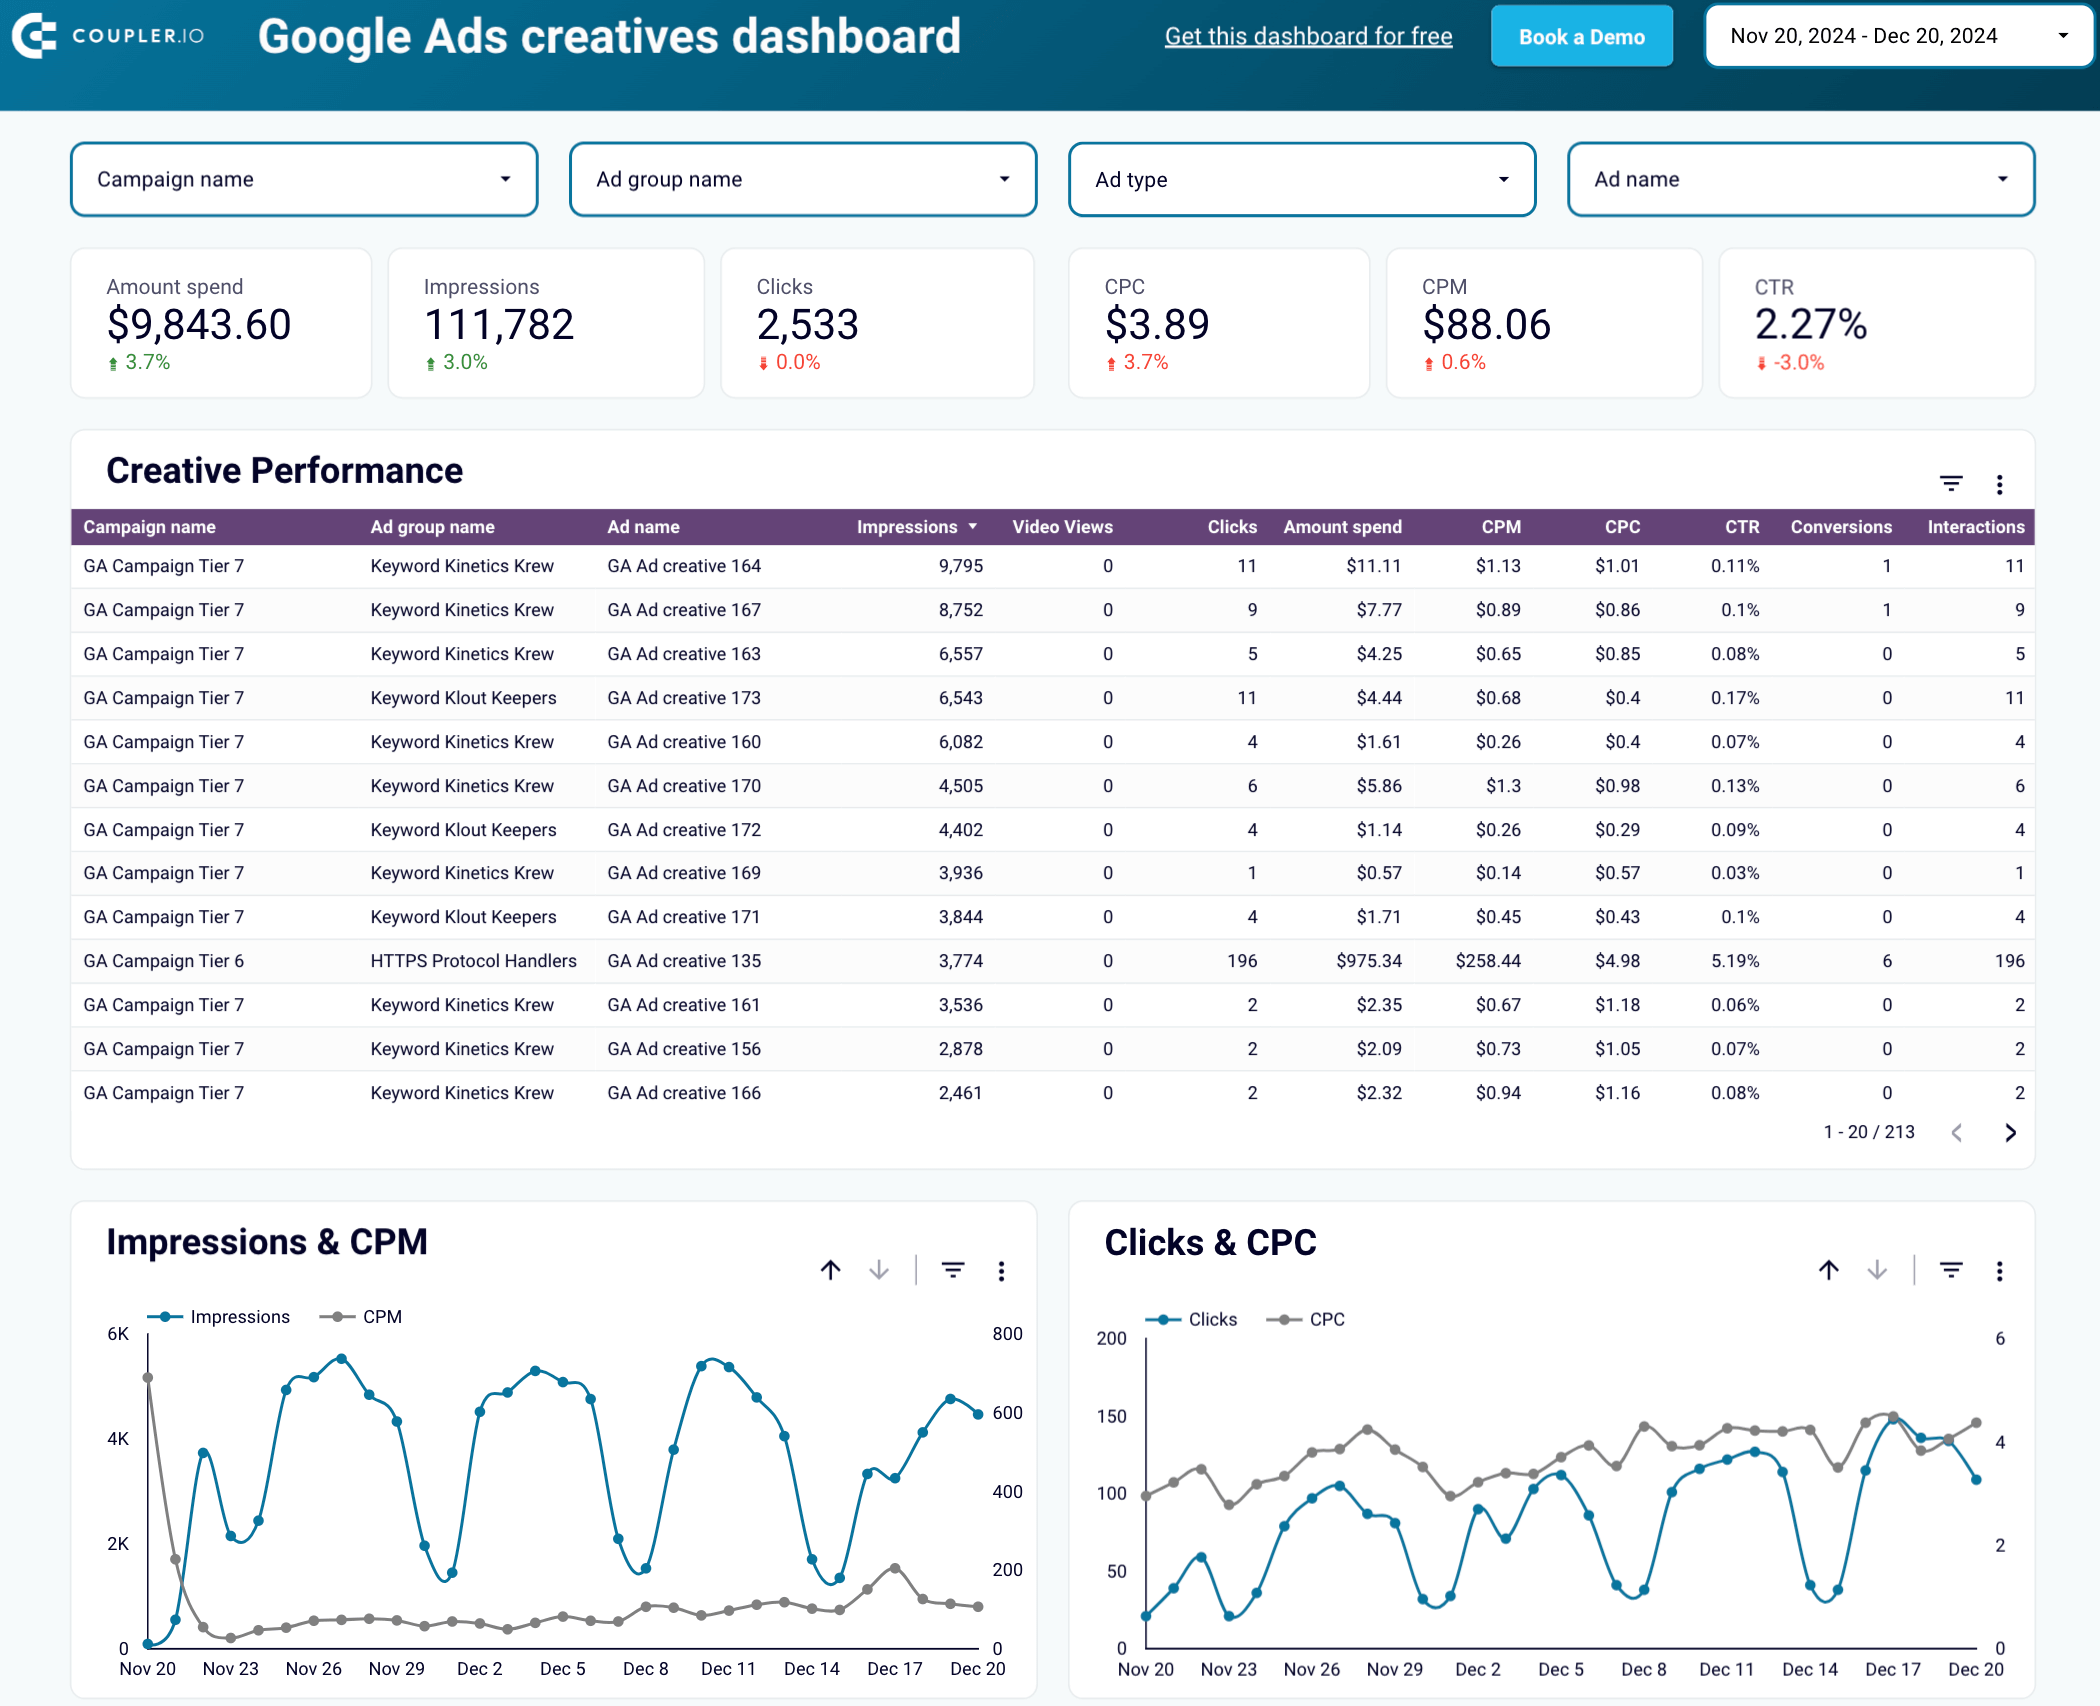
Here’s what you’ll learn using this dashboard:
- Review key performance metrics: Check the amount spent, impressions, video views, interactions, clicks, CPC, cost per mille, click-through rate, and conversions to evaluate the effectiveness of your ads.
- Track your numbers through a specific period: View impressions vs. cost per mille, clicks compared to CPC, and spending dynamics over time to identify seasonal trends in ad performance.
- Look at impressions by ad type: Identify which generates the most impressions: image ads, responsive search ads, responsive display ads, TrueView in-stream video ads, or expanded dynamic search ads.
To get started, follow the instructions in the Readme tab to install the Coupler.io connector, link your Google account, and visualize your ad data in the dashboard.
Quality score analytics dashboard
This Looker Studio dashboard template lets you track the historical quality scores of your Google Ads campaigns to analyze changes over time and identify growth opportunities.

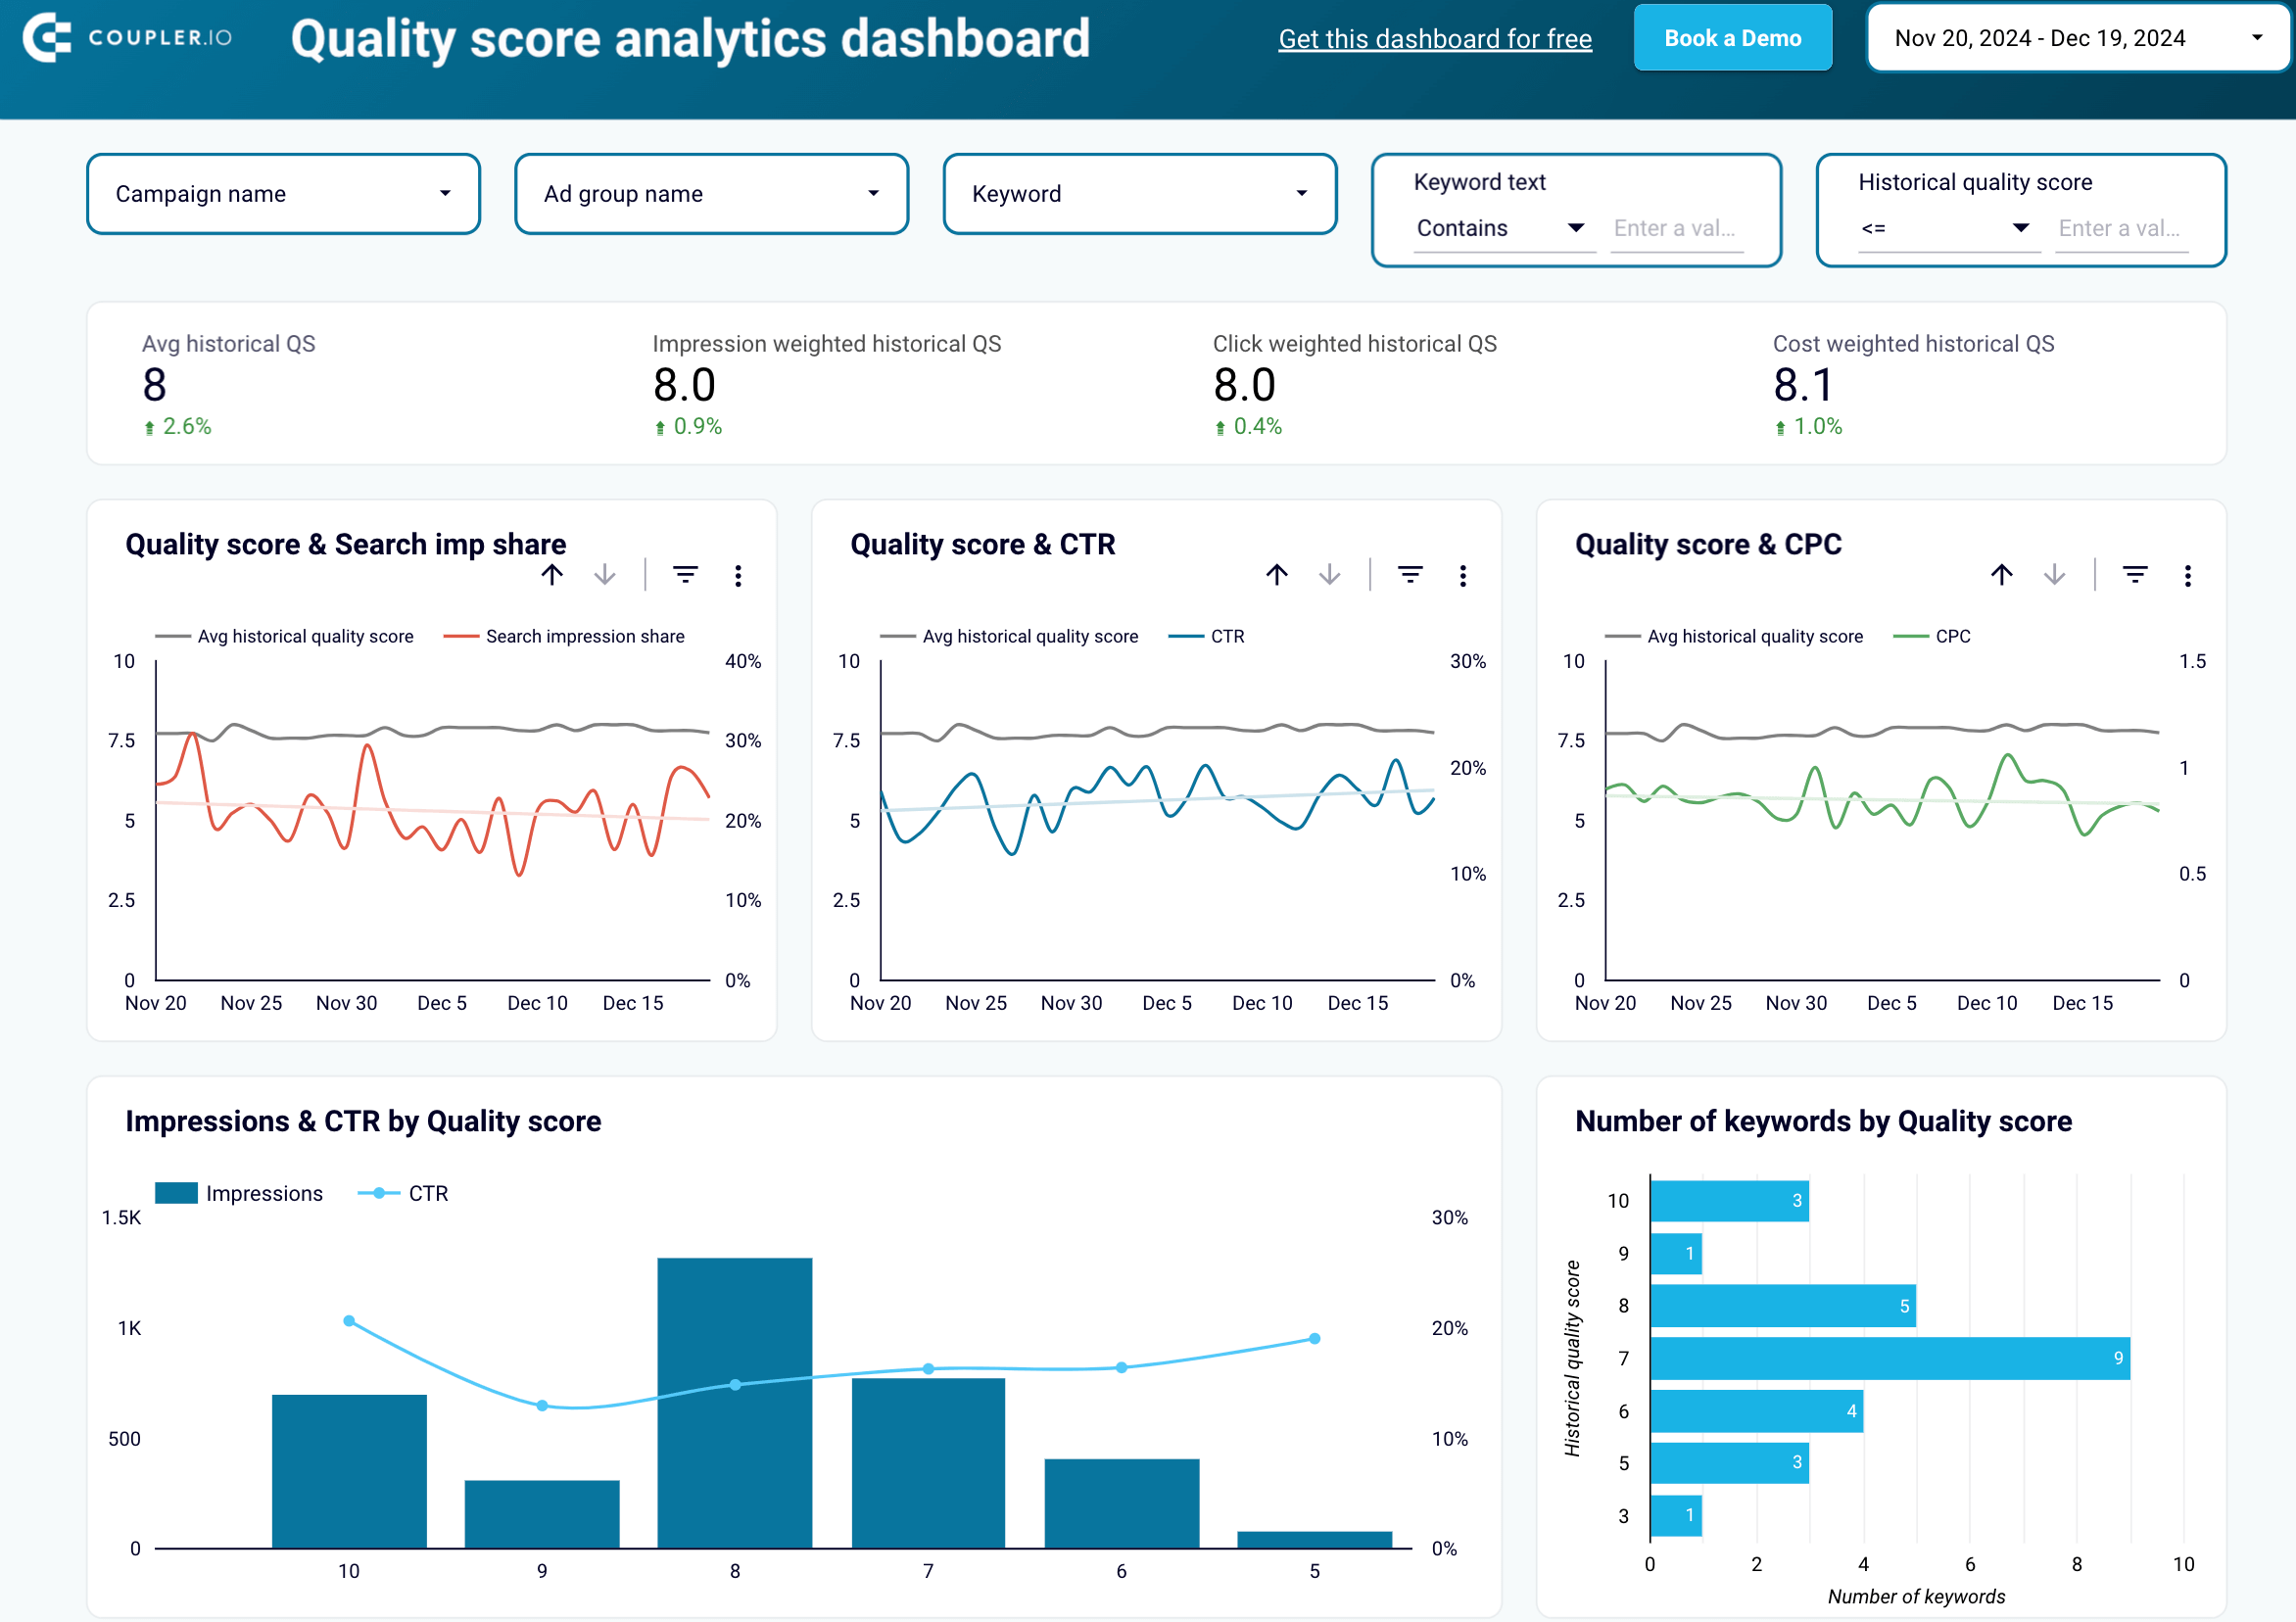
Using this dashboard, you’ll gain the following insights:
- Track quality score and related metrics over time: Compare average historical quality scores with search impressions, click-through rate, and CPC throughout the month.
- Explore data on specific types of historical quality scores: Review figures for impression-weighted, click-weighted, and cost-weighted quality scores, as well as landing page QS and creative QS.
- Analyze quality scores in the broader context of keyword performance: Check keyword-specific quality scores alongside metrics, including the amount spent, clicks, conversions, and cost per conversion across ad groups and campaigns.
Navigate to the Readme tab inside the template to set up the dashboard according to step-by-step instructions.
Keyword performance dashboard
The keyword performance dashboard in Looker Studio displays the performance of your Google Ads campaigns by specific keywords to identify which drives the most value.

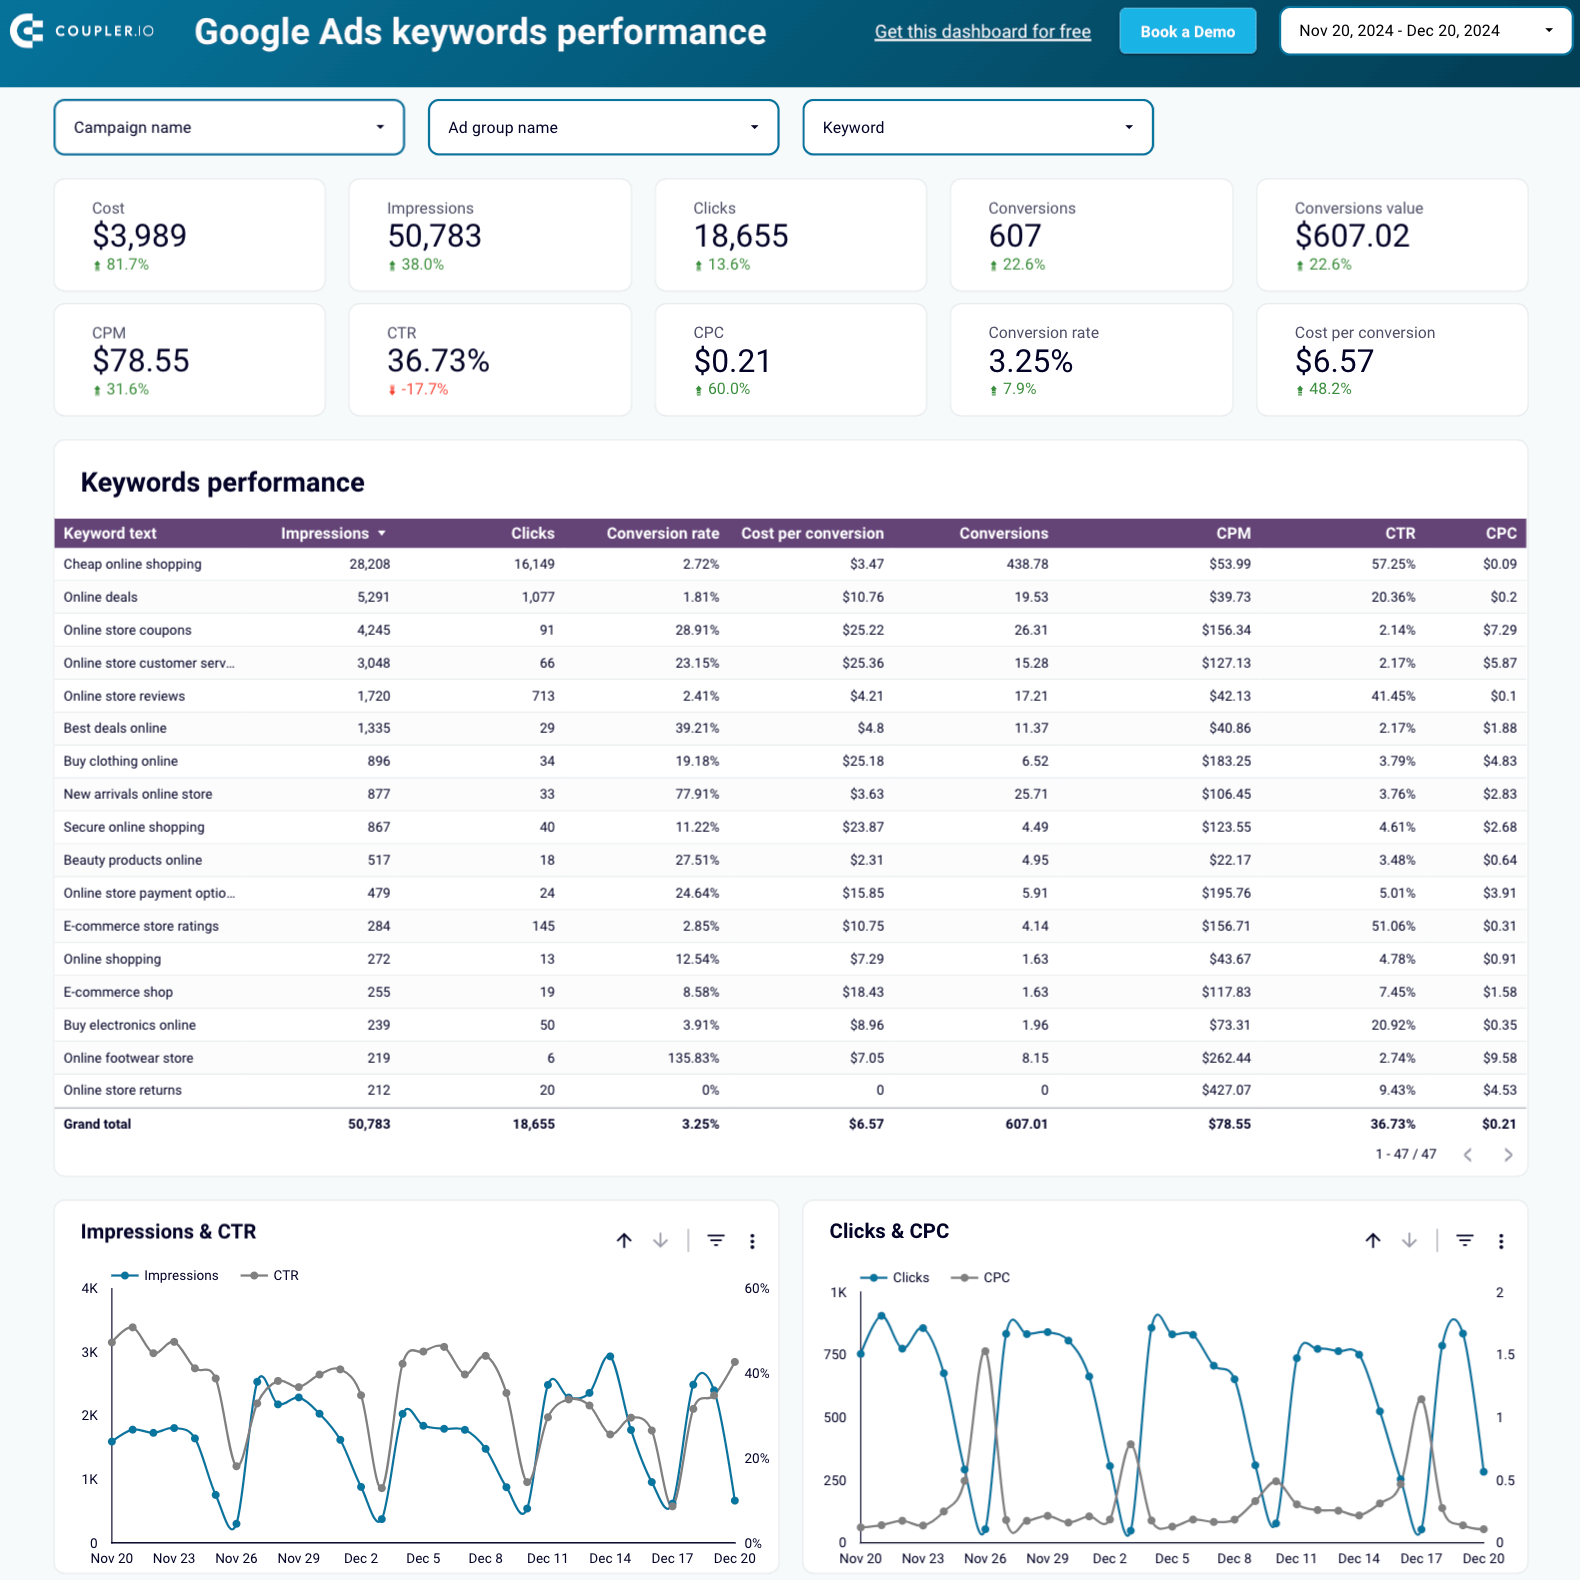
This dashboard reveals the following aspects of keyword performance:
- Keep updated on total and keyword-specific performance metrics: Access multiple data points in one place, such as impressions, cost per mille, clicks, click-through rate, CPC, conversion value, cost per conversion, total cost, and more.
- Spot seasonal trends in keyword performance: Monitor impressions, click-through rates, clicks, CPC, conversions, and cost per conversion month-to-month.
- Discover the most clickable keywords: Get a list of top-performing keywords based on clicks to understand which ones drive the highest engagement.
To start using this dashboard, navigate to the Readme tab and follow the straightforward setup guide to fetch your Google Ads data into Looker Studio.
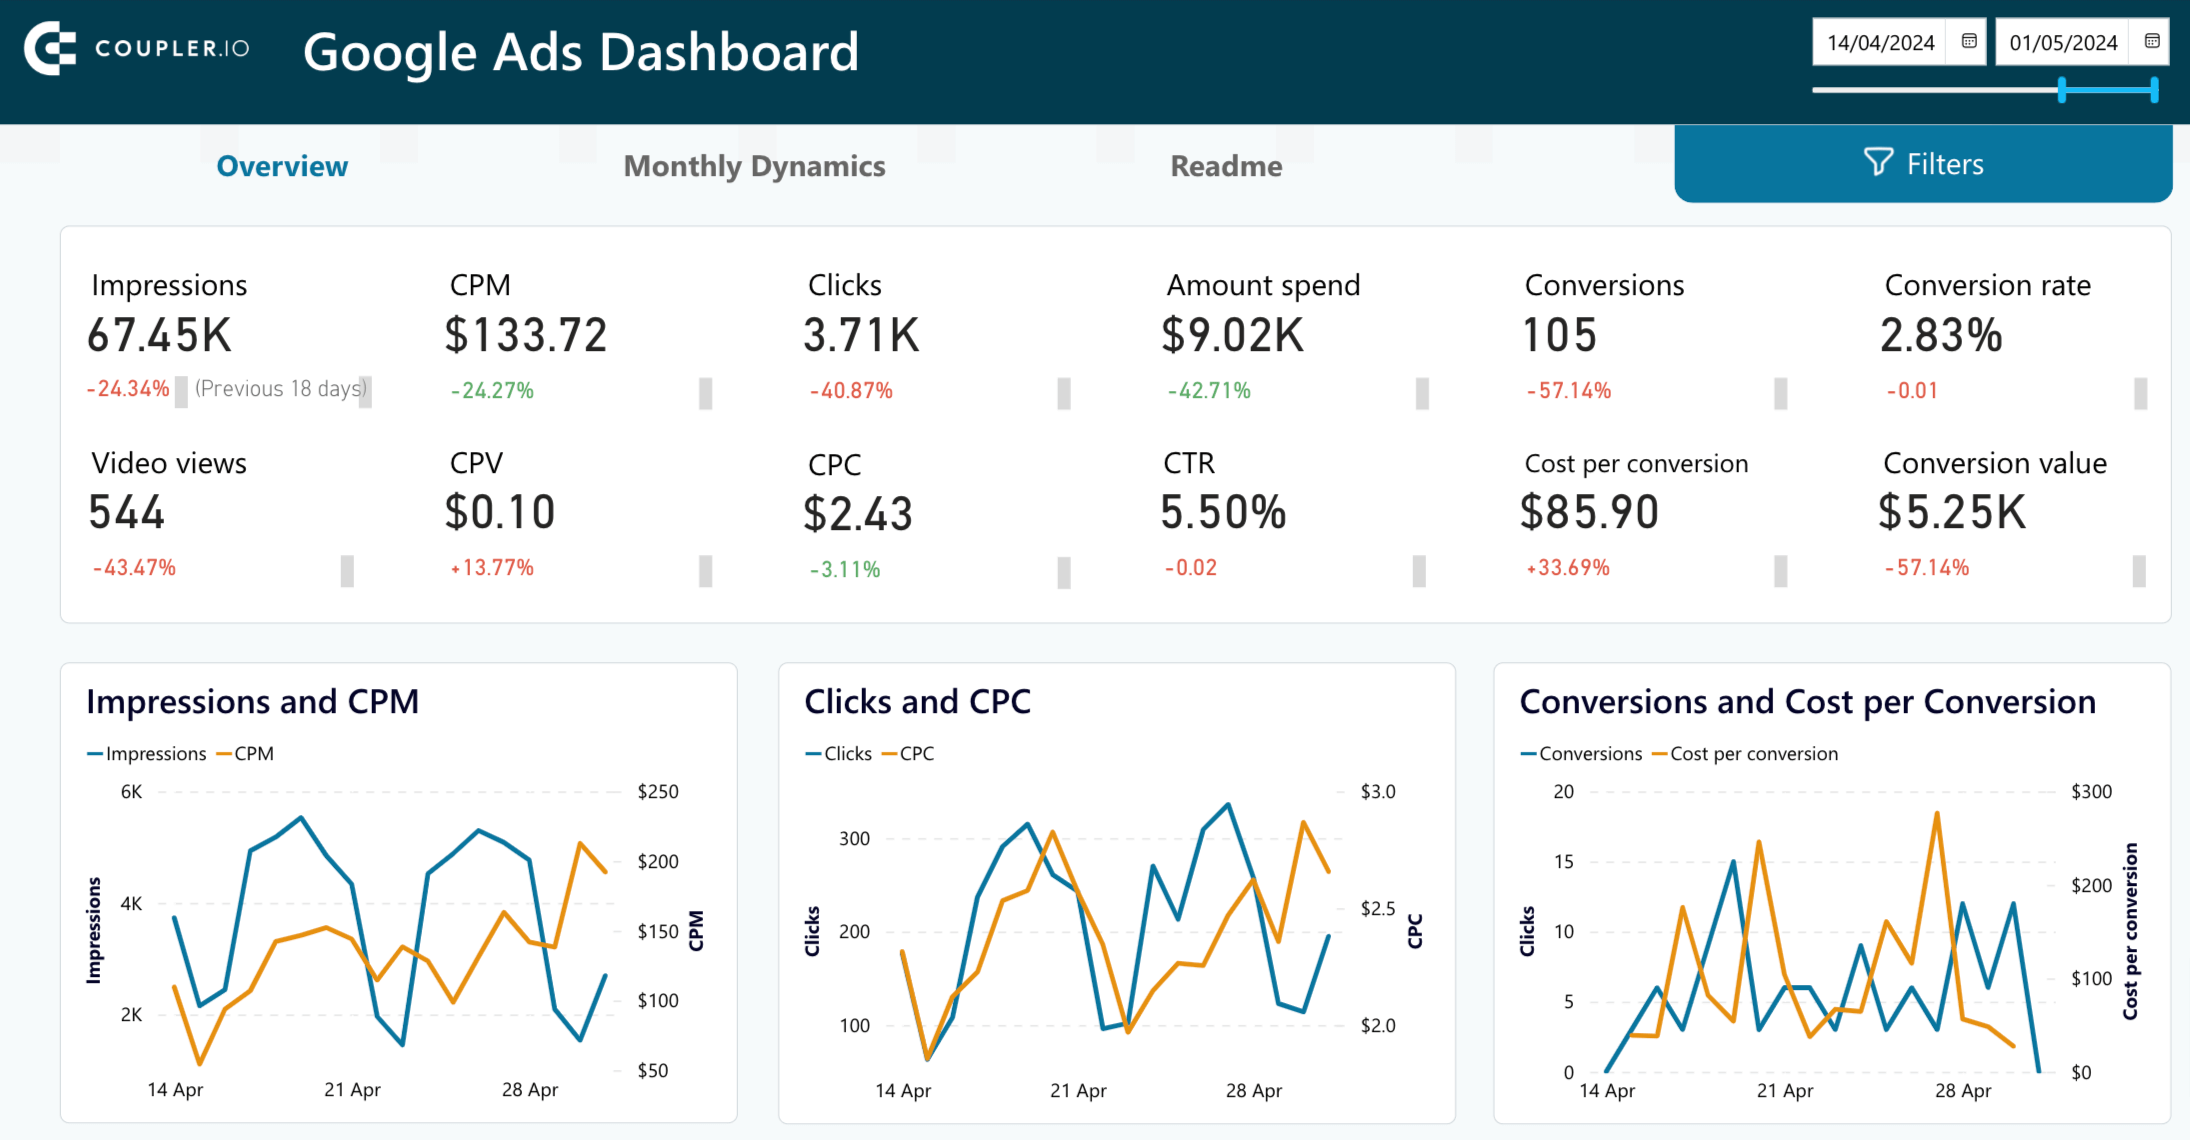
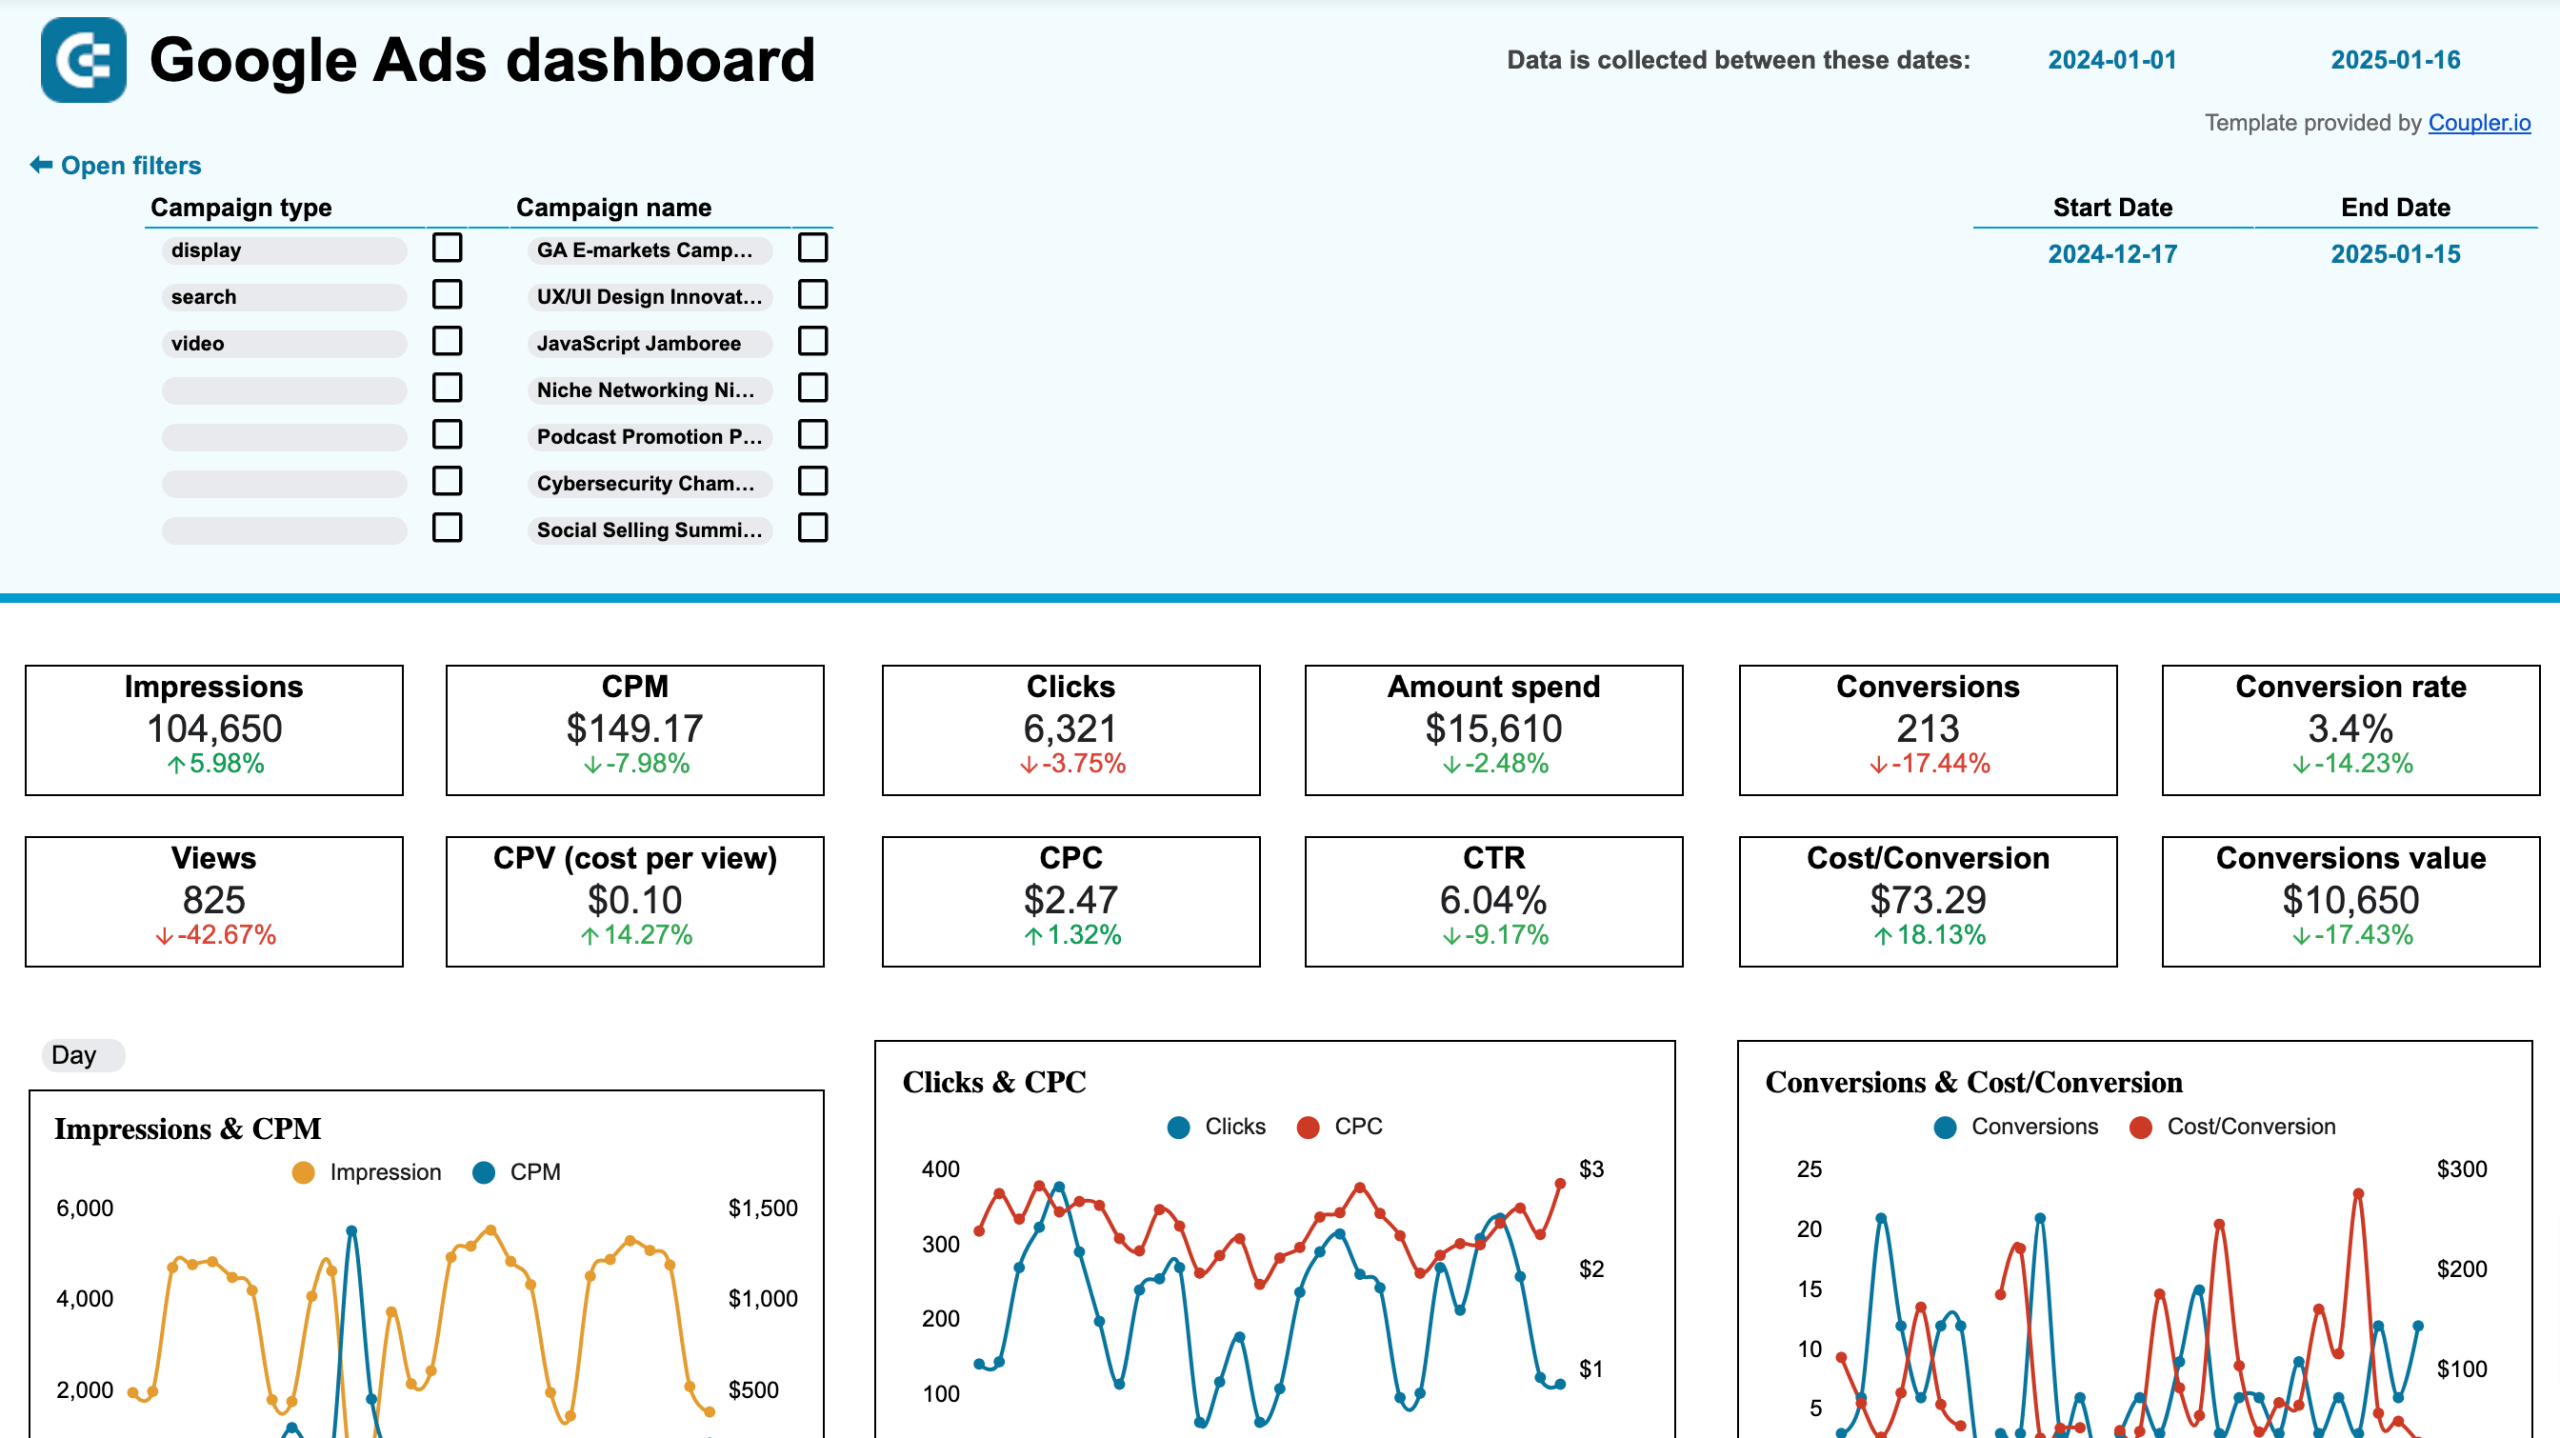
Google Ads dashboard
This dashboard provides a detailed overview of your Google Ads campaign performance and tracks the monthly dynamics of key metrics.

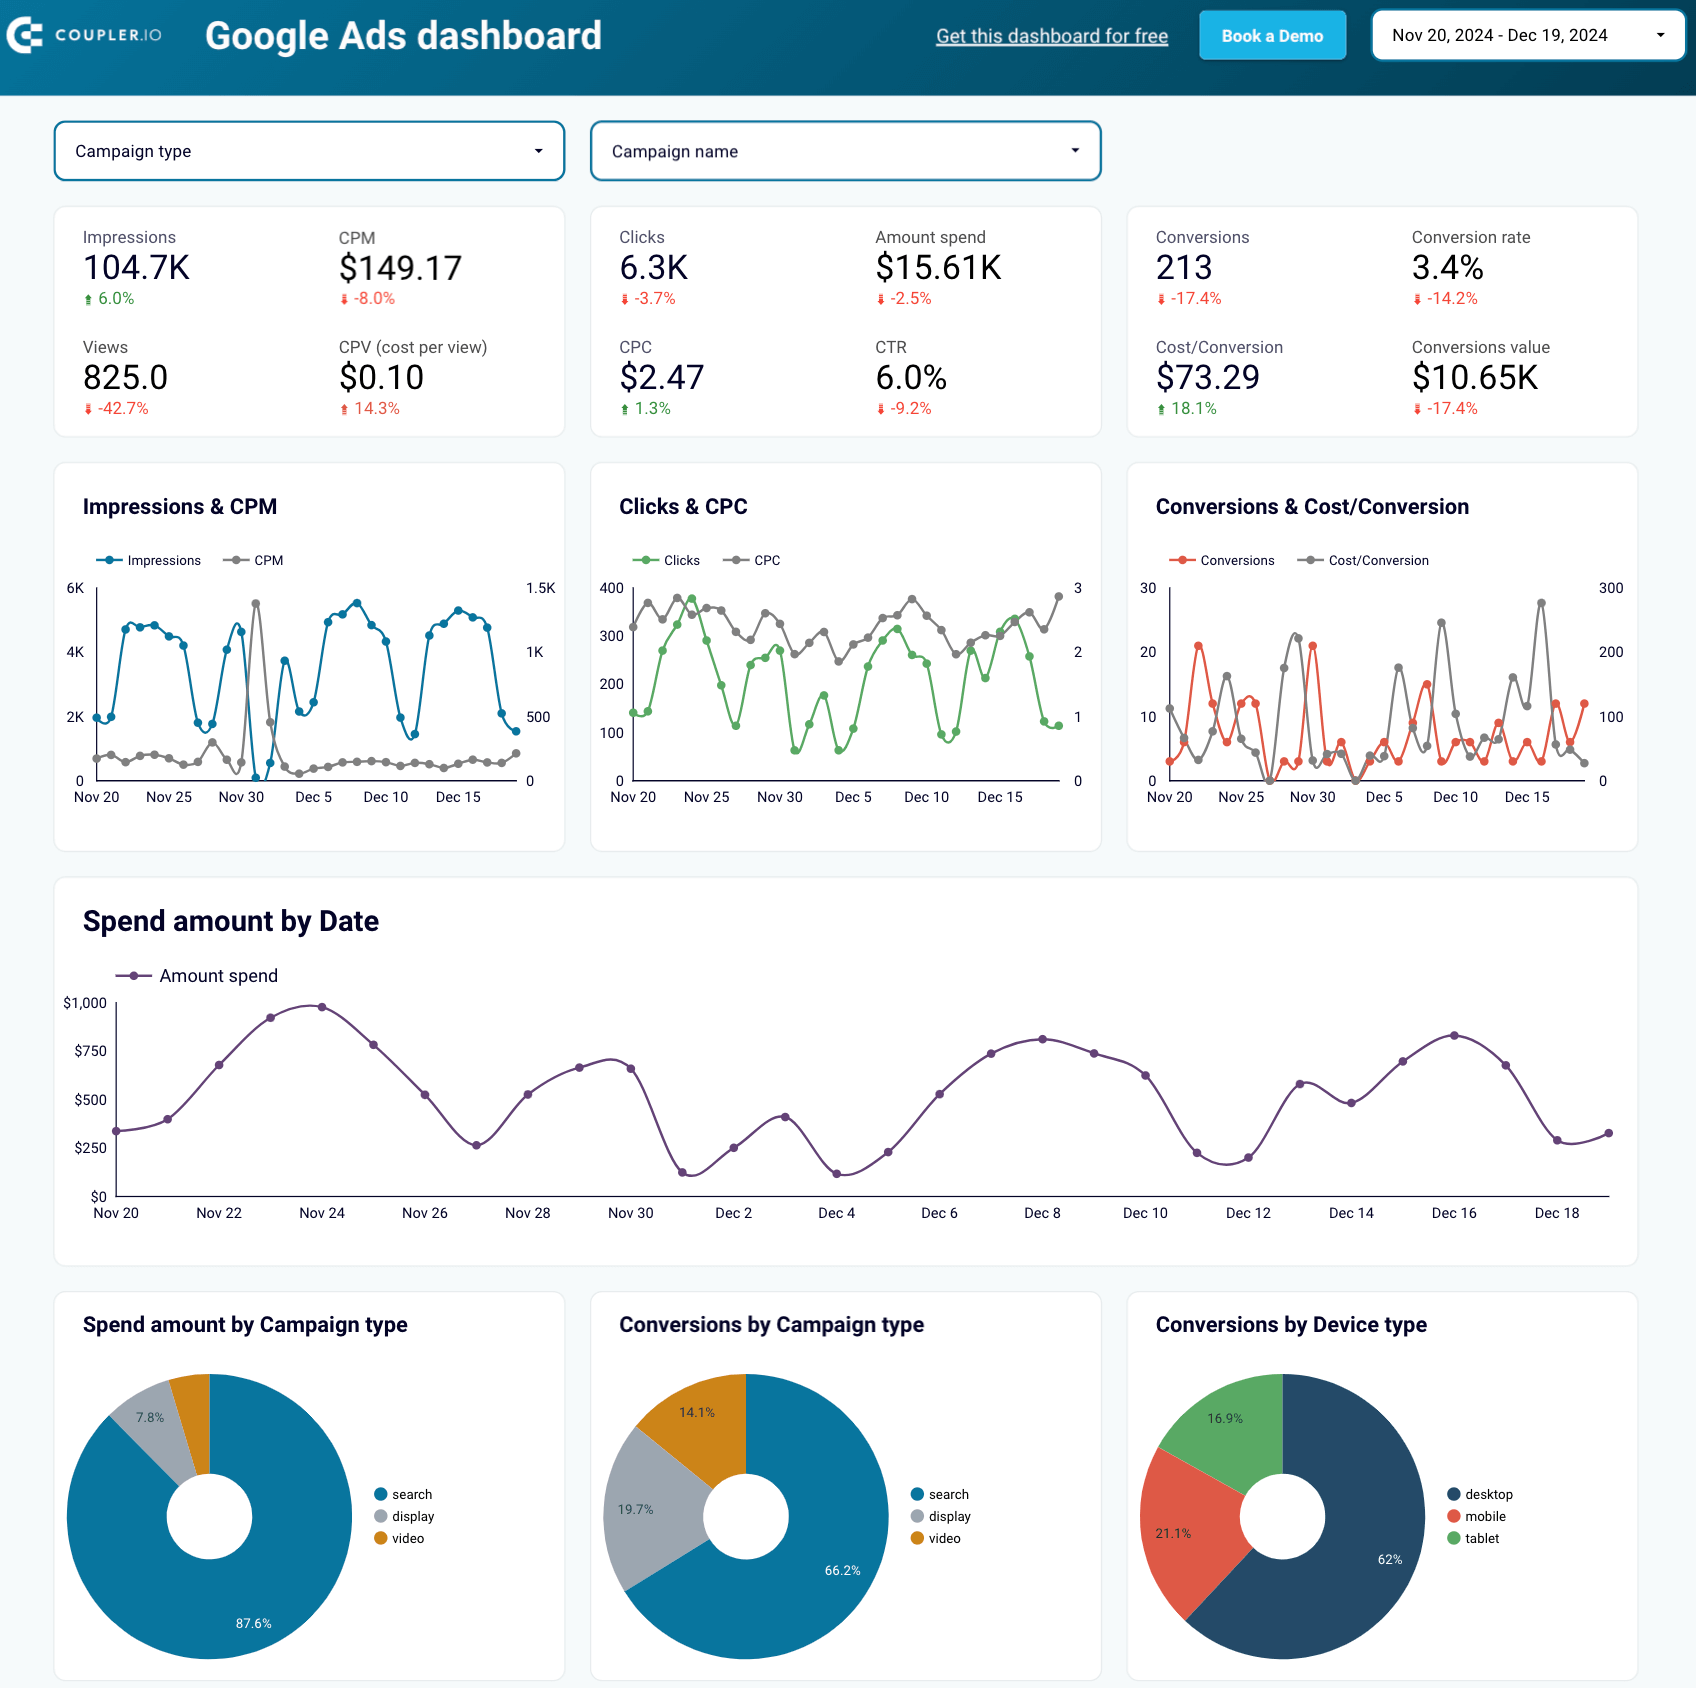
The dashboard offers the following data points:
- Monitor conversions: Look at conversion numbers by campaign type or device, get a list of top-performing campaigns based on convertibility, and explore a breakdown of the conversion actions you’ve set up.
- View performance from a timeline perspective: Analyze month-to-month data on metrics such as spend amount, impressions, clicks, cost per click, CTR, conversions, and cost per conversion.
- Check conversions based on demographics: See how your digital advertising campaigns convert audiences across different regions, age groups, and genders.
The template is available for Looker Studio, Power BI, and Google Sheets. To track your ad performance with this dashboard, follow the setup instructions in the Readme tab and get your data visualized.

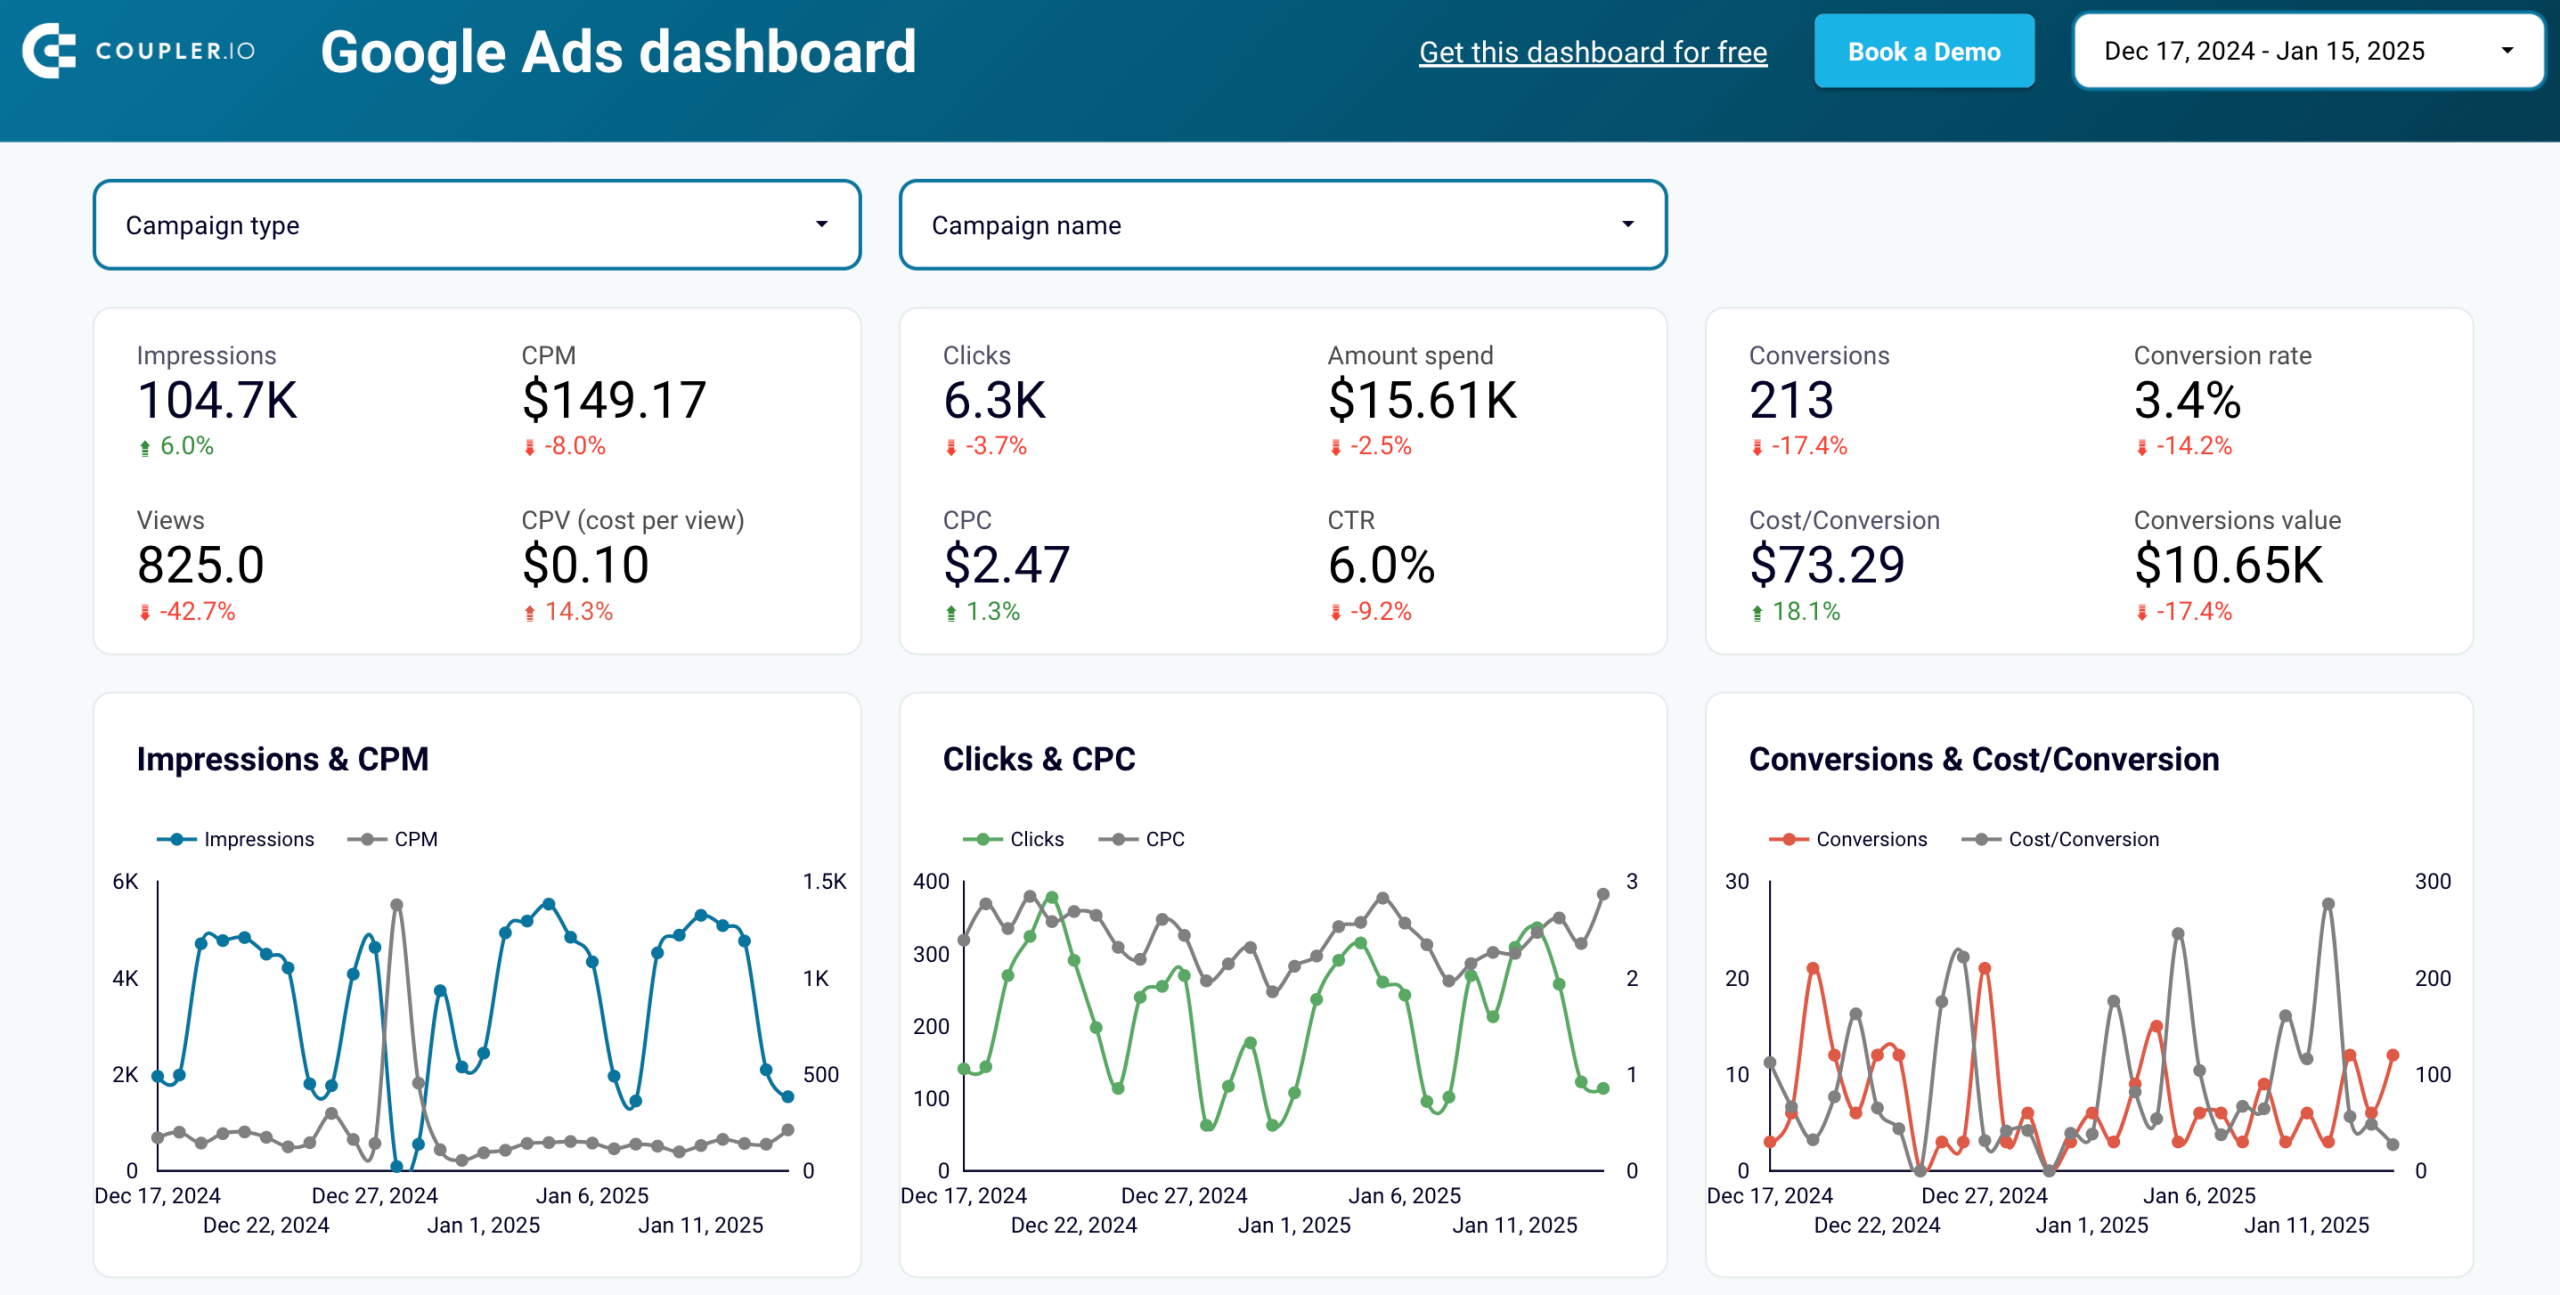
Google Ads dashboard in Looker Studio
Get a detailed overview of your Google Ads campaigns’ performance to achieve your marketing goals better.


Google Ads dashboard in Power BI
Overview the performance of your campaigns in Google Ads and track monthly dynamics of key metrics.


Google Ads dashboard in Google Sheets
Evaluate the performance of your PPC campaigns launched on Google and use these insights to optimize budgeting and conversion.
Tools and techniques for Google Ads competitor research
Manual competitor analysis on the SERP
Manual Google Ads competitor research is a direct analysis of competitors’ ads. Using the Google Search results page, you’ll find relevant keywords and observe which competitors appear in the top ad positions. This allows you to analyze creatives, landing pages, and ad frequency to understand competitors’ messaging and focus. Although this method is time-consuming, it offers a first-hand look at competitors’ tactics.
Google’s internal tools
Keyword Planner
This Google Ads tool shows the keywords your competitors target. While its primary role is to plan campaigns, you can use it to identify keyword opportunities and gaps by analyzing variations of competitor keywords. It reveals the most competitive keywords and guides your bidding strategy to help you outrank competitors in high-value searches.
Ads Transparency Center: How to see competitors Google Ads
Ads Transparency Center provides visibility into all the ads currently run by a competitor across Google platforms. Search for a competitor’s name, then analyze their ad creatives, formats, and messaging. This allows you to identify trends, spot seasonal Google Ads competitor campaigns, and benchmark your ad content against that of your competitor to find ways to differentiate or improve.
Merchant Center
Google Merchant Center helps e-commerce businesses understand the competitive landscape at a product category level across Shopping ads. It demonstrates how your products’ visibility has changed over time and how it compares to that of your competitors. Filters such as country, category, traffic, and period allow you to narrow your results even further.
External competitive analysis tools

Similarweb
Similarweb shows who you compete with and where you stand in Google Ads competition. You can use it to narrow down your competitors and identify their most successful ads over a selected period. The tool allows you to dig right in with the many metrics, such as the traffic share, impressions, keywords targeted, average ad position for each top-performing ad, and more.

Ahrefs
While primarily known for SEO, Ahrefs offers several features and reports that help with Google Ads competitor analysis. It reveals which keywords your competitors bid on and the ad copies they use. You can also discover which pages your competitors spend the most on and how their ad strategy has changed over time.

Semrush
Semrush lets you see your top competitors based on the number of keywords their ads share with yours. You can also explore the competitors’ ad positions, the average monthly searches each keyword gets, the CPC for those keywords, and the estimated amount of traffic they drive. The Semrush Keyword Gap tool shows keywords your competitors bid on that you don’t and the keywords they rank for that you don’t, among other insights.

SpyFu
Using SpyFu, you can search for competitors, download their keywords, and view how many clicks they get and how much they pay for each keyword. Additionally, SpyFy analyzes all your competitors’ bidding history and recommends the most profitable keywords you haven’t yet purchased. Or vice versa: look at the results of every ad split test the competitor ever ran and the early keywords that didn’t work out.

SE Ranking
SE Ranking enables you to overview your competitors’ current and past Google ads. Essentially, you get a list of the most popular keyword ads, their estimated traffic volume, the traffic share they capture, search volume, ad competition level, etc. This will suggest what ads work best for your rivals and how to build better ones for your PPC campaign.
Tool for post-analysis reporting: Coupler.io
With Coupler.io, you can automate Google Ads campaign reporting and track the impact of competitor-driven adjustments. This platform lets you build custom reports on the performance of your campaigns, creatives, and more. The reports can be loaded into spreadsheet apps or BI tools for easy sharing with stakeholders. Coupler.io also refreshes data on your chosen schedule, keeping it synced with the latest changes in the source.

For immediate Google Ads analytics, you can use pre-built dashboard templates. They are designed in Looker Studio, Google Sheets, and other tools and equipped with a Coupler.io connector to load data from your account. This way, you get ready-to-use reports without the need to create them from scratch.
Try Coupler.io for free and track the impact of the competitor analysis insights you’ve implemented in your campaigns!
Automate Google Ads post-analysis reporting with Coupler.io
Get started for free