Want to make sure that your PPC campaigns are running smoothly and that you are not spending more than you should? In this article, we are going to focus on Google Ads and the metrics you should pay special attention to when running a campaign on this platform. As a bonus part, you’ll explore free dashboard templates for Google Ads reporting and analytics.
Understanding Google Ads metrics
Google Ads metrics are specific indicators and data points that provide insights about the performance and effectiveness of your Google Ads campaigns. These metrics help you assess the success of your advertising efforts, make informed decisions, and optimize your campaigns for better results.
Tracking Google Ads metrics is extremely important, and here are a few reasons why you should do this:
- Performance evaluation: Metrics provide insights into the performance of your ads, campaigns, and keywords. By tracking metrics such as impressions, clicks, CTR, and conversion rate, you can evaluate the effectiveness of your advertising efforts.
- Optimization opportunities: Metrics reveal which aspects of your campaigns are working well and which ones need your attention. For instance, if you have a low CTR, you can modify your ad copy or adjust your targeting to increase engagement.
- Budget management: This is definitely an important reason to monitor these metrics. Tracking metrics like cost, CPA, and ROAS allows you to manage your advertising budget effectively. You can assess the cost-effectiveness of your campaigns and allocate your budget to the most profitable strategies.
- Benchmarking and competition analysis: Metrics allow you to compare your performance with industry benchmarks and analyze how your campaigns stack up against your competitors.
The Google Ads metrics list that we selected
When you first set up your campaigns in Google Ads, you will see many metrics. In the beginning, it might be difficult to decide which of them deserve the most attention, and which are secondary and are not so indicative. So, to help you sort it out, we’ve selected the top 10 most important Google Ads key metrics to track and monitor at all times.
1. Click-Through Rate (CTR)
The click-through rate (CTR) displays the proportion of impressions to clicks that your ads received. You may figure it out by multiplying by 100 after dividing the clicks by impressions.
The CTR formula is as follows:
CTR = (Clicks / Impressions) * 100
For your Google advertising campaigns, CTR is a crucial measure to monitor as it shows the efficacy and relevancy of your advertising. A higher CTR can demonstrate how appealing your advertisements are to users, luring them to your target page.
2. Cost Per Click (CPC)
Cost Per Click (CPC) displays how much you pay when a user clicks on your advertisement. In the well-known pay-per-click (PPC) advertising model, marketers are only charged when a user clicks on their advertisements.
The quantity of your bid, the quality of your ads, and the level of competition for the keywords you’re targeting all affect your CPC. Advertisers participate in an auction through Google Ads and put bids for ad positions. The winning advertiser pays the amount of the second-highest bid and receives the highest bid and ad quality.
3. Conversion Rate
This value reveals the number of visitors who took action after viewing your website via your advertisement. The specific action, such as making a purchase, completing a form, subscribing to a newsletter, or downloading a document, depends on your company goals. The conversion rate shows how well your campaigns perform in regard to conversions.
It can be calculated by dividing the total number of conversions by the total number of ad clicks and multiplying by 100. The formula for figuring out the conversion rate is as follows:
Conversion Rate = (Conversions / Clicks) * 100
4. Impressions
When checking impressions in Google Ads, you will see the number of times your ads were displayed to users on the Google network. This includes the search results page and the display network. Each time your ad appears on a person’s screen, it counts as one impression, even if that user doesn’t interact with the ad in any way. Also, you can receive multiple impressions from one user if they see that ad multiple times.
Impressions indicate the visibility and reach of your ad campaigns. Higher impression numbers show that your ads reach a larger audience. However, take into account that impressions alone do not guarantee user engagement or conversions. They are just the starting point for evaluating the performance and effectiveness of your campaigns.
5. Cost Per Acquisition (CPA)
Cost Per Acquisition (CPA) shows how much it costs to acquire one conversion from your campaigns. It is calculated by dividing the total cost you paid on your ads by the number of conversions the campaign generated.
Here’s the formula:
CPA = Total Cost / Conversions
Tracking this metric helps you understand how much you’re spending to convince a user to make a purchase, fill out a form, or sign up for a newsletter, depending on your desired goal.
6. Quality Score
Quality Score is used to measure the quality and relevance of your ads, keywords, and landing pages. It determines your ad rank and the cost per click (CPC) you pay.
Google uses this score to see how well your ads align with the search queries of users and their overall user experience. It takes into consideration various factors, including the CTR, ad relevance, landing page experience, and historical performance. The Quality Score ranges from 1 to 10, with 10 being the highest score.
7. Ad Rank
Ad Rank determines the position of your ads on SERP or the display network. It is calculated based on several factors, including your bid, ad quality, and the expected impact of ad extensions and other ad formats. Ad Rank is used with the user’s search query to determine which ads are shown and the order they are shown in.
Unfortunately, you won’t be able to check Ad Rank in Google Ads as the platform doesn’t show this number. However, there is a way to calculate your approximate Ad Rank to make sure you are on track:
The formula for Ad Rank in Google Ads is:
Ad Rank = Bid x Quality Score
Please note that this is not an official formula (Google doesn’t disclose it), but it still can be useful and help you see the approximate value.
When you calculate the Ad Rank, you should also look at the conversion rate. While Google doesn’t look at conversion metrics to make up your Ad Rank, the conversion metric shows you how well your campaigns are performing.
8. Return on Advertising Spend (ROAS)
Return on Advertising Spend (ROAS) is a metric that measures how effective your ads campaign is. It evaluates the revenue generated compared to the amount of money spent on advertising. It can help you see the profitability of your marketing investments.
A higher ROAS indicates a more successful campaign, as it signifies that the revenue generated from the ads outweighs the advertising costs.
The formula for calculating ROAS is:
ROAS = (Revenue Generated from Ads / Advertising Spend) * 100
Search Impression Share is a metric that shows how many impressions your ads receive compared to the total number of impressions your ads could’ve received in a specific target market or location.
Search Impression Share is calculated by dividing the number of impressions your ads received by the estimated number of impressions your ads were eligible to receive, and then multiplying by 100.
You can use the following formula to calculate Search Impression Share:
Search Impression Share = (Impressions Received / Impressions Eligible) * 100
10. Cost
Cost shows how much you spent on your campaigns during a specific period of time. It can be calculated by multiplying the number of clicks or impressions with how much each of them costs and then summing them up.
Also, if you are running display or video campaigns, you should keep an eye on the Cost per thousand impressions (also referred to as CPM). When you run these campaigns, you may be charged based on the number of impressions your ads receive. In this case, the cost is calculated per thousand impressions, rather than per click.
Now that you know what Google Ads metrics you should track closely, let’s go through some tips to help you deal with them efficiently.
Free dashboards to analyze and visualize Google Ads metrics
Checking the performance of your campaigns directly in Google Ads can be a bit confusing, especially if you have a lot of campaigns. You can track these metrics in various ways, from using the native stats to creating a custom Google Ads report in a BI tool.
However, creating reports from scratch can be time-consuming. Therefore, Coupler.io offers free self-updating dashboard templates to derive insights into your Google Ads performance data in minutes. These dashboards are designed to save you time and facilitate data-driven decision-making.
Google Ads dashboard
If you need to focus on the campaign analysis for Google Ads, then use our automated Google Ads dashboard template. It will save you a lot of time and effort as it already features the most important metrics presented in a concise visual form. You will only need to connect your Google Ads account to have a ready-to-use professional Google Ads dashboard.
This dashboard is fully pre-configured. All the settings are already there, so the dashboard will automatically pull relevant data and visualize it in the way you can see below. Coupler.io will keep refreshing your data automatically, so it will always be up-to-date without any manual effort.
This Google Ads dashboard is also available as a white-label template, so you can customize its style and easily adjust it to your needs. The template is designed in Google Sheets, Looker Studio, and Power BI. Choose the version you like the most and try it right away for free!
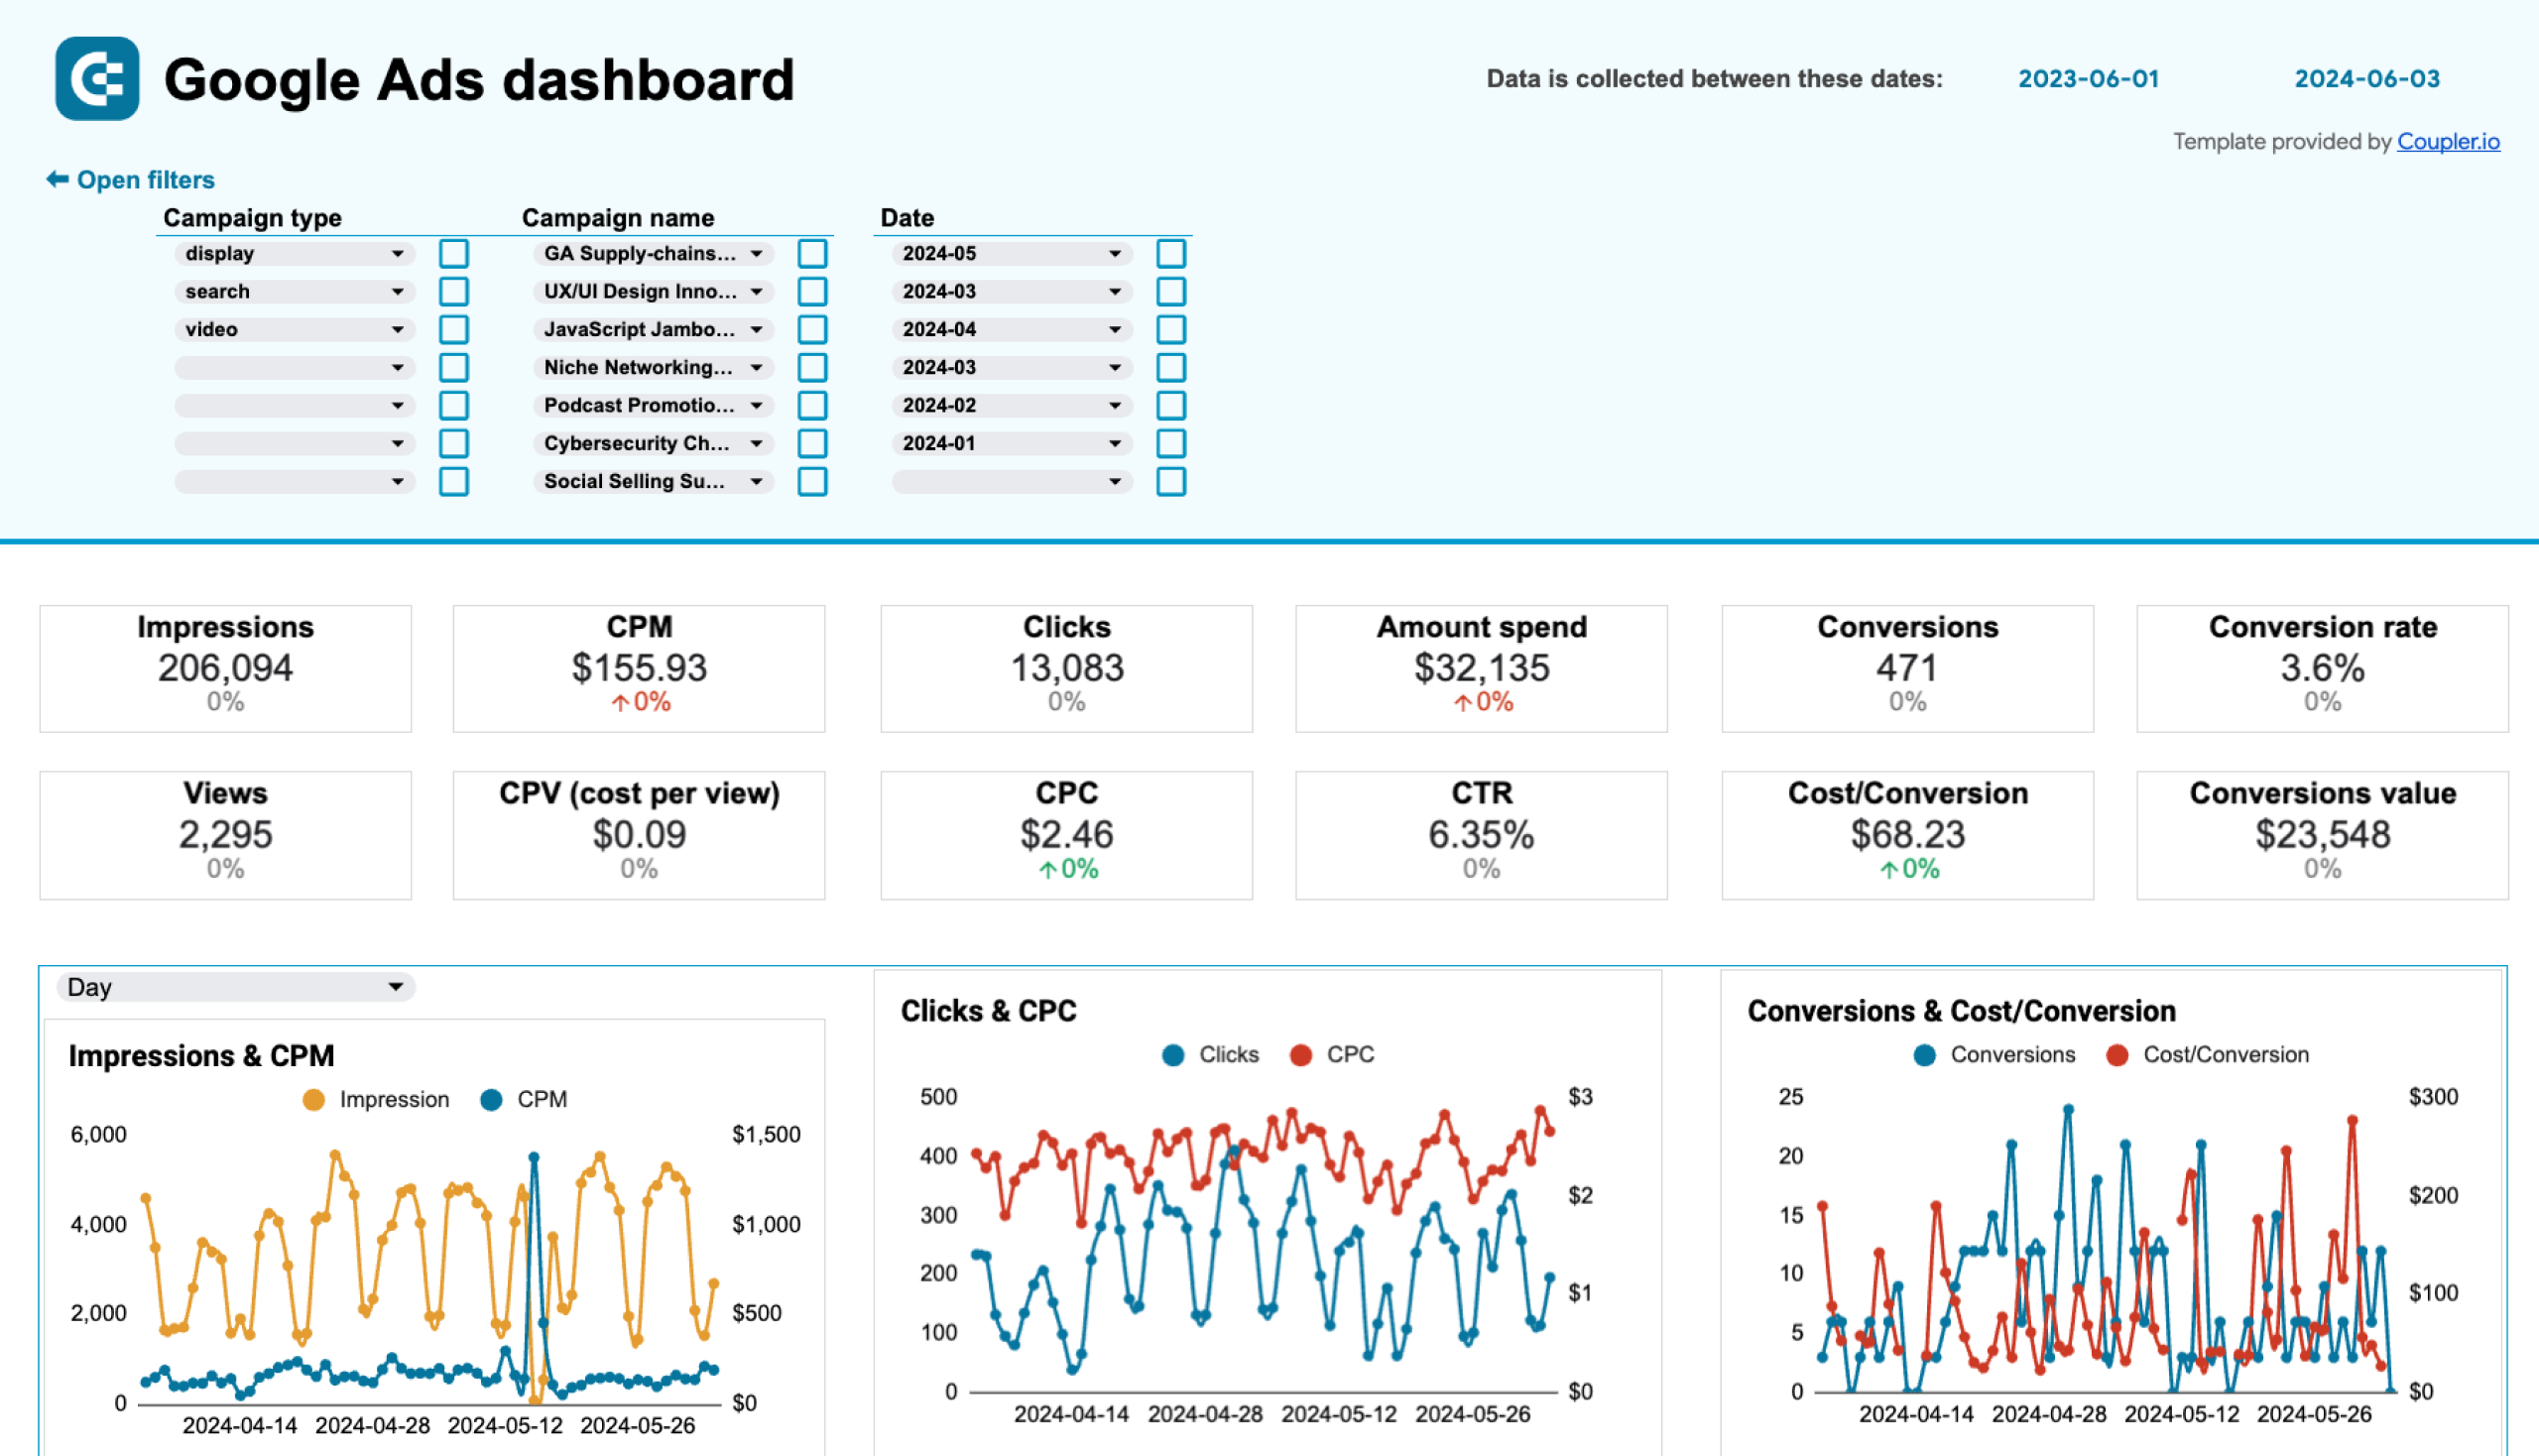
Google Ads dashboard in Google Sheets
Evaluate the performance of your PPC campaigns launched on Google and use these insights to optimize budgeting and conversion.


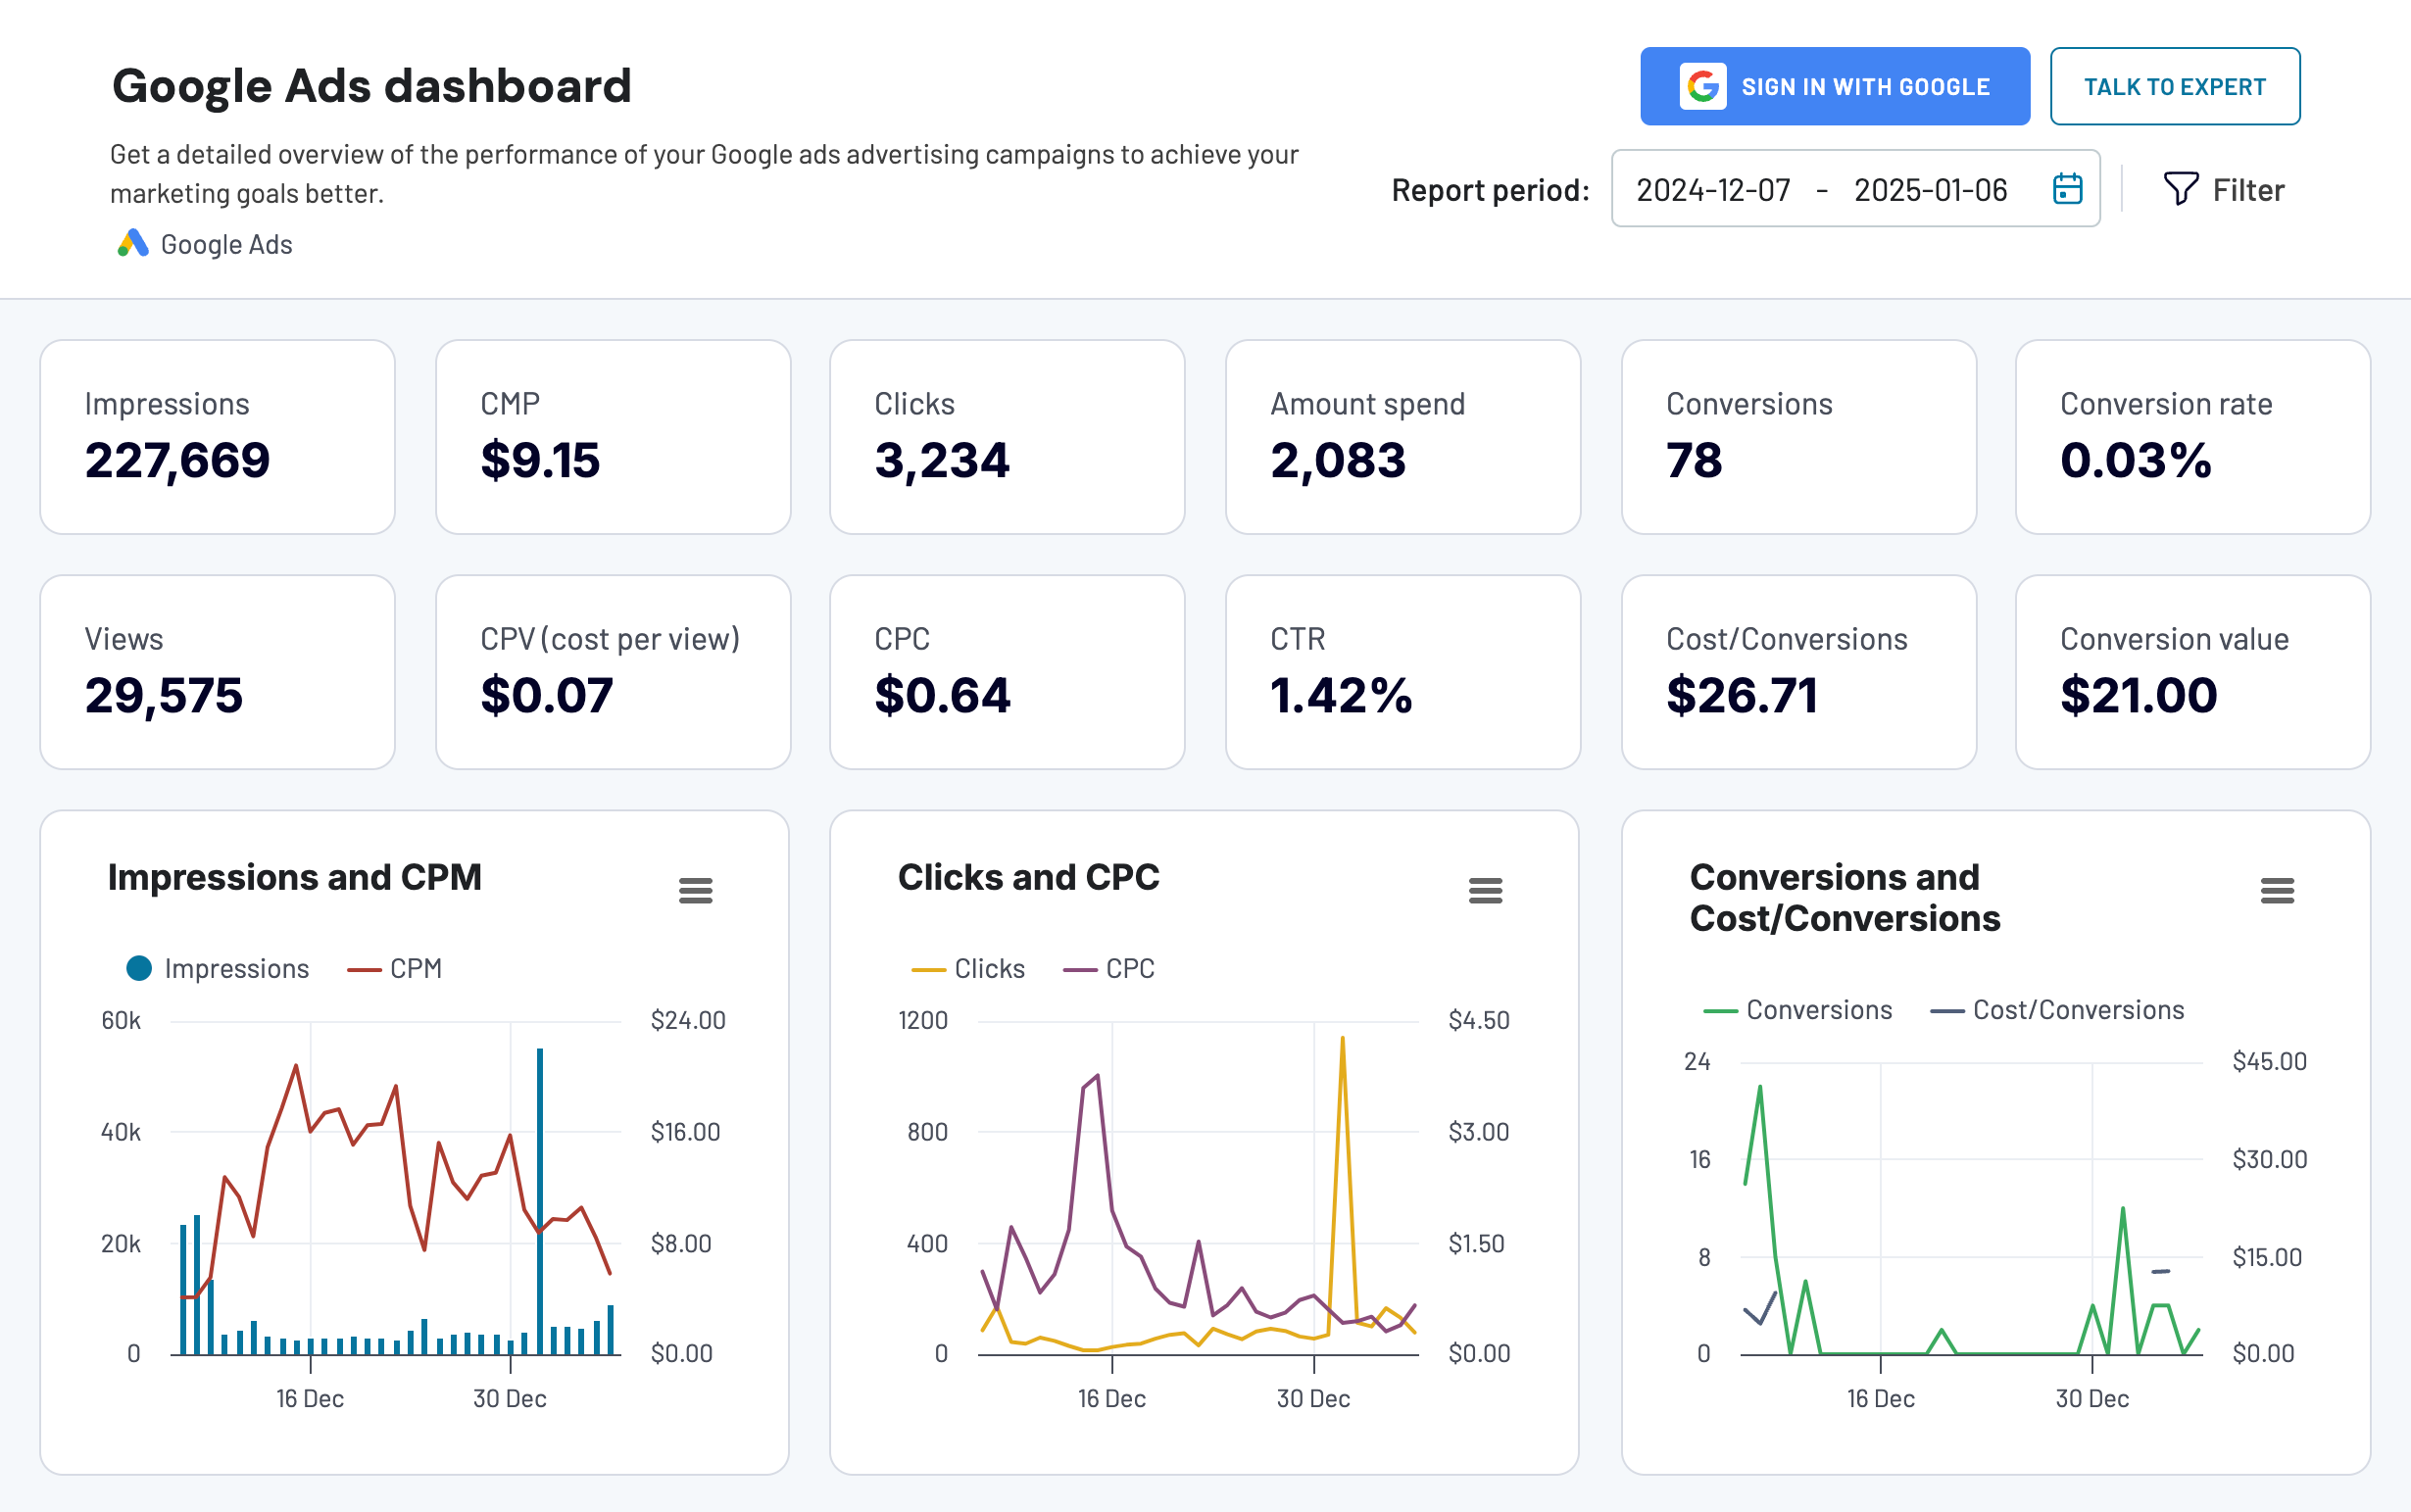
Google Ads dashboard in Looker Studio
Get a detailed overview of the performance of your Google ads advertising campaigns to achieve your marketing goals better.

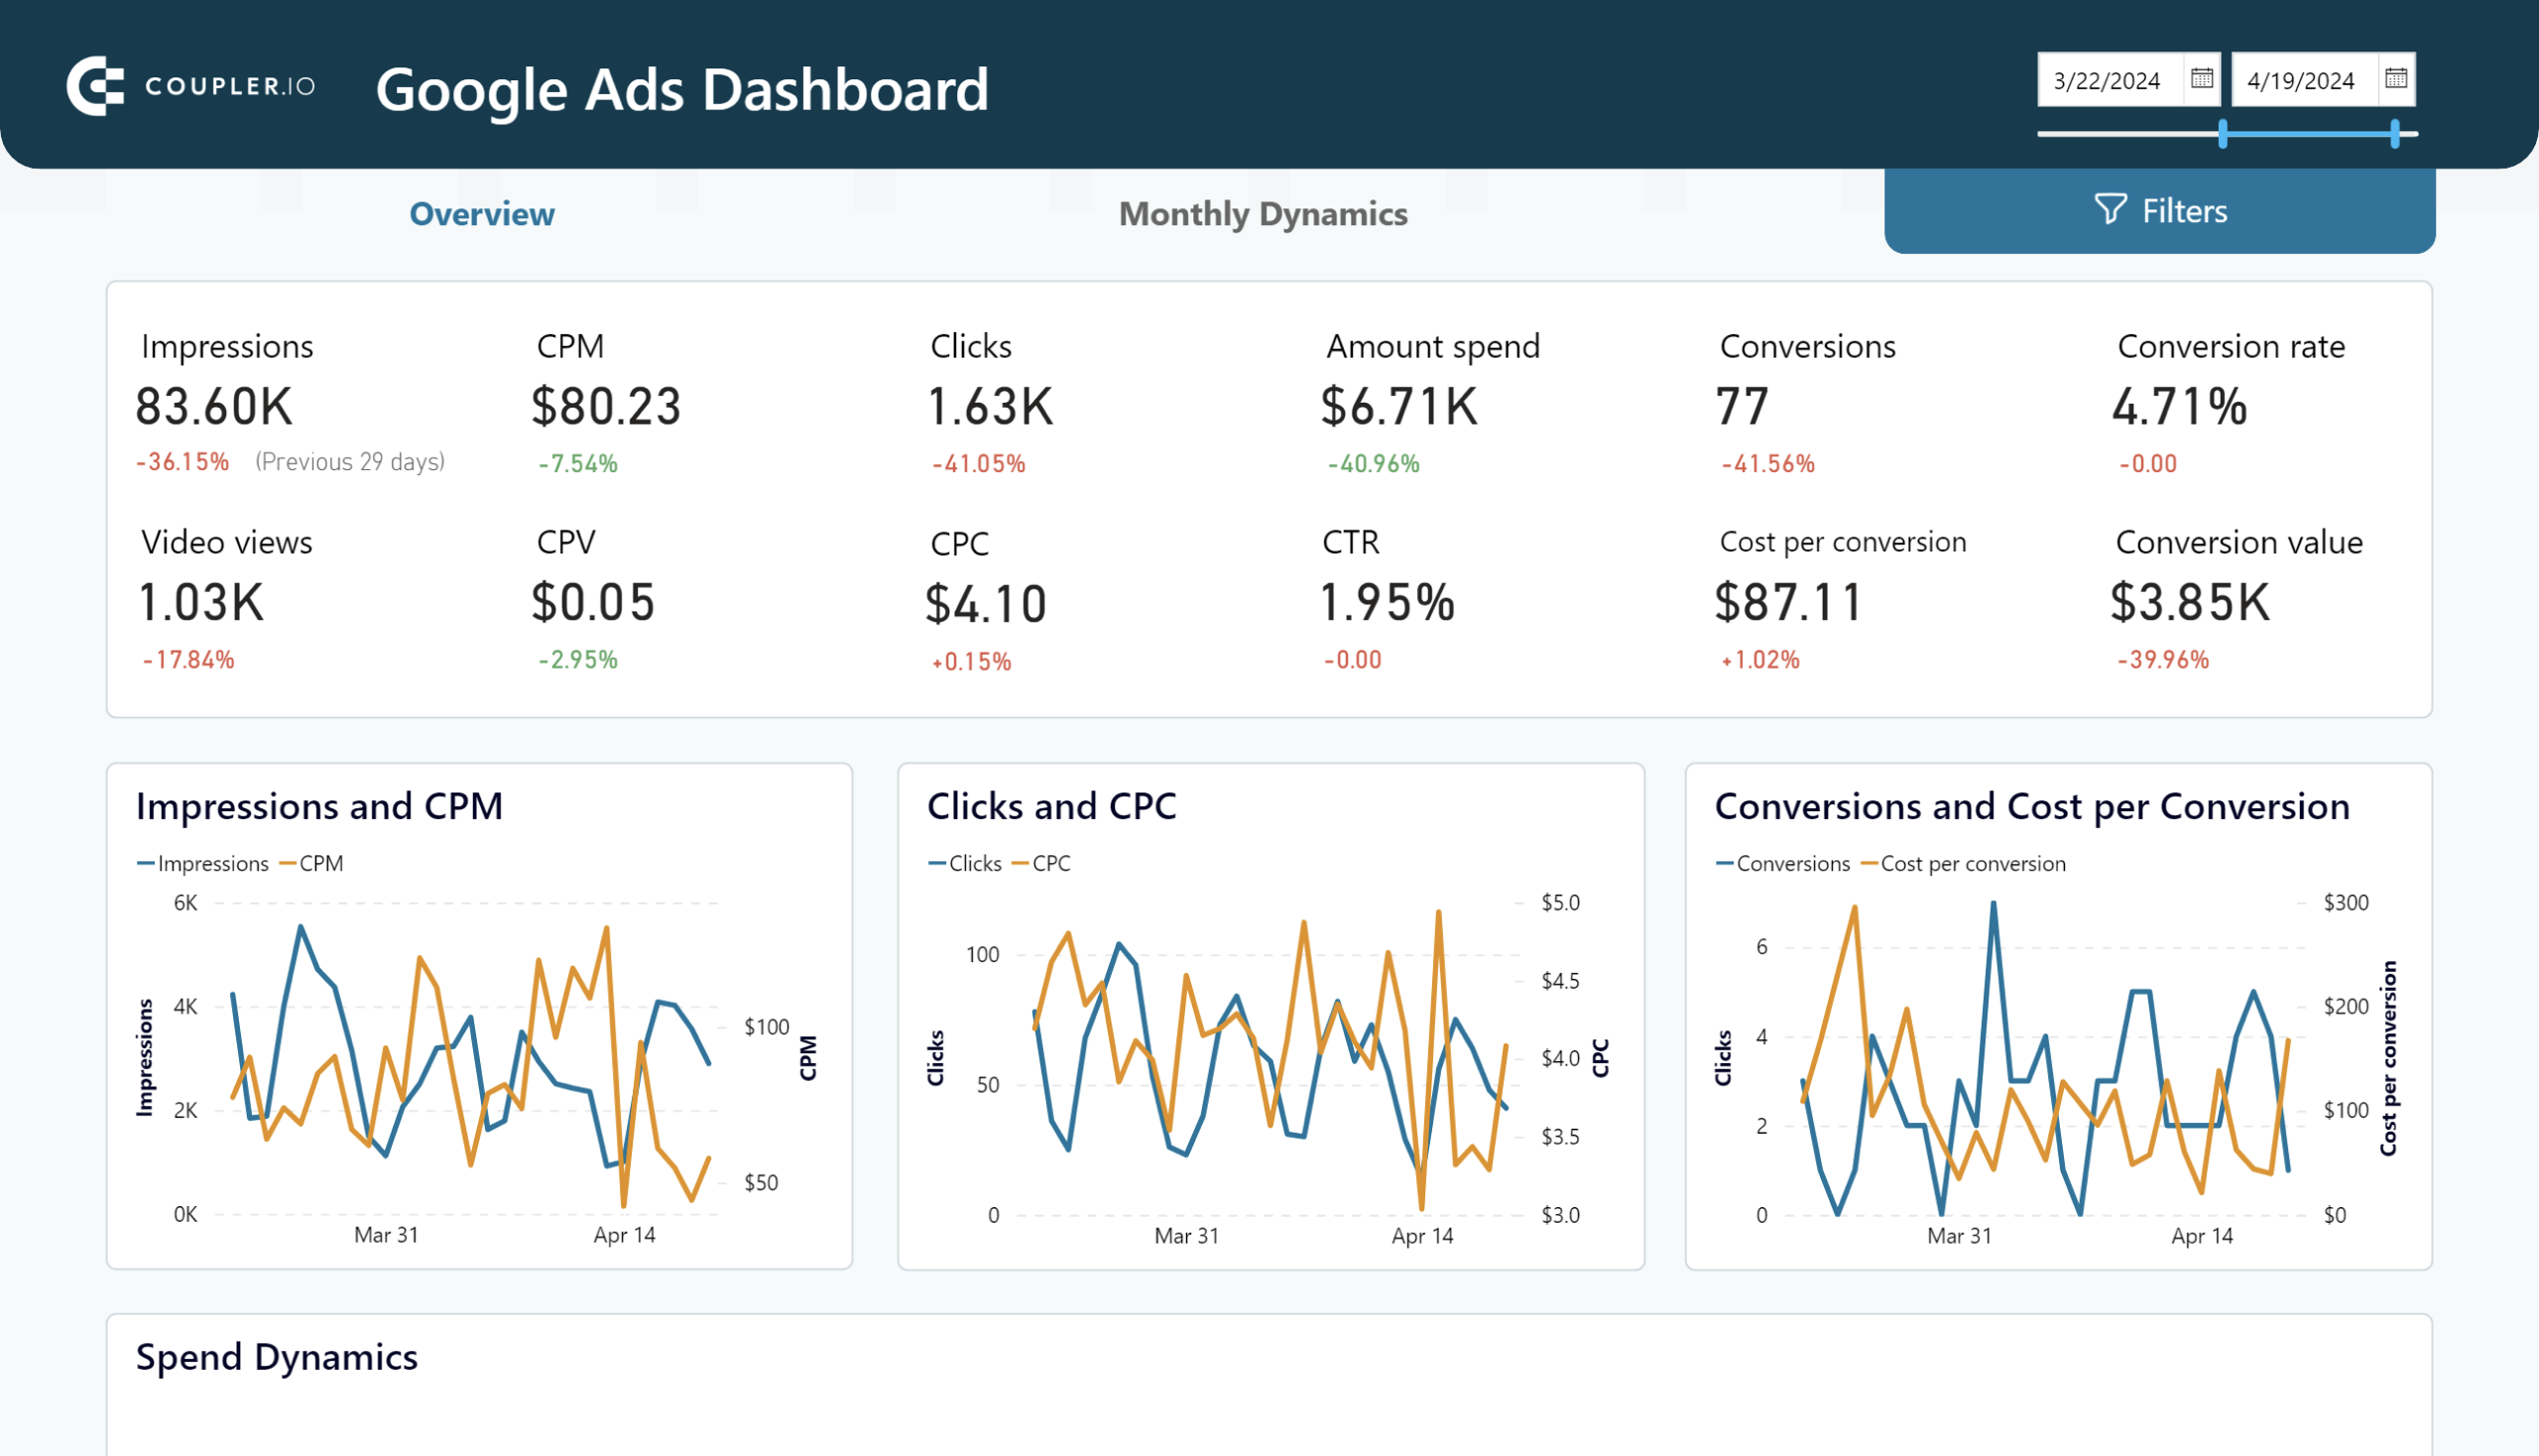
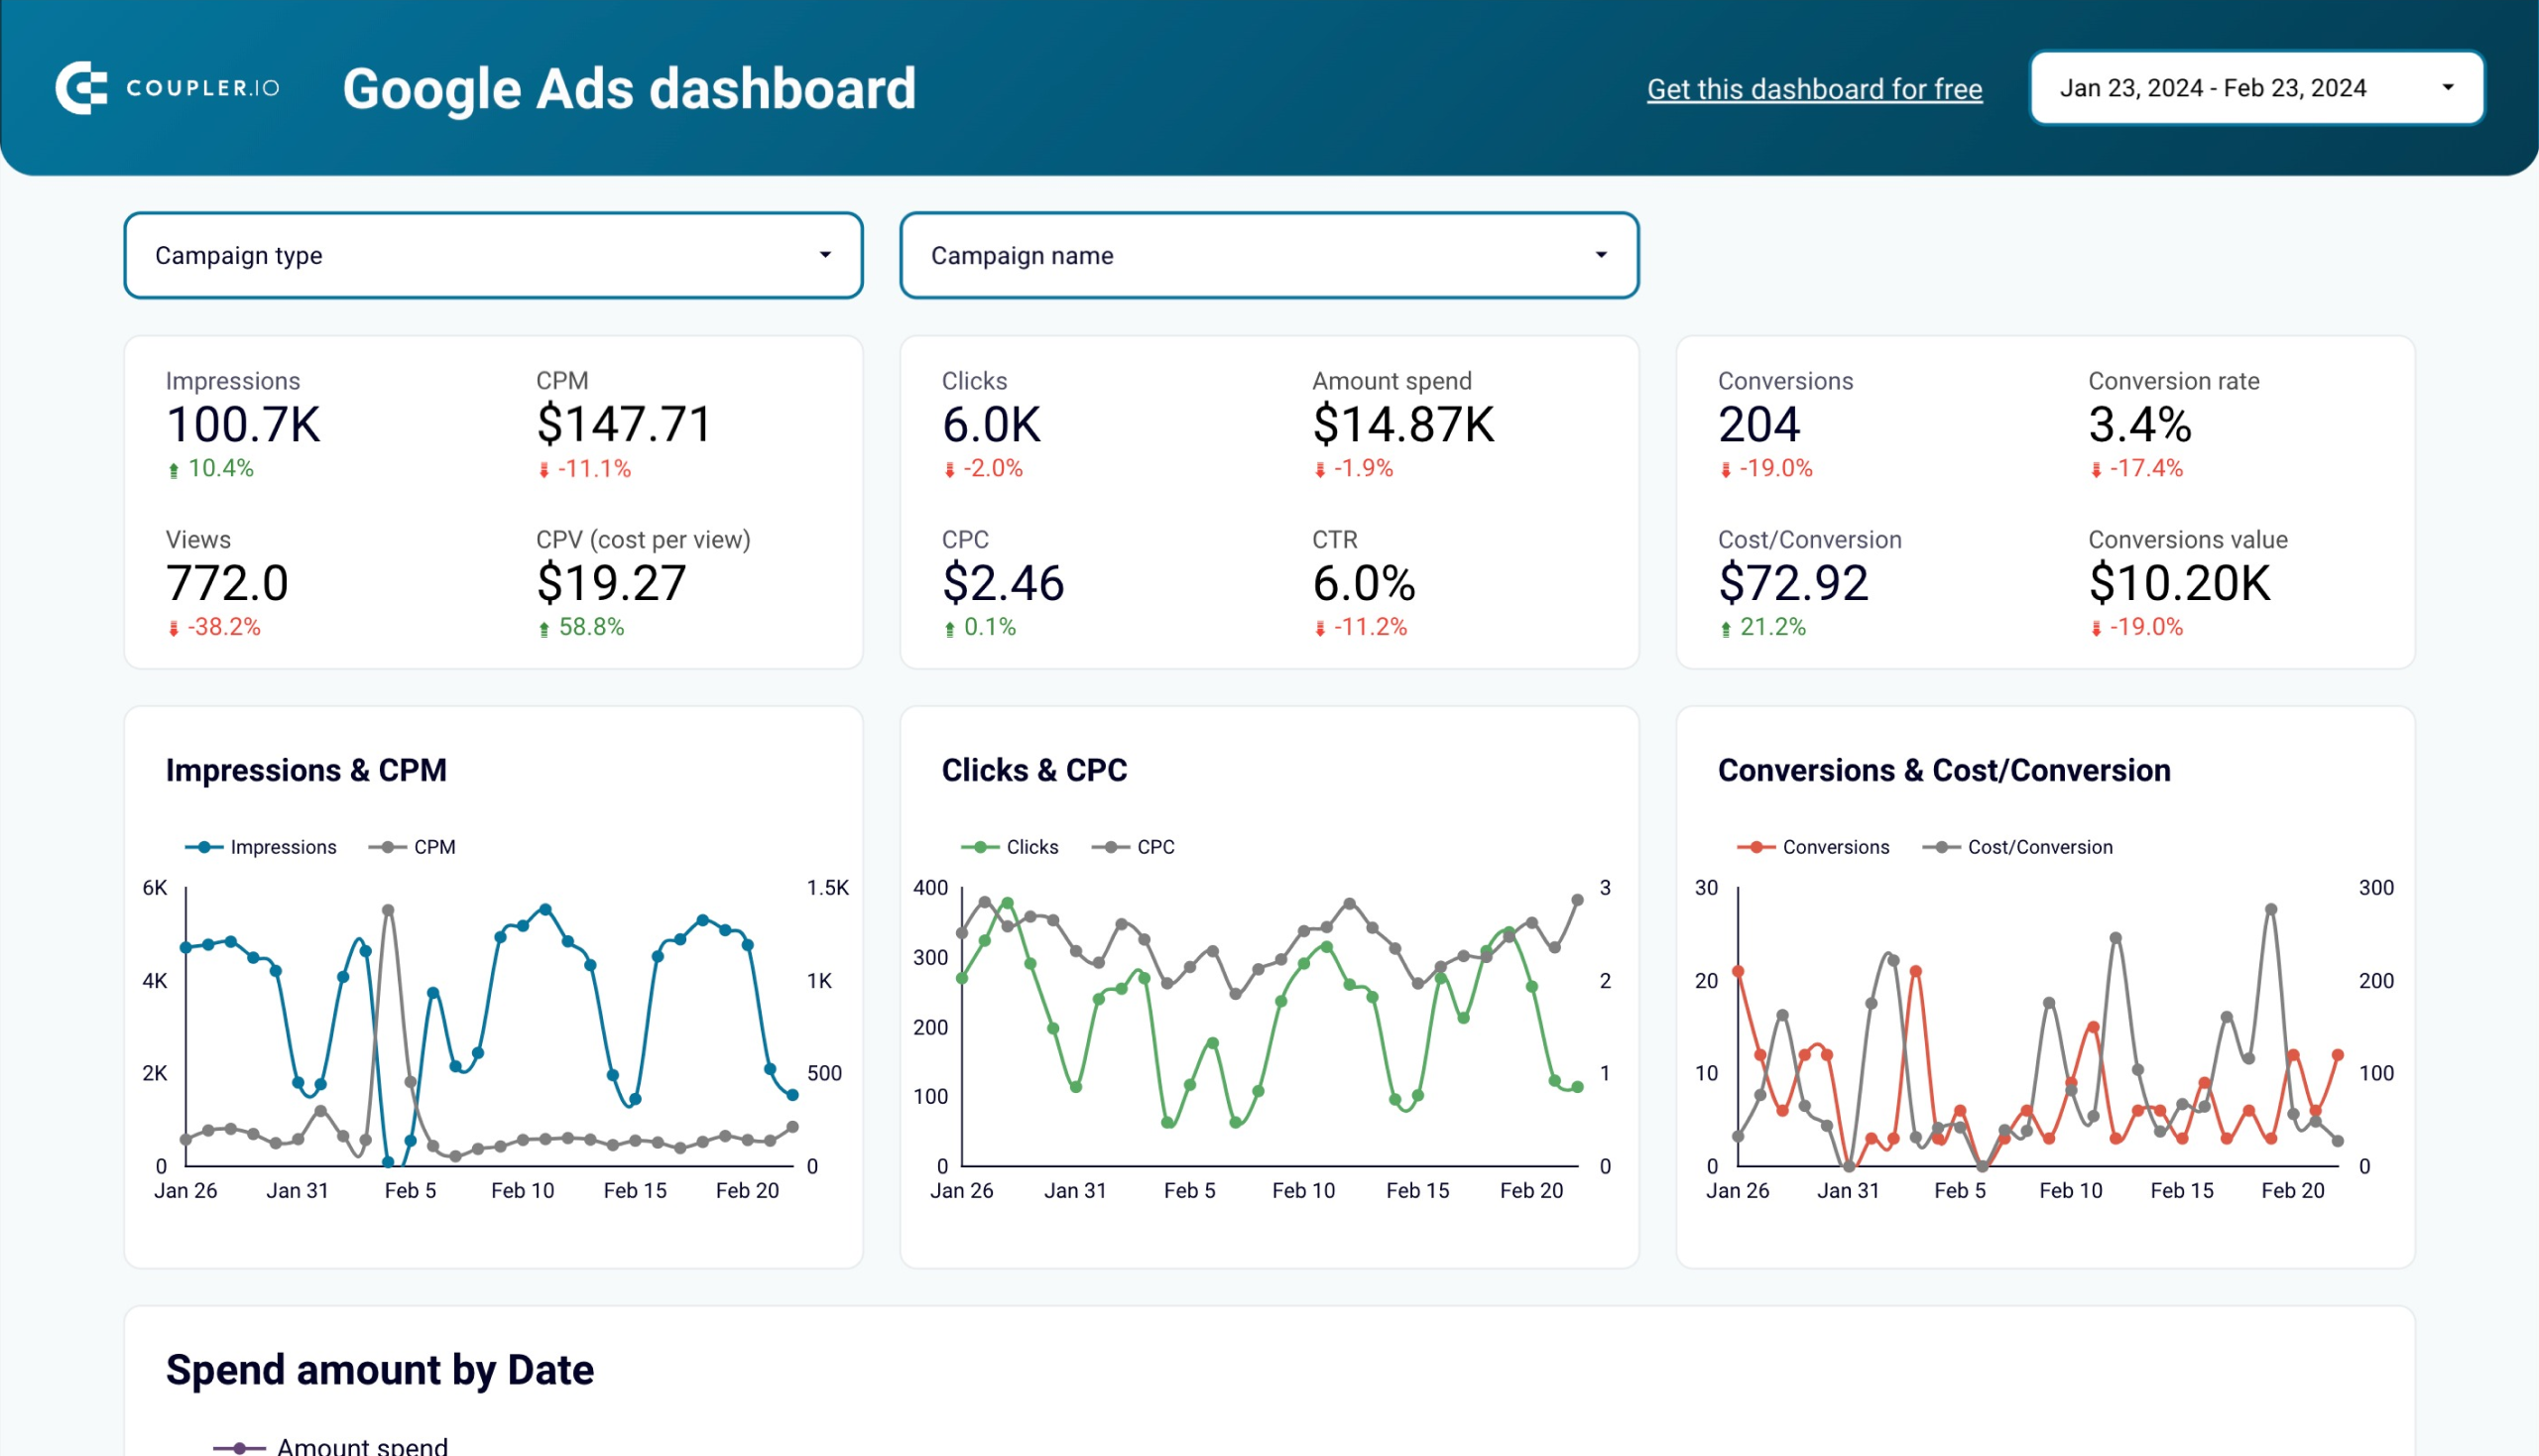
Google Ads dashboard in Power BI
Overview the performance of your advertising campaigns in Google Ads and track monthly dynamics of key metrics.

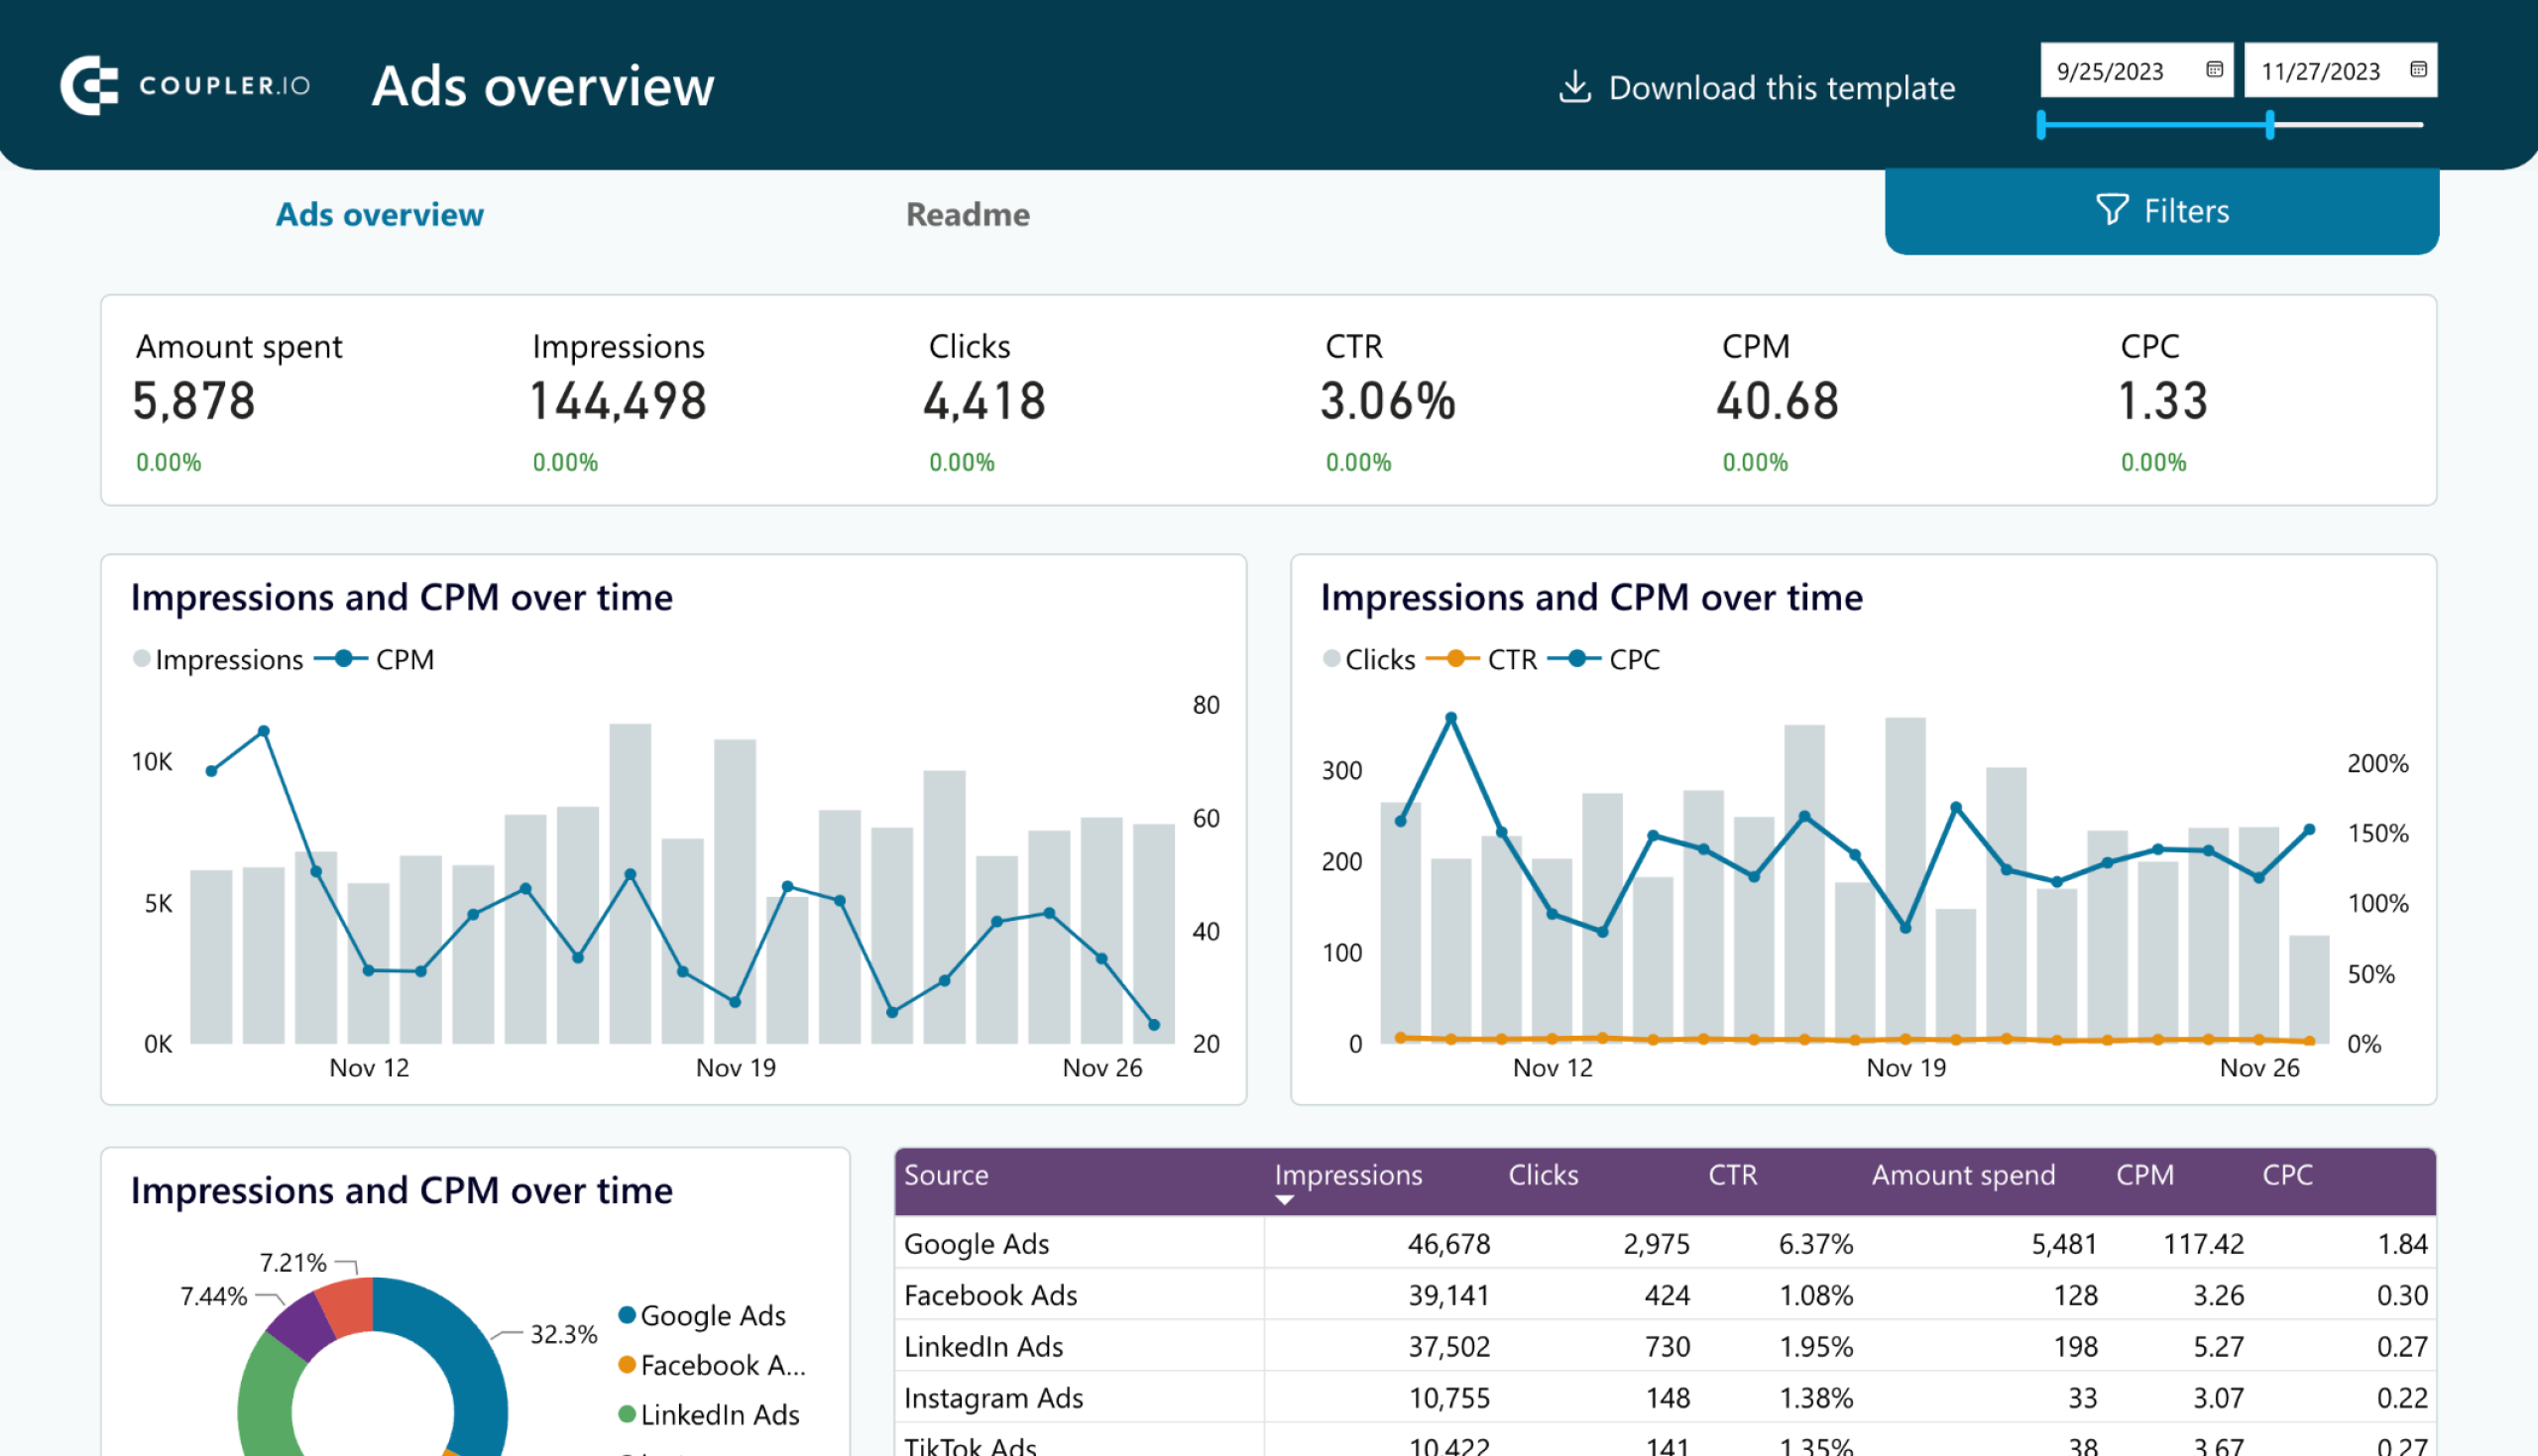
PPC cross-channel dashboard
Most likely, you run ad campaigns not only on Google Ads but also on other ad platforms such as Facebook Ads, LinkedIn Ads, etc. For this case, Coupler.io offers another PPC report template that is meant for analyzing the performance of multiple PPC platforms.
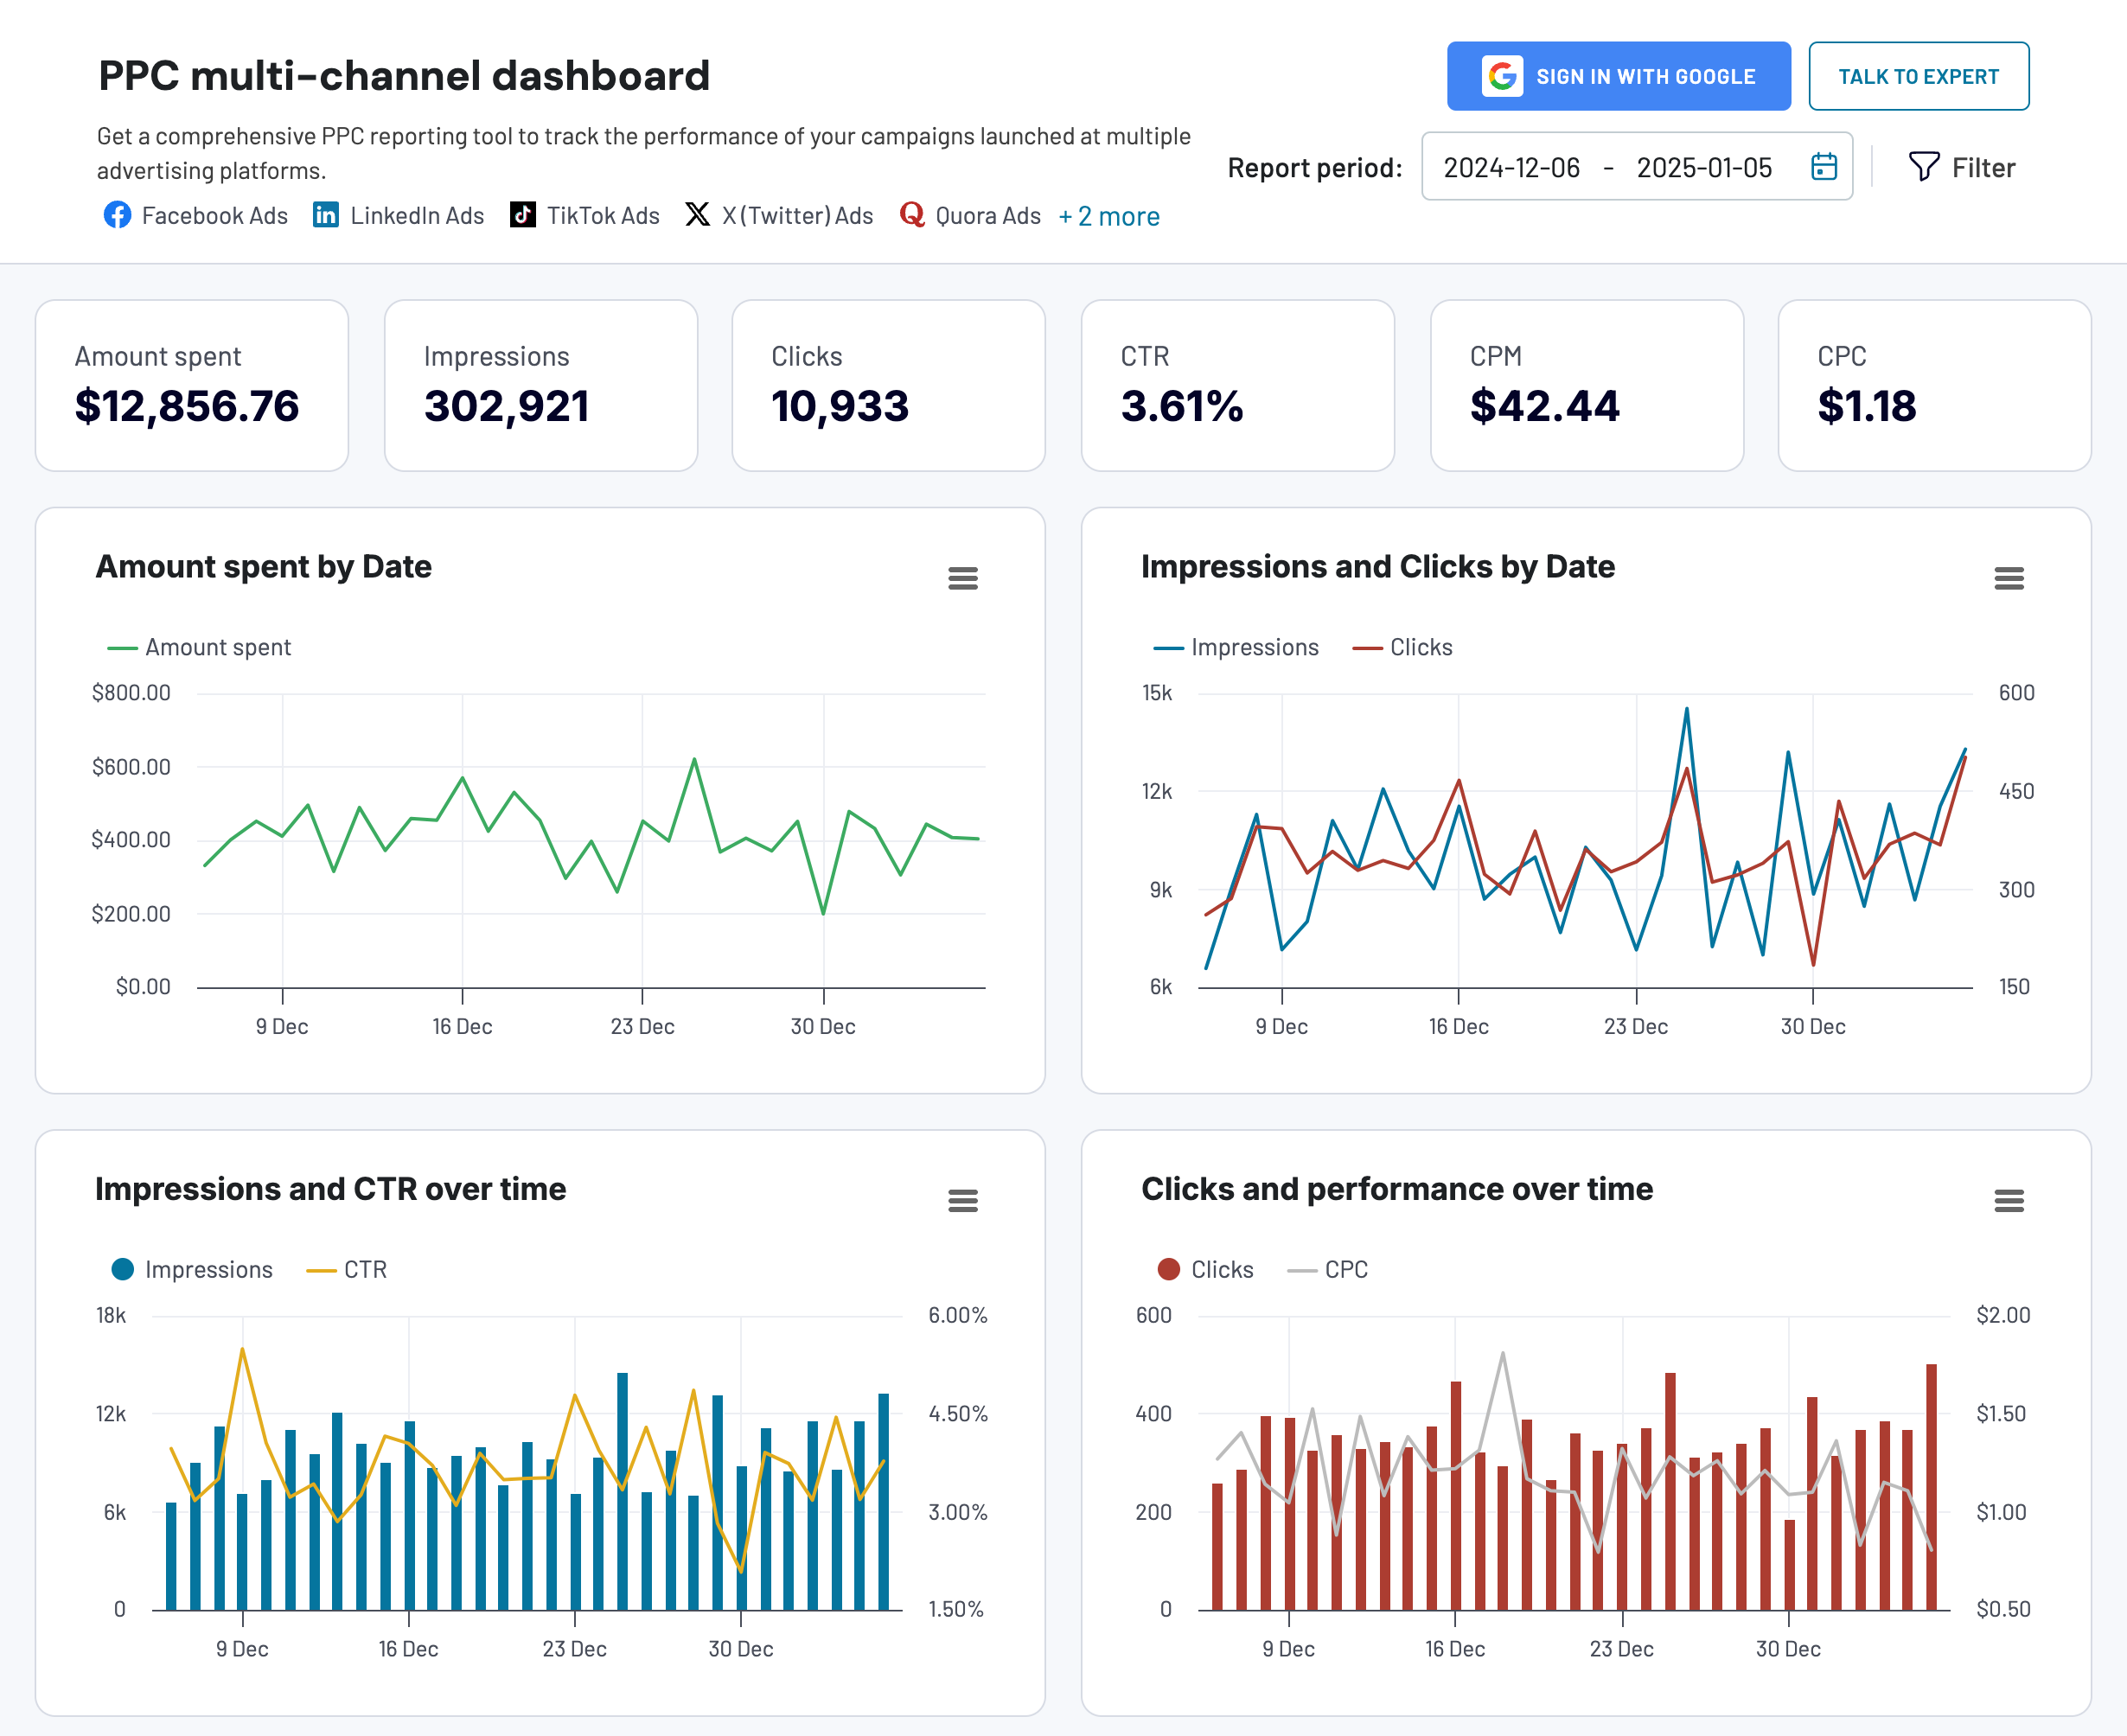
It supports Google Ads, Facebook Ads, LinkedIn Ads, Instagram Ads, TikTok Ads, and other platforms. You can use it to visualize your advertising data by connecting only your Google Ads account and populating the dashboard.
This dashboard template is designed in Coupler.io. At the same time, it’s also available as a template for multiple destinations, including Google Sheets, Looker Studio, Power BI, and Tableau. If you’re interested in any of those, pick the one you would like to get started.

PPC multichannel dashboard in Google Sheets
Use a PPC dashboard designed for Google Sheets to track the performance of your campaigns across multiple advertising platforms.


PPC multichannel dashboard in Looker Studio
Get a comprehensive PPC reporting tool to track the performance of your campaigns launched at multiple advertising platforms.
PPC multichannel dashboard in Power BI
Use a Power BI PPC dashboard for tracking and analyzing your advertising campaigns across multiple platforms.

PPC multichannel dashboard in Tableau
Track and analyze the performance of your advertising campaigns across various platforms using a one-stop PPC dashboard in Tableau

Google Ads keyword performance dashboard
The Google Ads keyword performance dashboard is useful for evaluating keyword effectiveness across your campaigns. It provides a detailed view of key metrics like cost, impressions, clicks, CTR, CPC, conversion rate, and cost per conversion. With this dashboard, you can quickly see which keywords are delivering the best results and which ones need improvement.
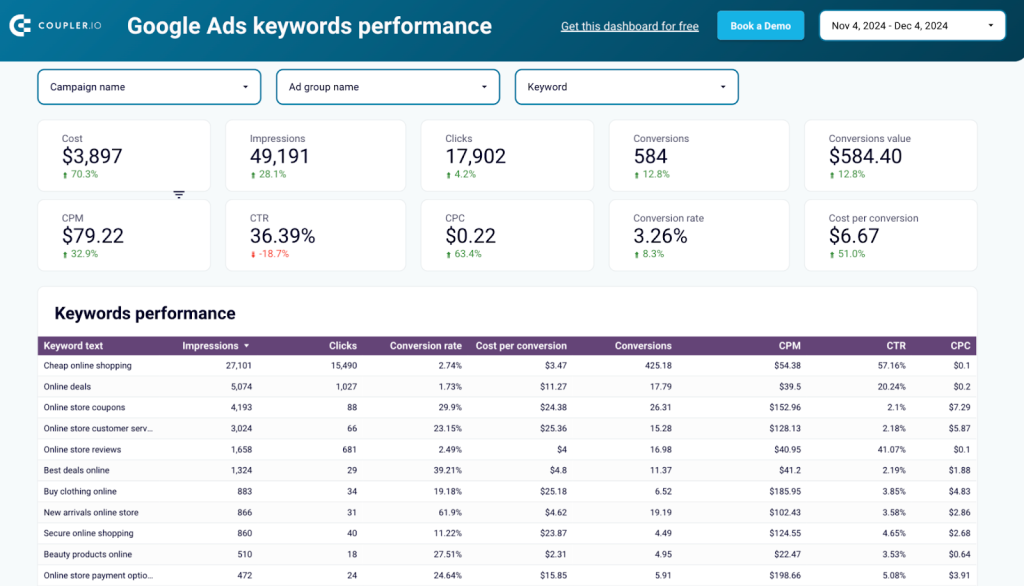
It is designed to show trends over time and spot patterns to adjust your ad strategy as needed. For example, you can monitor changes in CPC or identify keywords that are driving conversions to allocate your budget effectively.
Best of all, the dashboard is fully automated and keeps your data up-to-date without any manual intervention. It is available in Looker Studio and can be easily set up in minutes.
Google Ads quality score dashboard
The Google Ads quality score dashboard provides insights into metrics like historical quality score, impression-weighted quality score, click-weighted quality score, and cost-weighted quality score. By visualizing these data points, you can evaluate how well your ads align with user intent and Google’s quality standards.
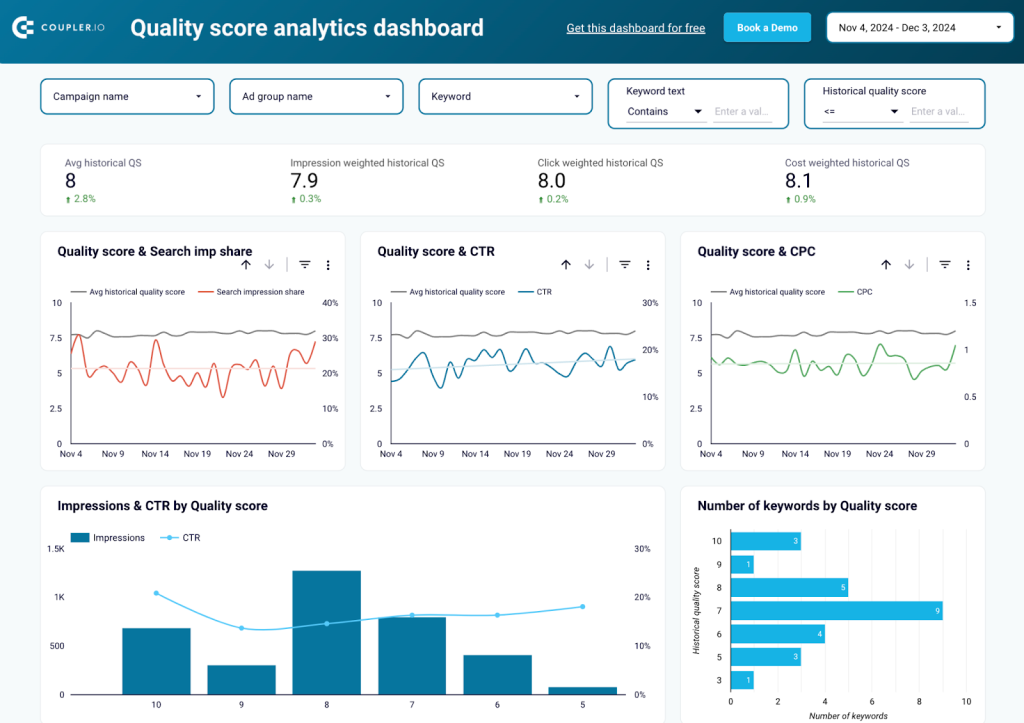
With this dashboard, you can track the impact of quality score on critical metrics like CTR, CPC, and search impression share over time. It allows you to identify patterns, prioritize high-performing keywords, and uncover opportunities to improve ad relevance, landing page experience, and expected CTR.
The dashboard is fully automated and ensures you always have up-to-date data at your fingertips. It is available in Looker Studio and can be set up in minutes By focusing on quality score metrics, you’ll be able to improve ad performance and maximize your ROI.
Google Ads creatives dashboard
The Google Ads creatives dashboard allows you to analyze the performance of your ad creatives. With a clear breakdown of metrics like impressions, clicks, CTR, CPC, CPM, and conversions, you get valuable insights into how your creative assets are contributing to results. This dashboard also highlights which ad formats and messaging are performing best.
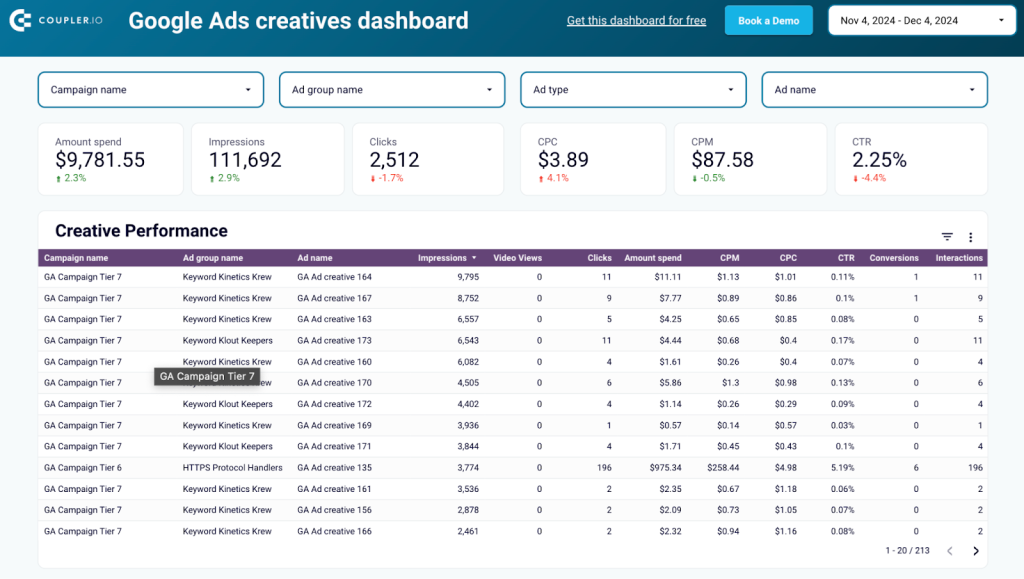
The dashboard is fully automated, ensuring your data is always up-to-date. It is available in Looker Studio and can be customized with your data in minutes.
Such dashboards are important instruments that enable data-driven decisions. As we’ve already mentioned, they can display near real-time data, enabling you to monitor Google Ads key metrics and performance indicators. Also, they help integrate data from multiple sources and systems, bringing together diverse datasets into a single view.
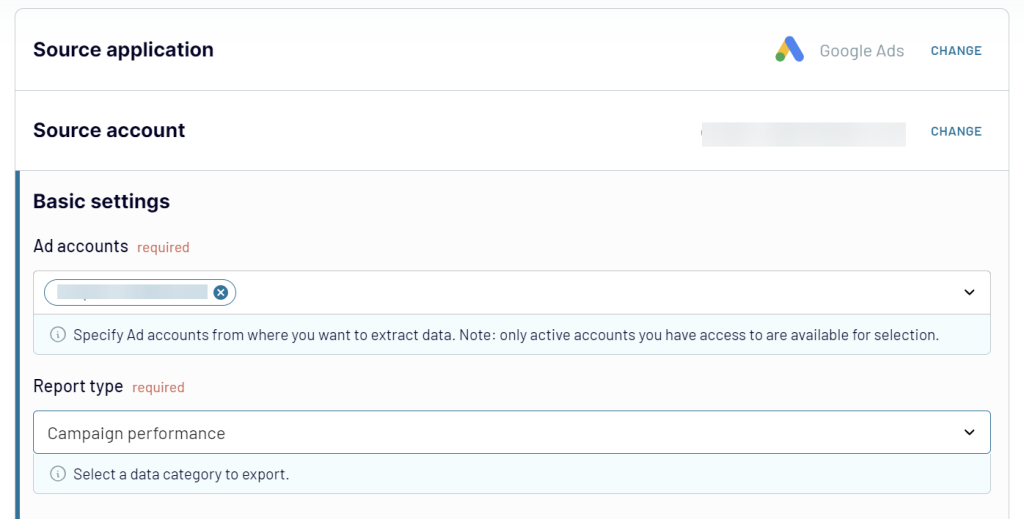
At the same time, Coupler.io is not only about dashboard templates. This reporting automation platform allows you to create custom Google Ads reports and load them to spreadsheets, data warehouses, or BI tools. You can try it yourself right away for free. Just select an app where you’d like to load your report in the form below and click Proceed.
Once you connect your Google Ads account, you can select what data you want to import to Looker Studio.
Then, you will need to follow the instructions in the app to transform your data into a report and load it to the selected destination app. The flow is quite simple and doesn’t require any tech knowledge.
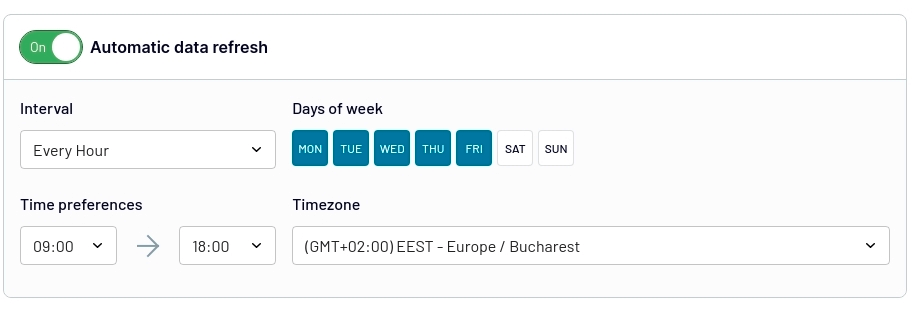
Then, you can schedule your exports in Coupler.io. Specify the preferred update interval, days of the week, and time preferences for your automatic data refresh.
Coupler.io allows you to extract data from various ad sources like Google Ads, Google Analytics 4, LinkedIn Ads, YouTube, and 60+ other business apps. You can blend data from multiple apps, transform it in various ways, calculate custom metrics, and then load your information into Google Sheets, Looker Studio, Power BI, Tableau, BigQuery, and more.
Explore our guide on YouTube Ads.
Tips and tricks for working with Google Ads key metrics
Want to better monitor your metrics in Google Ads? We’ve prepared a few tips and tricks that will help you.
Set up clear goals
Before you start tracking key metrics, you need to define your goals. Determine what you want to achieve with your campaigns and then choose the metrics that best align with those goals. For example, if you are setting up a campaign to promote your event, you will need to pay closer attention to the conversion rate than to impressions.
Visualize data in dashboards
Google Ads doesn’t offer you much customization for presenting and analyzing your data. At the same time, a Google Ads analytics dashboard created outside of the platform will ensure full flexibility and endless customization. You can choose any graphical elements you wish, from line or bar charts to pivot tables and more. You can select any metrics in any combination, and even bring together data from multiple ad channels. Native Google Ads functionality cannot offer you that.
On a higher level, creating dashboards offers several advantages for campaign management and decision-making. Dashboards and graphs provide a clear and concise presentation of data, making it easier to interpret and understand complex metrics. Visualizing data through dashboards enables you to gain valuable insights that might not be apparent from raw numbers alone.
Look at trends
Looking at trends in Google Ads metrics provides valuable insights beyond simple metrics by offering a more comprehensive view of your campaign performance. Trends provide context by showcasing how your metrics change over time. Simple metrics might give you a snapshot of your current performance, but trends help you understand if your metrics are improving, declining, or staying stable.
Also, by looking at trends, you can identify patterns and spot any anomalies. Trends can help in forecasting future performance based on historical patterns, aiding budget planning and goal setting.
On a similar note, you can read about the latest PPC trends to optimize your strategy for 2025 and beyond.
Compare data to industry benchmarks
Industry benchmarks provide a reference point to evaluate your campaign’s performance against the broader market. By comparing your metrics to industry averages or benchmarks, you can gauge how well your campaigns are performing relative to your competitors or industry standards.
Industry benchmarks serve as a guide for setting realistic and achievable goals. Also, these benchmarks help identify areas where your campaign excels or falls behind compared to industry leaders.
Check out the article on 2025 PPC advertising statistics to start benchmarking your Google Ads metrics.
Make tracking metrics in Google Ads hassle-free
Tracking Google Ads metrics is crucial for successful campaign management and optimizing advertising performance. By monitoring and analyzing key metrics, advertisers gain valuable insights that enable data-driven decision-making. Metrics also highlight areas for improvement within campaigns. Therefore, by closely monitoring metrics, advertisers can identify underperforming keywords, ad groups, or targeting settings, enabling them to optimize their strategies for better results.
For better visualization, use tools like Coupler.io to create insightful dashboards for Google Ads analytics. These will help you to better track your metrics and share campaign results with clients or managers.
Automate Google Ads reporting with Coupler.io
Get started for free


