
Promoting your business through Google Ads requires an optimized budget. You must identify top-performing advertising efforts to invest more in and underperforming ones to pause. This involves a lot of data analysis, and what’s a better tool for this than BigQuery? Let’s explore how to export data from Google Ads into BigQuery and prepare your reports for analysis!
Ways to load Google Ads data to BigQuery
There are several common ways to get your data from Google Ads to Google BigQuery:
- No-code Google Ads to BigQuery integration by Coupler.io
You can use Coupler.io to create custom reports based on extracted Google Ads data and have them automatically loaded into BigQuery on schedule. This method is simple and allows you to fetch marketing data from other apps into BigQuery for cross-channel analysis. Coupler.io also provides built-in dashboard templates. So you can gain insights from your data directly within the app interface without building reports or exporting them to external tools.
- Manual data transfer via the CSV file
Here, you’ll need to export data from Google Ads as a CSV file and then upload it to BigQuery.
- Data Transfer Service
BigQuery’s feature, Data Transfer Service, enables you to automate the transfer of Google Ads data to BigQuery and keep it up to date.
- Google Ads Script
This method involves writing a script that pulls data from Google Ads via the API and loading it into BigQuery.
Let’s check out all these methods to choose the best one for your needs.
Option #1. No-code Google Ads BigQuery integration by Coupler.io
Would you like to automate data exports on a schedule, for example, every hour on Tuesday and Friday? You can do this quite easily with the help of the Google Ads BigQuery integration by Coupler.io in three simple steps:
Step 1. Extract data from Google Ads
- Click Proceed in the form below. We’ve preselected the data source and destination – in our case, Google Ads and BigQuery.

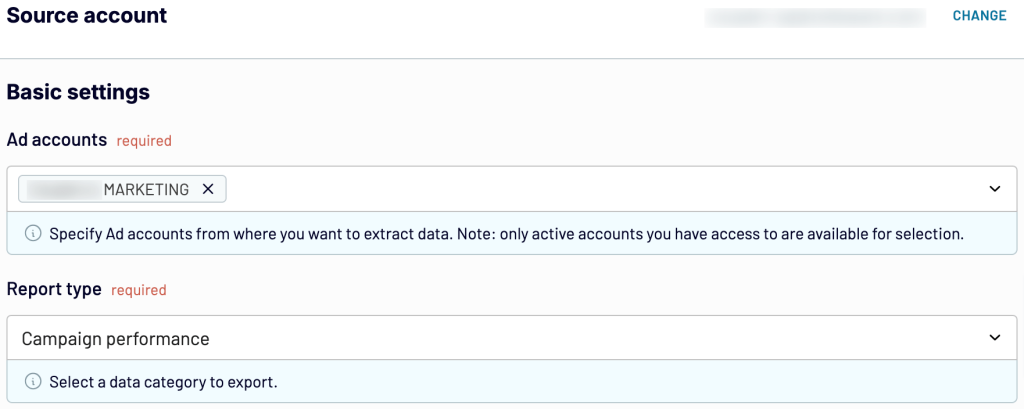
- Connect your Google Ads account, then select the required Ad accounts and specify the Report type. For this example, we’ve chosen the Campaign performance report.

- Optionally, you can select the Start date and End date for reporting, as well as choose how to split data by periods. Then, finish the source setup and proceed.
Now, if you want to export data from more Google Ads accounts, select Google Ads from the gallery of sources and adjust the settings as described above. Later, you can merge all the datasets into a single one and import them into the same destination file.

Once ready, proceed to the next step.
Step 2. Transform data
In this step, you can preview your data and make the following transformations:
- Rename, rearrange, hide, or add columns.
- Sort data in ascending or descending order.
- Filter data to extract it based on specific criteria.
- Create new columns with custom formulas.
- Aggregate data using operations like sum, avg., count, min., or max.
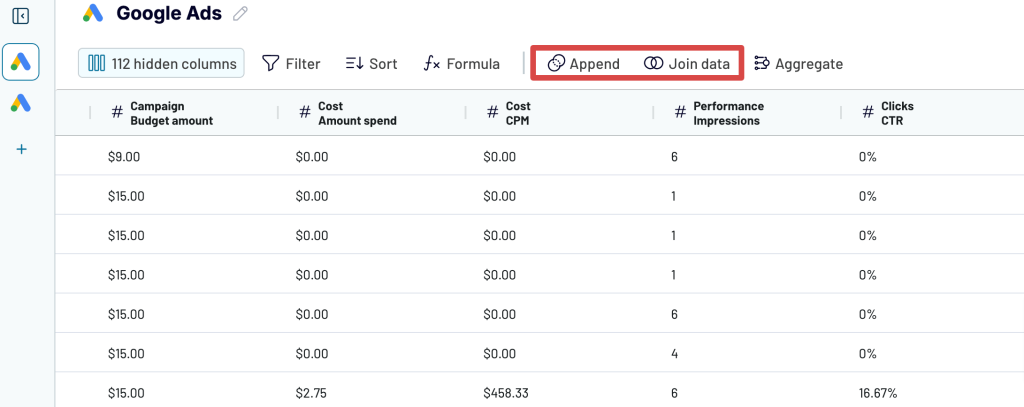
- If you’ve previously connected several sources, blend data in the chosen manner:
- Append – merge datasets with similar structures and columns matched by name.
- Join – combine datasets with different structures and at least one matched column.

Once you’re ready with your data, move forward to set up your destination.
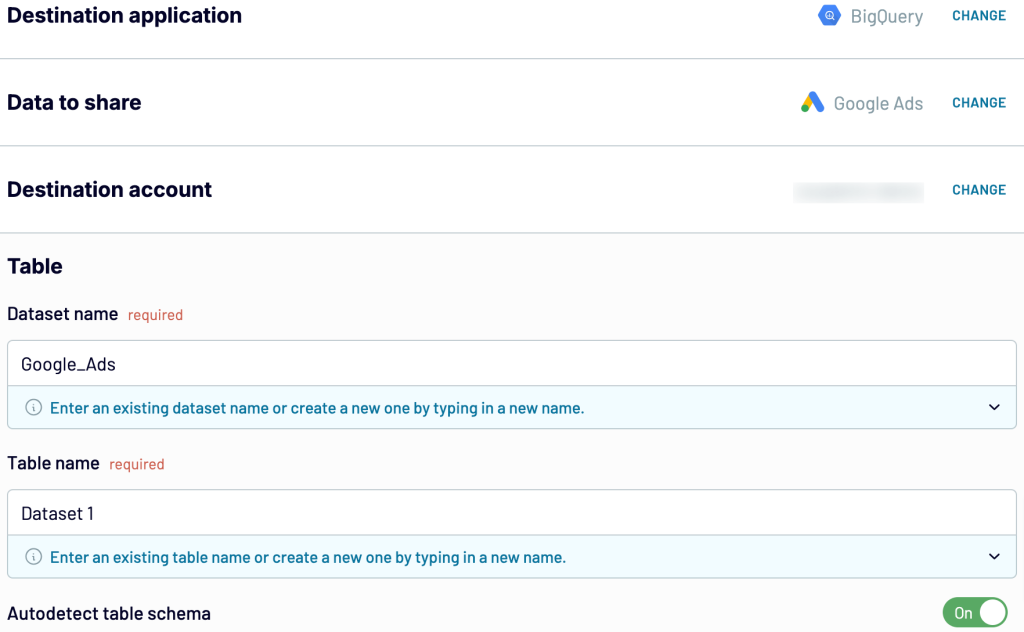
Step 3. Load data and schedule refresh
Now, you’re ready to connect your BigQuery account. To do this, you’ll first need to generate a Google Cloud JSON key. See these instructions on how to get it. Once done, upload it in the connection form. The Project ID and Connection name will be filled in automatically. Press Save.
Once the BigQuery account is connected, specify the dataset and table where Coupler.io should export your data. You can create a new dataset and table by typing new names.
Toggle on Autodetect table schema – this will help to structure your data correctly while importing.

In addition to BigQuery, Coupler.io allows you to load data from Google Ads to PostgreSQL.
You can optionally change the import mode. For the first import, the result won’t change, but it will matter when you set a schedule for the updates. If you select Replace, the old Google Ads dataset will be replaced with its updated version during each data refresh. If you opt for Append, the updated version will be below the previous one. The latter can be helpful if you need to track changes chronologically.
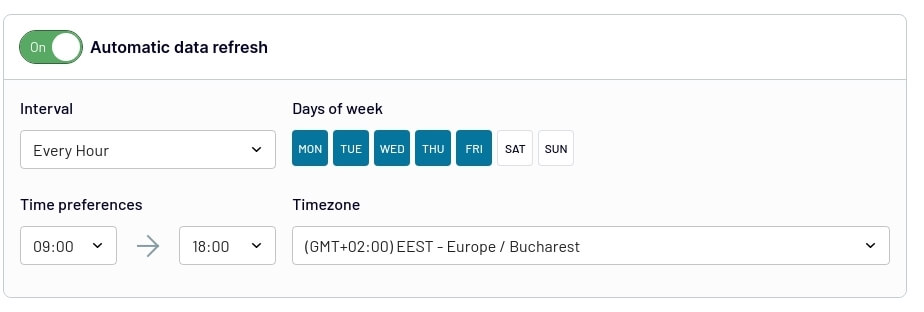
Proceed to toggle on Automatic data refresh and configure the desired schedule to automate data load from Google Ads to BigQuery. Coupler.io can refresh data as frequently as every 15 minutes!

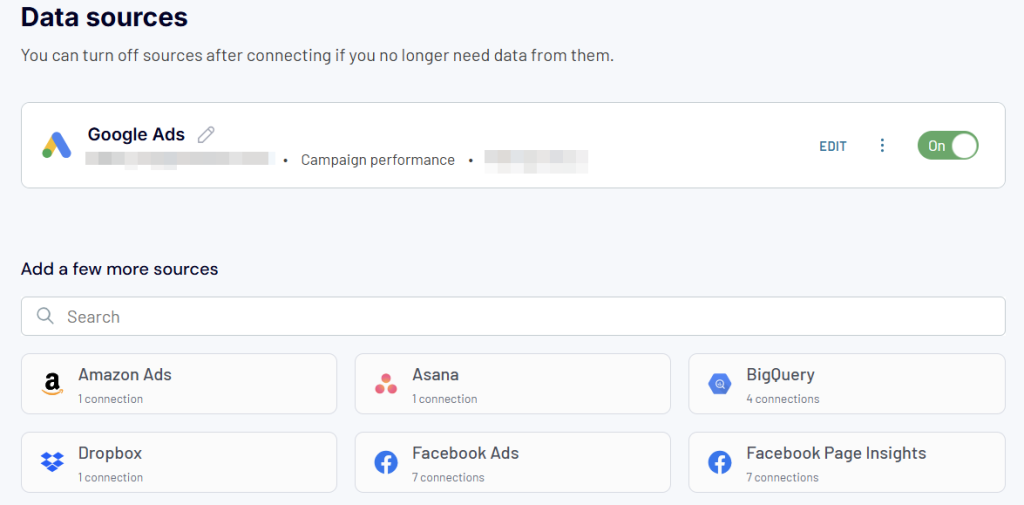
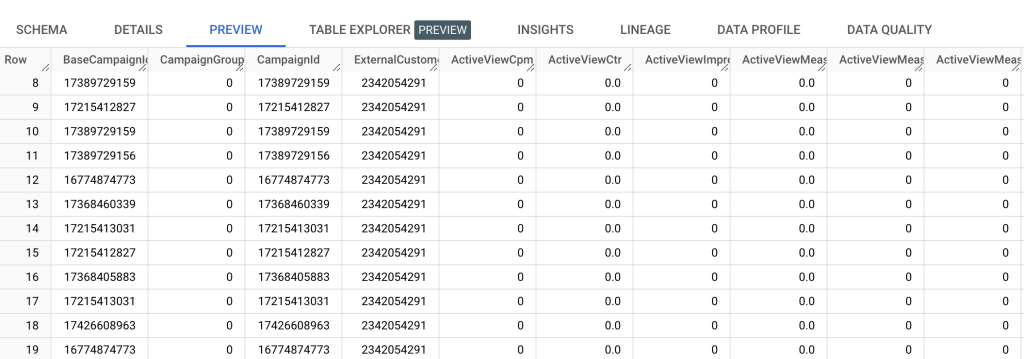
After that, run the importer, and you’re done. Here’s an example of data exported from Google Ads to BigQuery:

Option #2. How to export Google Ads reports to BigQuery
The most straightforward way to load your data to BigQuery is by using CSV files. BigQuery can automatically create a table based on your CSV file schema, so let’s see how we can do this:
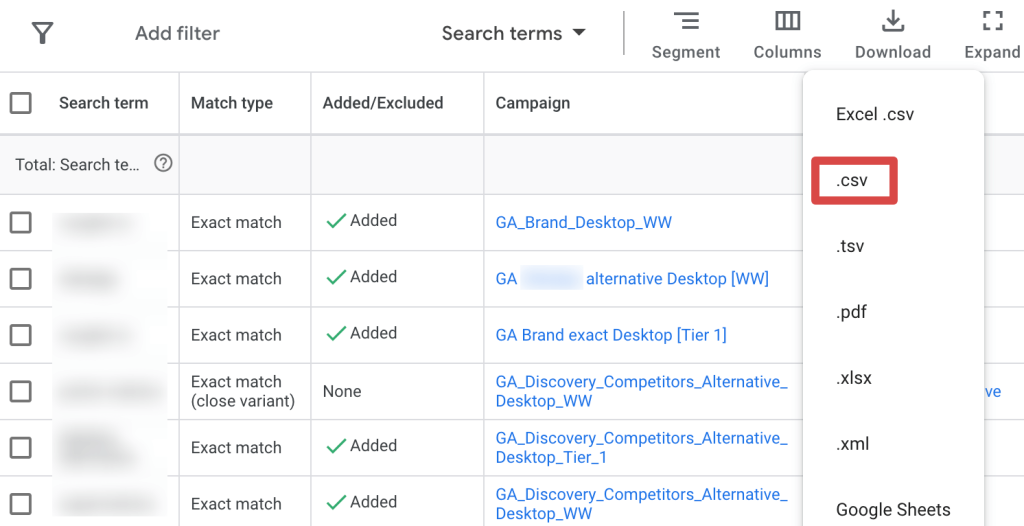
- Open Google Ads and navigate to the report you want to download.
- Click Download from the top of the report.

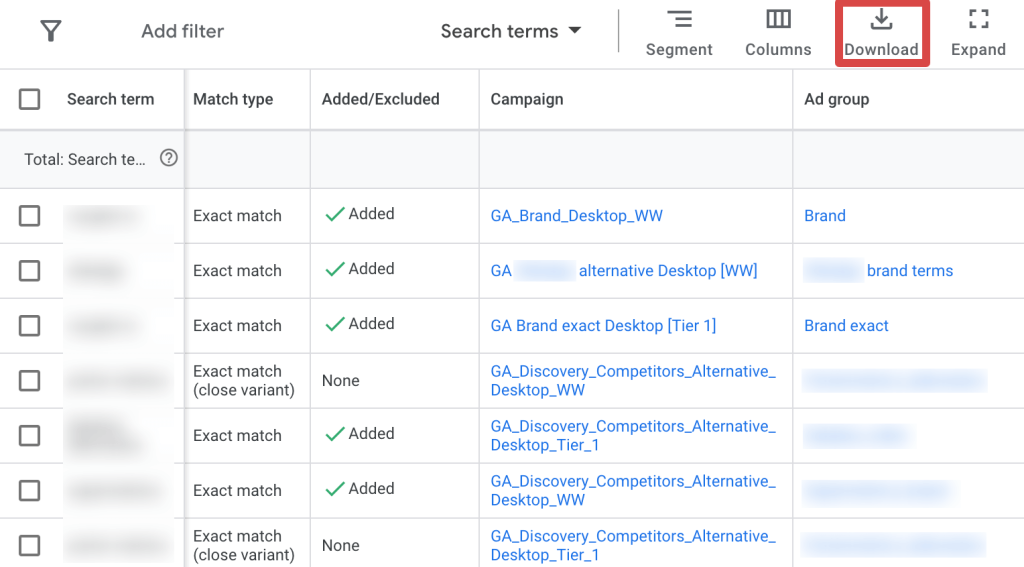
- Select .csv as the format.

Now that the report has been downloaded, we must add it to Google BigQuery. To do this:
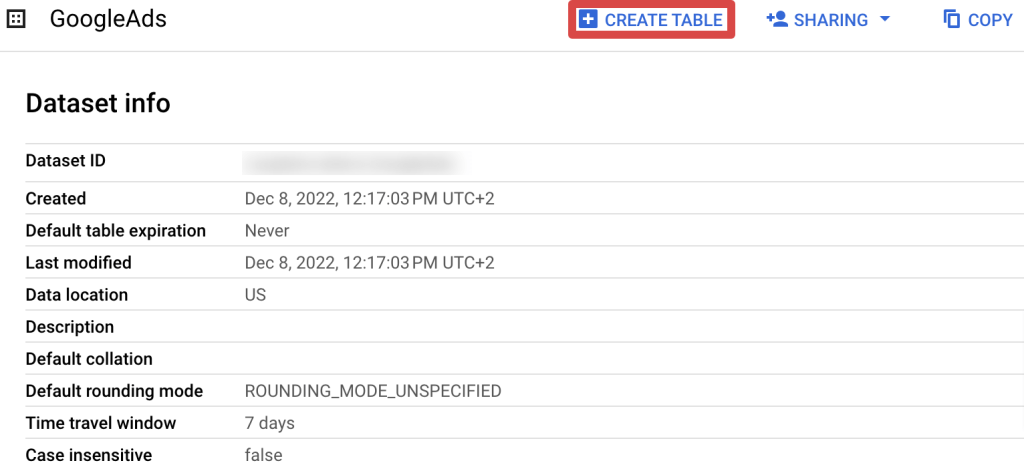
- Open your Google BigQuery console.
- Choose the dataset that will contain the new report table.
- Click on Create Table from the Dataset menu.

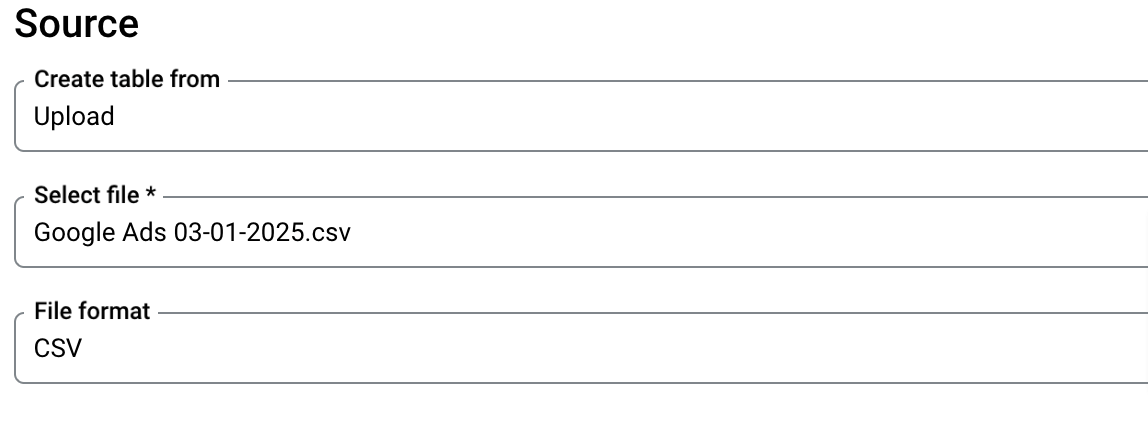
- Select Upload as the source of the table, your file, and CSV as the file format.

- Specify the table name for the uploaded report.

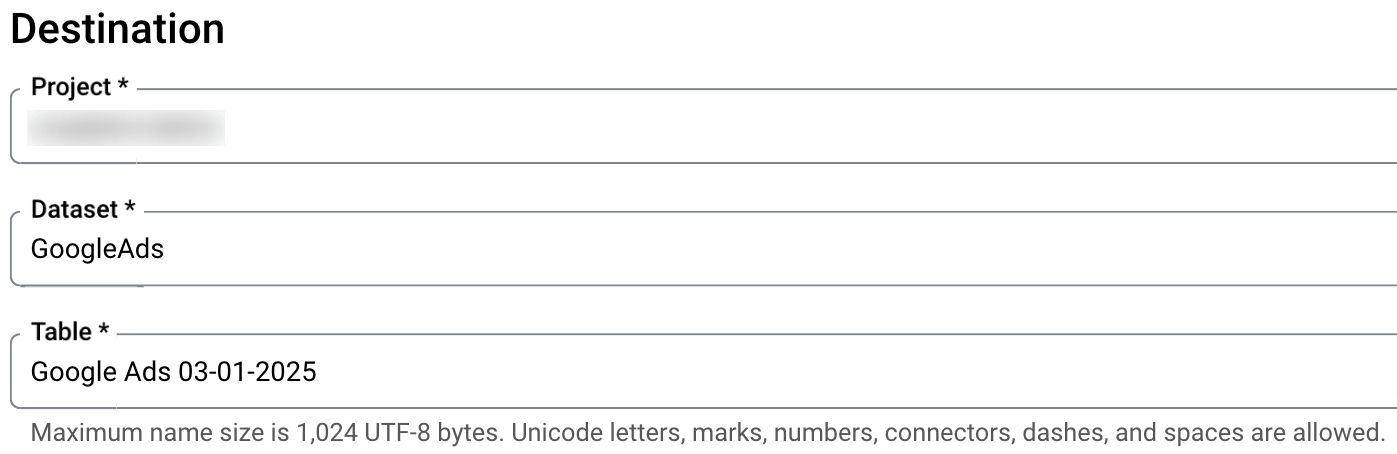
- Put a tick against Auto detect. Then click Create Table.
Congratulations! Your report is now loaded in BigQuery and ready for analysis!
This simple manual method is fine if you want to transfer your data once. However, for recurring data exports, you’d better connect Google Ads to BigQuery. Let’s take a look at how this can be done.
Option #3. How to transfer Google Ads data to BigQuery using the Data Transfer Service
Another way you can transfer your Google Ads data to BigQuery is by using the official BigQuery Data Transfer Service. This helpful feature allows you to automatically transfer all your necessary Google Ads data to BigQuery and keep them up to date. Before starting, please ensure you have BigQuery Admin permissions and read access to the appropriate Google Ads account or Google Ads Manager account.
Let’s see how you can set it up:
- Go to the Google Cloud Platform and open your BigQuery console.
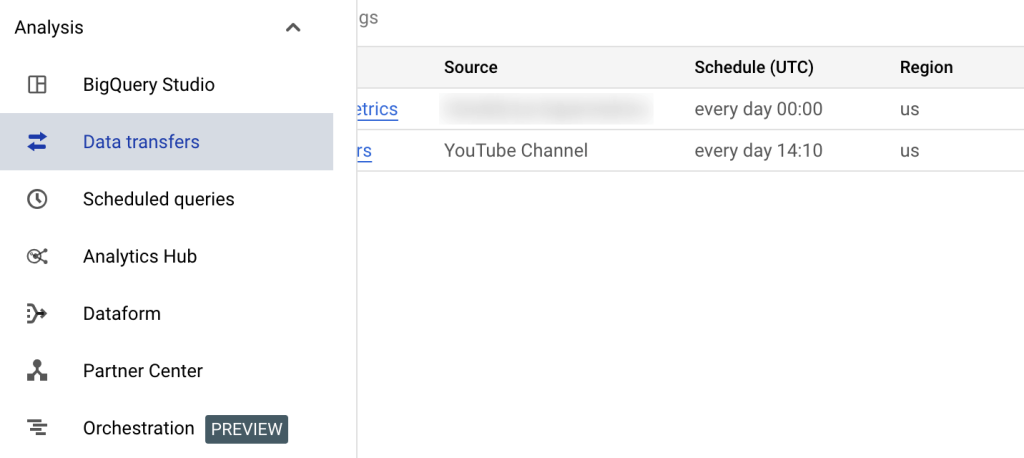
- From the left pane, choose Data Transfers.

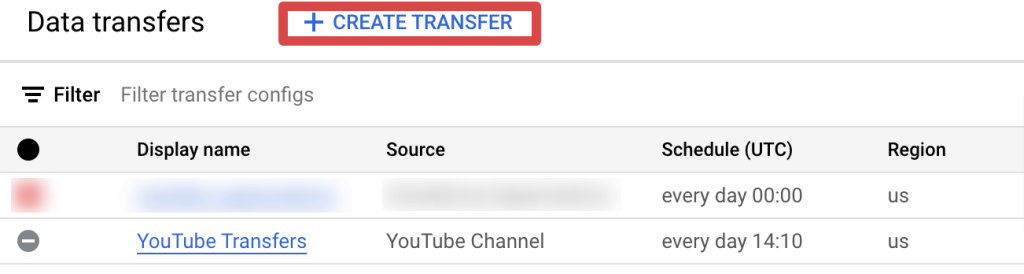
- Select Create transfer.

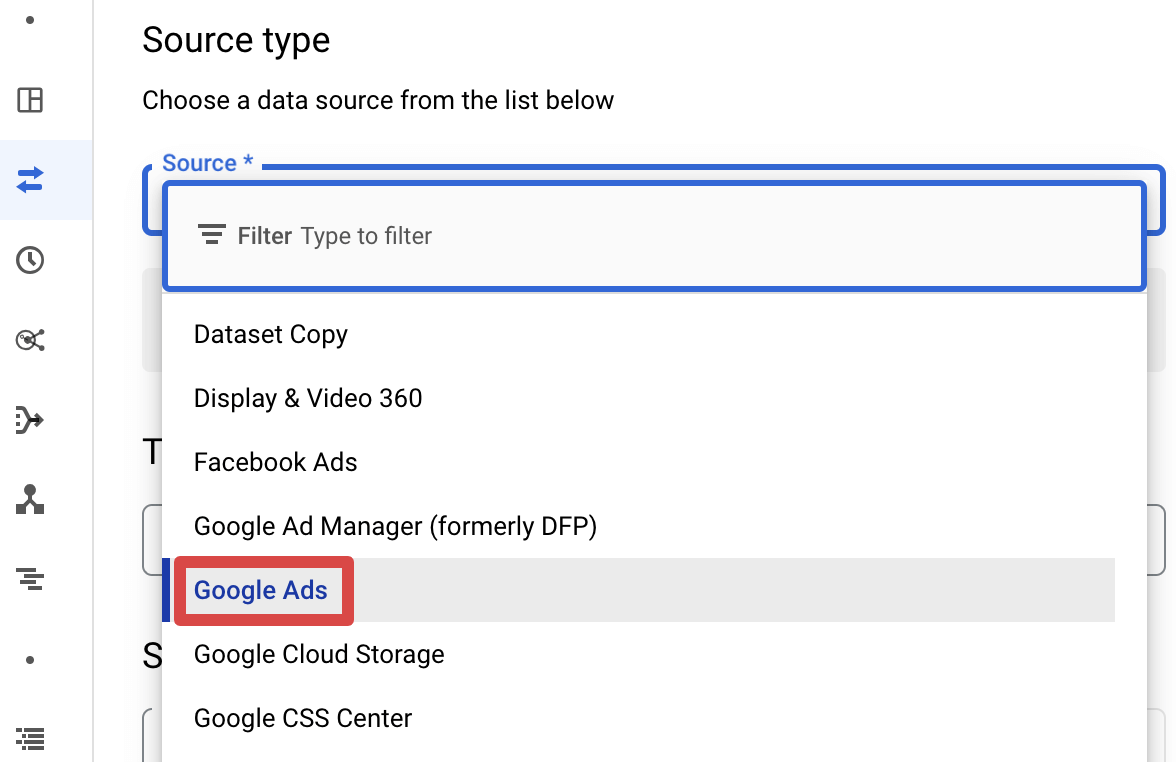
- In the Source field, select the Google Ads option.

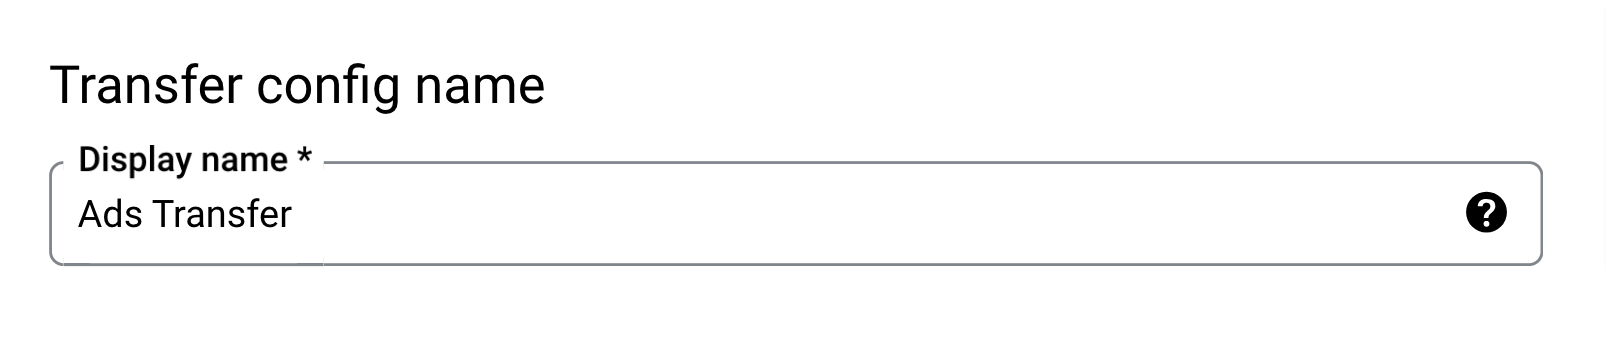
- Give a distinctive name to the transfer (e.g., *** Ads Transfer).

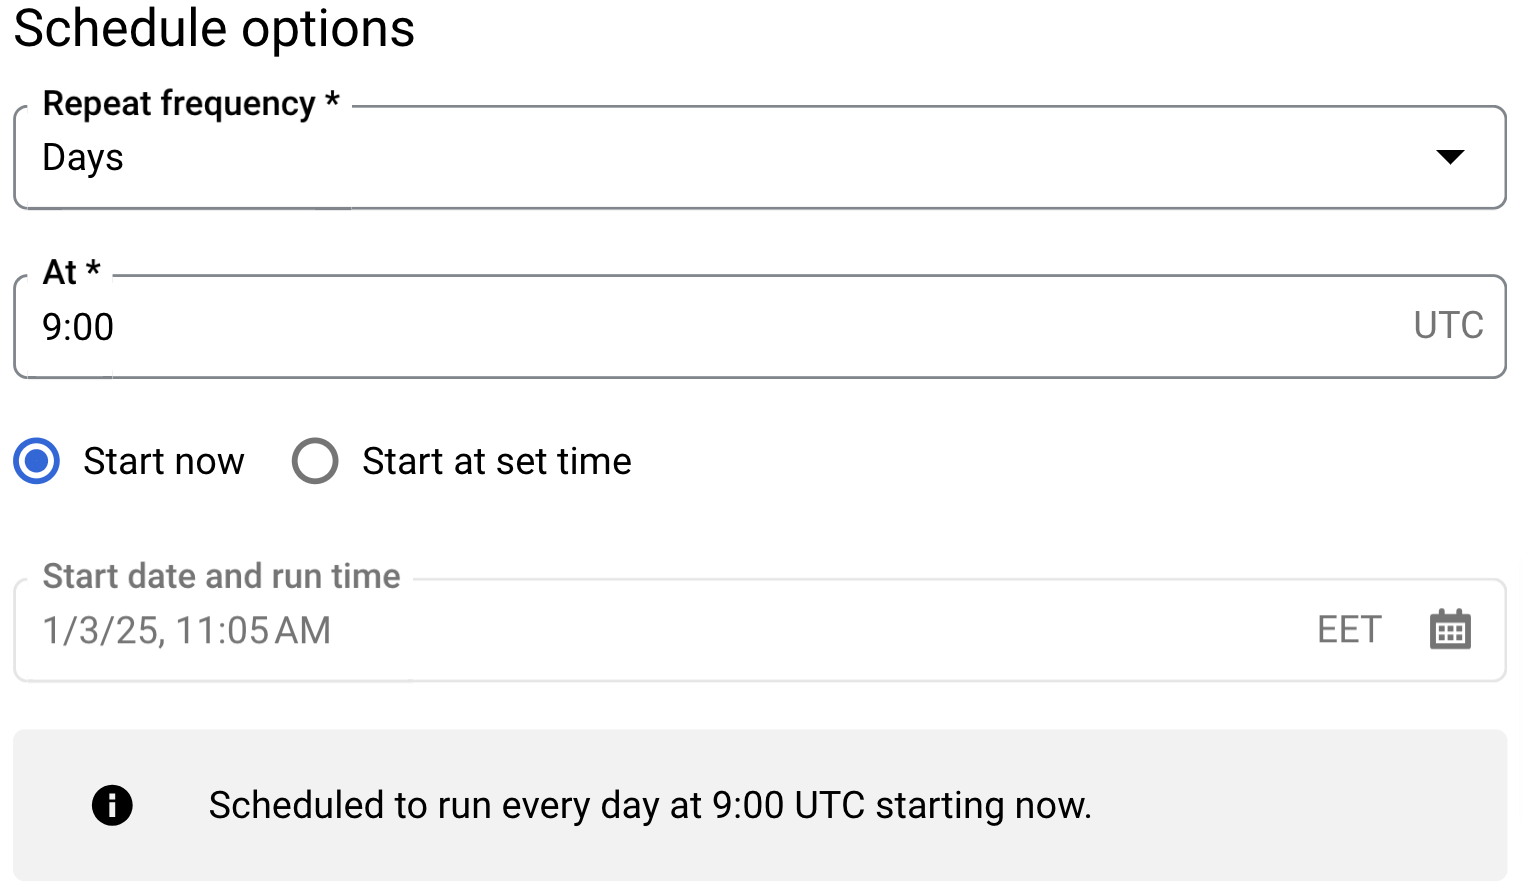
- Schedule your transfer by selecting the frequency and start time. We suggest running the transfer daily.

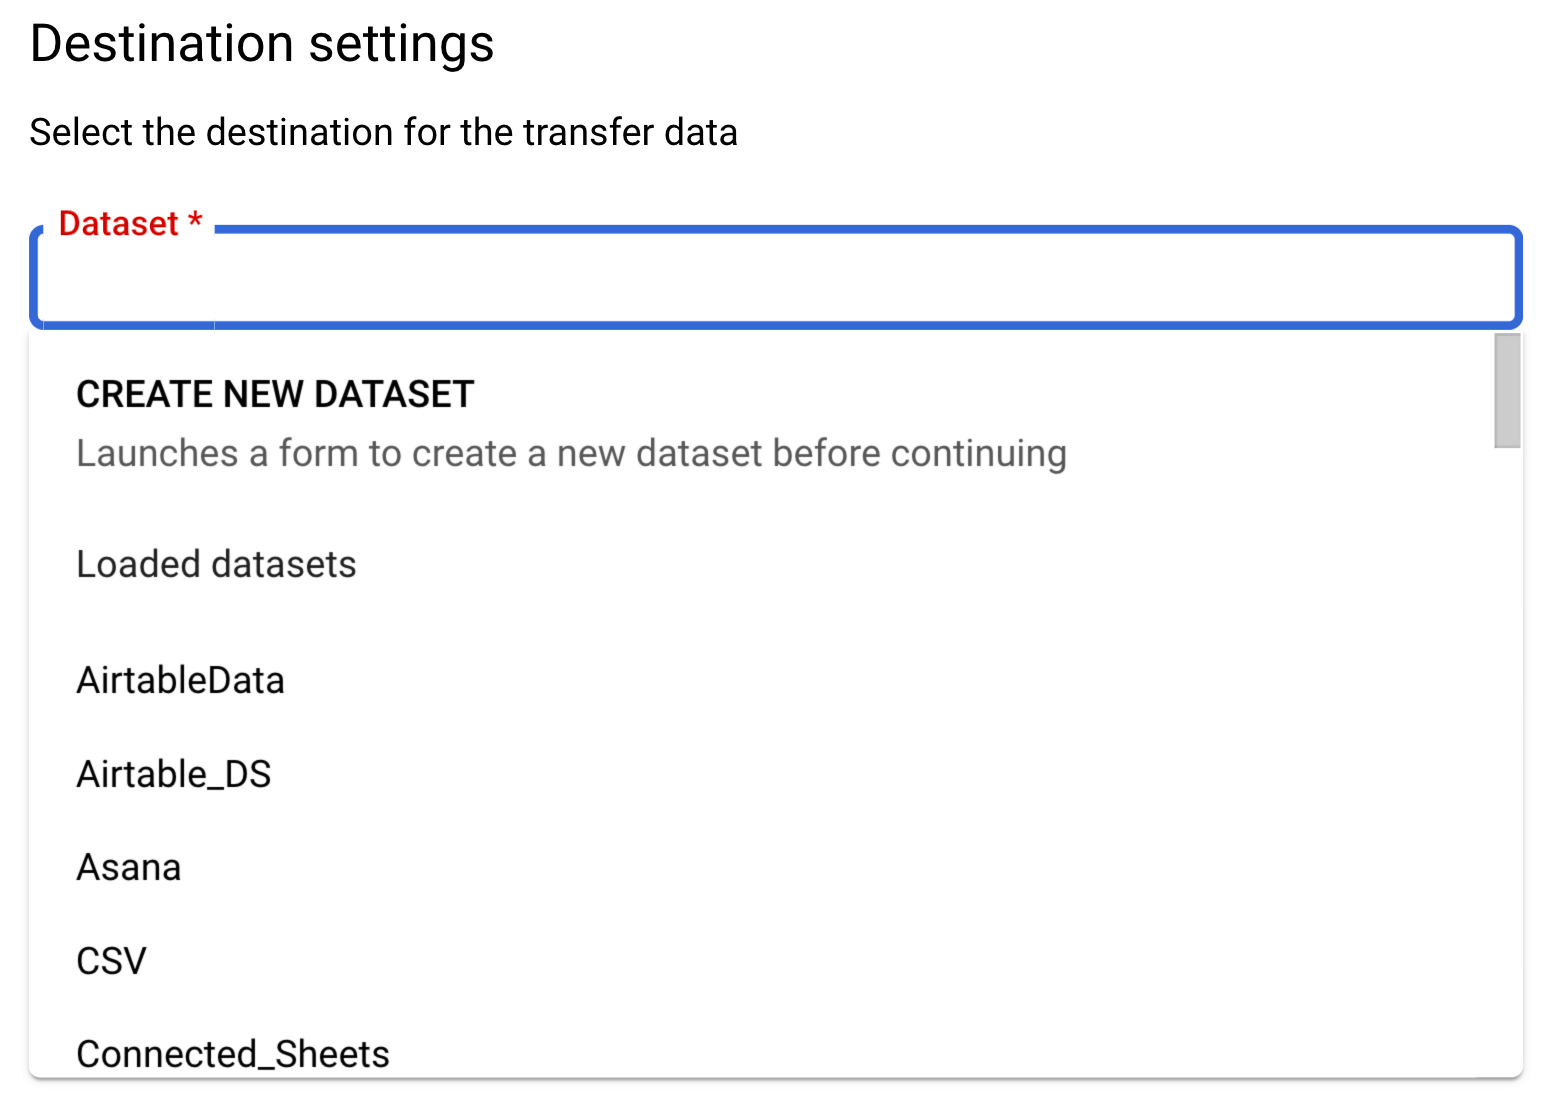
- Select (or create) your dataset under which all the tables will be made.

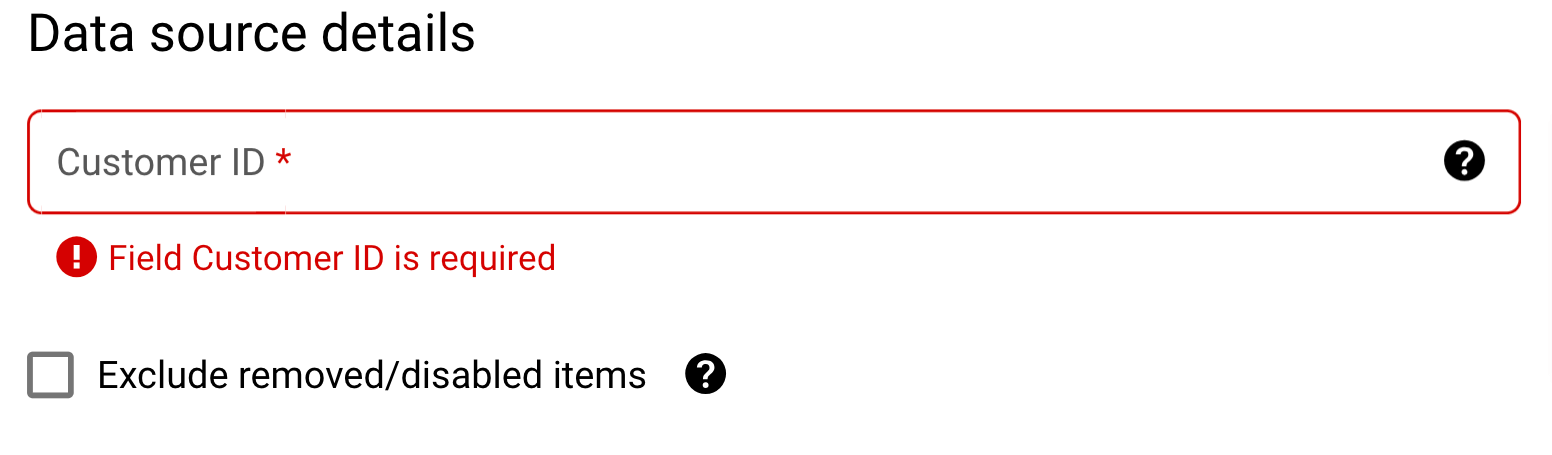
- Provide the customer ID of the Google Ads account (e.g., 1231231234). The service accepts both standard and manager accounts, so if you need multiple accounts for one transfer, you can add the manager account ID.

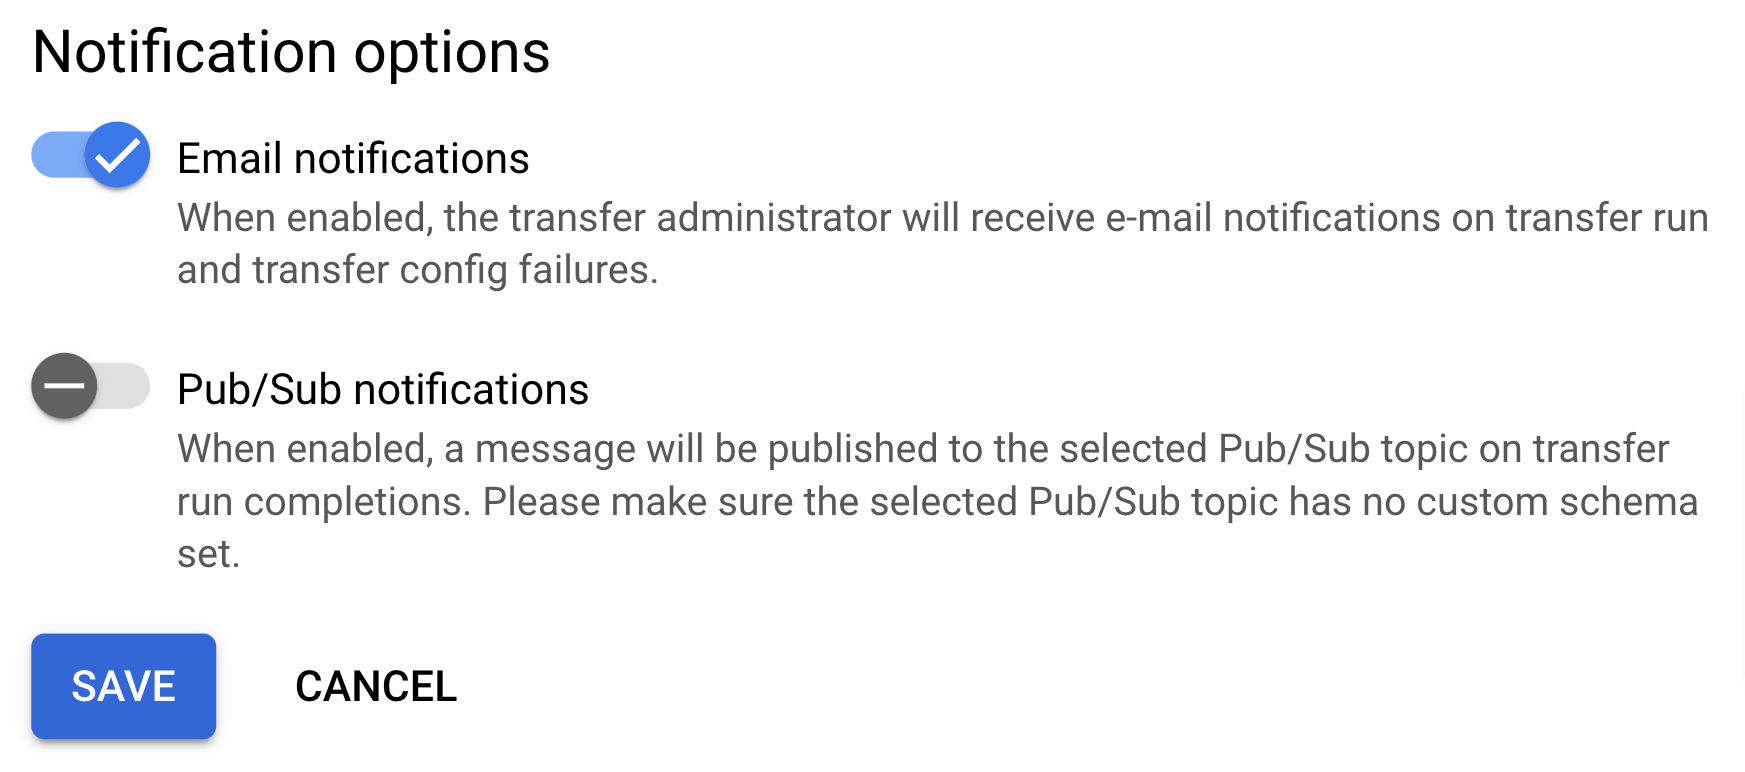
- You can add a customized Refresh window (from 0 to 30) which means that on each transfer, the services will import and update the last X days of data. If you leave it blank, the default is set to 7 days. Toggle on Email notifications and click Save.

This export will generate a set of tables and reports containing all the data you’ll need. Moreover, through backfilling, it will keep your data up to date, so you won’t need to do this all over again.
Option #4. How to send data from Google Ads to BigQuery using Google Ads Scripts
While the Data Transfer Service provides a fast and easy way to transfer all your data to Google BigQuery, there are times when you need only specific reports or to manipulate the data before uploading.
In this case, and if you’re familiar with coding, Google Ads scripts can be your best friend. Through custom JavaScript code, you can query, manipulate, and send Google Ads data to BigQuery. Let’s see how you can set up such a report and a code example of how to query a campaign performance report and send it to Google BigQuery.
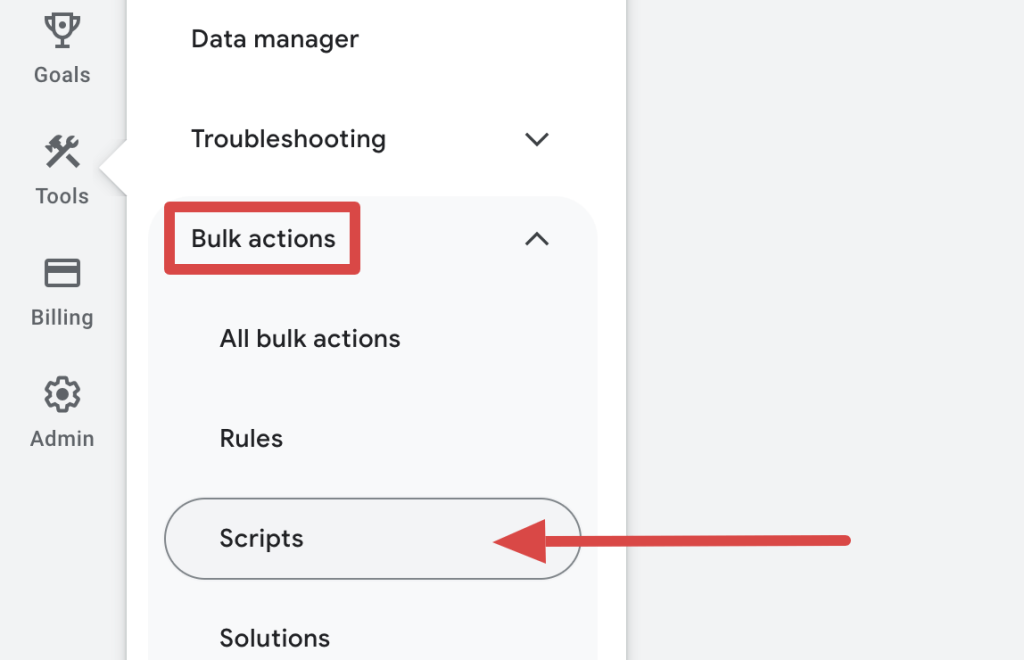
- Open Google Ads and navigate to the account of preference. Hover the pointer over Tools in the left sidebar. Select Scripts from the Bulk actions category.

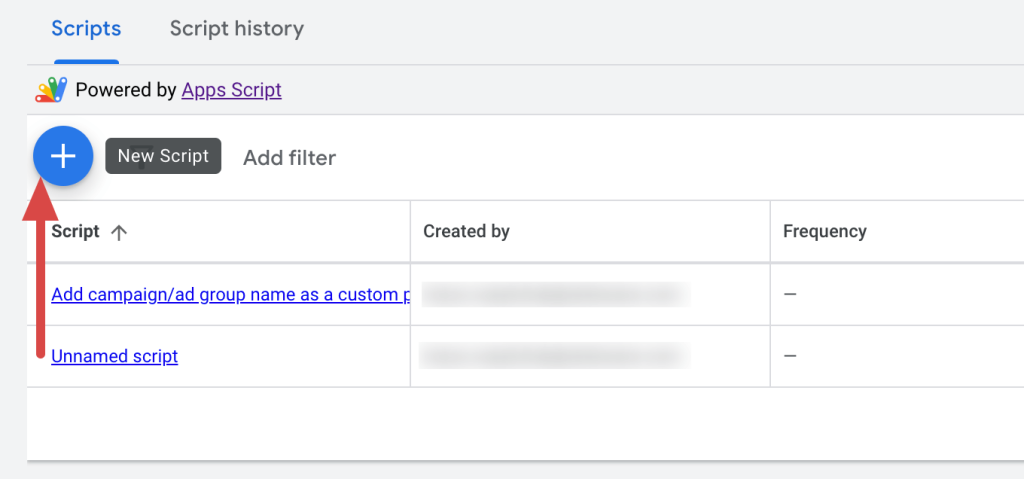
- Click on the + sign to create a new script.

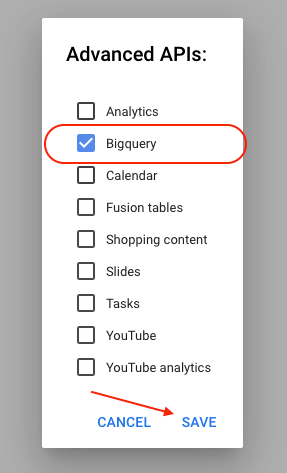
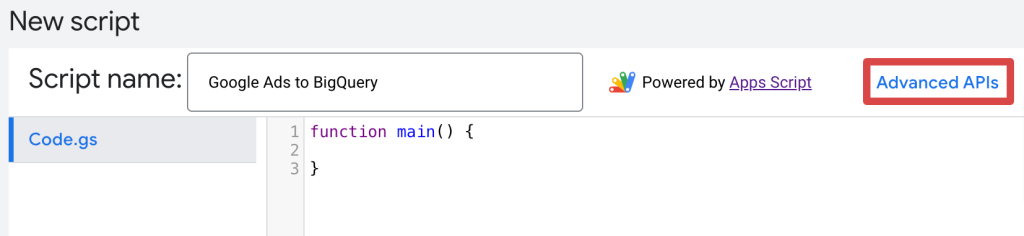
- Give a name to the script (e.g., Google Ads to BigQuery). Click on Advanced APIs.

- Enable BigQuery and click Save.

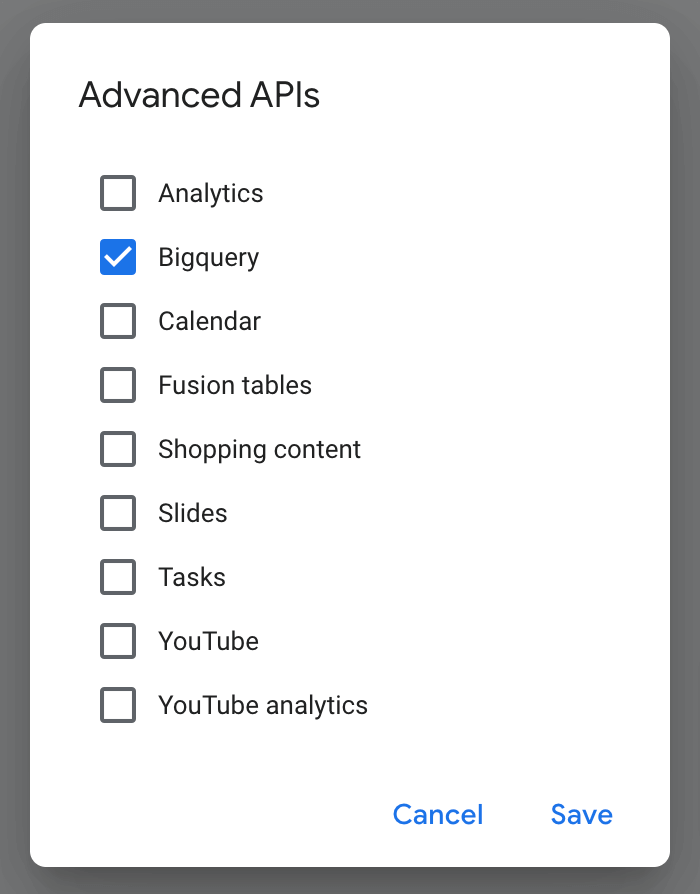
With these settings, Google Ads Scripts can connect directly to both Google Ads API and BigQuery. Writing your own scripts, you can access and manipulate Google Ads reports and load them to Google BigQuery.
The official documentation contains?? everything related to Google Ads Script. Then, you can start building your custom scripts to upload any required data.
Bonus: Ready-to-use Google Ads dashboards
To get immediate insights into your Google Ads data, use pre-built dashboard templates by Coupler.io. They are designed in Google Sheets, Looker Studio, and Power BI and equipped with a Coupler.io connector to load data from your account. This way, you get ready-to-use reports without creating them from scratch. Let’s take a look at some of them.
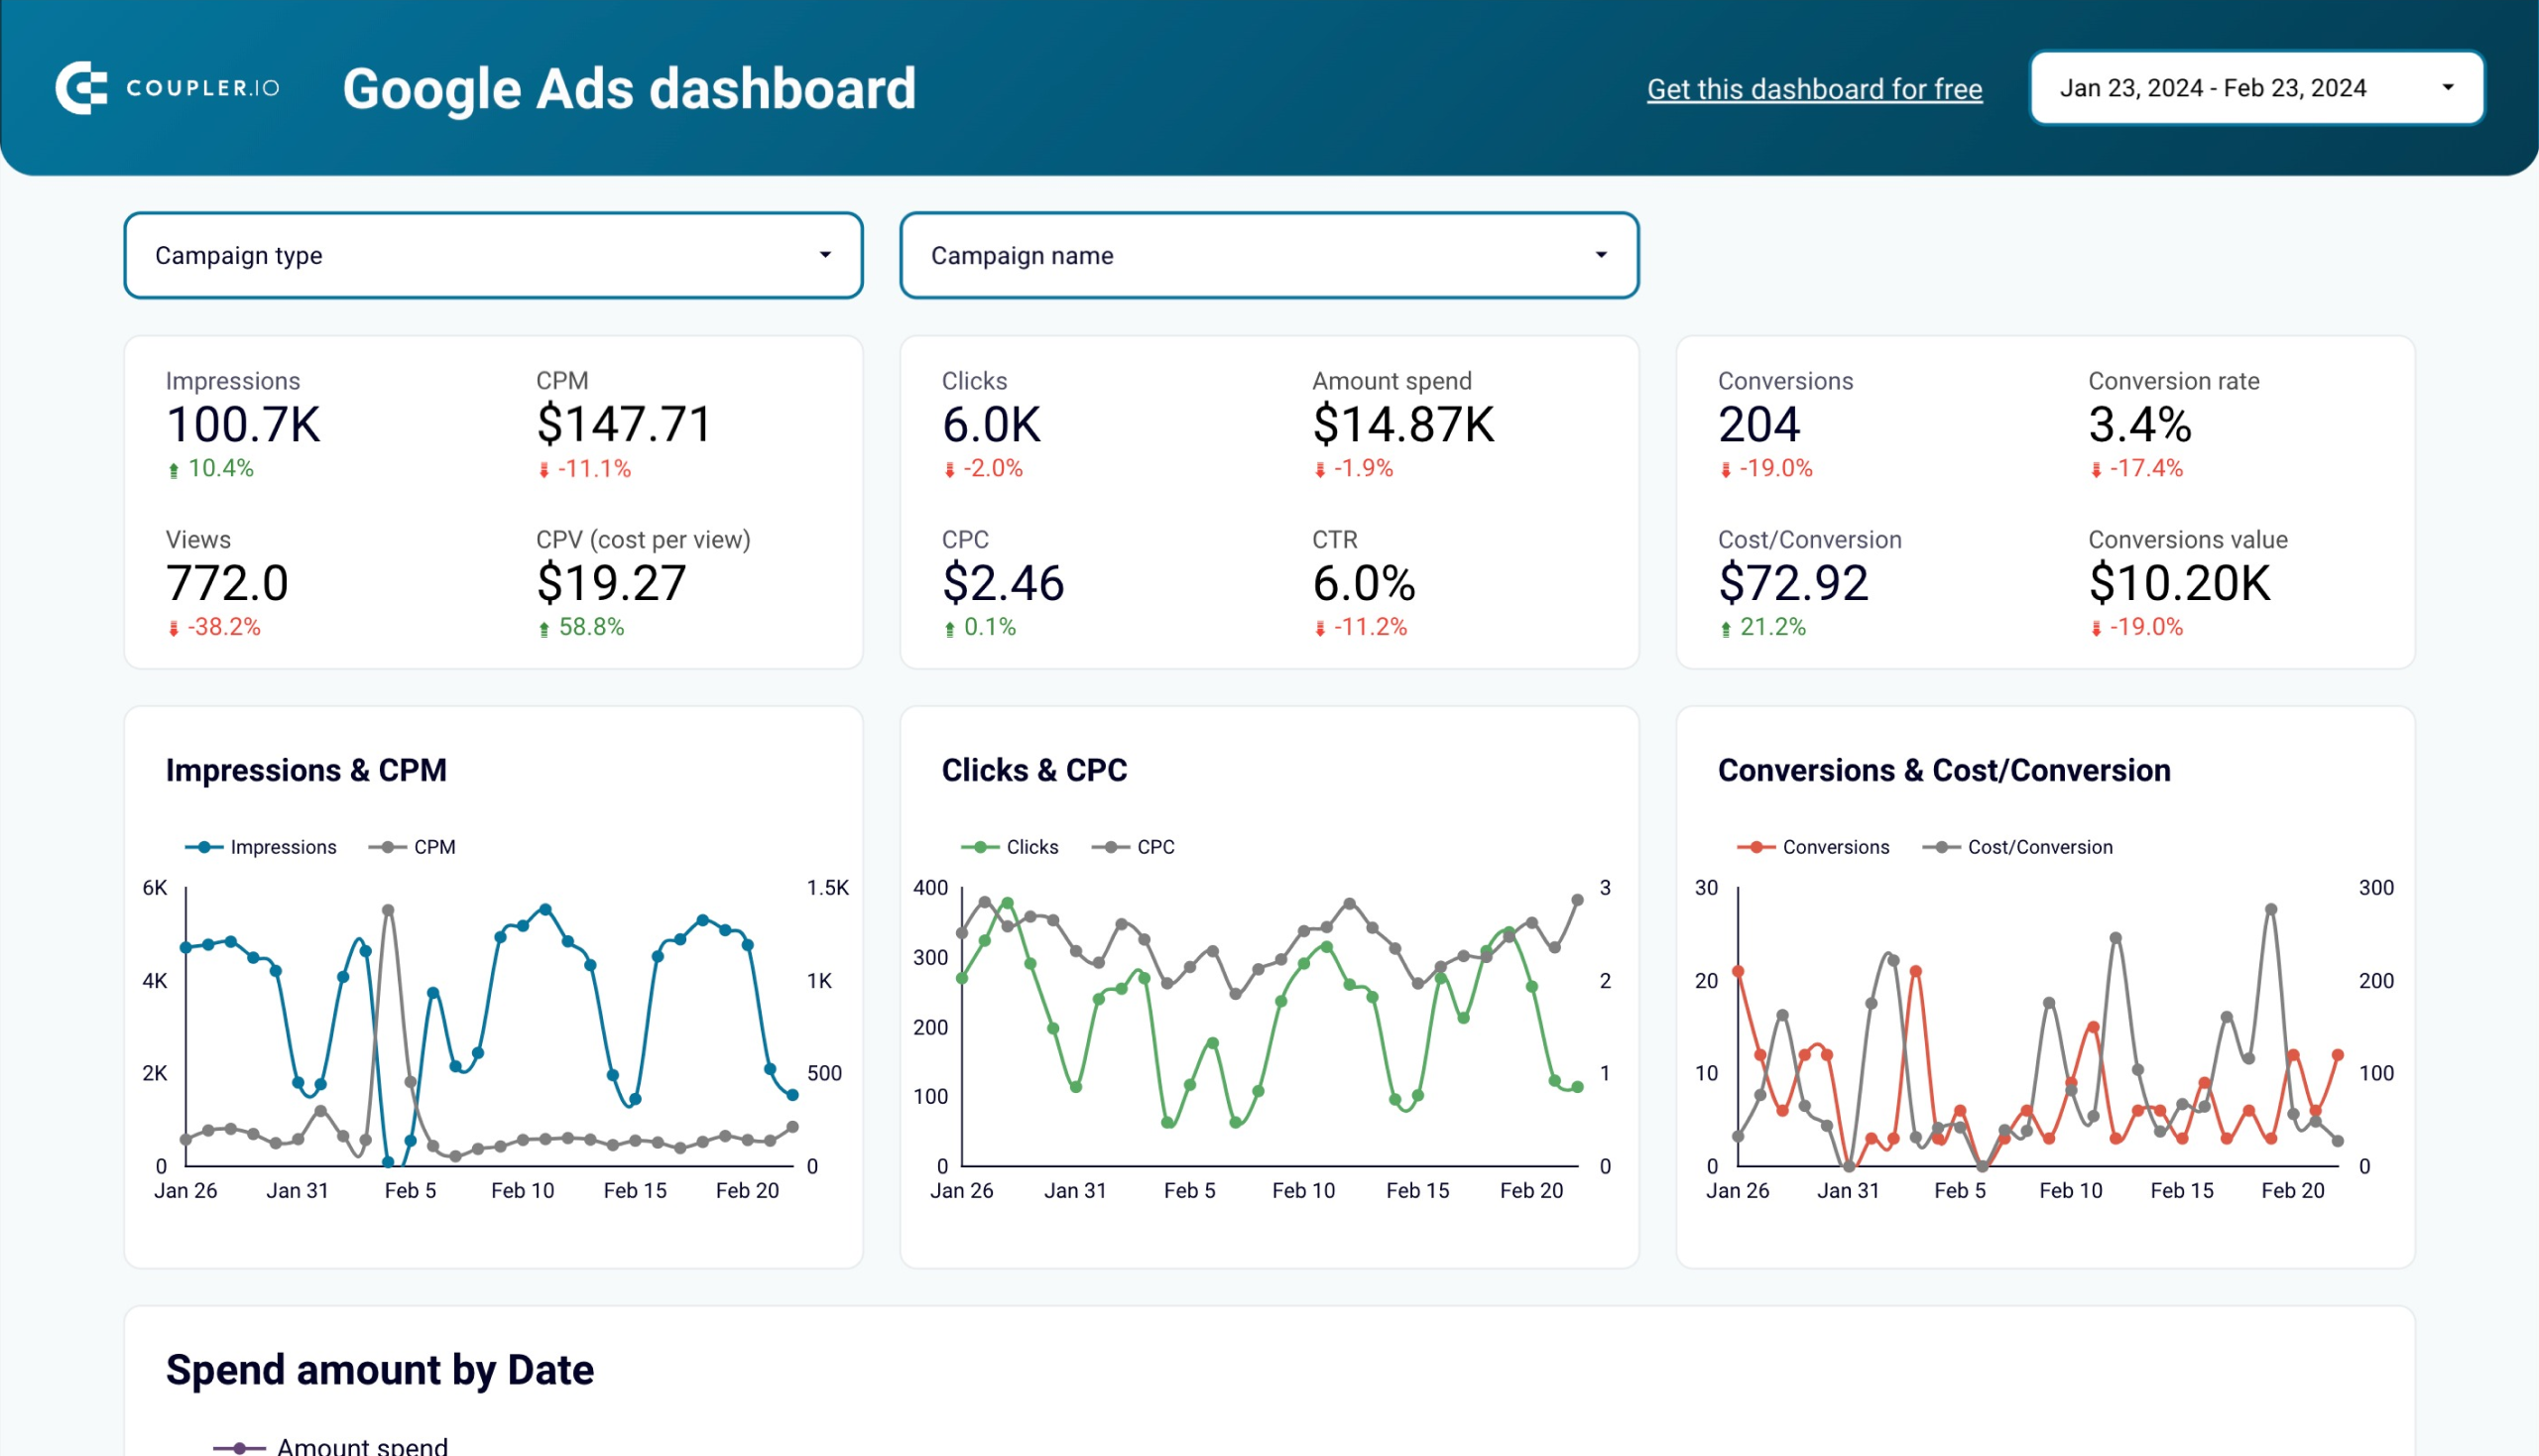
Google Ads dashboard
This dashboard provides a detailed overview of your Google Ads campaign performance and tracks the monthly dynamics of key metrics.

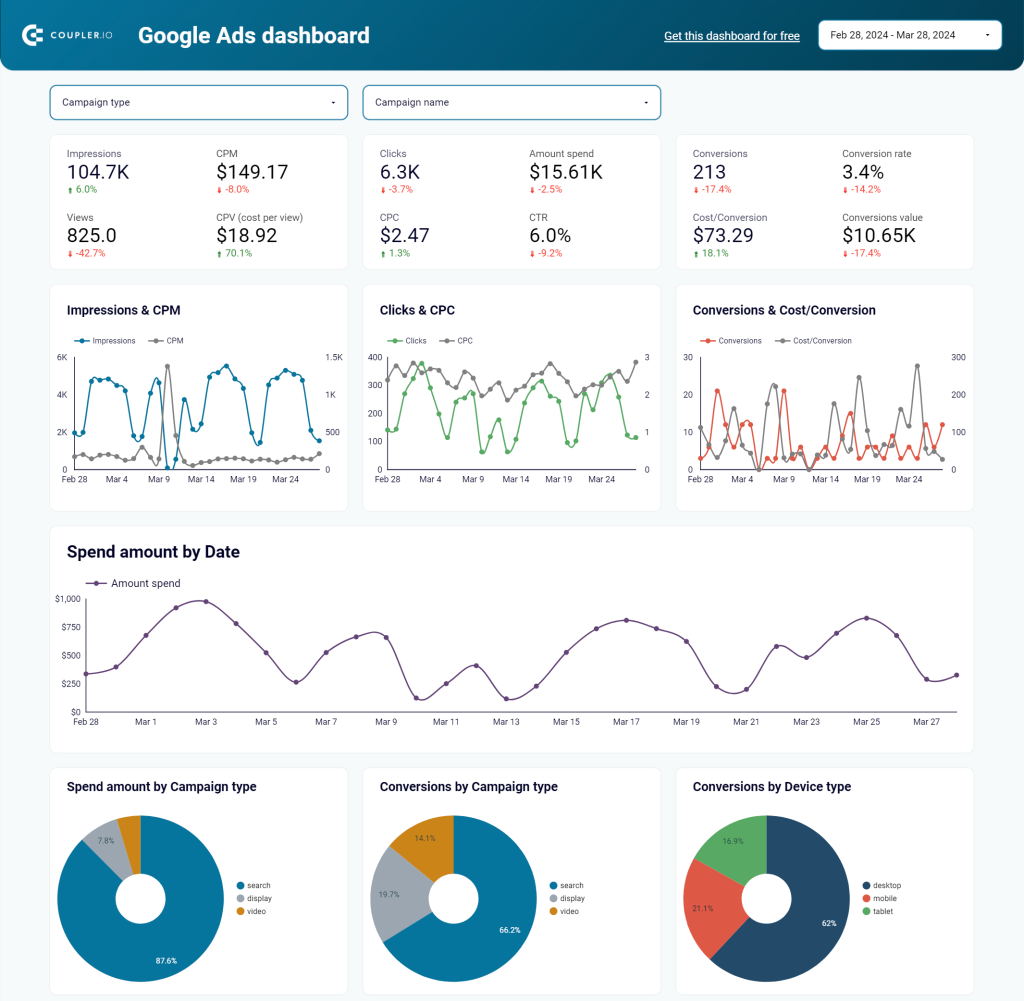
The dashboard offers the following data points:
- Monitor conversions: Look at conversion numbers by campaign type or device, get a list of top-performing campaigns based on convertibility, and explore a breakdown of the conversion actions you’ve set up.
- View performance from a timeline perspective: Analyze month-to-month data on metrics such as spend amount, impressions, clicks, cost per click, CTR, conversions, and cost per conversion.
- Check conversions based on demographics: See how your advertising converts audience across different regions, age groups, and genders.
The template is available for Looker Studio, Power BI, and Google Sheets. To track your ad performance with this dashboard, follow the setup instructions in the Readme tab and get your data visualized.

Google Ads dashboard in Google Sheets
Evaluate the performance of your PPC campaigns launched on Google and use these insights to optimize budgeting and conversion.

Google Ads dashboard in Looker Studio
Get a detailed overview of the performance of your Google ads advertising campaigns to achieve your marketing goals better.
Google Ads dashboard in Power BI
Overview the performance of your advertising campaigns in Google Ads and track monthly dynamics of key metrics.

Keyword performance dashboard in Looker Studio
The keyword performance dashboard in Looker Studio displays the performance of your Google Ads campaigns by specific keywords to identify which drives the most value.

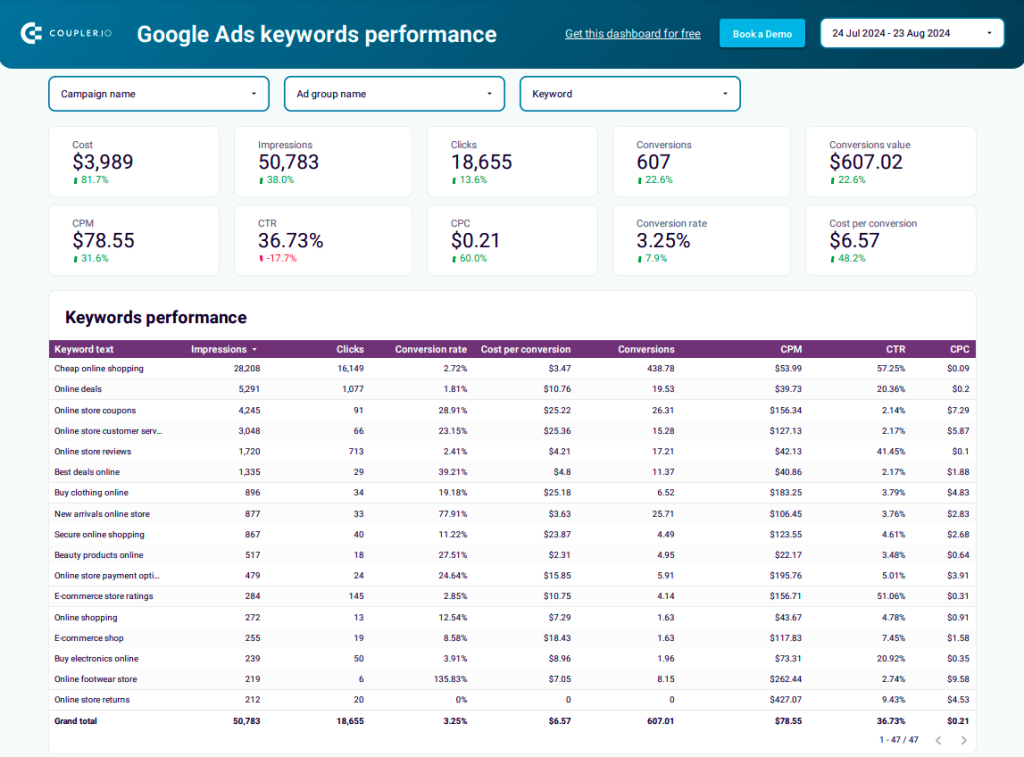
This dashboard reveals the following aspects of keyword performance:
- Keep updated on total and keyword-specific performance metrics: Access multiple data points in one place, such as impressions, cost per mille, clicks, click-through rate, CPC, conversion value, cost per conversion, total cost, and more.
- Spot seasonal trends in keyword performance: Monitor impressions, click-through rates, clicks, CPC, conversions, and cost per conversion month-to-month.
- Discover the most clickable keywords: Get a list of top-performing keywords based on clicks to understand which ones drive the highest engagement.
To begin using this dashboard, go to the Readme tab and follow the straightforward setup guide to fetch your Google Ads data into Looker Studio.
Google Ads creatives dashboard in Looker Studio
Google Ads creatives dashboard in Looker Studio shows the performance of your creatives, including impressions, clicks, and conversions. It enables you to evaluate which ads drive the best results.

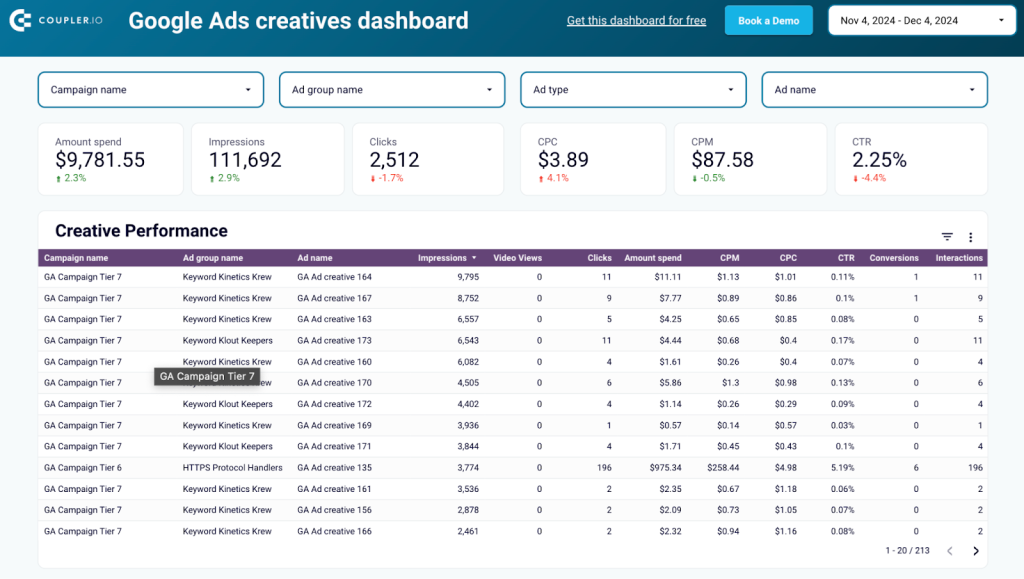
Here’s what you’ll learn using this dashboard:
- Review key performance metrics: Check the amount spent, impressions, video views, interactions, clicks, CPC, cost per mille, click-through rate, and conversions to evaluate the effectiveness of your ads.
- Track your numbers through a specific period: View impressions vs. cost per mille, clicks compared to CPC, and spending dynamics over time to identify seasonal trends in ad performance.
- Look at impressions by ad type: Identify which generates the most impressions: image ads, responsive search ads, responsive display ads, TrueView in-stream video ads, or expanded dynamic search ads.
To get started, follow the instructions in the Readme tab to install the Coupler.io connector, link your Google account, and visualize your ad data in the dashboard.
Quality score analytics dashboard in Looker Studio
This Looker Studio dashboard template lets you track the historical quality scores of your Google Ads campaigns to analyze changes over time and identify growth opportunities.

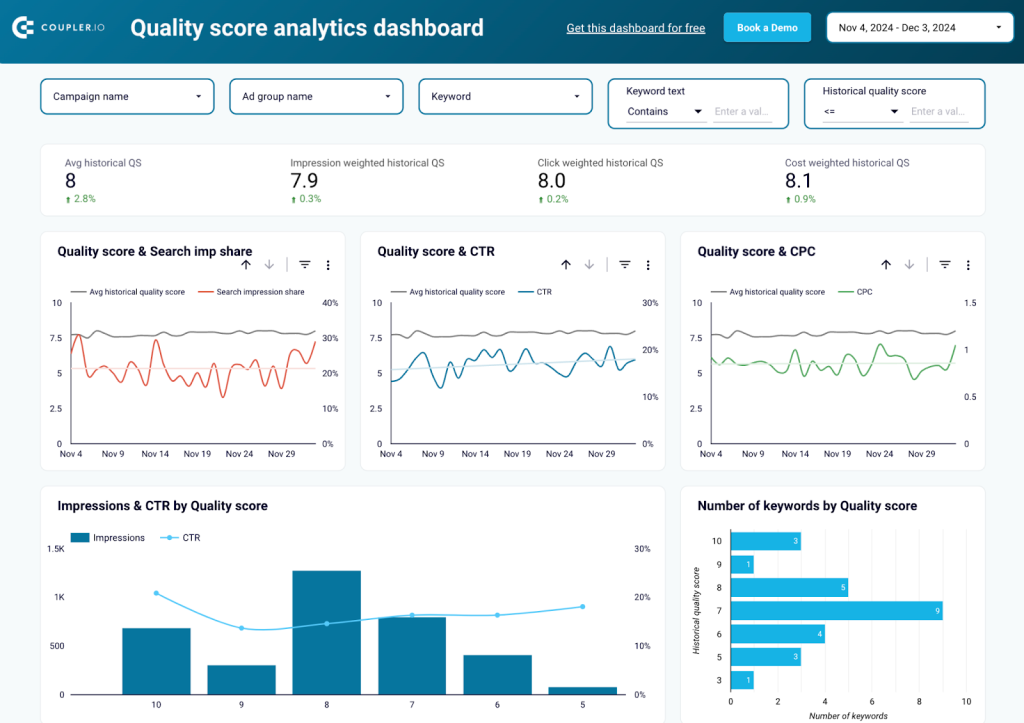
Using this dashboard, you’ll gain the following insights:
- Track quality score and related metrics over time: Compare average historical quality scores with search impressions, click-through rate, and CPC throughout the month.
- Explore data on specific types of historical quality scores: Review figures for impression-weighted, click-weighted, and cost-weighted quality scores, as well as landing page QS and creative QS.
- Analyze quality scores in the broader context of keyword performance: Check keyword-specific quality scores alongside metrics, including the amount spent, clicks, conversions, and cost per conversion across ad groups and campaigns.
Navigate to the Reame tab inside the template to set up the dashboard according to step-by-step instructions.
Google Search Ads performance tracker + editor in Google Sheets
This Google Sheets dashboard template allows you to review the performance of responsive search ads and make edits to them. This will help you ensure your campaigns are optimized and consistent across platforms.

To set up the dashboard, go to the template’s Readme tab and follow the instructions. Then, select the campaign or ad group for which you’ll modify existing ads or create new ones and act upon the short guide in the Ad edit tool tab.
Why connect Google Ads data to BigQuery
Below are key reasons to connect Google Ads to BigQuery for data analysis:
- Data-driven insights into ad performance: By analyzing data in BigQuery, you can identify which efforts bring the best results and shift your budget toward them. Moreover, you’ll be able to identify campaigns or specific ads that fall behind and stop them to save budget. Last but not least, this helps you learn what your customers look for and plan your business decisions for the future.
- Backup for your data: Maintain a backup copy of your Google Ads records in the BigQuery data warehouse. Once your data is loaded into the cloud and encrypted, it will be securely stored and readily accessible for future use. Your backup copy will also be automatically refreshed at your chosen frequency so it stays up to date.
- Cross-channel data view: Bring together data from different sources and see what insights emerge at the intersection. Combine records from Google Ads with data from other ad platforms, CRM systems like Pipedrive or HubSpot, Google Analytics, etc. This way, you’ll get the complete picture of your marketing activities.
- Machine learning-supported analytics: Thanks to BigQuery ML models, you can use the exported Google Ads data for forecasting, predicting sales, analyzing and segmenting your audience, and much more. BigQuery allows you to do all this using standard SQL queries.
Which option to choose to connect Google Ads to BigQuery
In this post, we reviewed a few ways to extract and load your Google Ads data to BigQuery. But what’s the best way to do it? Well, that always depends on your case study.
If you need to regularly get your Google Ads data to BigQuery, knowing that the data will be refreshed according to the specified schedule, use Coupler.io. In addition, this automation platform supports other data sources, such as Google Analytics 4, different CRM applications, and so on. So, you can have one solution to get data from different places into your data warehouse.
If you want to extract all your account(s) data and keep it up-to-date in real time, the Data Transfer service is the way to go.
If you are familiar with coding, Google Ads Scripts is your best friend. It allows you to choose which data you upload and gives you room to manipulate the data before loading them to BigQuery.
Finally, if you’re looking to export a specific report for one-time analysis, you can do so without connecting but simply choose the necessary report and upload it. For more on this topic, review our article about transferring data from Google Ads to JSON.
Choose wisely, and good luck with your data!
Automate Google Ads reporting with Coupler.io
Get started for free