

What are the options to pull data from Google Ads to Microsoft Excel
There are three ways to load your ad performance data to workbooks:
- Manual export as a CSV file. It’s a pretty straightforward method that works well for quick data sharing with stakeholders.
- Custom integration via the Google Ads API. This method lets connect Google Ads and Excel but requires a technical background.
- No-code Google Ads connector by Coupler.io. It allows you to automate data flow to your workbook using the Google Ads API but does not require any coding skills.
Since creating a custom API-based integration is for tech-savvy users, we won’t cover it in this article. At the same time, we’ll focus on two methods that marketers and PPC experts should find quite useful – Coupler.io and manual data export.
How to connect Google Ads to Excel with Coupler.io
Coupler.io is designed specifically for business users who may not have any tech background – such as marketers or sales professionals. It allows them to create reports of their data collected from over 60 cloud sources including advertising platforms, analytics tools, CRM apps, etc. To connect Google Ads to Excel, click Proceed in the form below where we’ve preselected Google Ads as a source app and Microsoft Excel as a destination app.

You’ll be offered to create a free Coupler.io account with no credit card required. Then, you need to complete three simple steps.
Step 1. Extract data from Google Ads
- Connect your Google Ads account and grant the requested permissions. This is necessary to transfer your data from Google Ads to Excel.
- After this, select an active ad account from where you want to extract data and choose a report type to export. With Coupler.io, you can export dozens of reports and data entities. They are grouped by category to simplify selection for all users. For example, you can choose a Campaign performance report to export from Google Ads to Excel.

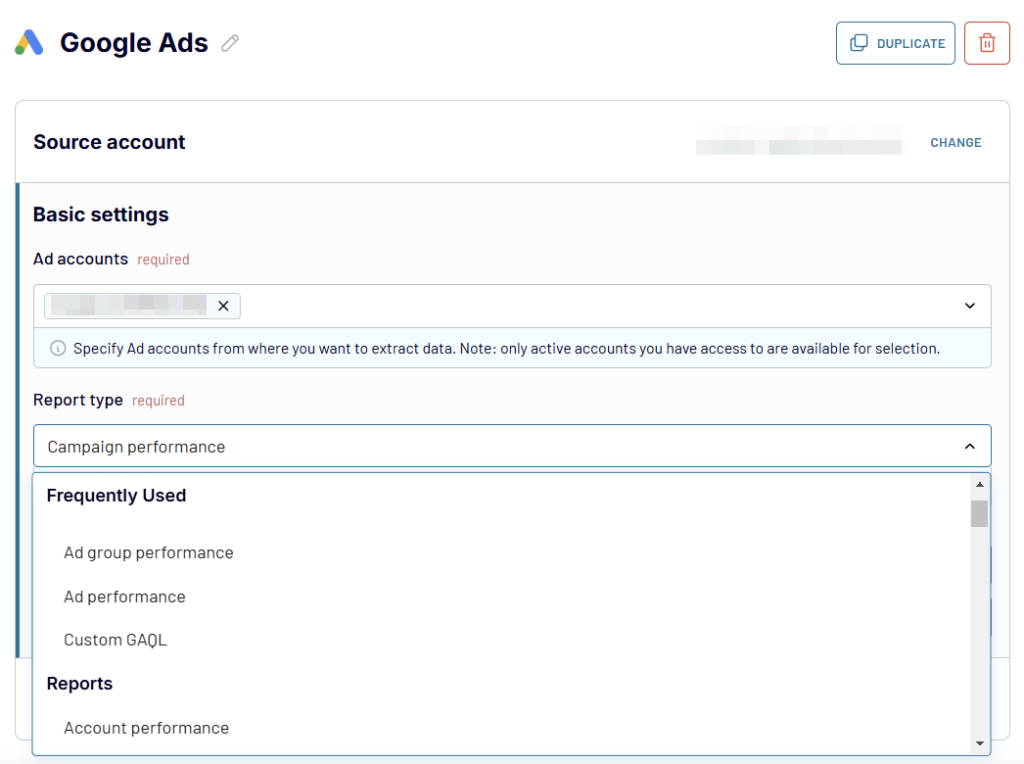
Optionally, you can specify the start/end dates for the data and the conversion window for your report. Oh, and you can also specify the periods to split your report data.
You can proceed to the Transformations step. It’s also worth mentioning that Coupler.io allows you to collect data from multiple sources. For instance, you can blend information from Google Ads with data from LinkedIn Ads, TikTok Ads, and so on. For this, select the needed app and configure the connection.

Step 2. Transform data before loading it to Excel
With Coupler.io, you can preview the data set from Google Ads before loading it into your Excel workbook. Moreover, you can perform some transformations namely:
- Hide, rename, and reorder columns, and change their data type.
- Create new columns using supported calculation formulas.
- Sort and filter data based on the selected criteria and specified values.
- Aggregate data for quick insights, such as the sum, average, or min/max of specific columns.
- Join data from other apps or Google Ads accounts to create a unified performance report.
- Merge datasets with similar columns and labels

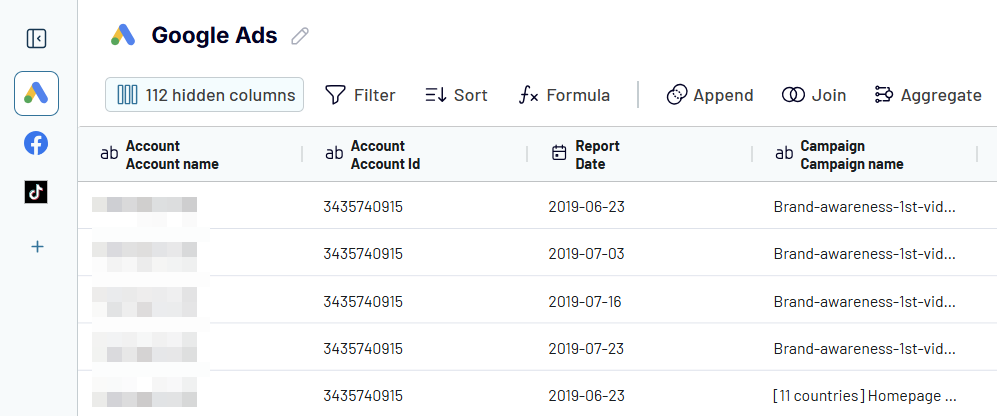
When you’re happy with the final result, move on to the last step: Destinations.
Step 3. Load data and schedule automated data refreshes
- Connect your Microsoft account. If you’re logged out, log in and grant the requested permissions.
- On your OneDrive, select a workbook and a worksheet where you want to transfer your Google Ads data. You can enter a worksheet name to create a new one.

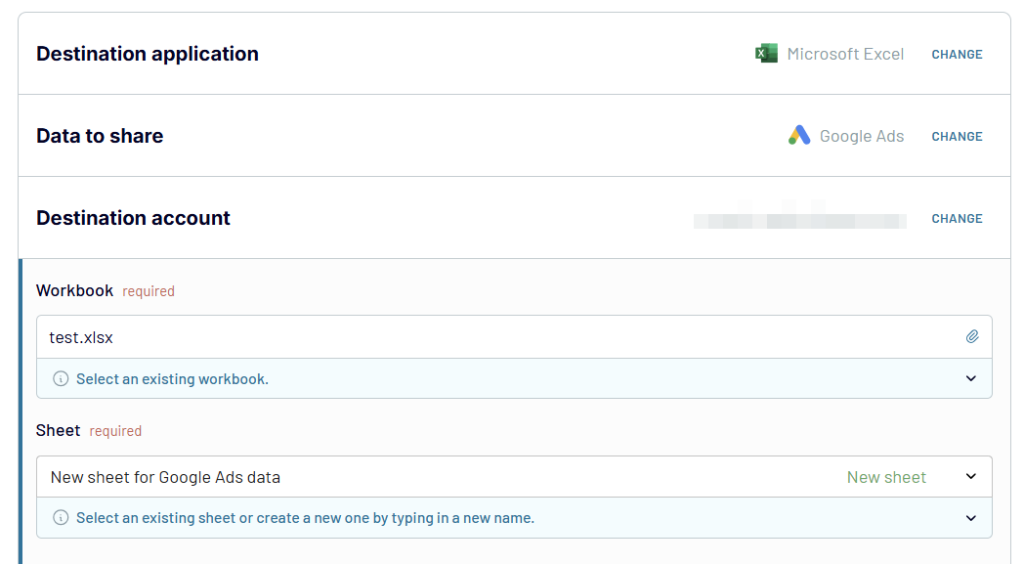
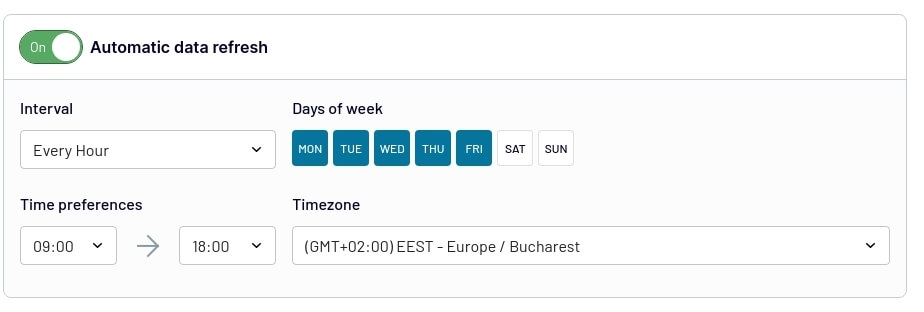
Once this is ready, you can set a schedule for the updates. Toggle on the Automatic data refresh feature, and select the preferred intervals and days when Coupler.io should refresh your Google Ads data in Excel.

Now, Coupler.io will automatically export your data from Google Ads to Excel according to the schedule you set. As you can see, the process is rather simple. You don’t need any tech background to set this integration, and all this can be done within just a few minutes.
Why connect Google Ads to Excel automatically
An automated connection between these two apps can be useful for many reasons. Here are some of the most common use cases.
- Monitoring custom metrics. If you export Google Ads to Excel automatically, you can set custom metrics in a spreadsheet and monitor them in real-time. When your Google Ads data in Excel is being constantly updated, your calculations stay up to date as well.
- Creating self-updating dashboards. Excel allows you to build rather complex graphs and dashboards with its native functionality. Add to this automation, and you’ll get self-updating dashboards that always show the latest information.
- Preparing custom reports. You can overcome the limitation of the native reporting features by exporting data from Google Ads to Excel. In a spreadsheet, you can build custom reports that only include the information you need, and present it exactly the way you want. Just like dashboards, with the right automation tool, these reports can be self-updating as well.
- Sharing data with stakeholders. Giving your Google Ads credentials to colleagues or clients is often not an option. By transferring data from Google Ads to Excel, you can give them access to the latest data by simply sharing a link to the workbook. This will help to keep everyone in the loop and improve collaboration. At the same time, this allows you to decide what to share (or not share) with each stakeholder.
- Maintaining a backup copy. Another reason to connect Google Ads to Excel is to back up your data. If you use an automated solution for this, you get a self-updating backup file in Excel. So, you don’t need to update it manually, and even better, you don’t even need to remember about this task at all. Everything will be done without your involvement.
Bonus: Turn Google Ads data into insights with dashboard templates by Coupler.io
Raw Google Ads data can be overwhelming and difficult to analyze. While you can create custom reports from scratch, Coupler.io offers ready-to-use dashboard templates specifically designed for Google Ads analysis.
Unfortunately, these templates are not for Excel. Most of them are available in Coupler.io, Looker Studio, Google Sheets, and other tools. At the same time, the templates can be very useful since they let you get instant insights into the performance of your Google Ads campaigns. Let’s explore the most actionable dashboards.
Turn Google Ads data into insights with dashboard templates
The raw data does not look fancy, right? To fix this, you can either turn it into a custom report or opt for a ready-to-use dashboard by Coupler.io. The latter offers options designed for Google Ads, as well as more advanced PPC reporting solutions. For instance, you can consolidate Google Ads with the records taken from other apps, such as Facebook Ads or LinkedIn Ads in a single view. Let’s explore what you can consider.
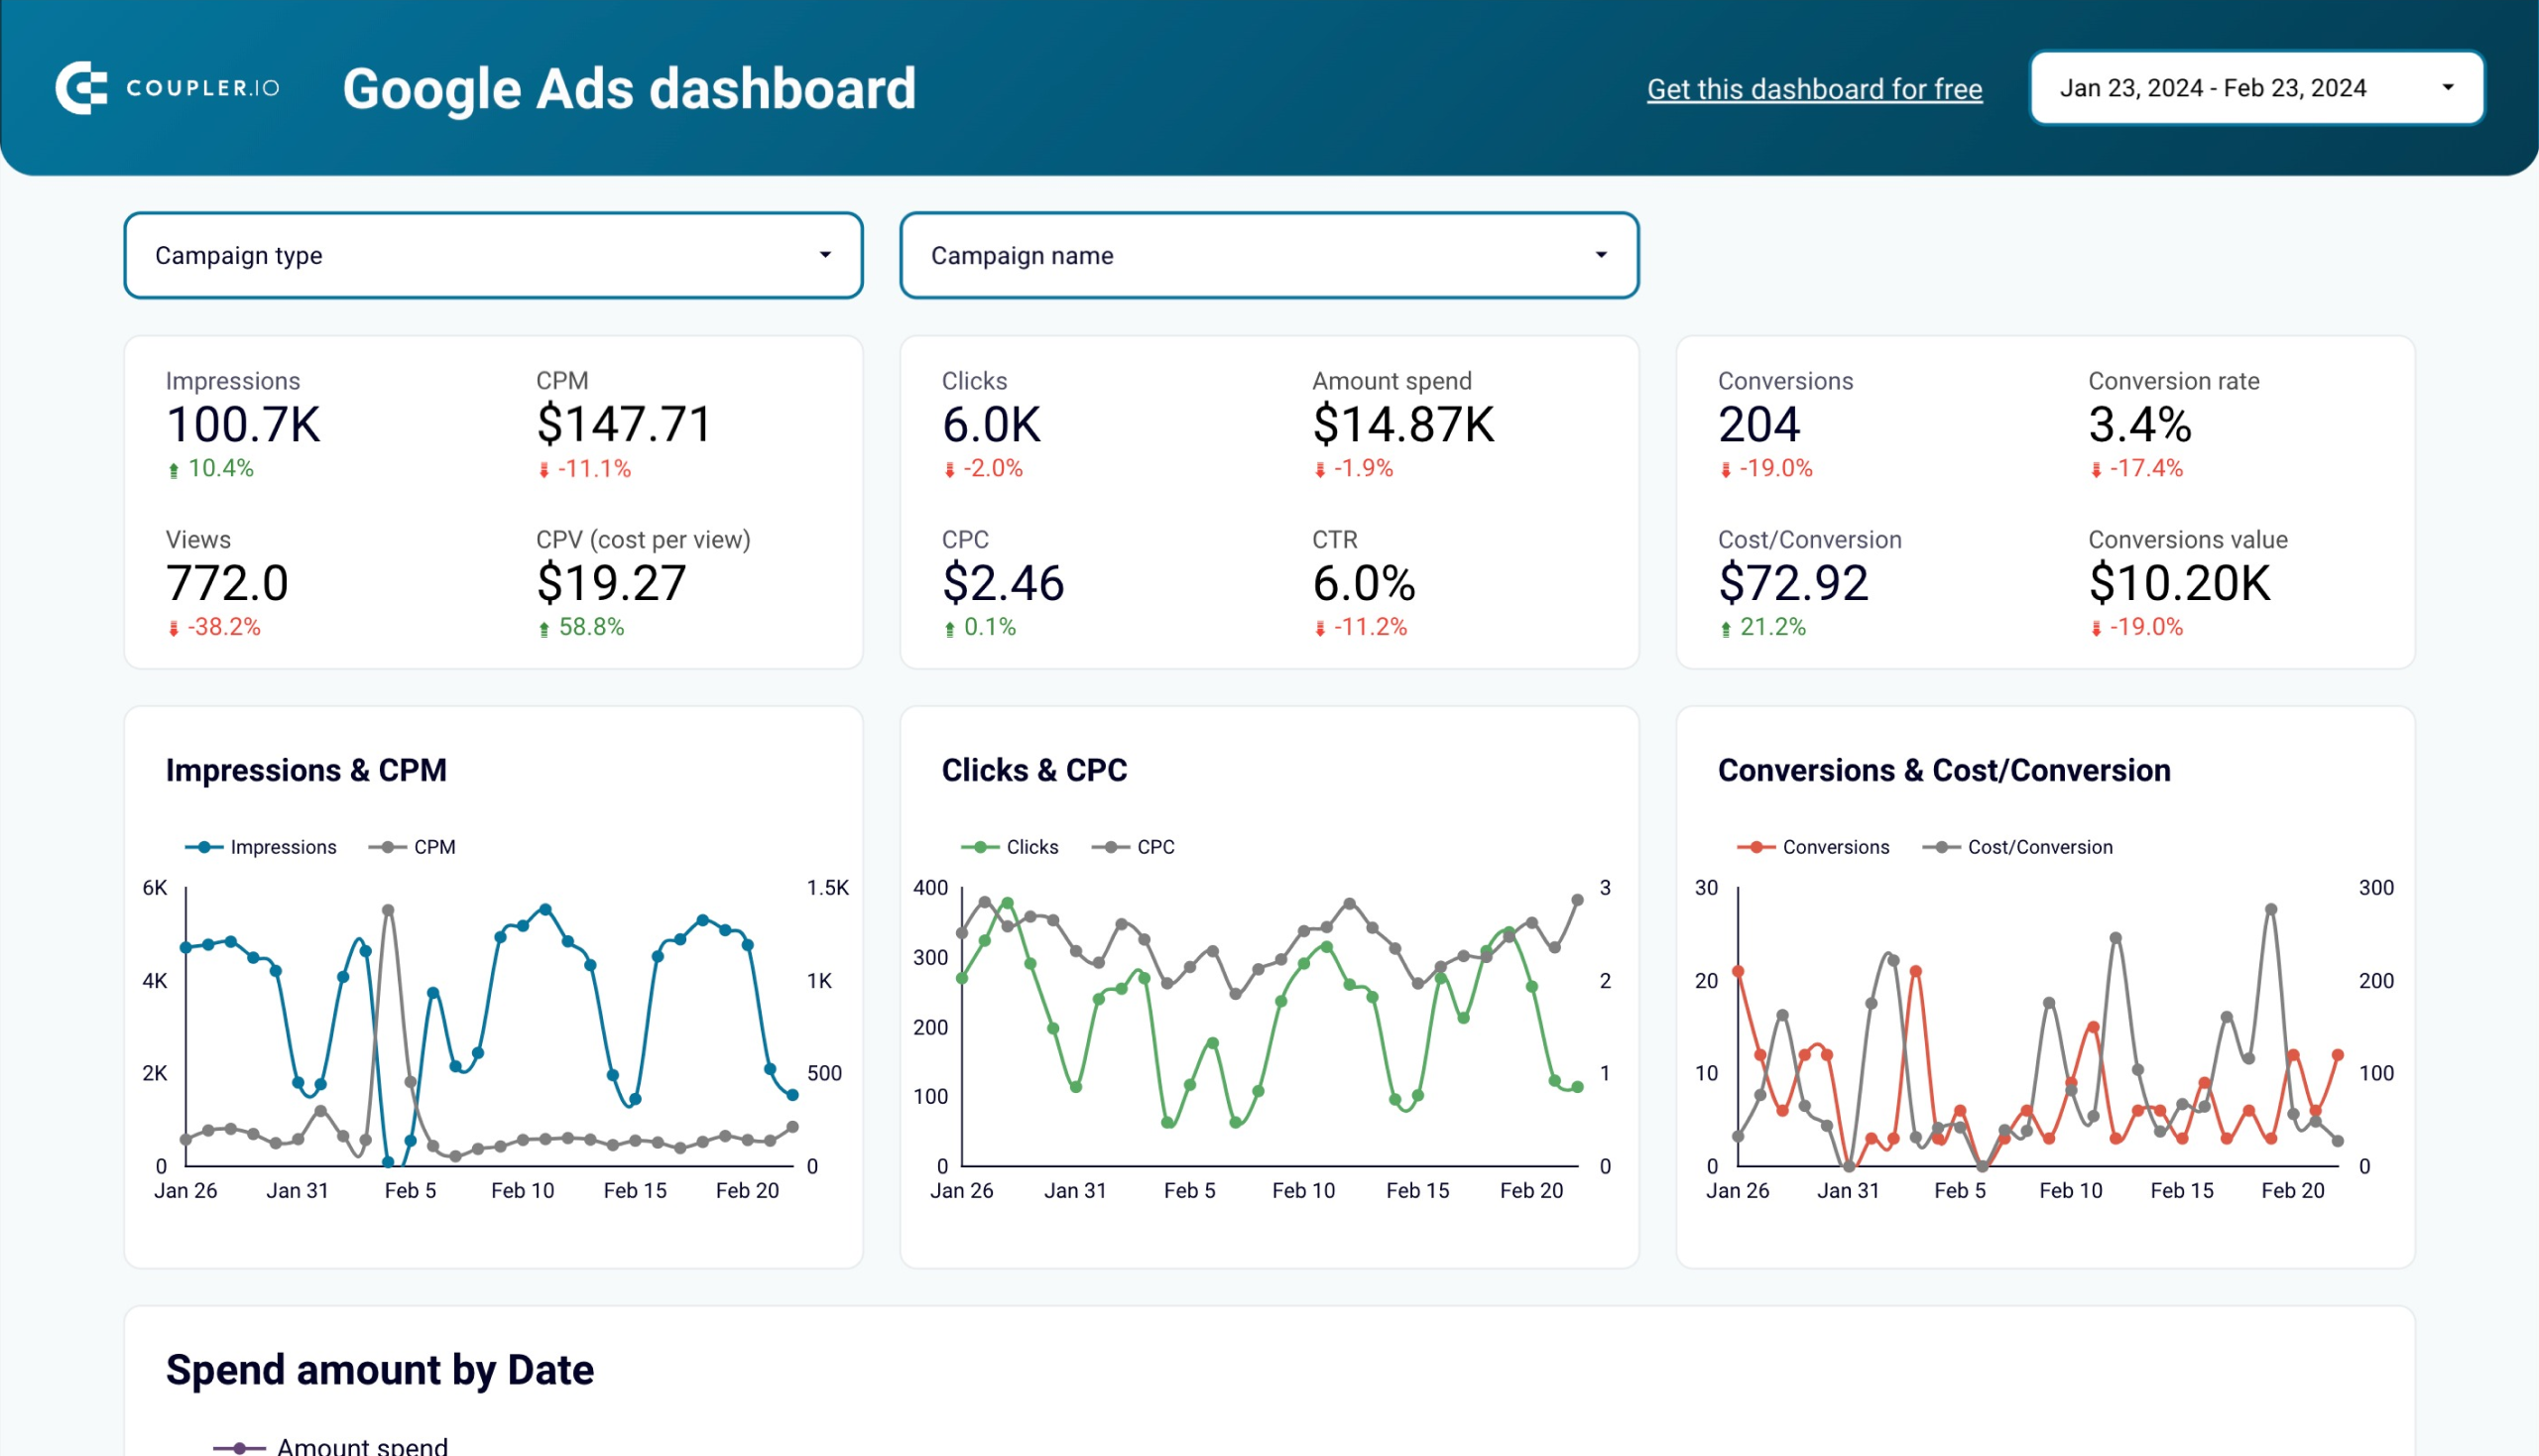
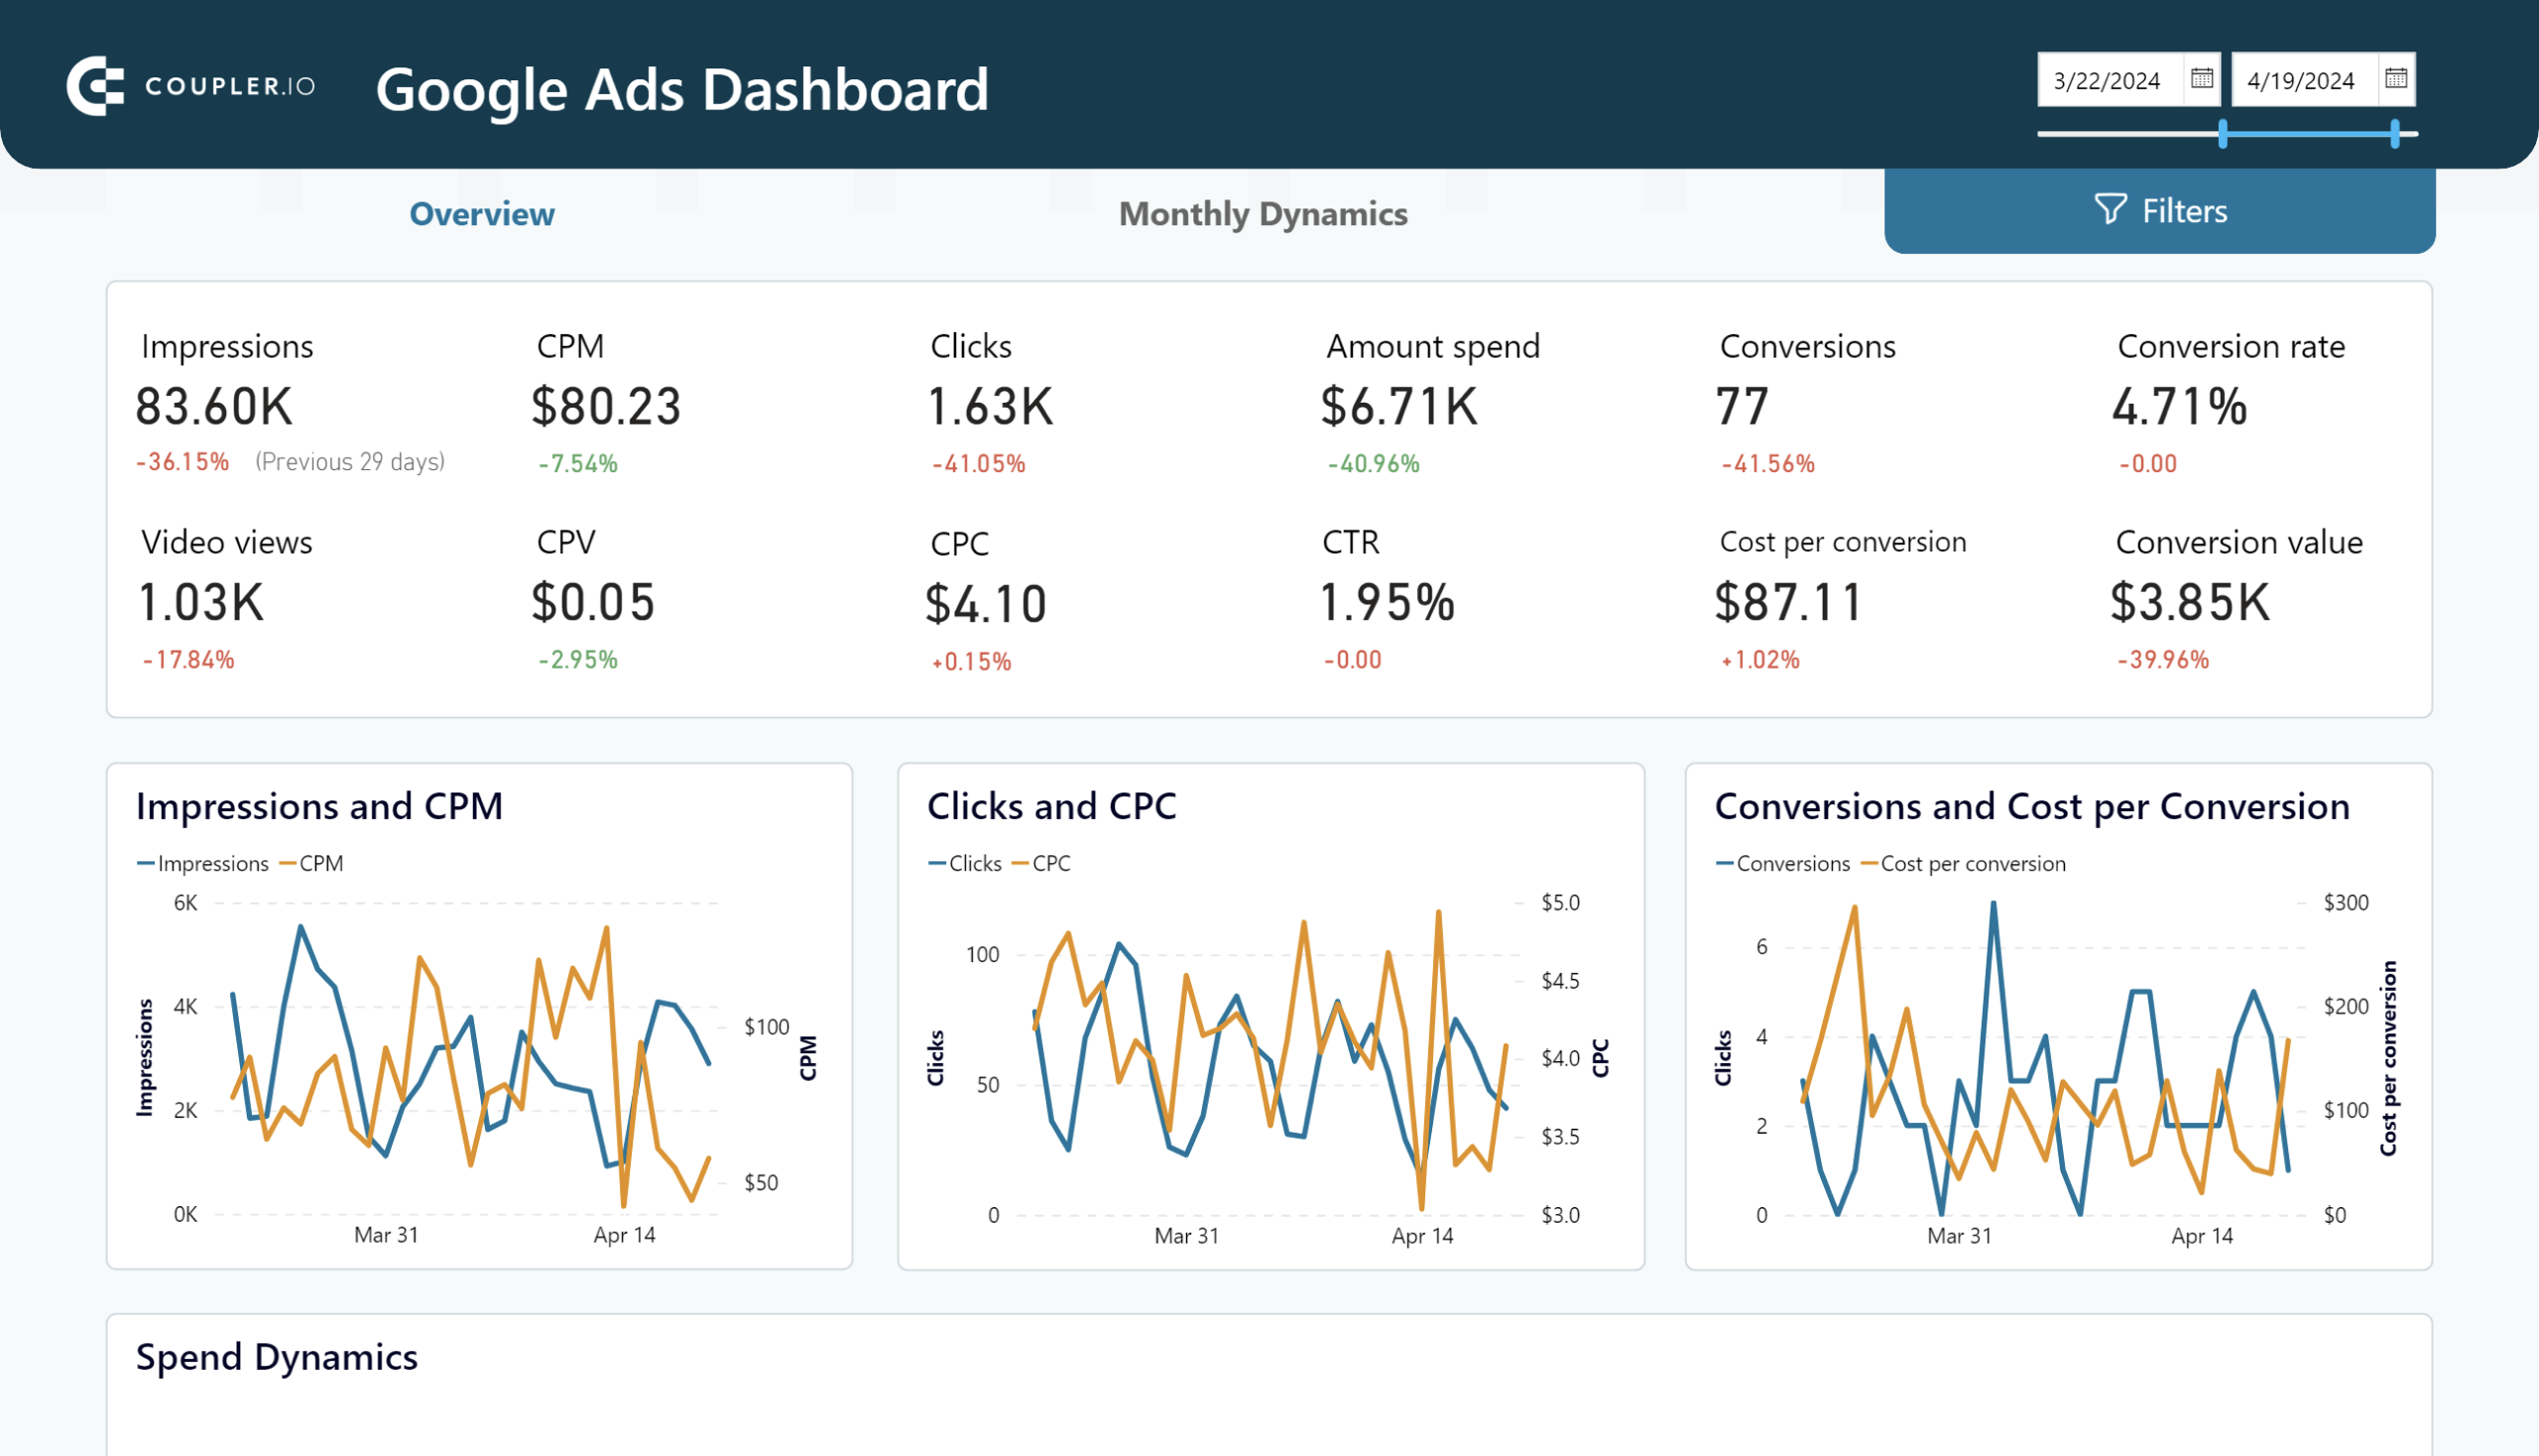
Google Ads dashboard
This dashboard delivers instant visibility into your advertising performance on Google through essential metrics and dynamic tracking. It visualizes campaign trends over time and provides detailed device-level performance breakdowns.

With easy-to-use campaign type and name filters, you can drill down into specific segments of your advertising data for deeper analysis. The template connects seamlessly to your Google Ads account through Coupler.io, automatically populating your dashboard with fresh data.
The dashboard is also available as a template in Google Sheets, Looker Studio, and Power BI. Choose the version relevant to your needs and try it for free.

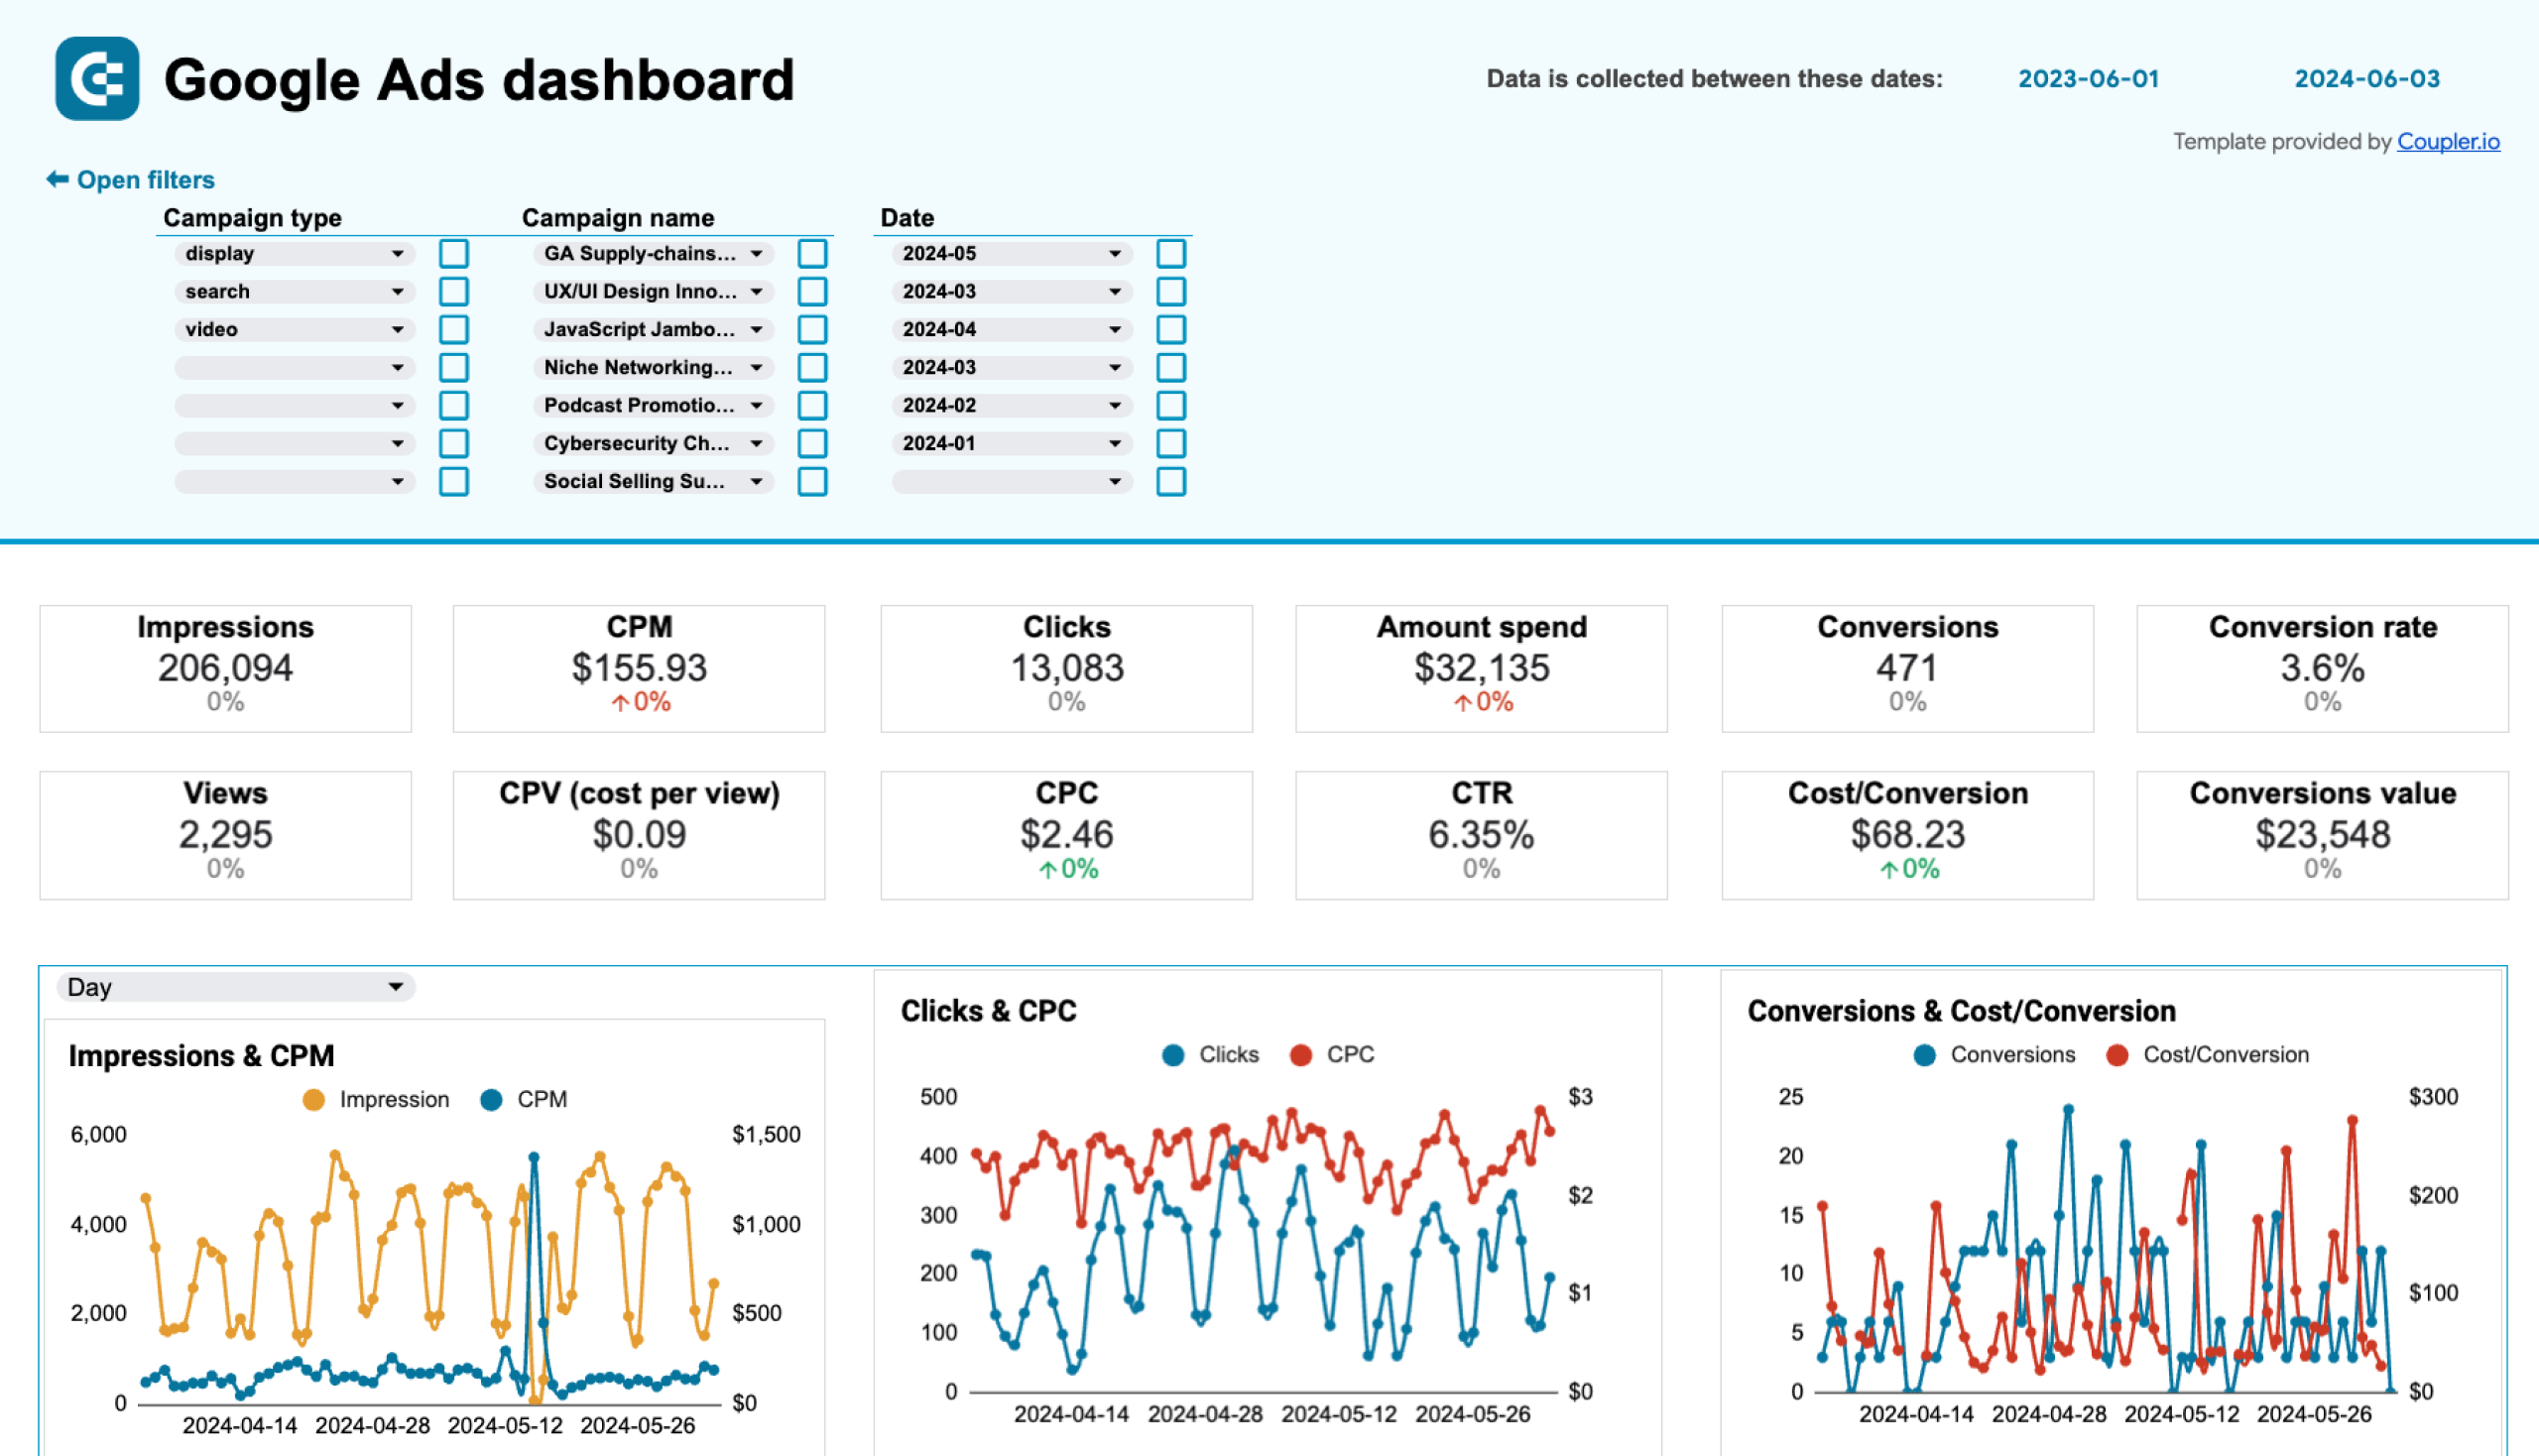
Google Ads dashboard in Google Sheets
Evaluate the performance of your PPC campaigns launched on Google and use these insights to optimize budgeting and conversion.

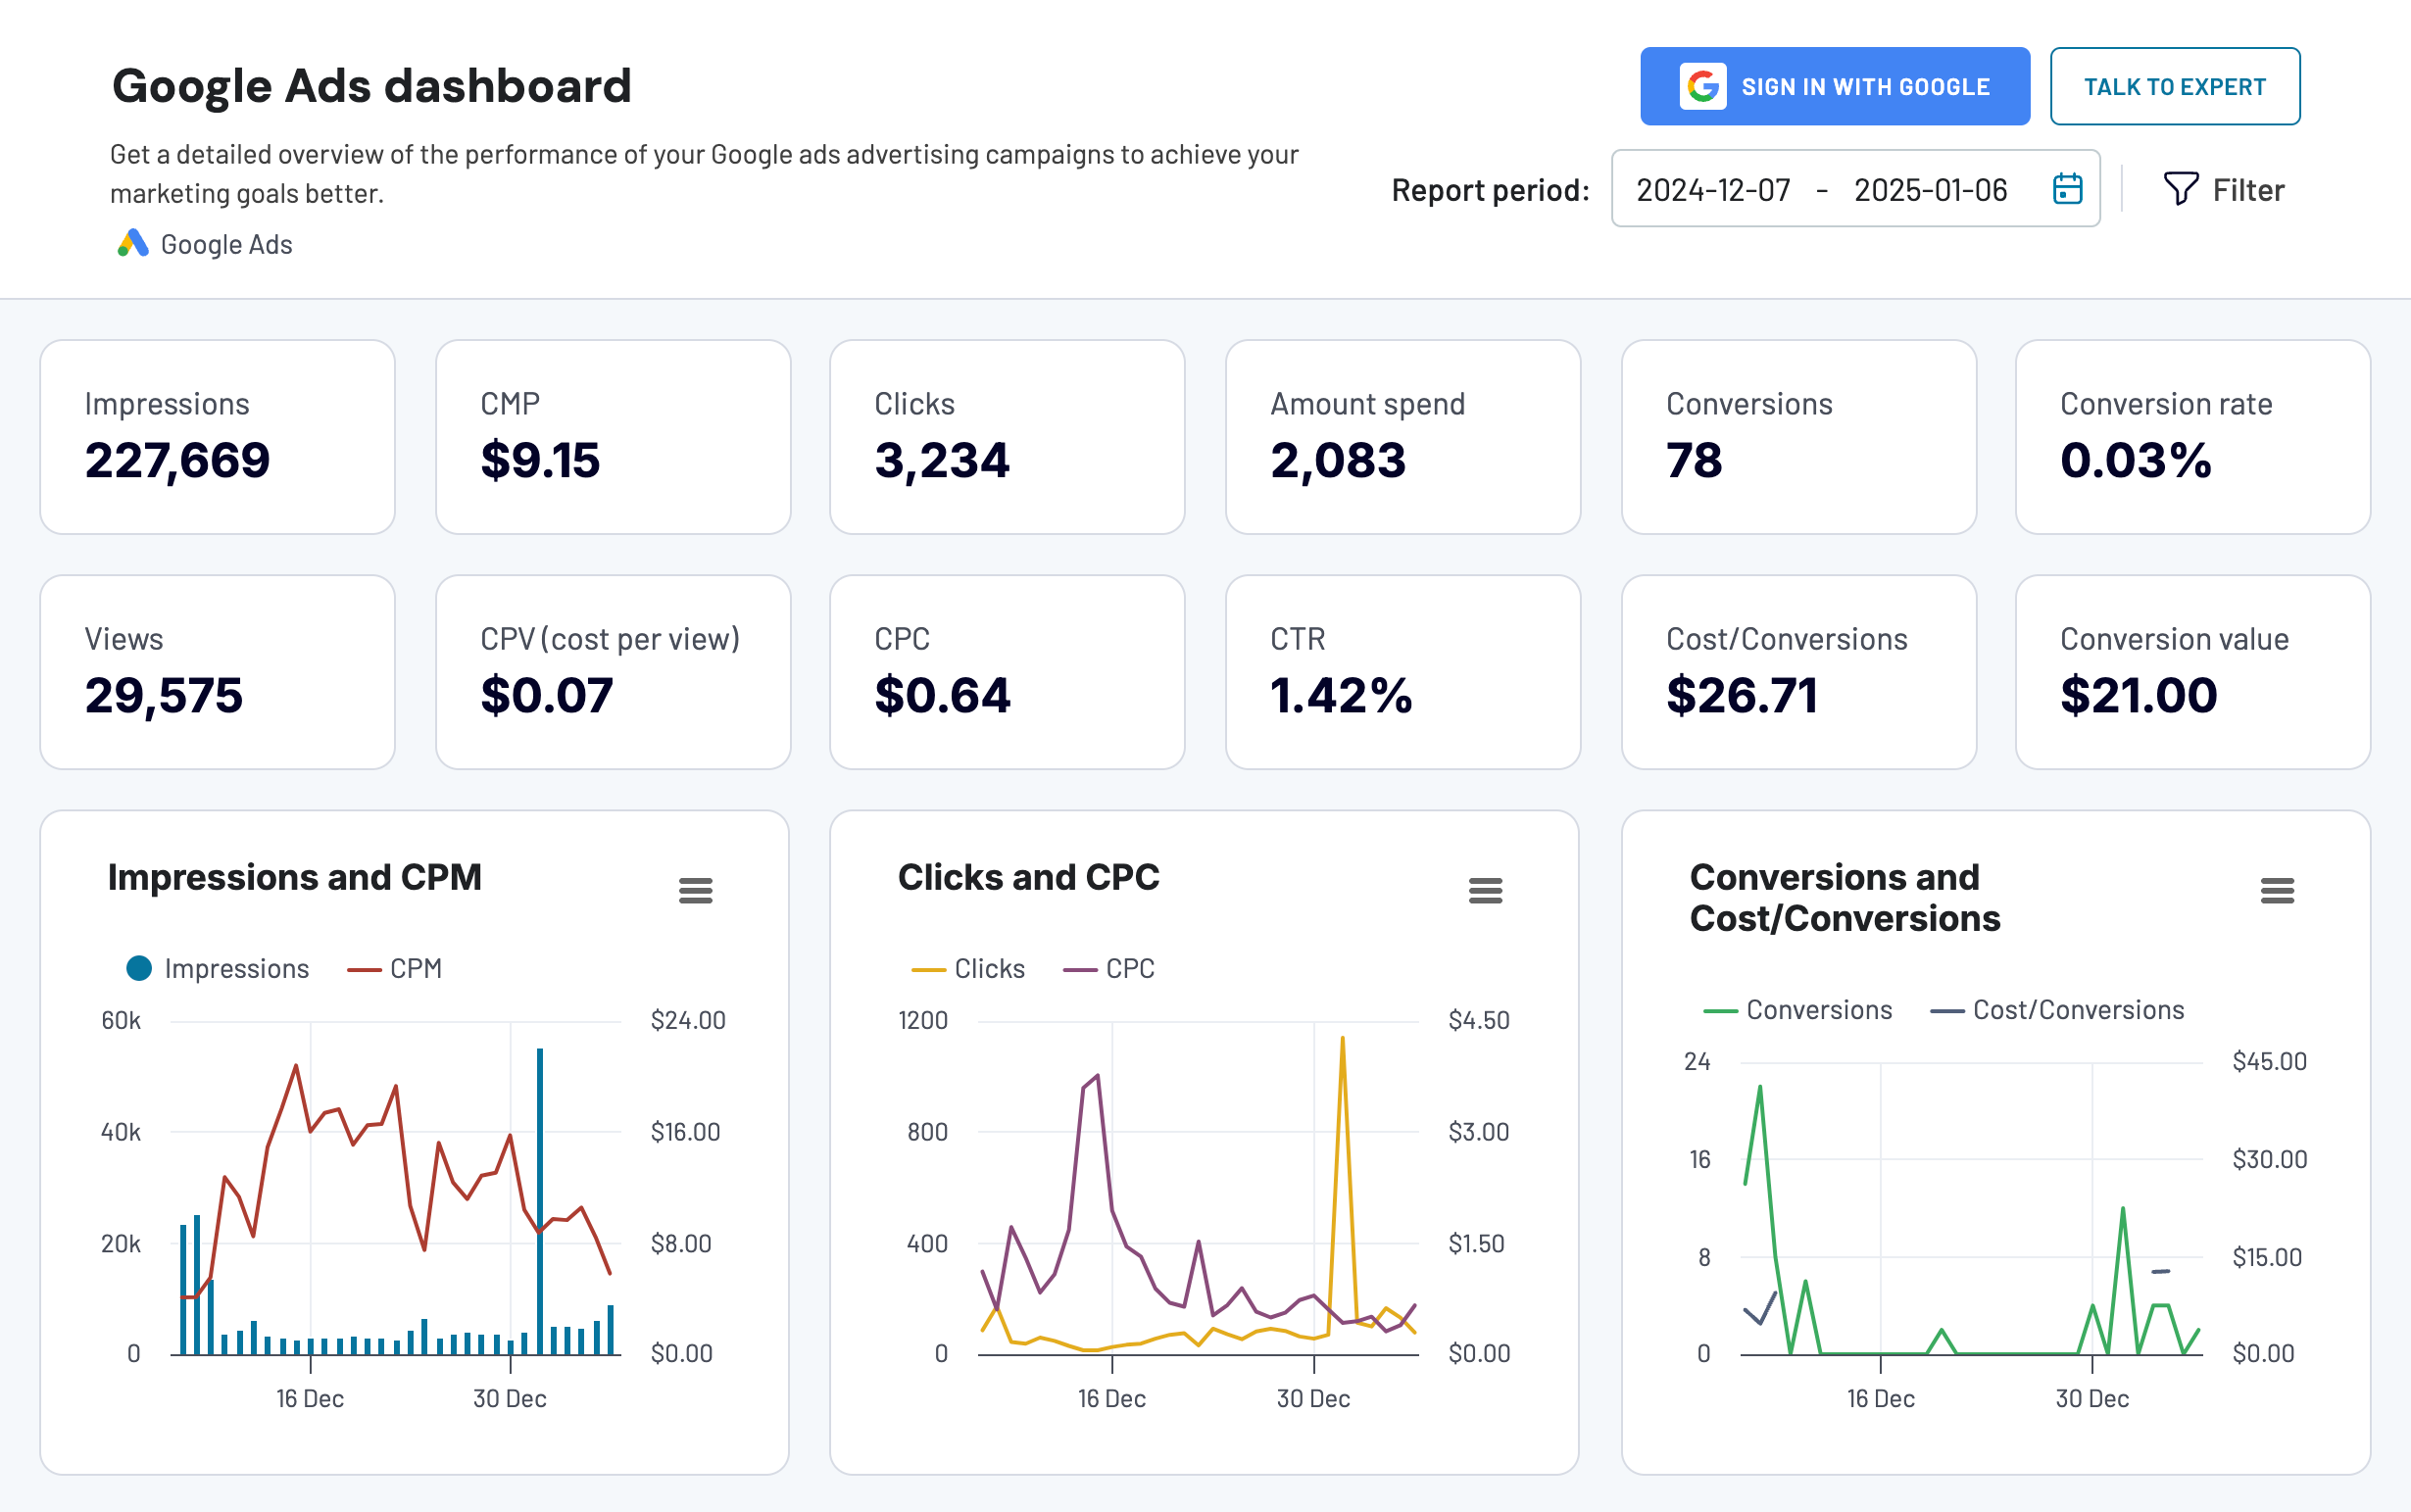
Google Ads dashboard in Looker Studio
Get a detailed overview of the performance of your Google ads advertising campaigns to achieve your marketing goals better.
Google Ads dashboard in Power BI
Overview the performance of your advertising campaigns in Google Ads and track monthly dynamics of key metrics.

Google Ads keyword performance dashboard in Looker Studio
This specialized dashboard focuses on keyword-level analysis. It helps you optimize your search advertising strategy on Google.

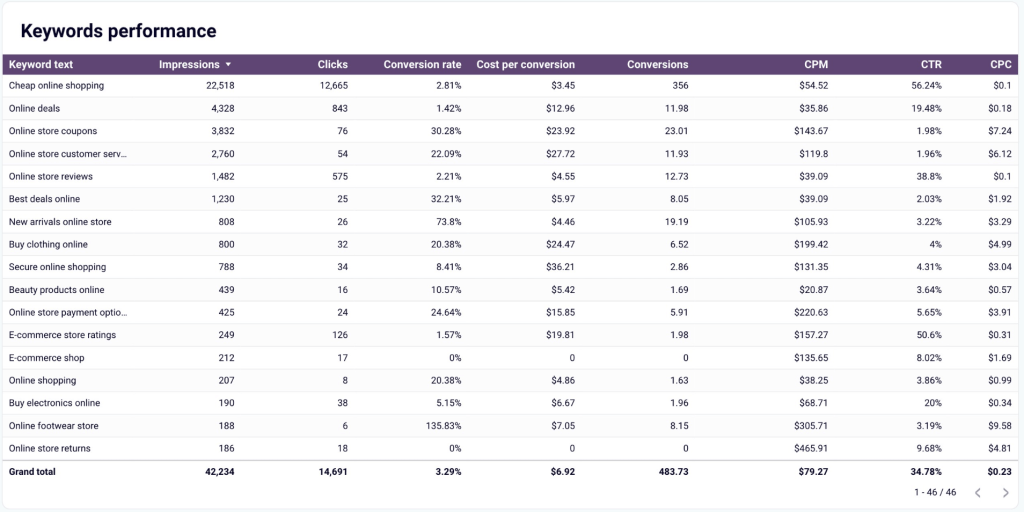
With this Google Ads dashboard, you can identify your top-performing keywords and pages based on clicks and impressions, while providing historical performance comparisons. The search impression share analysis offers valuable insights into your ads’ visibility in the search results.
The dashboard template is built in Looker Studio, therefore it offers powerful visualization capabilities. You can use it to make data-driven decisions about your keyword strategy.
Google Search Ads performance tracker + editor dashboard in Google Sheets
This dual-purpose template combines performance tracking with campaign management capabilities. Beyond monitoring standard metrics like impressions and spend, it provides an interface for modifying existing ads or creating new ones directly in Google Sheets.

Follow the instructions on the Readme tab to get started with this Google Ads dashboard. Simply connect your Google Ads account through your free Coupler.io account to begin tracking and managing your campaigns.
Google Ads creatives dashboard in Looker Studio
Transform your creative performance data into actionable insights with this specialized Google Ads dashboard. It provides a detailed analysis of creative performance across key metrics including impressions, clicks, and CTR.

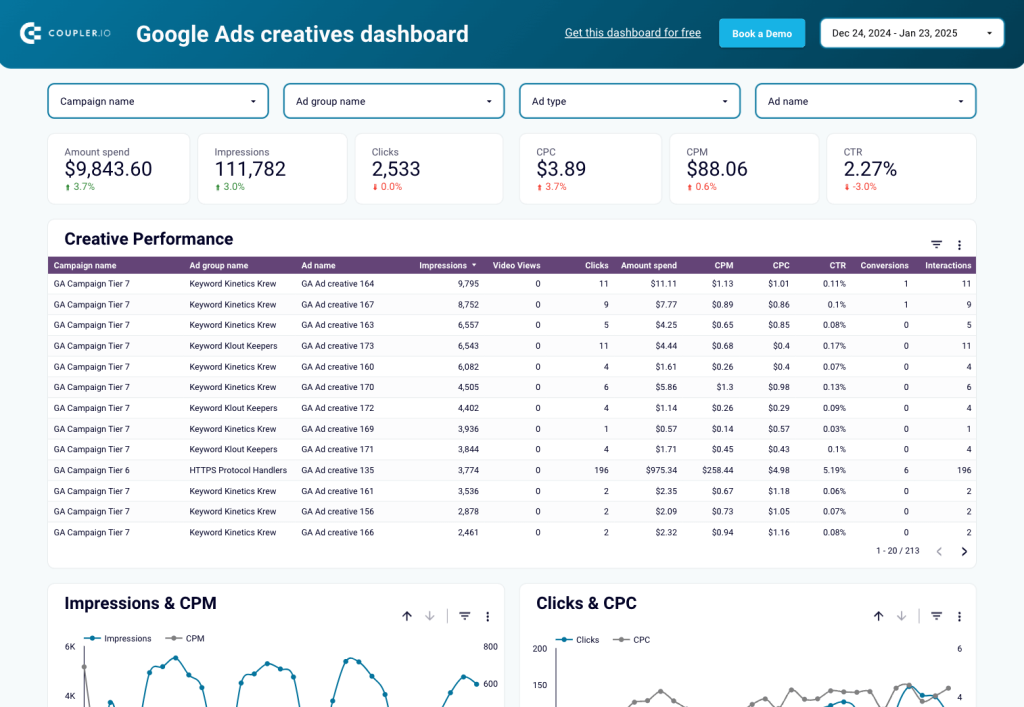
The dashboard helps you identify optimization opportunities through trend analysis and audience engagement patterns. With built-in budget monitoring and cost efficiency comparisons (CPM vs CPC), it ensures your creative strategy aligns with campaign goals and financial targets.
The template is designed in Looker Studio and allows you to set it up in less than 5 minutes with a free Coupler.io account.
Google Ads quality score analytics dashboard in Looker Studio
This analytical dashboard focuses on tracking and improving your quality score performance. It enables deep analysis of quality score trends against key performance indicators, with flexible filtering by campaign, ad group, keyword, and time period.

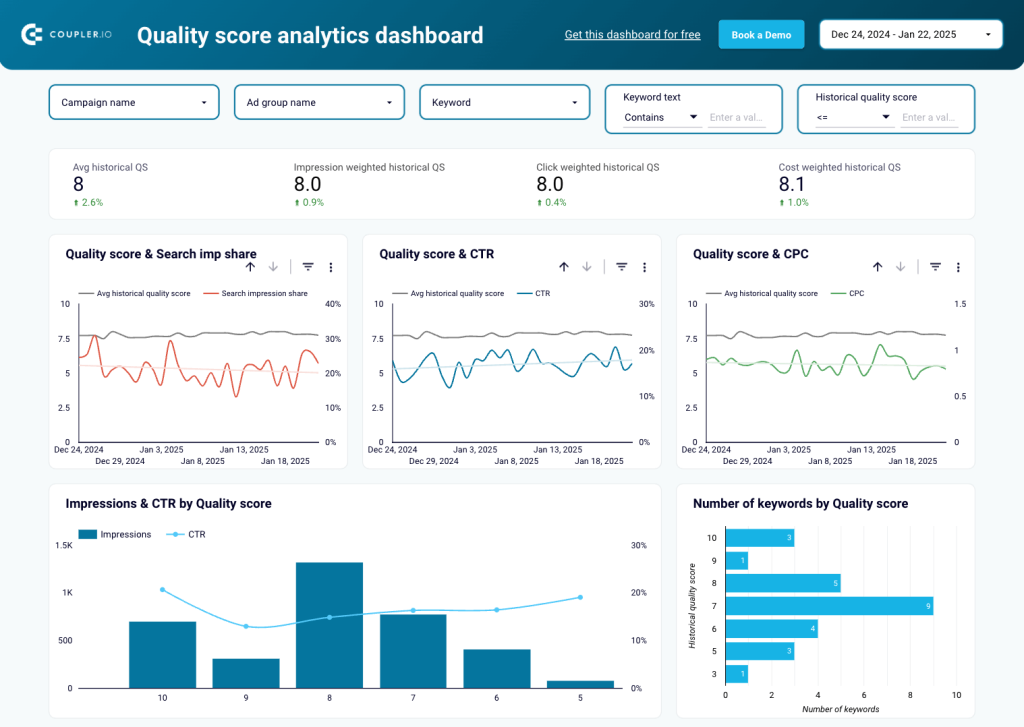
The Google Ads dashboard lets you identify correlations between quality score and metrics like search impressions, CTR, or CPC. It also provides both weighted and historical score analysis to help optimize your campaign quality.
Try this dashboard for free in Looker Studio. It only takes a few minutes to connect your data and get started.
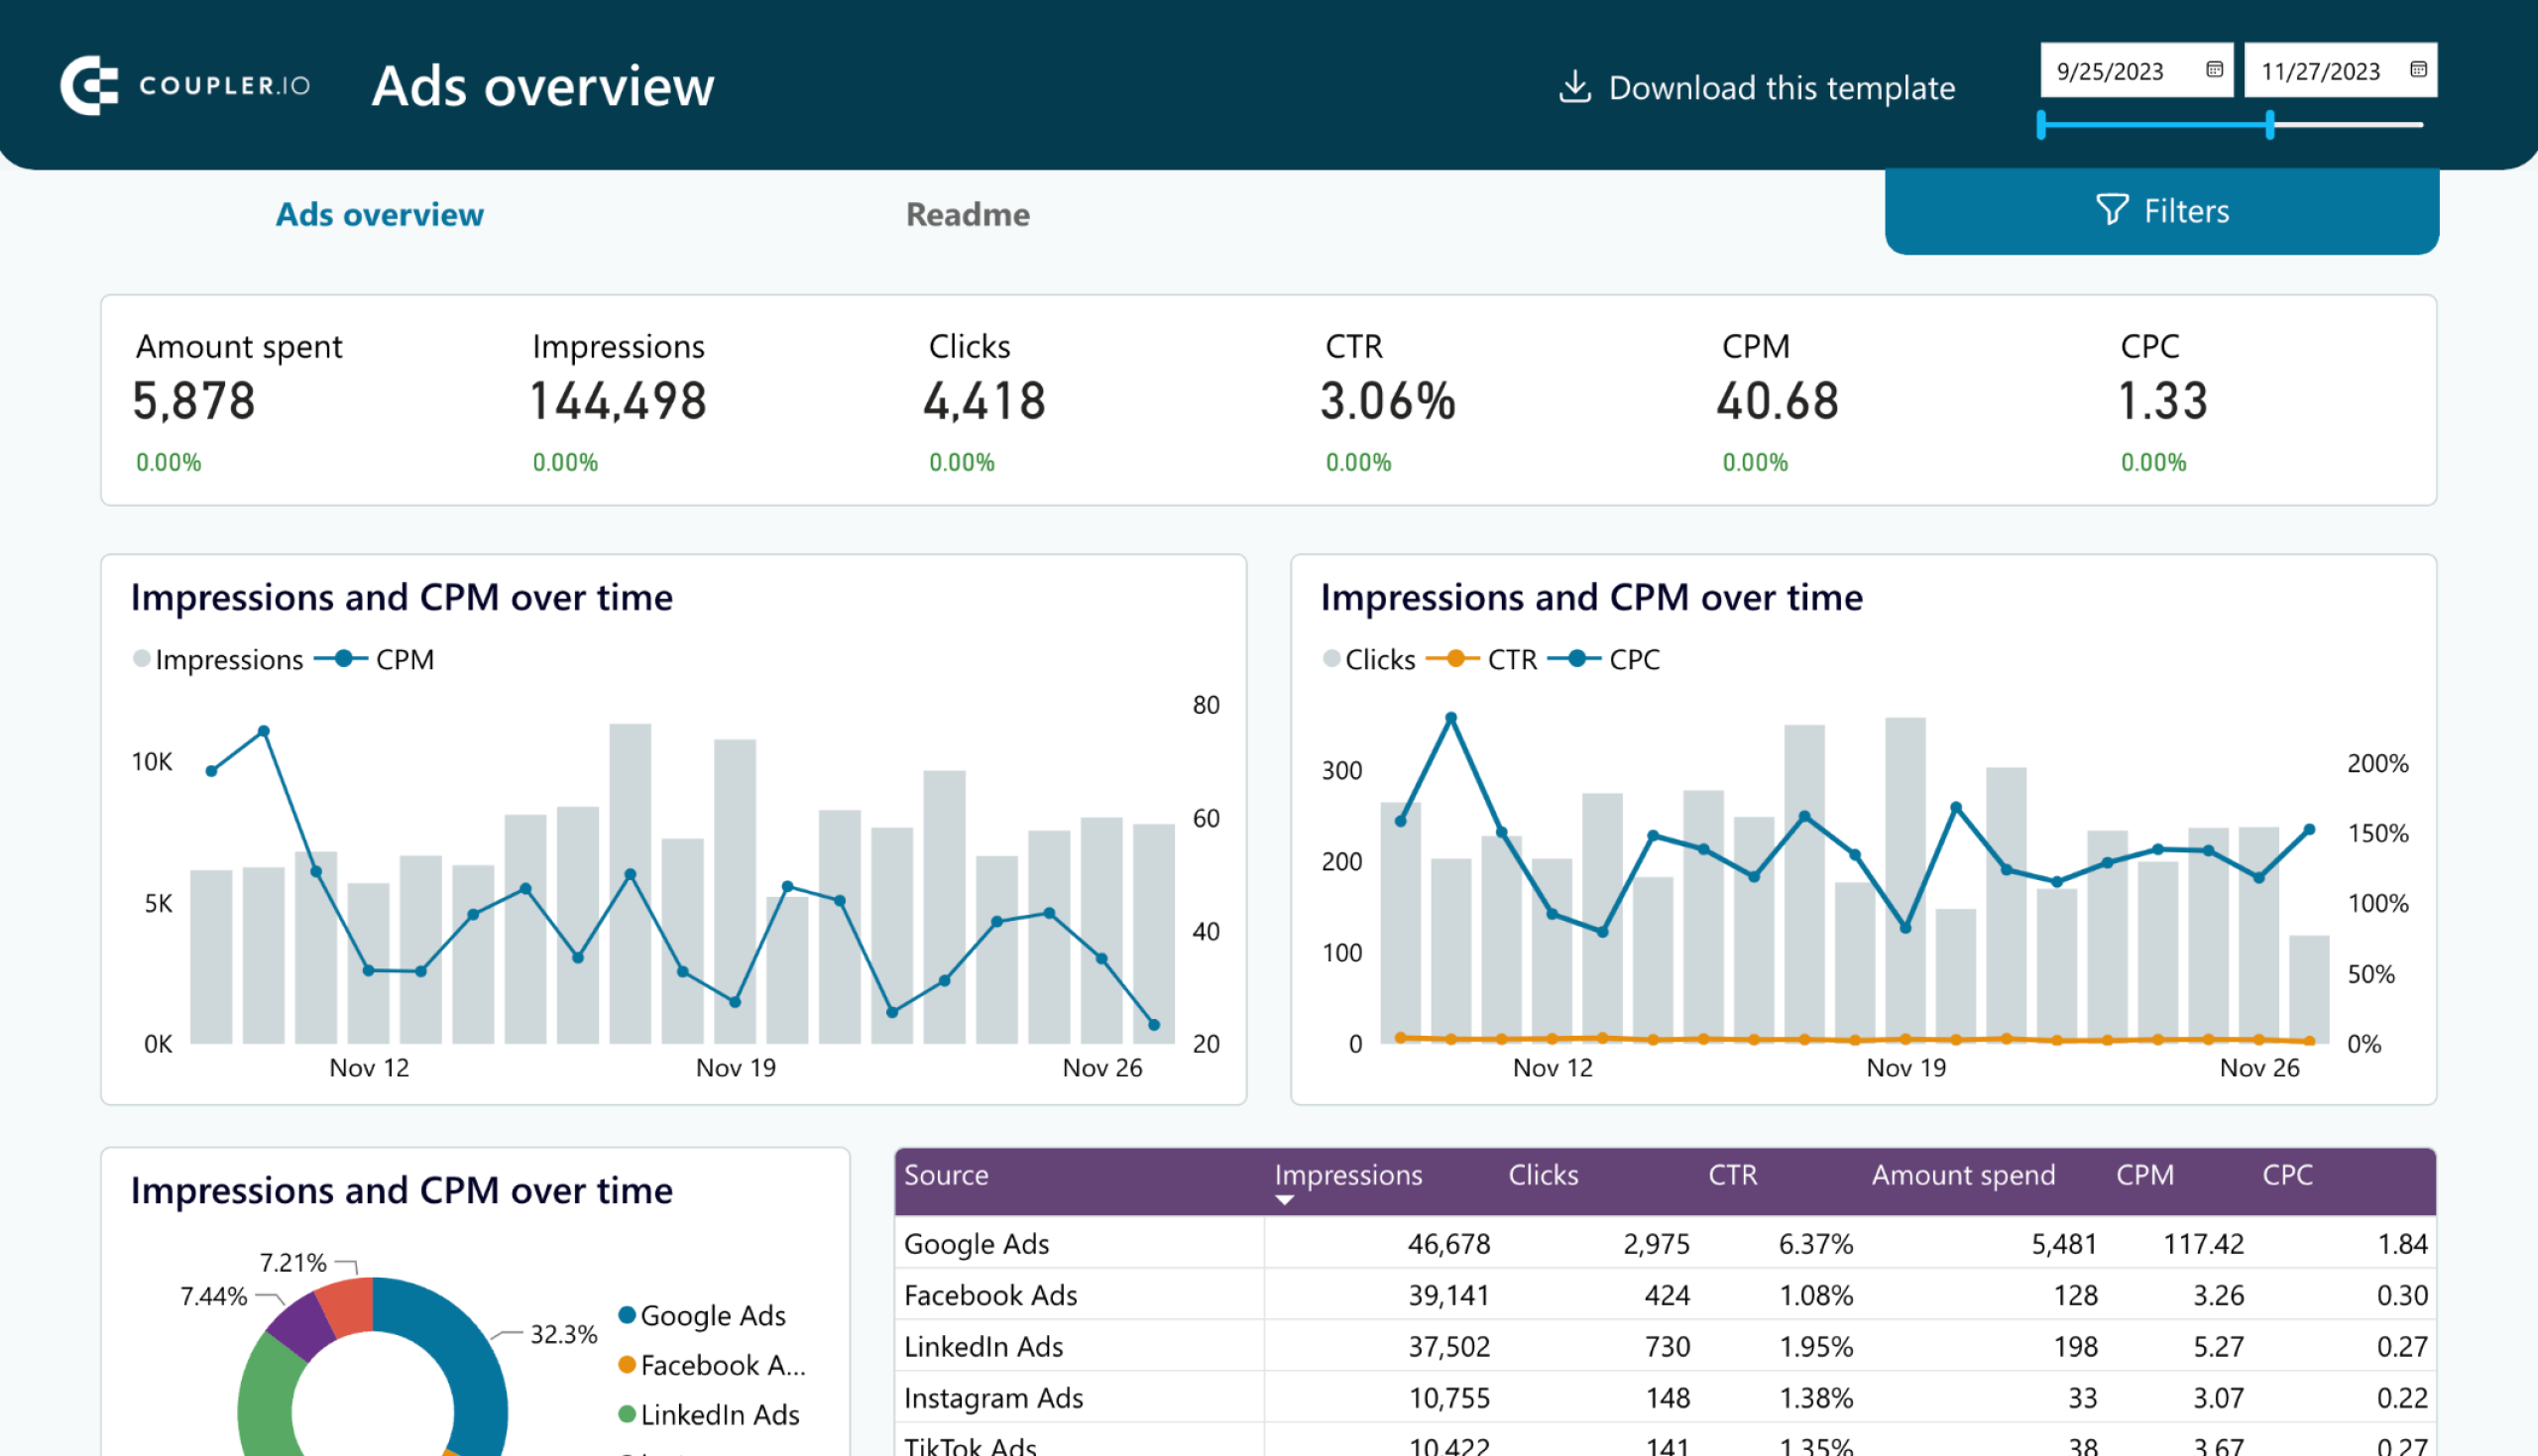
PPC multichannel dashboard for Google Ads, Facebook Ads, and other platforms
For comprehensive cross-platform advertising analysis, use this PPC dashboard that integrates data from multiple platforms including Google Ads, Facebook Ads, TikTok Ads, Quora Ads, Microsoft (Bing) Ads, LinkedIn Ads, and X (Twitter) Ads. It lets you track and compare ad performance to optimize your entire digital advertising portfolio.

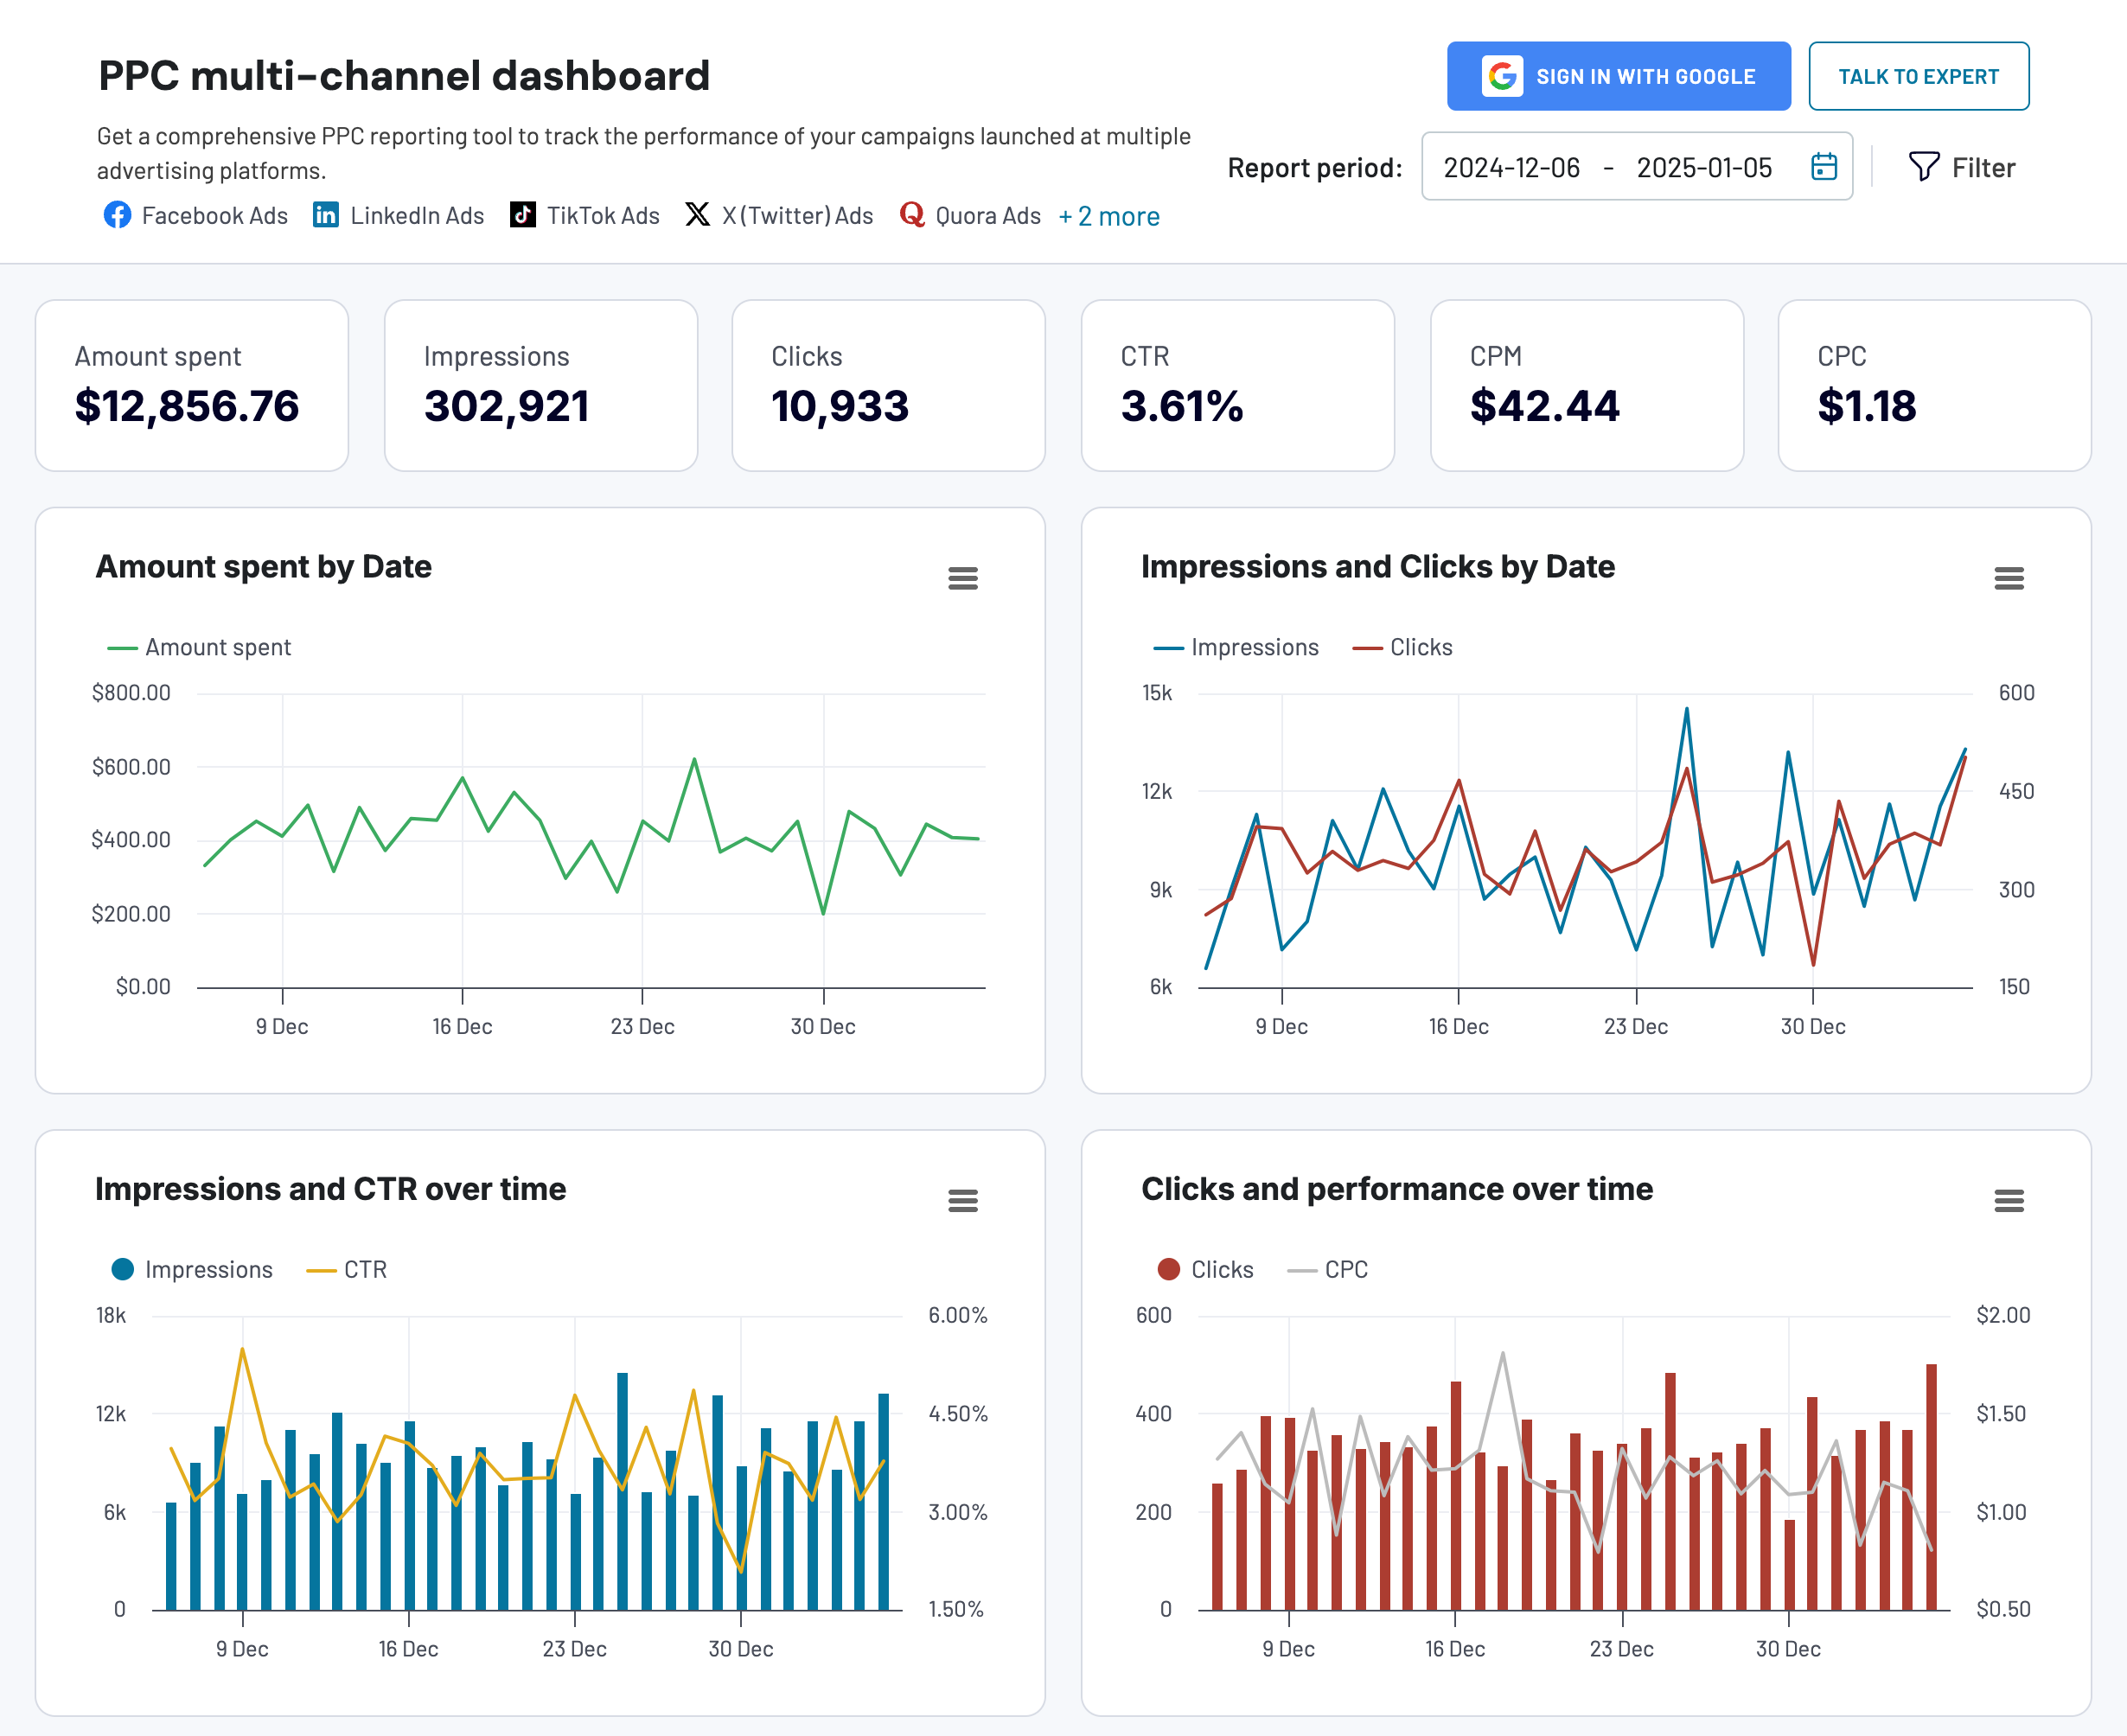
The dashboard provides a unified view of cross-platform performance metrics such as CPC, CPM, and conversion rates. So, PPC experts won’t need to check metrics on individual platforms separately. In addition, it becomes much easier to share insights with stakeholders.
Alternatively, you can use the dashboard as the template in Google Sheets, Looker Studio, Power BI, and Tableau. Select the one you prefer and try it out.


PPC multichannel dashboard in Google Sheets
Use a PPC dashboard designed for Google Sheets to track the performance of your campaigns across multiple advertising platforms.


PPC multichannel dashboard in Looker Studio
Get a comprehensive PPC reporting tool to track the performance of your campaigns launched at multiple advertising platforms.

PPC multichannel dashboard in Power BI
Use a Power BI PPC dashboard for tracking and analyzing your advertising campaigns across multiple platforms.

PPC multichannel dashboard in Tableau
Track and analyze the performance of your advertising campaigns across various platforms using a one-stop PPC dashboard in Tableau
How to export data from Google Ads to Excel manually
The simplest way to export Google Ads to Excel is to download your data as a CSV file and then import it into an Excel workbook. Let’s take a look at how you can do this.
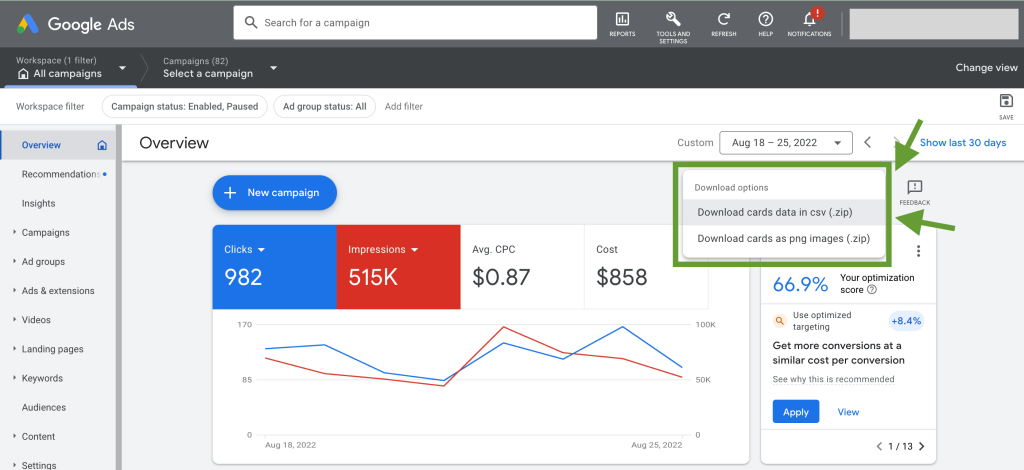
- In this example, we are going to export the overview cards. On the Overview page, click Download next to the Feedback icon.
- Select Download cards data in csv.

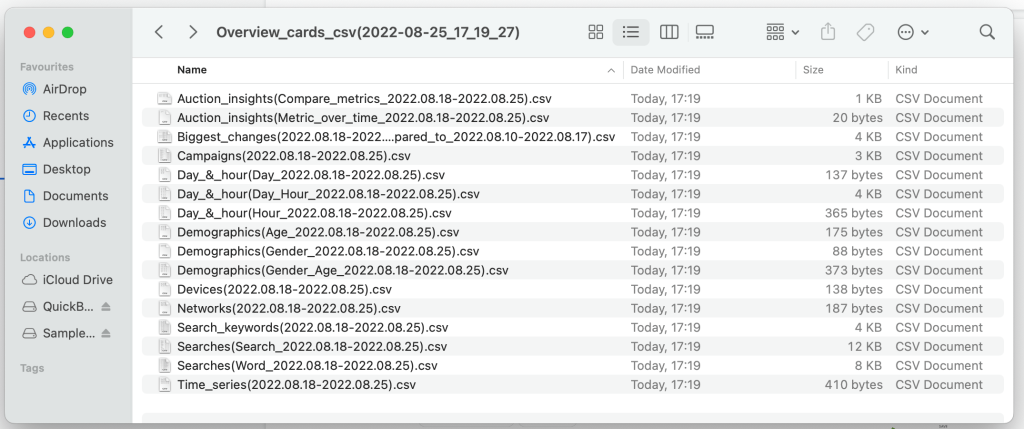
- An archive with the CSV files will be downloaded automatically. Here’s what it looks like:

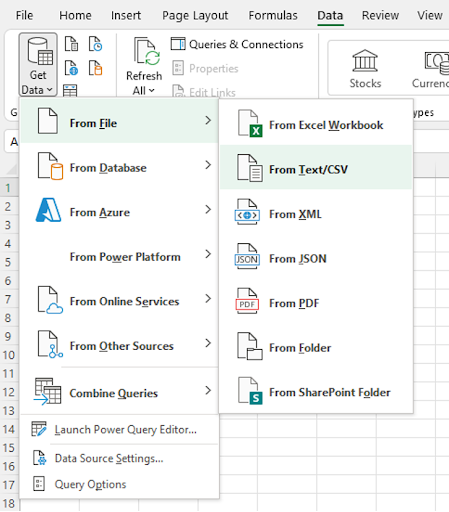
- Then, we need to import this data to the spreadsheet. Go to Excel and find the Data tab. Select Get & Transform Data -> From Text/CSV. After this, select the CSV file you want to upload. In our example, data from each card needs to be imported separately.

How to export Google Ads data as an .xlsx file
Some data entities, such as Locations, Videos, or Landing pages, can be downloaded as an .xlsx file. This will simplify the process even further because there’s no need to import extracted data in this case.
- Go to the page with the data entity you want to export. In this example, we’ll export Campaign reports, but it works the same way for the other data types. Click Download in the menu on the right and select .xlsx.
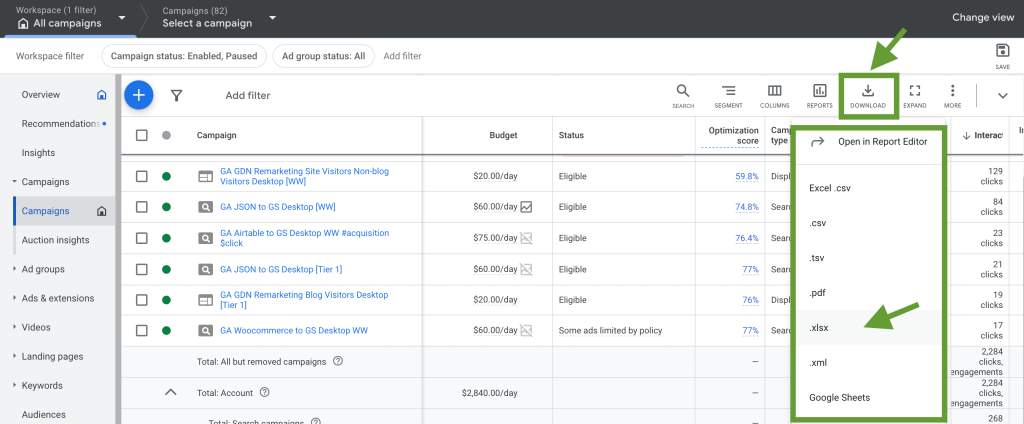
- When the campaign report is ready, it will be downloaded to your computer automatically. Now you can open it with Excel.
As you can see, exporting data from Google Ads to Excel as a CSV or .xlsx file is easy. However, this method still has some downsides. If you want to update your calculations or dashboards in Excel, you’ll need to download the latest version of your Google Ads data regularly.
This repetitive task, if performed manually, can cost you quite a lot of time and effort. That’s why you might want to consider automating this process. If you connect Google Ads to Excel automatically, your data in spreadsheets can be updated on a schedule without any involvement from your side.
What is the best way to export Google Ads to Excel?
We’ve explored the different methods that allow you to connect Google Ads to Excel. Each of them has certain advantages. If you don’t need to export Google Ads to Excel very often, then you can stick to the native functionality and simply export data as a CSV or .xlsx file.
But if you want to monitor performance continuously, create self-updating dashboards, or share the latest data with colleagues, then automation is a great way to achieve these goals. The efficiency boost provided by automation is especially significant if you want to blend your Google Ads data with information from other sources. You can achieve this using Coupler.io – it allows you to set a Google Ads to Excel integration quickly and easily. Apart from that, it can also help you connect Google Ads to Power BI and easily visualize your data, as well as send data from Google Ads to Redshift for in-depth analytics.
Good luck with your data, and stay in touch for updates!
Automate exports of Google Ads data with Coupler.io
Get started for free