

Managing Google Ads data becomes significantly more complex when you need to load it to Google Sheets for analysis and reporting. Organizations frequently require regular performance reports or need to consolidate Google Ads metrics with other marketing channel data. While manual export of Google Ads to Google Sheets is possible, it can be time-consuming and prone to errors. Fortunately, there are several efficient solutions available, including a reporting automation platform that requires no coding expertise.
How to pull data from Google Ads to Google Sheets
There are several ways of exporting Google Ads data to Sheets.
- The most obvious one is to download a CSV file with information about Google Ads. Then you can upload the file to Google Sheets.
- The most actionable option is to connect Google Ads to Google Sheets using Coupler.io. This reporting automation solution allows you to schedule exports of raw data or create custom reports without any hassle.
- Another handy approach to exporting Google Ads data to a spreadsheet is through Google’s native add-on for Google Sheets.
- The third exporting solution is for tech-savvy users since it involves an API and a script developed in Google Apps Script or another programming language. We won’t cover it in this guide as even though Google Apps Script is not the most difficult programming language, most people, especially marketers, won’t be able to develop a script on their own.
So, let’s check out each of these options in detail.
Connect Google Ads to Google Sheets with Coupler.io for automated reporting
When building a self-updating dashboard to report on your ad campaign performance or other ad data, it’s best to avoid time-consuming manual exports. You can automate this process instead with the Google Ads to Google Sheets integration by Coupler.io.
To export information about campaigns or other data from Google Ads to Google Sheets automatically, click Proceed in the form below.

You’ll need to sign up for Coupler.io with your Google account for free and configure the connection between the source and destination apps.
Step 1. Extract data from Google Ads
Connect your Google account with access to Google Ads and follow the steps in the interface:
- Start by selecting an active ad account to extract data from.
- Next, choose a report type. For instance, ‘Campaigns performance,’ ‘Keywords performance,’ or ‘Geo performance by country.’

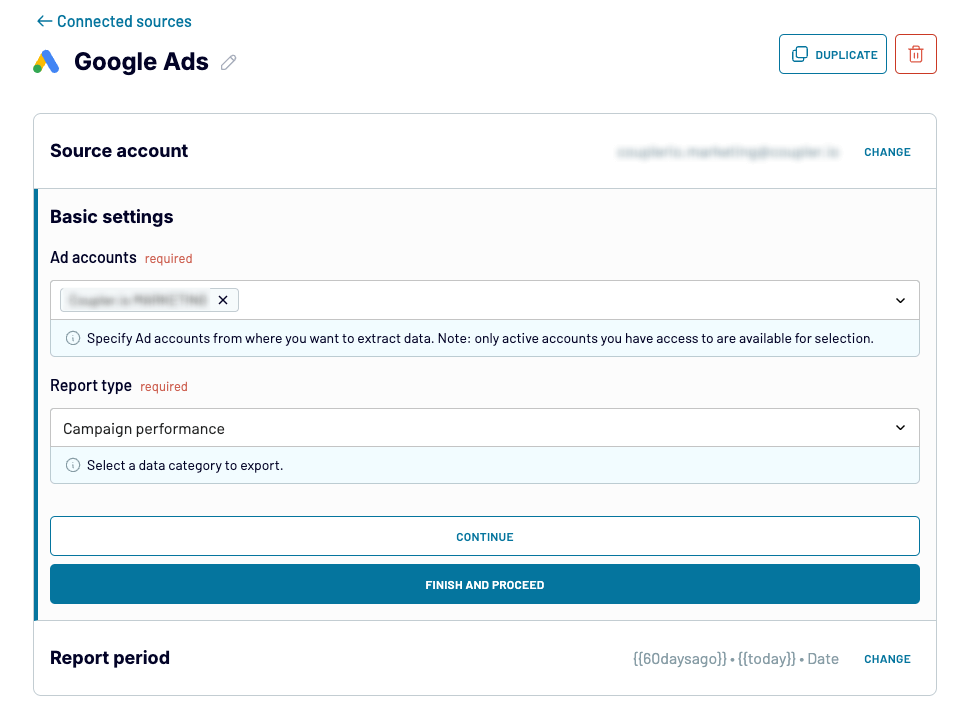
Optionally, you can specify the start/end dates for your report and choose to split the data by periods. Once you’re ready, proceed to the Transformations step.
Step 2. Transform data before loading it to Google Sheets
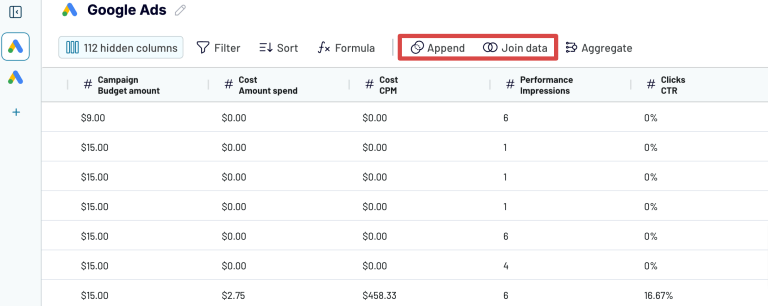
Coupler.io allows you to preview and even transform the Google Ads data before it lands in Google Sheets. Here’s what you can do:
- Hide, rename, reorder, and add new columns with custom formulas.
- Filter and sort your data.
- Aggregate data for quick insights, such as the sum, average or min/max of specific columns.
- Join data from other apps or Google Ads accounts to create a unified performance report.
- Merge datasets with similar columns and labels

When you’re happy with the final result, move on to the last step: Destinations.
Step 3. Load data and schedule automated data refreshes
Your destination is already set as Google Sheets – all you have to do is connect to the Google Sheets account. Then, select a spreadsheet and a sheet for the exported Google Ads data.

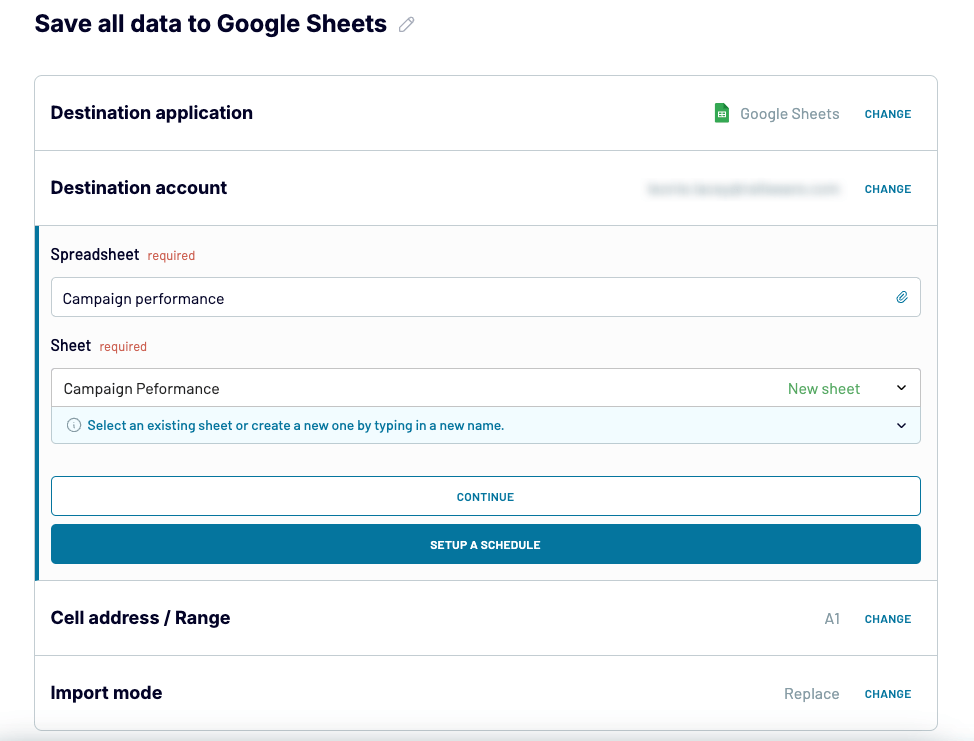
Optionally, you can specify the first cell or range for the exported data, and change the import mode from replace to append. Eventually, move to the automation section.
Finally, take the opportunity to enable automatic data refresh for your report. In the last step, turn on the scheduler and configure the frequency, days of week, time zone, and time preference for Google Ads exports. You can choose to have your data updated daily, weekly, or as frequently as every 15 minutes.

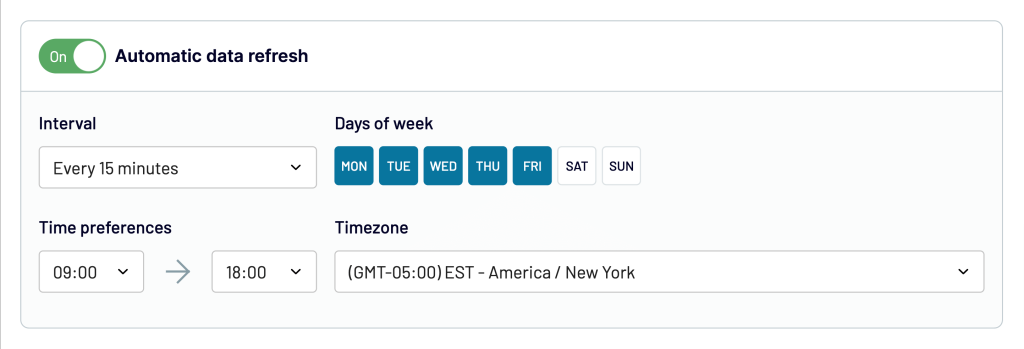
Once finished, click Save and Run to launch the Google Sheets connector and send your Google Ads data to your spreadsheet.
We’ve explained how to export data and generate a report from scratch, but you should also know about the quickstart option – Google Ads report templates. Coupler.io offers white-label templates for Google Ads and PPC reporting which take less than 5 minutes to set up. We’ll discuss them in more detail shortly.
Coupler.io add-on for Google Sheets to load data
If you prefer to handle the export process directly in your spreadsheet – rather than a separate interface – you can use the Coupler.io add-on for Google Sheets. First, open the sheet you want to work with, then:
- Click on Extensions in the top menu bar.
- Select Add-ons, then Get add-ons.
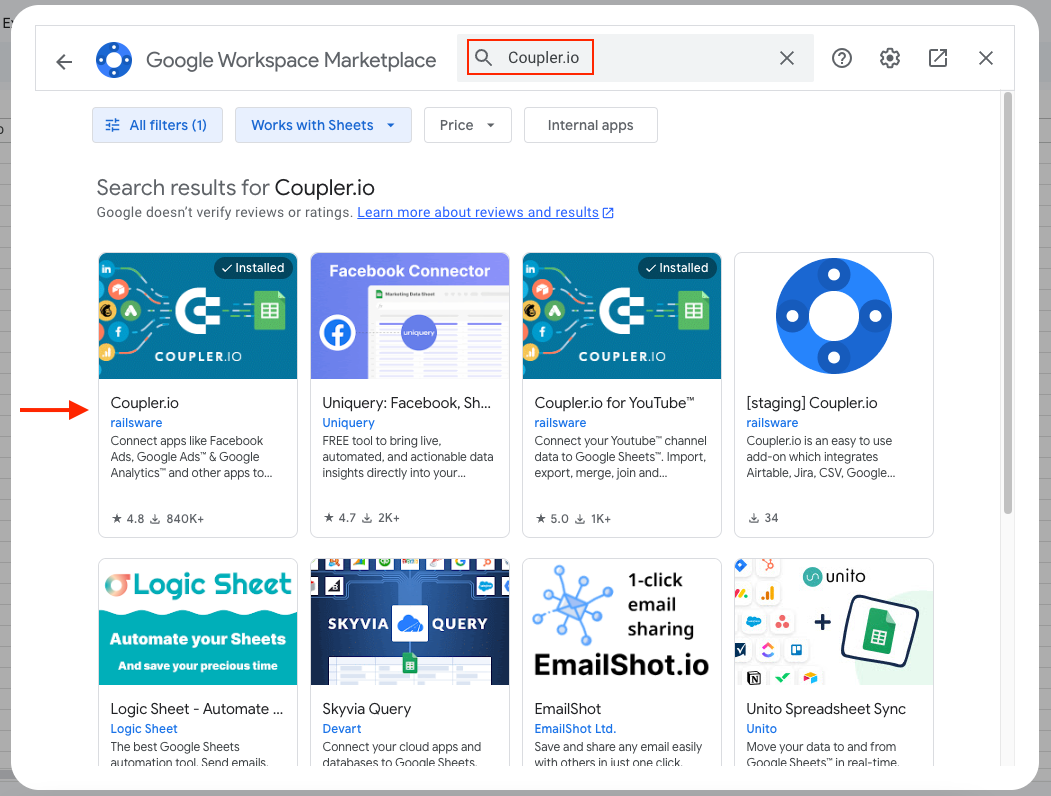
- A pop-screen for Google Workplace Marketplace will appear. Enter ‘Coupler.io’ into the search bar.
- Click on the first result and install the Coupler.io add-on. You may be prompted to sign in again to your Google account.

If the add-on doesn’t automatically appear on the right-hand side of your sheet, go to the Extensions drop-down, hover over Coupler.io, and click Launch. You’ll be asked to sign in or quickly sign up for a free Coupler.io account.
From the right-side Coupler.io tab, select Add importer and follow the steps within the pop-up screen to connect your Google Ads data to your Google Sheet.
Turn Google Ads data into insights with dashboard templates
The raw data does not look fancy, right? To fix this, you can either turn it into a custom report or opt for a ready-to-use dashboard by Coupler.io. The latter offers options designed for Google Ads, as well as more advanced PPC reporting solutions. For instance, you can consolidate Google Ads with the records taken from other apps, such as Facebook Ads or LinkedIn Ads in a single view. Let’s explore what you can consider.
Google Ads dashboard
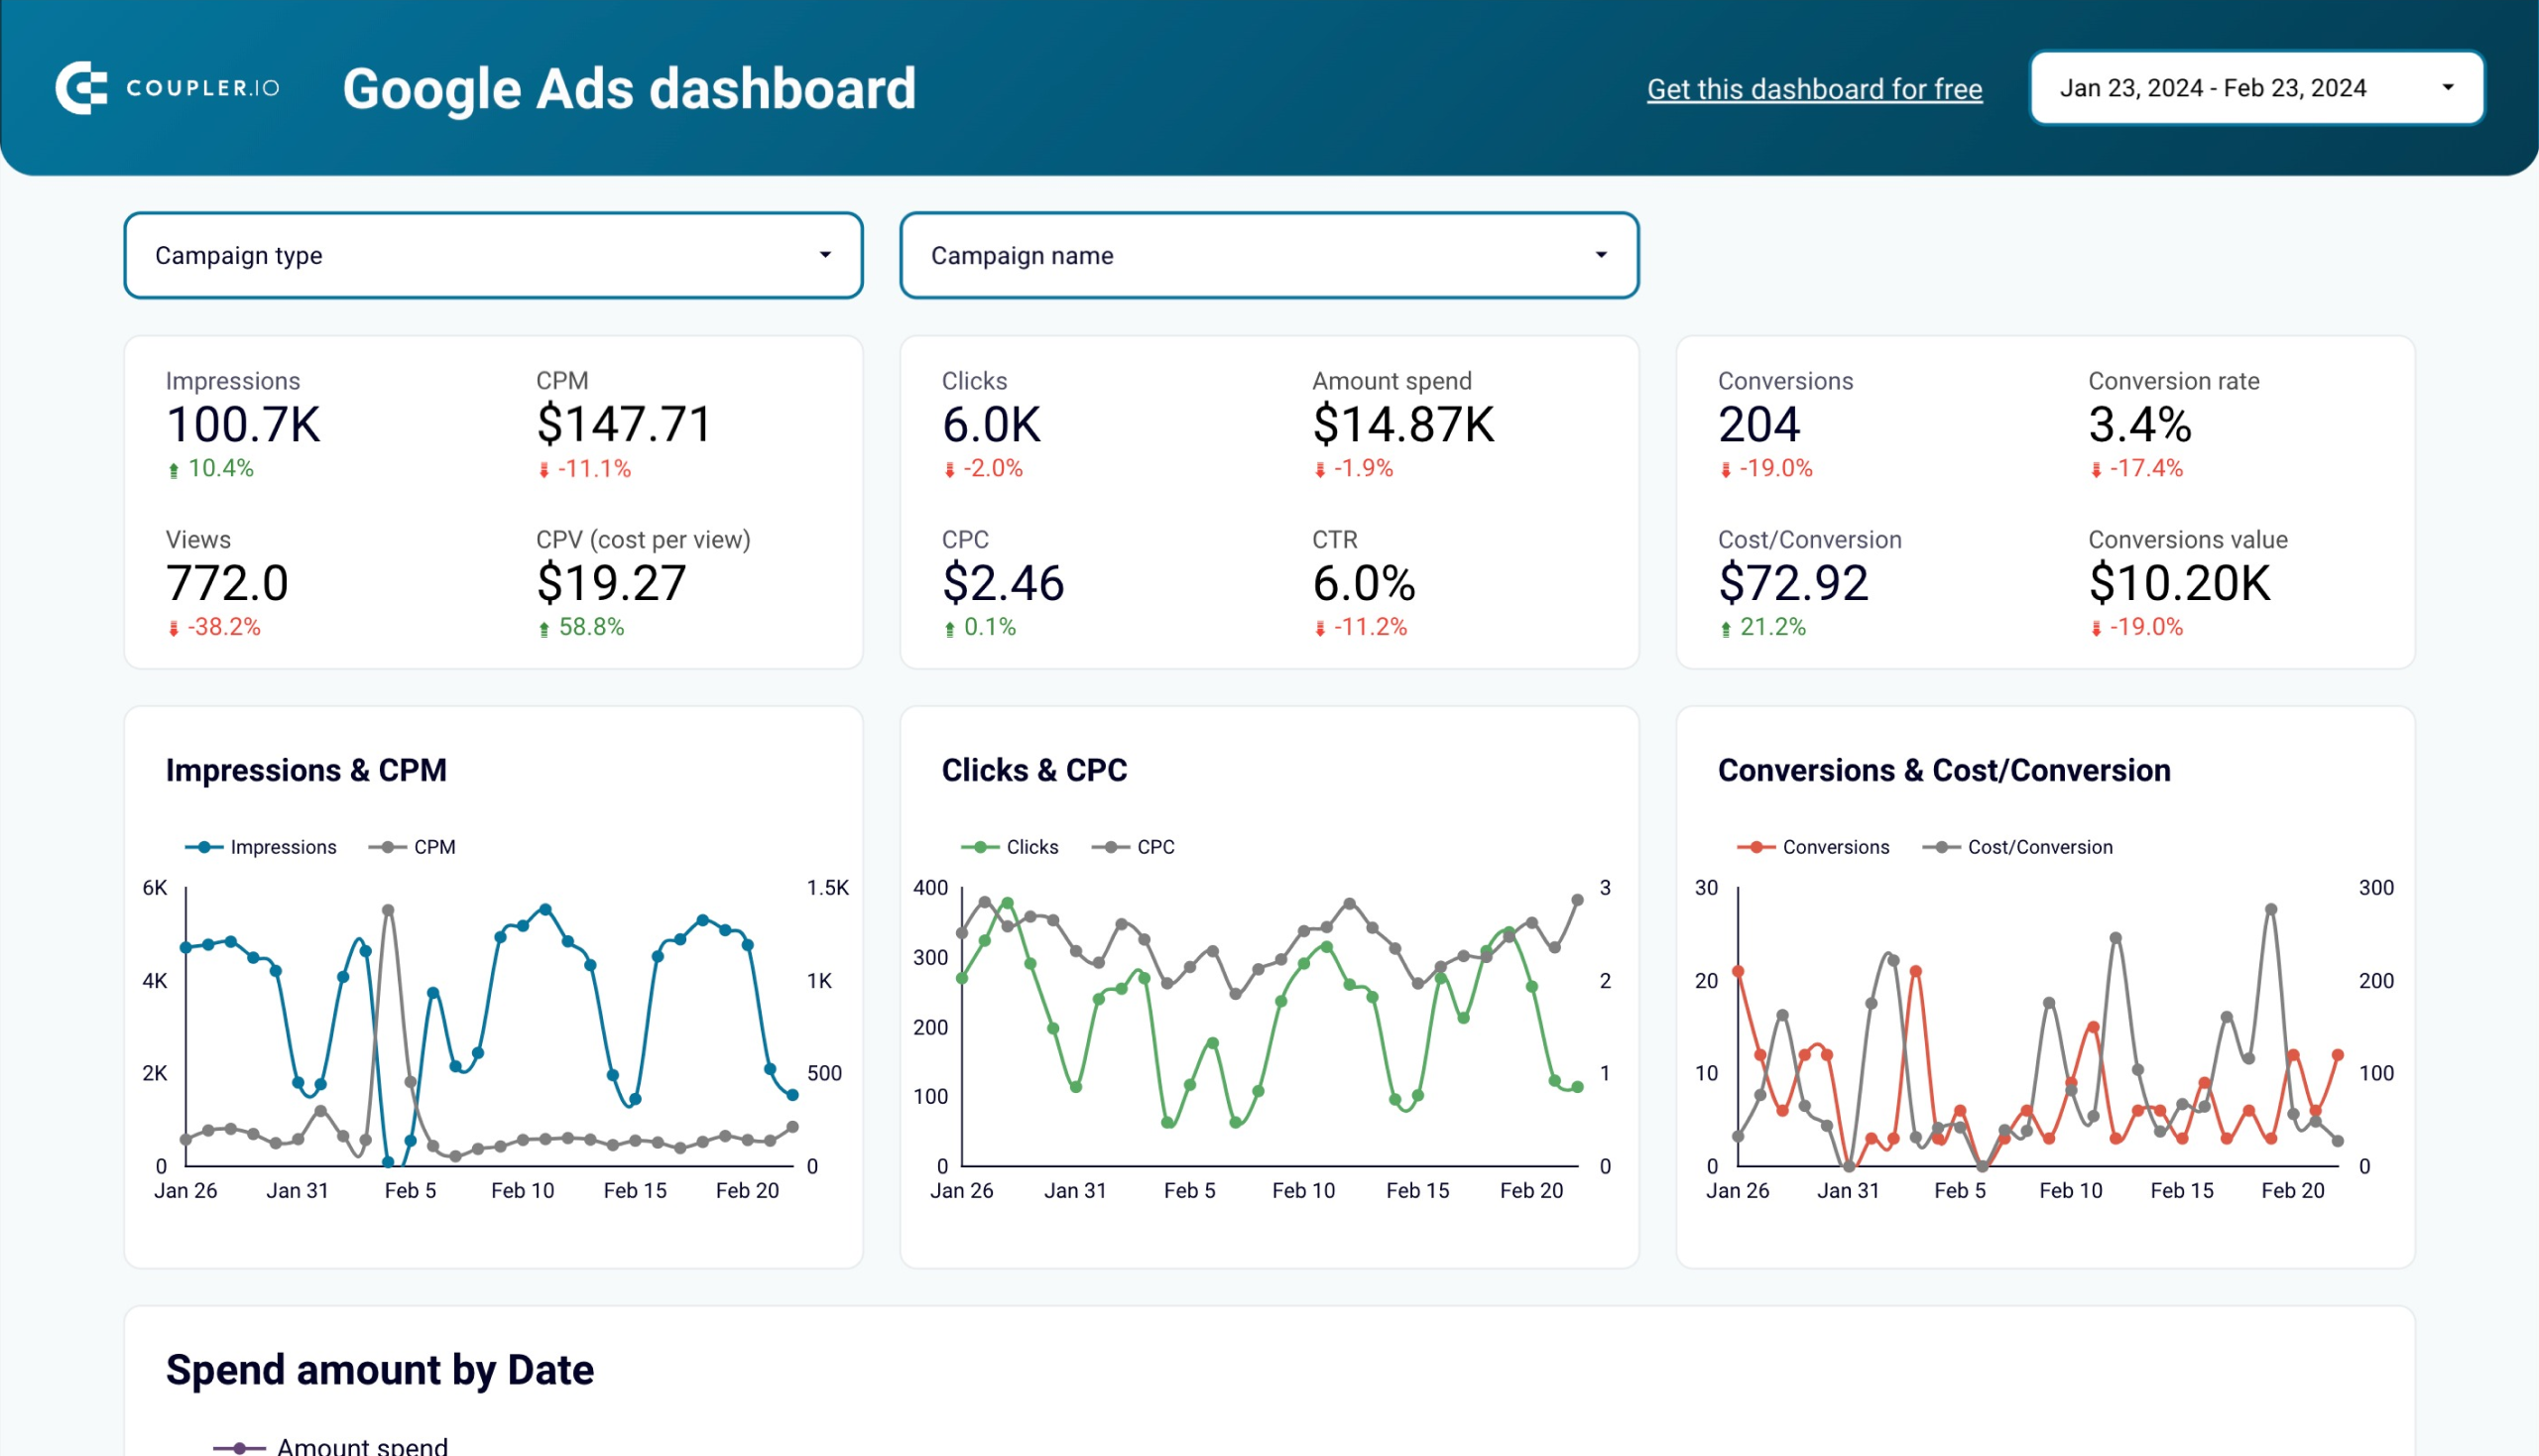
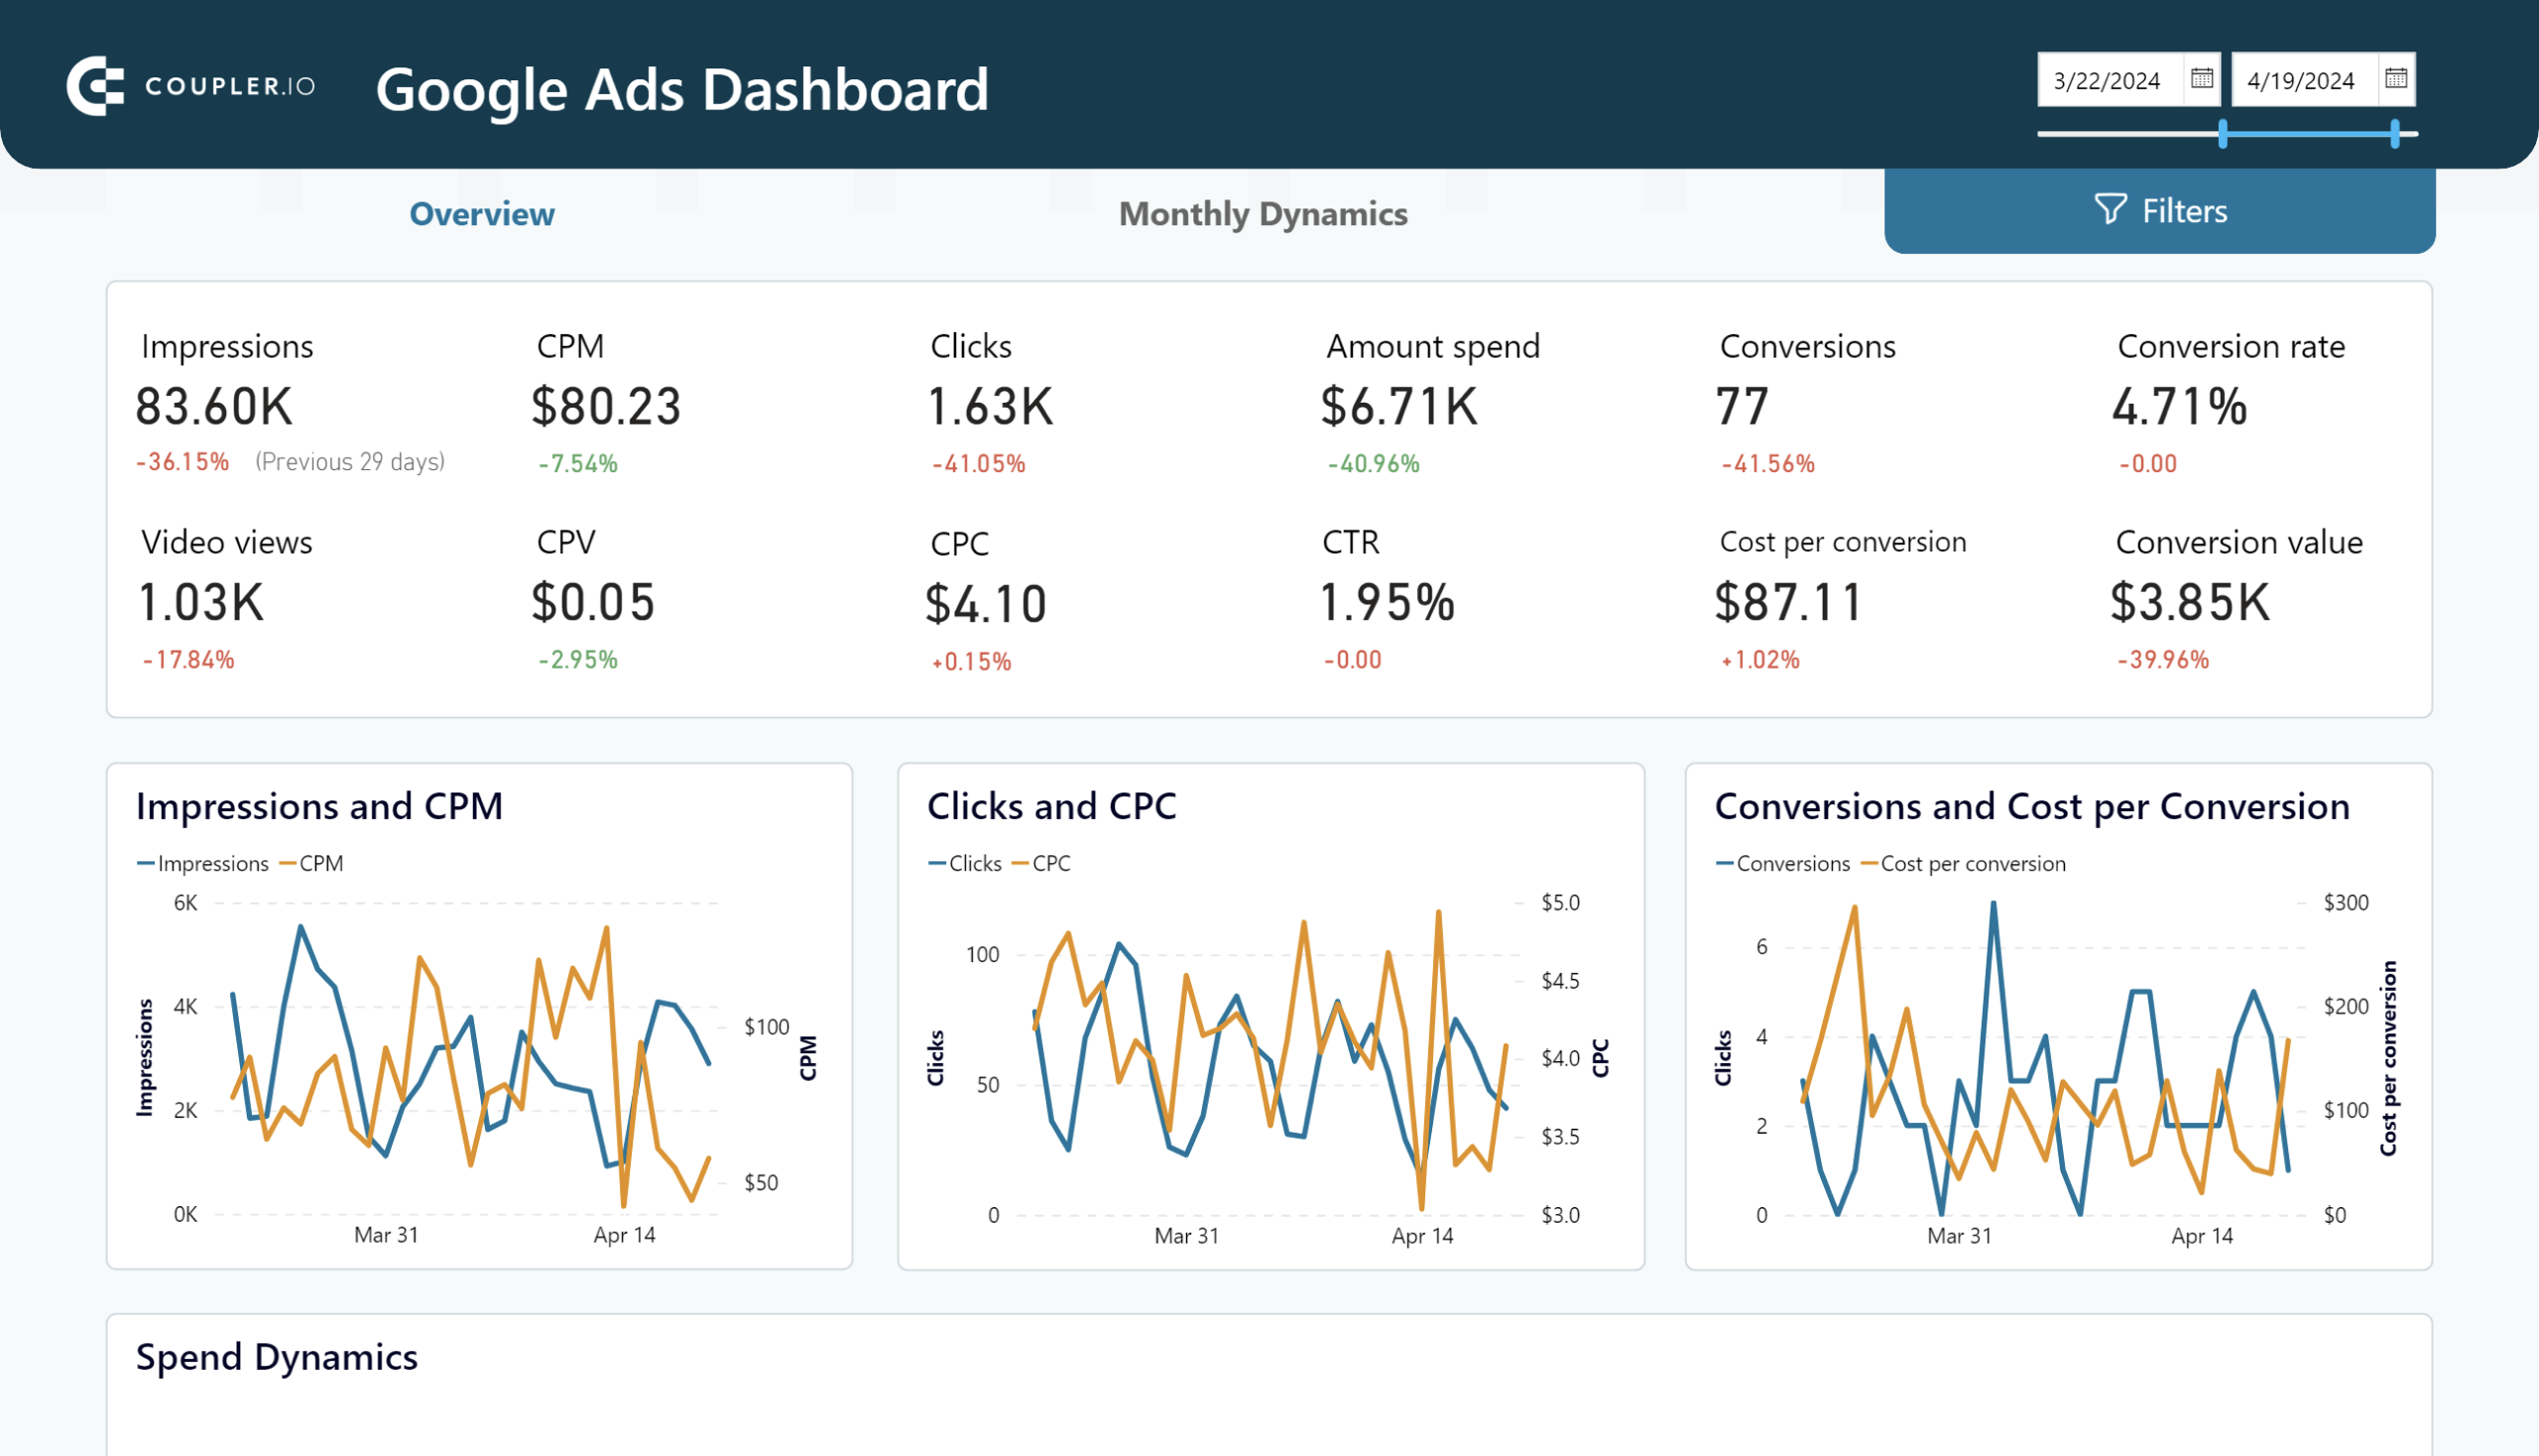
The Google Ads dashboard provides access to essential ad performance metrics and lets you track their dynamics.

You can monitor and compare results over time, as well as analyze performance across different devices. Use the filters by campaign type and name to narrow down your analytics.
The dashboard can be easily connected to your Google Ads account, and your data will appear in a few moments.
The Google Ads performance dashboard is also available as a template in Google Sheets, Looker Studio, and Power BI. Choose the version relevant to your needs and try it for free.

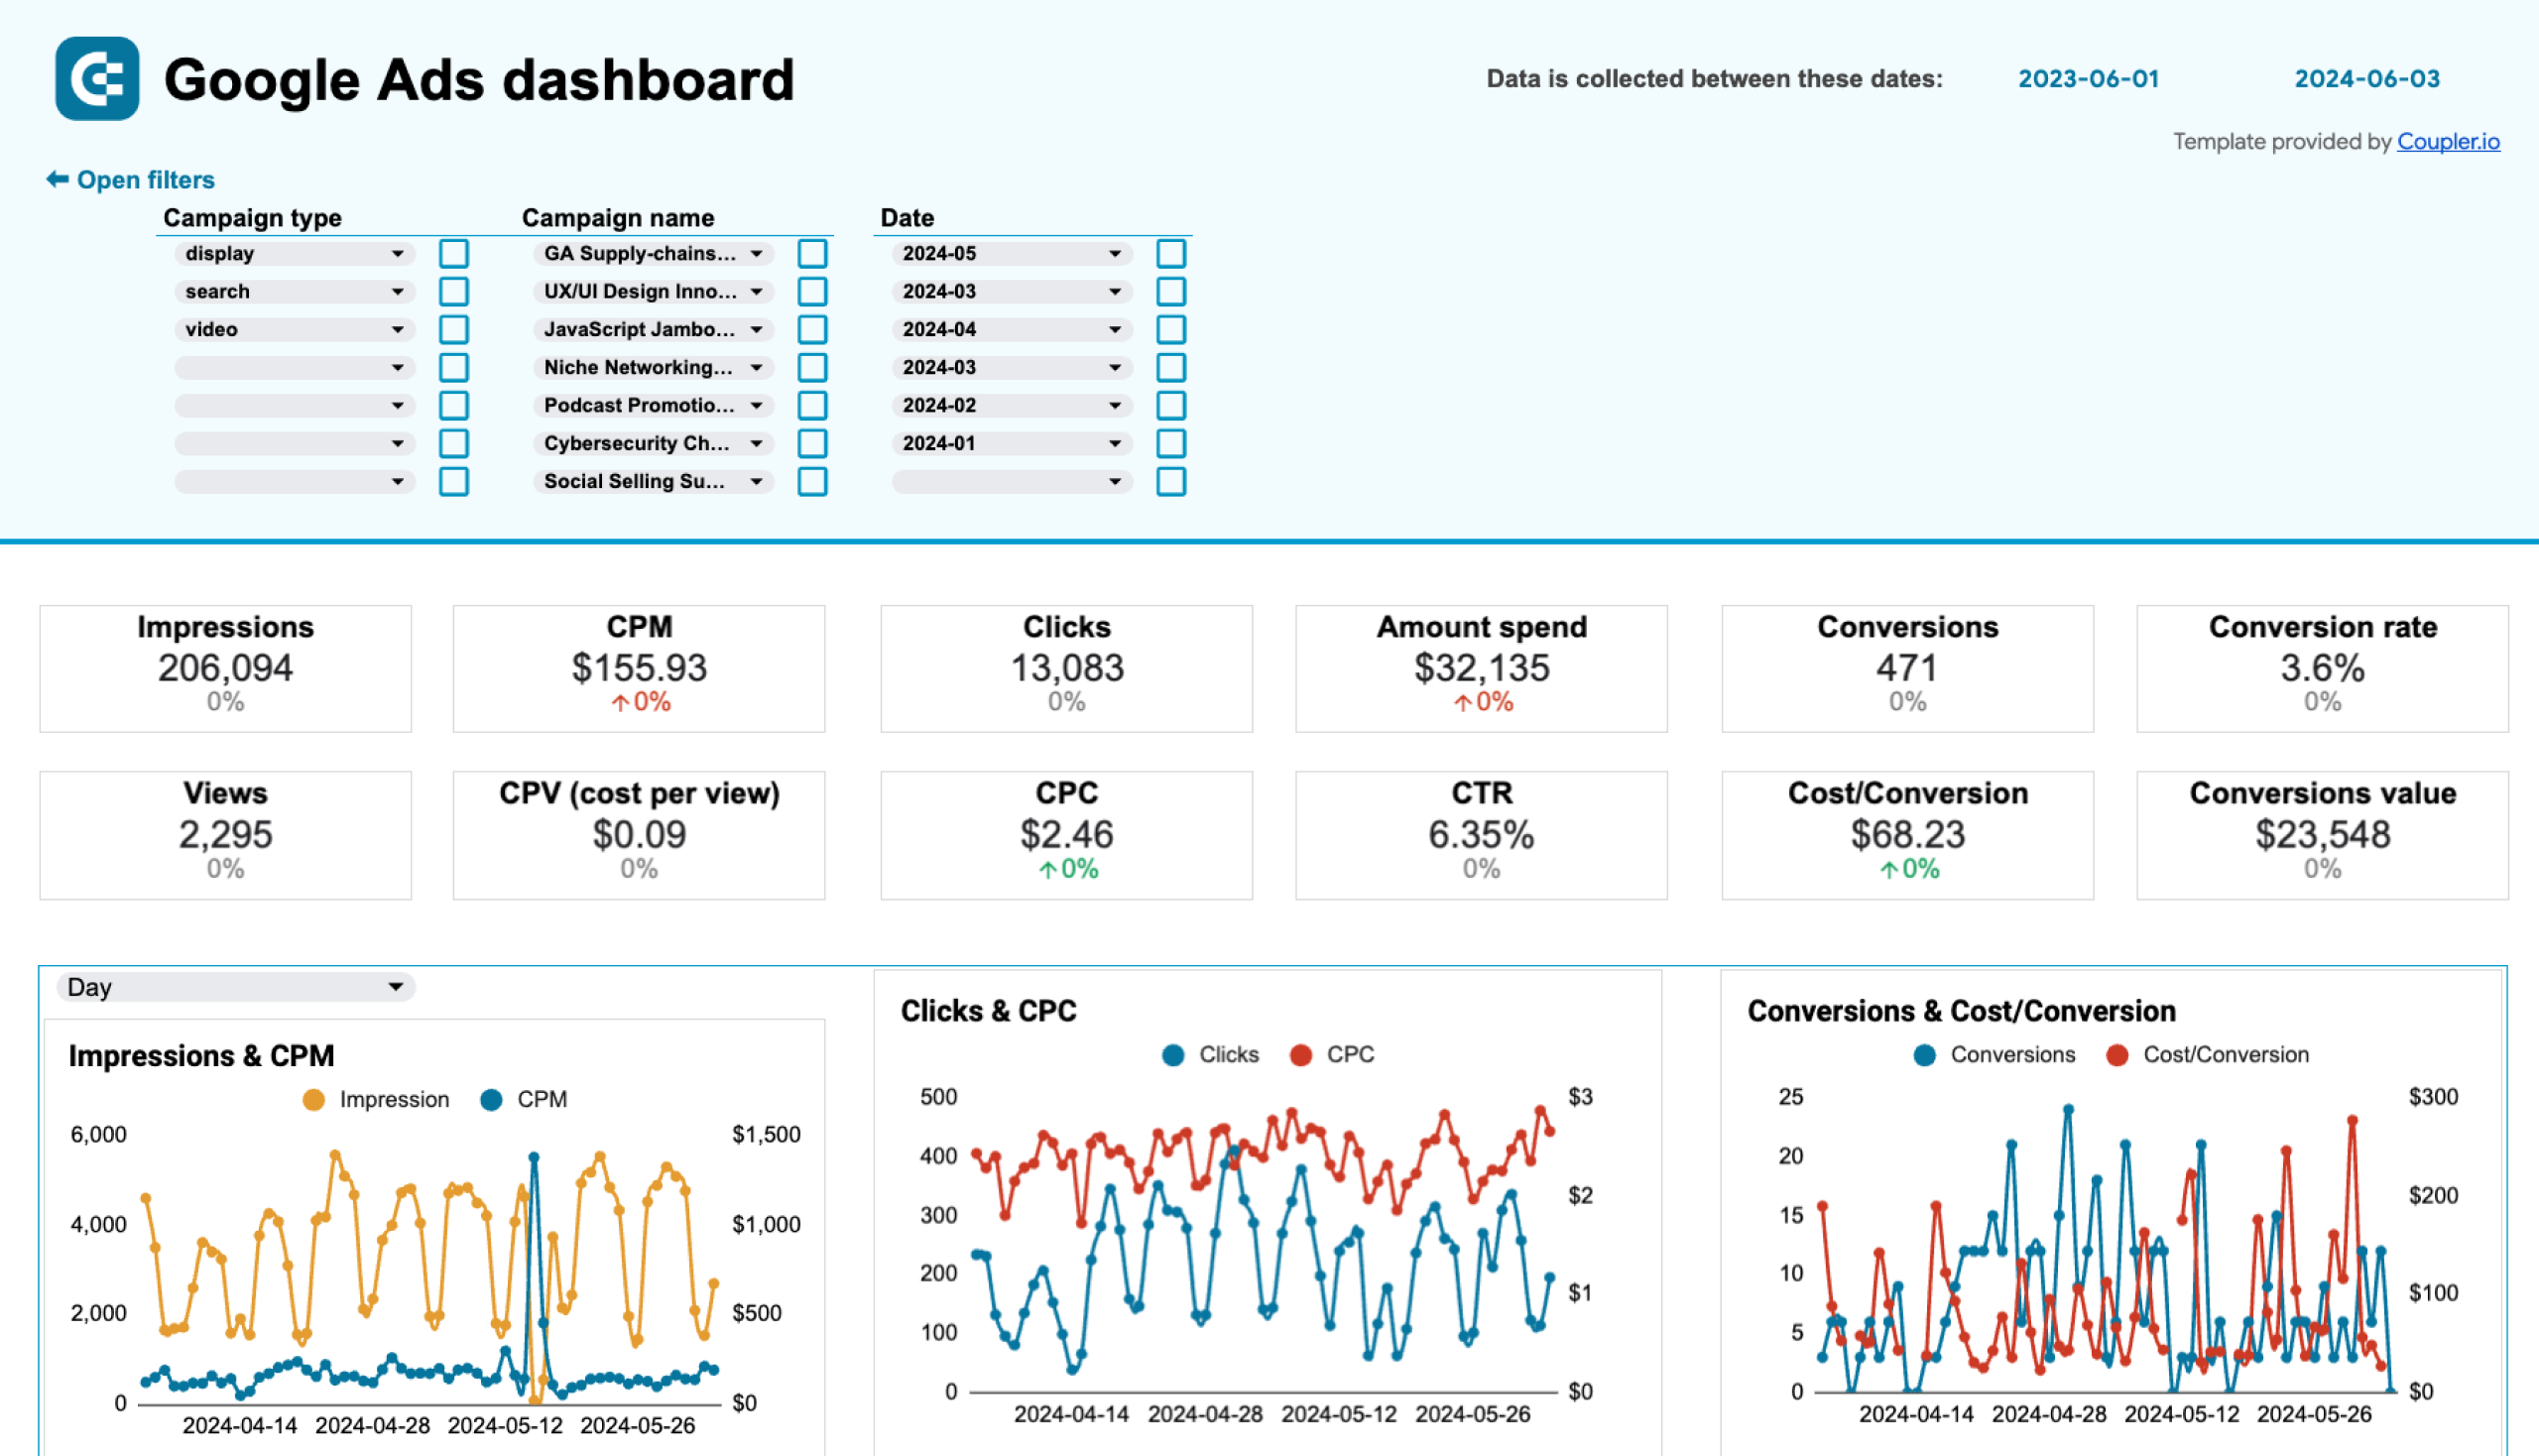
Google Ads dashboard in Google Sheets
Evaluate the performance of your PPC campaigns launched on Google and use these insights to optimize budgeting and conversion.

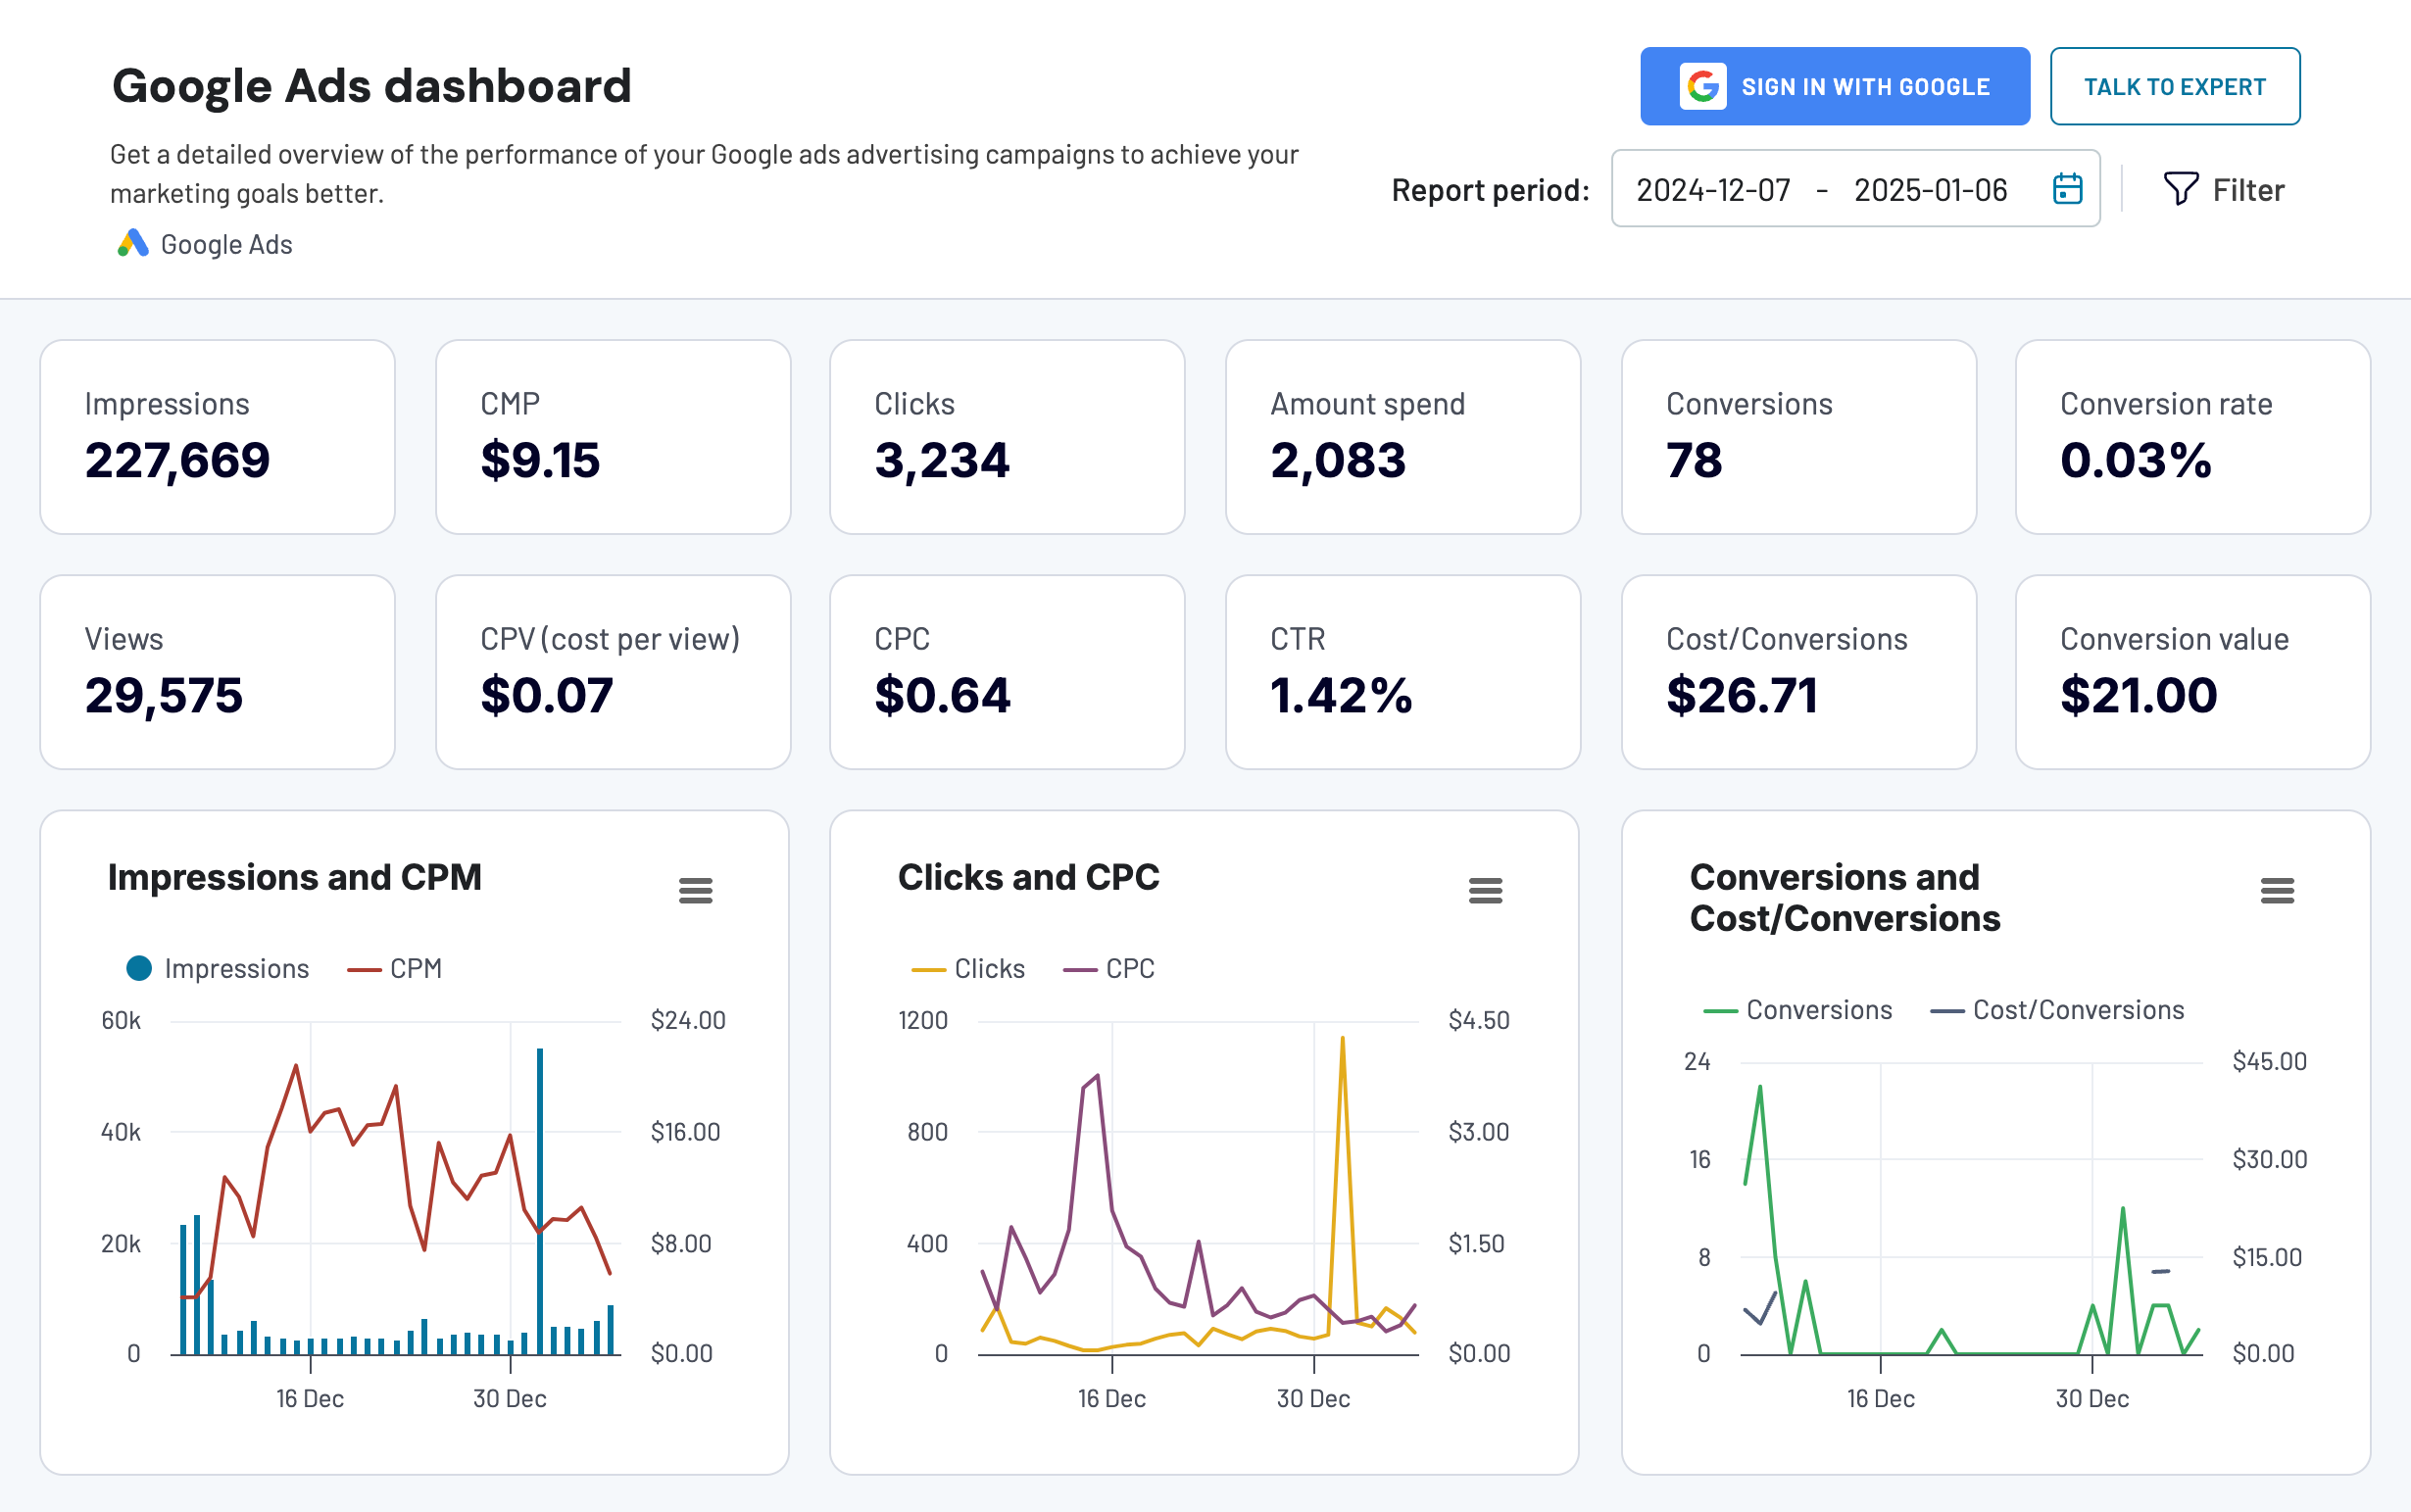
Google Ads dashboard in Looker Studio
Get a detailed overview of the performance of your Google ads advertising campaigns to achieve your marketing goals better.
Google Ads dashboard in Power BI
Overview the performance of your advertising campaigns in Google Ads and track monthly dynamics of key metrics.

Google Ads keyword performance dashboard
This dashboard allows you to analyze the performance of your Google Ads keywords.

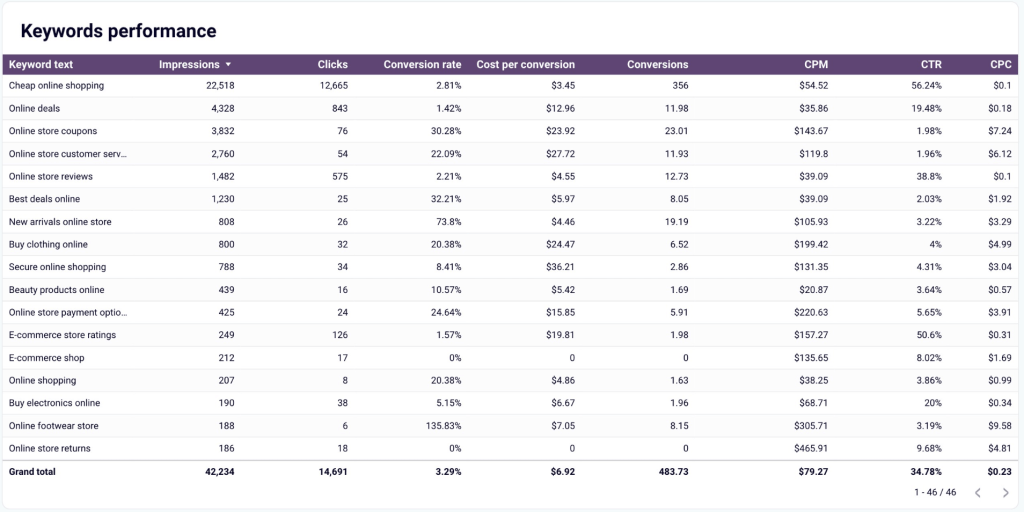
You can see your top keywords and pages based on clicks or impressions. The dashboard also provides an overview of critical metrics to compare their performance over time. Explore the search impression share for particular keywords to understand your ad visibility better.
The dashboard template is designed in Looker Studio and has a built-in Google Ads connector.
Google Search Ads performance tracker + editor dashboard
This Google Search Ads template allows you to track the results of your campaigns and evaluate their performance. Additionally, you can use the editor feature to modify your ads or create new ones.

It’s a handy tool for optimizing campaigns based on your latest results and key performance indicators, such as impressions, amount spend, etc. You can find a full set of instructions on how to use this dashboard in the Readme tab or at the top of the sheet. Simply create a free Coupler.io account and launch the report in Google Sheets.
Google Ads creatives dashboard
The Google Ads creatives dashboard provides an overview of your ad creatives’ performance. This allows you to make data-driven decisions to improve engagement, manage costs, and maximize ROI.

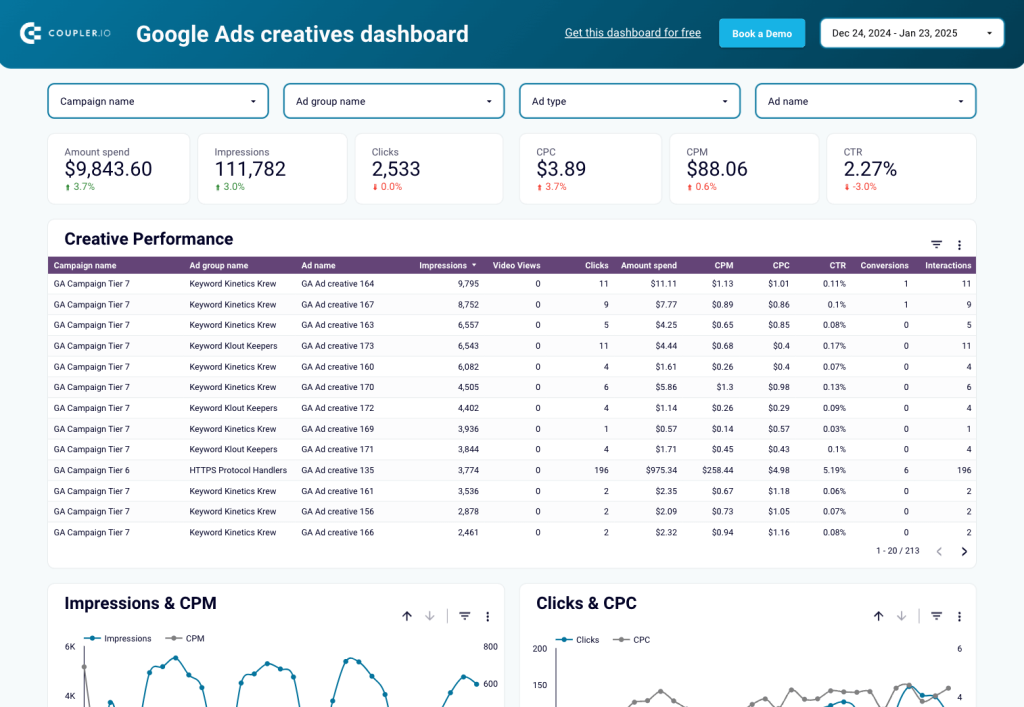
Specifically, you can use the dashboard to analyze the performance of creatives across key metrics like impressions, clicks, CTR, and more. Identify optimization opportunities by tracking trends in audience engagement and campaign impact.
Meanwhile, monitor spending patterns to ensure your budget aligns with campaign goals, or compare CPM and CPC to determine cost efficiency.
Set up this dashboard in less than 5 minutes with a free Coupler.io account. Check it out in Looker Studio:
Google Ads quality score analytics dashboard
This Google Ads dashboard allows you to analyze your quality score and compare its growth against key metrics. Filter results by campaign, ad group, keyword, and time period to understand the reasons for poor performance or growth spikes.

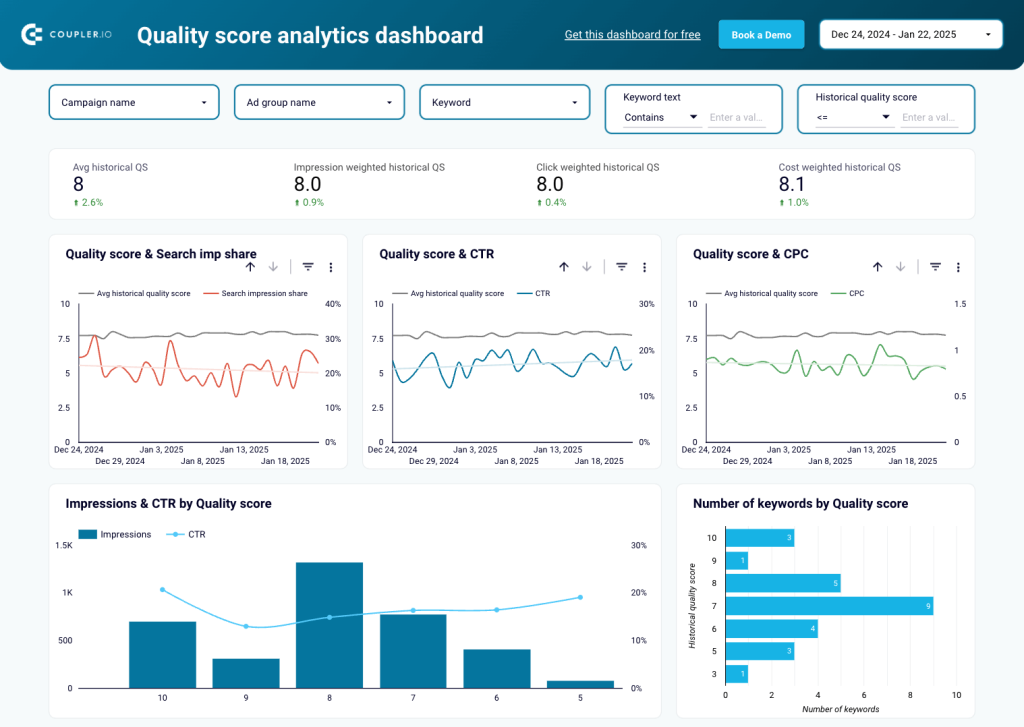
For example, you can compare your quality score with search impressions, CTR, or CPC dynamics to identify the campaigns driving growth. Use the table to analyze individual campaigns and their connection to quality score performance. You can also monitor your weighted and historical scores to spot opportunities for improvement.
Try this dashboard for free in Looker Studio. It only takes a few minutes to connect your data and get started.
Bonus: PPC multichannel dashboard for Google Ads, Facebook Ads, and other platforms
For cross-channel PPC analytics, use this dashboard that collects data from Google Ads, Facebook Ads, TikTok Ads, Quora Ads, Microsoft (Bing) Ads, LinkedIn Ads, and X (Twitter) Ads. It allows you to track your ad performance over time and compare results across different campaign types and platforms.

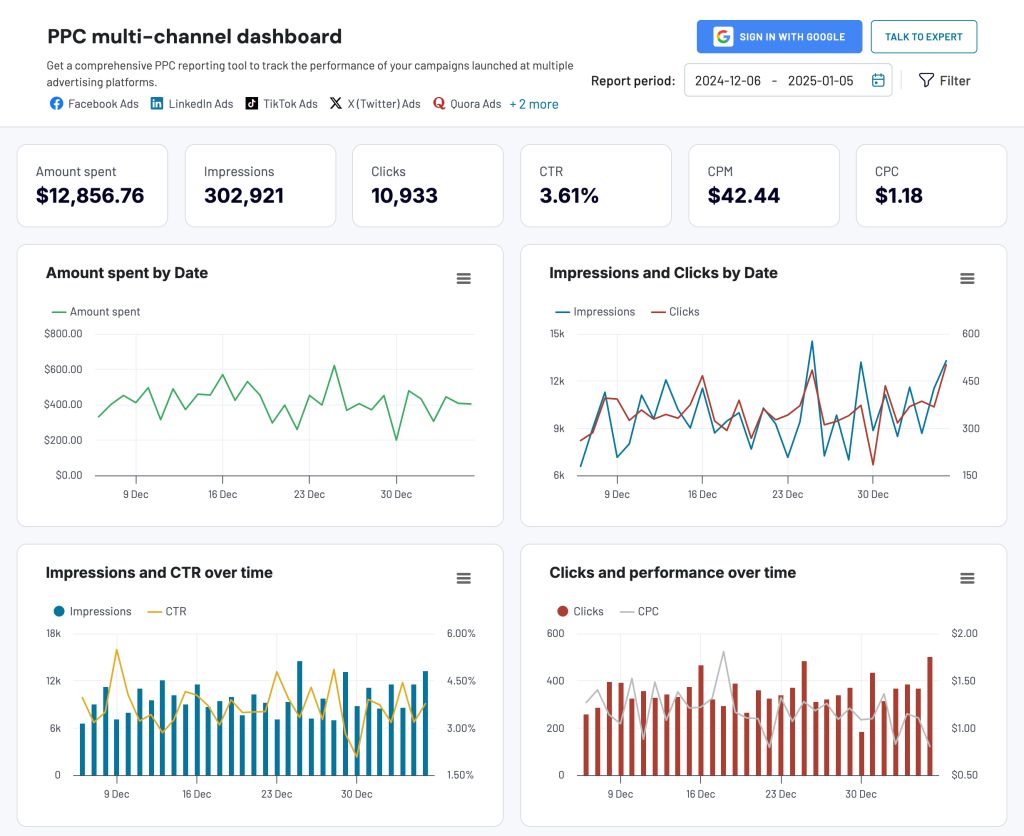
Simply connect Google Ads and other ad sources you want to monitor using the built-in Coupler.io connector. The dashboard is free, so try it right away!
Alternatively, you can use the dashboard as the template in Google Sheets, Looker Studio, Power BI, and Tableau. Select the one you prefer and try it out.


PPC multichannel dashboard in Google Sheets
Use a PPC dashboard designed for Google Sheets to track the performance of your campaigns across multiple advertising platforms.


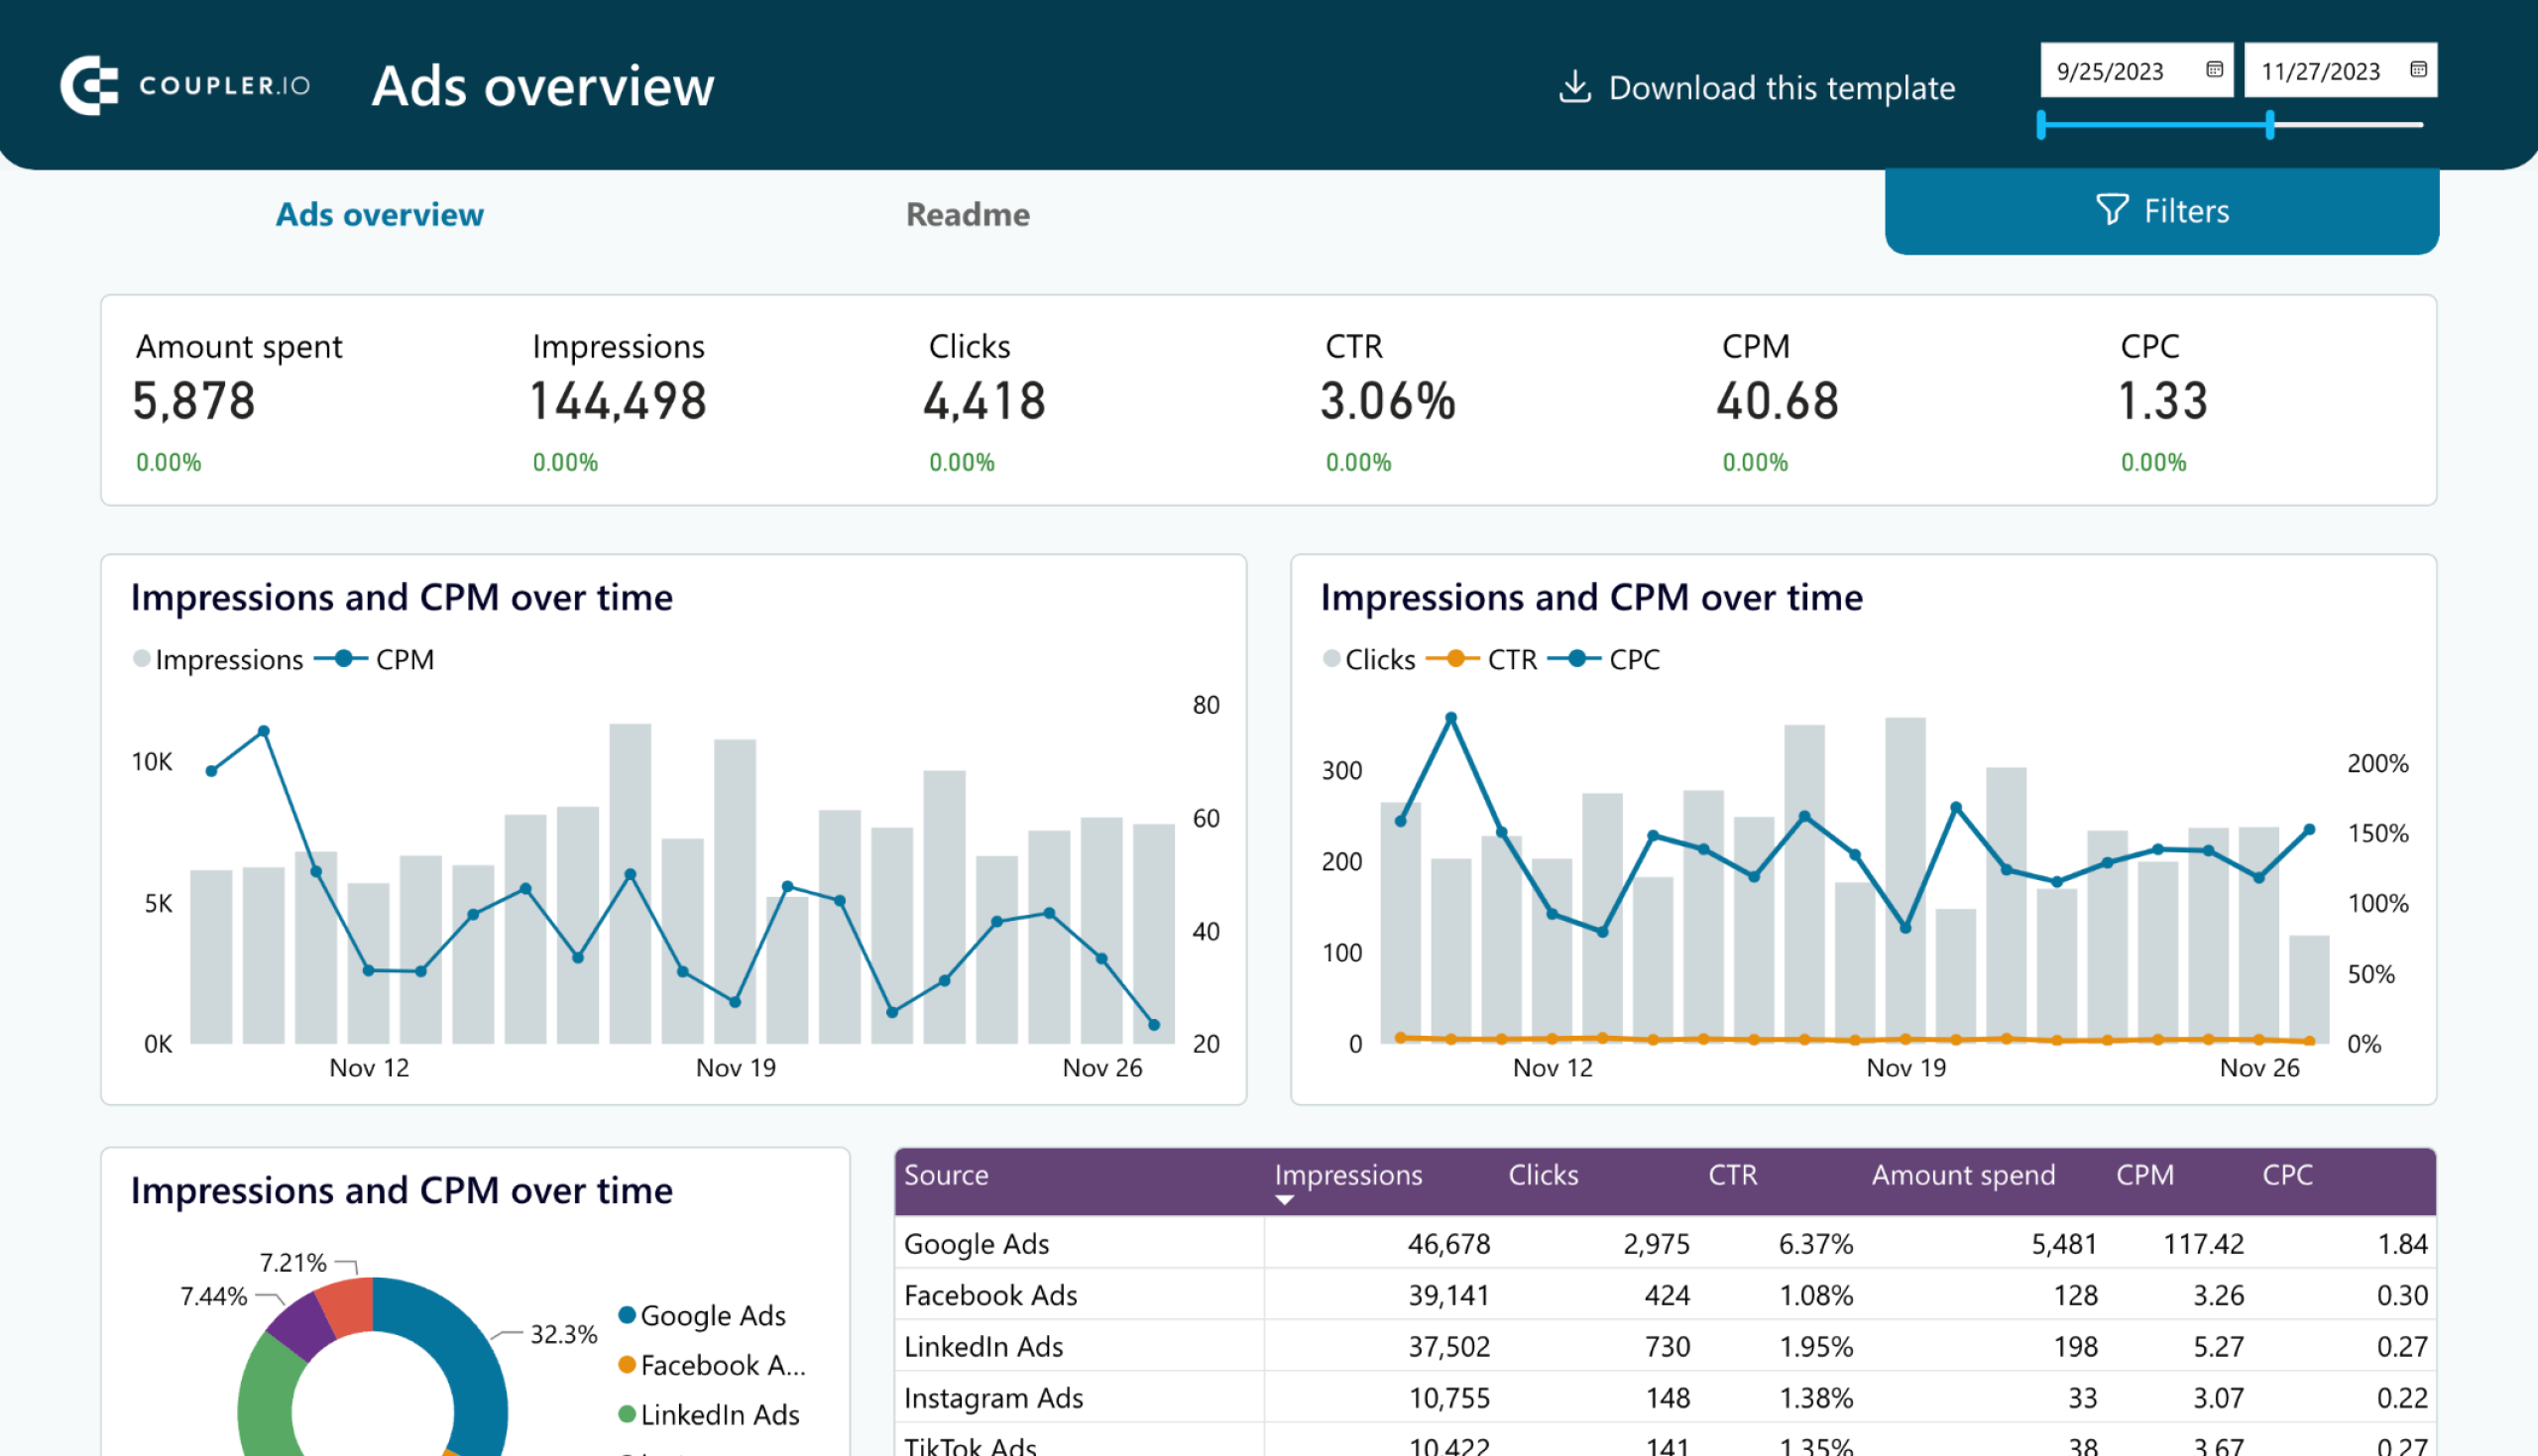
PPC multichannel dashboard in Looker Studio
Get a comprehensive PPC reporting tool to track the performance of your campaigns launched at multiple advertising platforms.

PPC multichannel dashboard in Power BI
Use a Power BI PPC dashboard for tracking and analyzing your advertising campaigns across multiple platforms.

PPC multichannel dashboard in Tableau
Track and analyze the performance of your advertising campaigns across various platforms using a one-stop PPC dashboard in Tableau
Download a CSV report to Google Sheets manually
The layman’s way to export your campaigns to Google Sheets is by downloading them as a CSV file. That only takes less than a minute, but the significant downside of this method is that you’re going to have to export a new report every time you need an update.
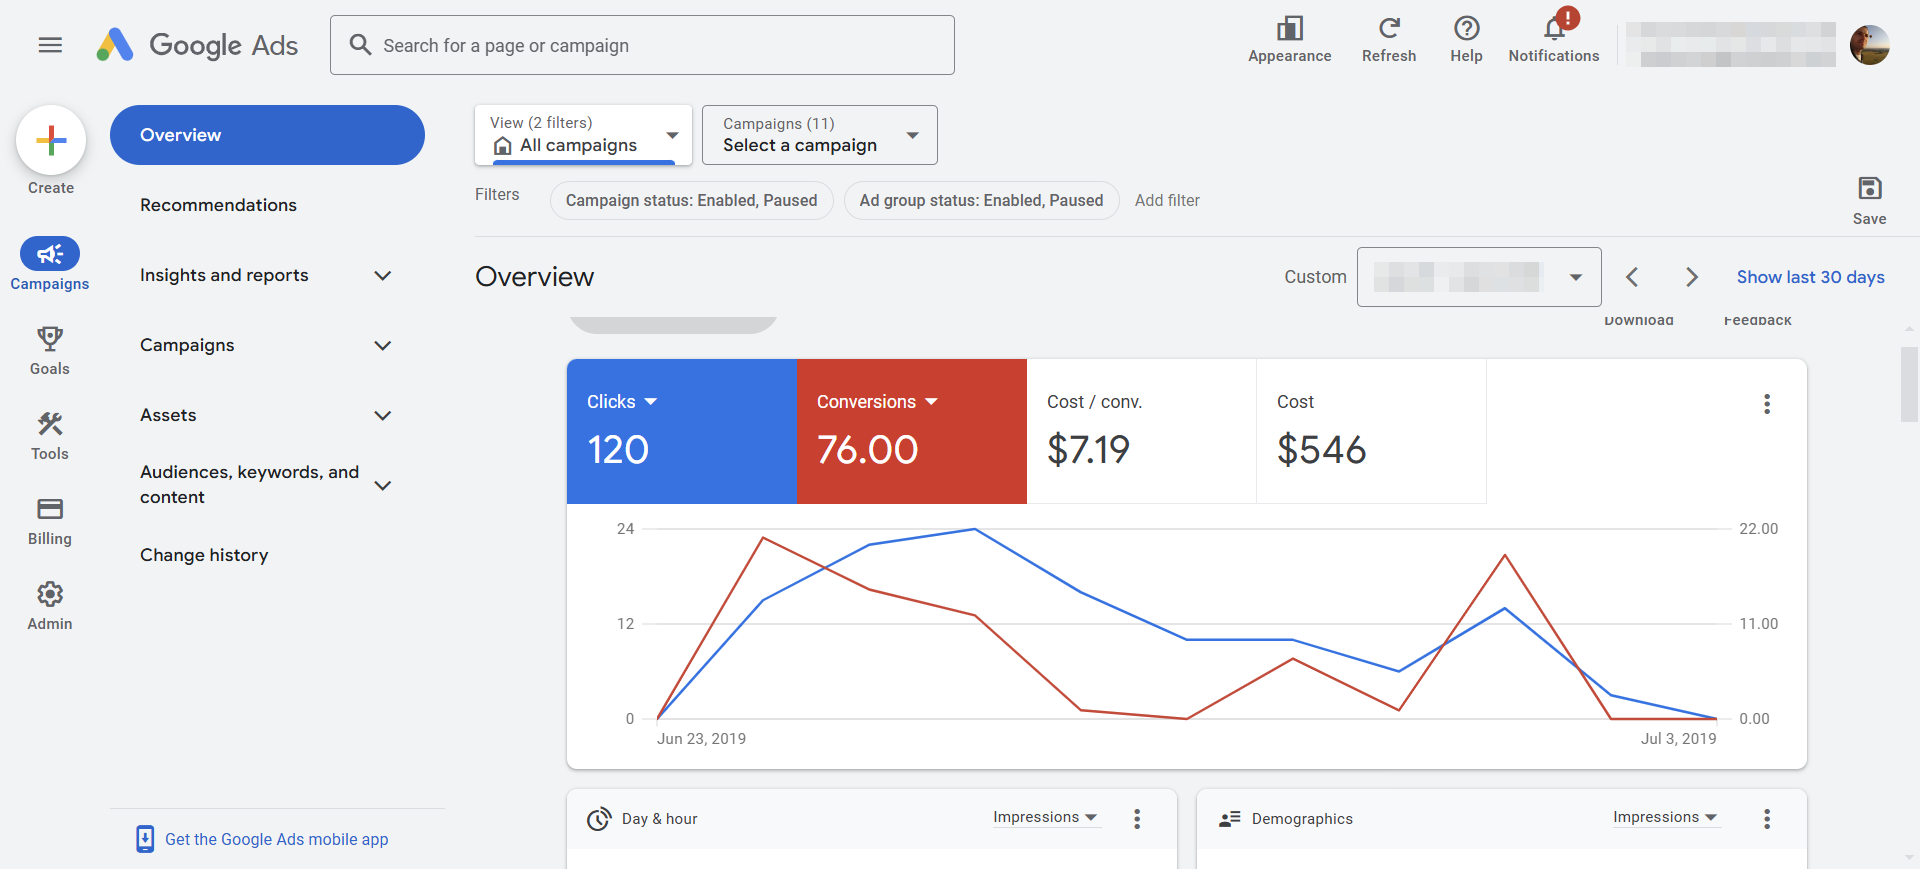
If you do need to export a CSV file, here’s what you do. Head down to your Google Ads account, open your campaigns, and find the “Download” button. It should be right above the table on the dashboard.

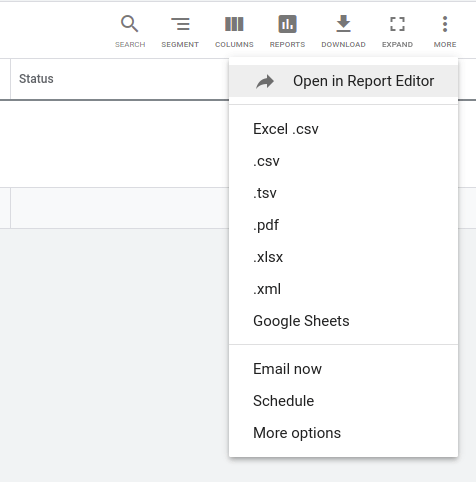
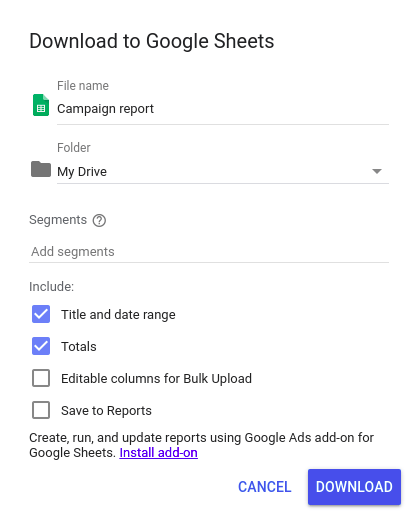
You do have the option to export the report you see in a .csv or .xlsx format, but you may also upload it right to Google Sheets. Choose the Google Sheets option at the bottom of the drop-down list, name the document, and you’re good to go.

You can export the other reports from Google Ads the same way. Go to the main dashboard, choose the report you want to export (Keywords, for example), and send it to your Google Drive.
Google Ads report to Google Sheets export with the native add-on
Let’s take a look at the second handiest option for exporting Google Ads to Google Sheets – using their native add-on. To install it to your Google Sheets, create a new spreadsheet, go to Extensions > Add-ons > Get Add-ons, and search for “Google Ads” in the pop-up window. Once you have found it, install it, and you’ll be able to use it in all Google Sheets.

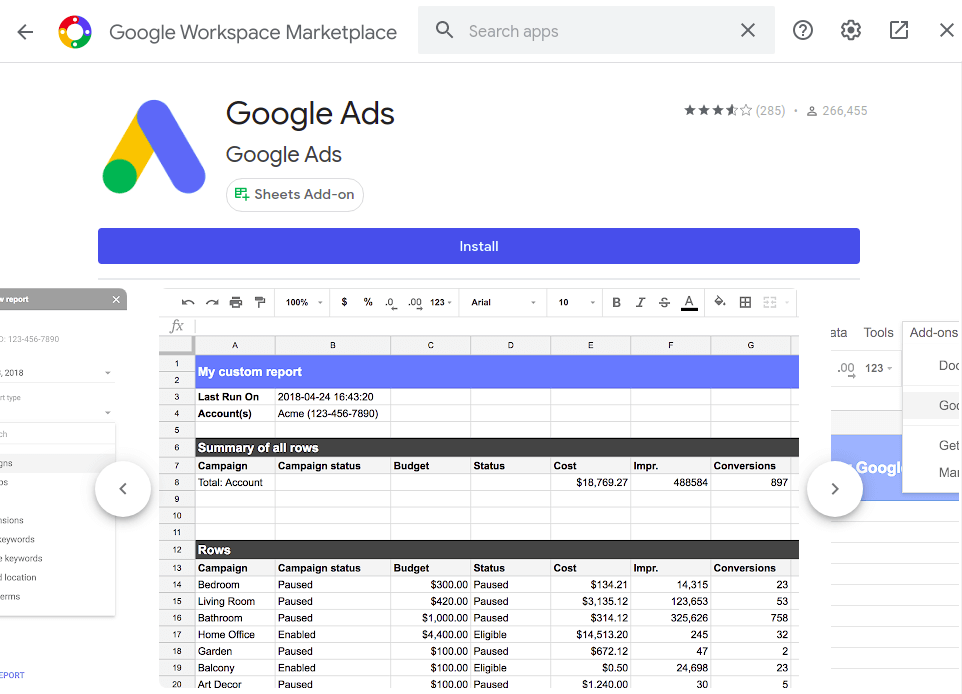
The Google Ads add-on works similarly to the Google Analytics add-on that we featured in Google Analytics to Google Sheets.
To create a new report, go to Extensions > Google Ads > Create new report.

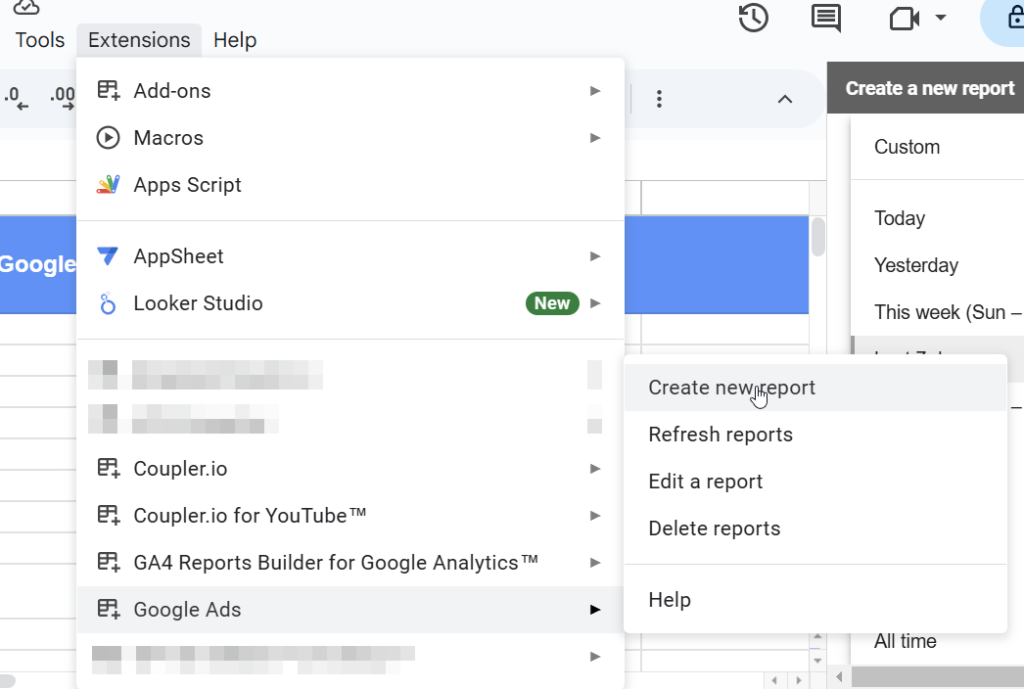
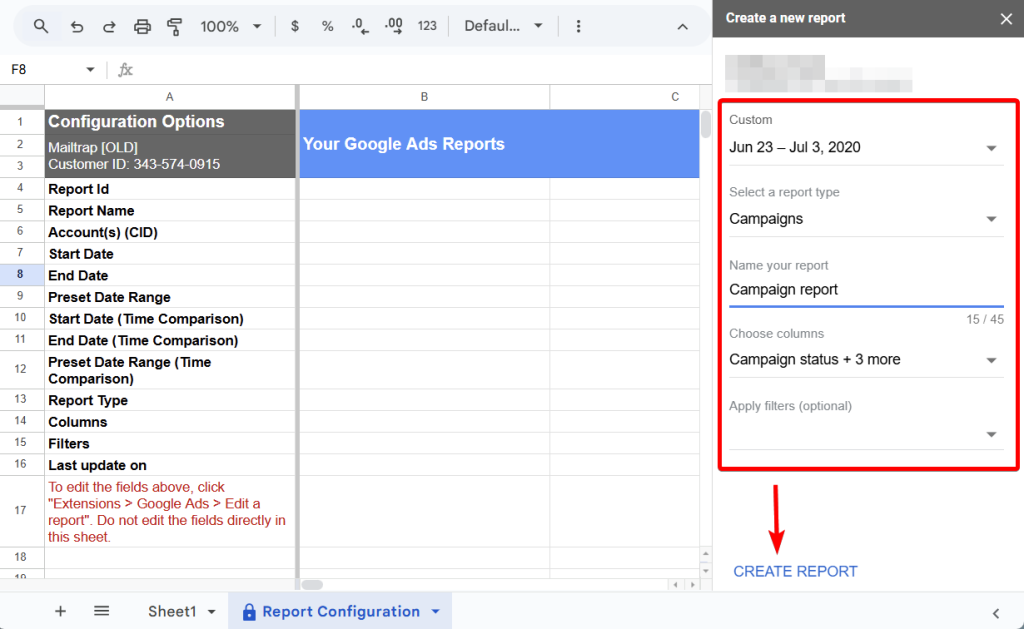
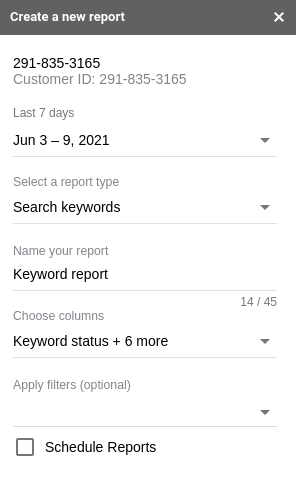
You’ll be prompted to sign in to your Google Ads account. Once in, you’ll see a new tab called Report Configuration and the very add-on on the right side of the spreadsheet. Here you need to specify the details to create your report:
- Choose a custom or preset period for the report.
- Select a report type, such as Campaigns, Search keywords, Landing page, etc.
- Enter the name of your report
- Choose columns to include
- Optionally, you can apply filters
Then click Create Report.

In a few moments, your new report will appear in a new sheet.

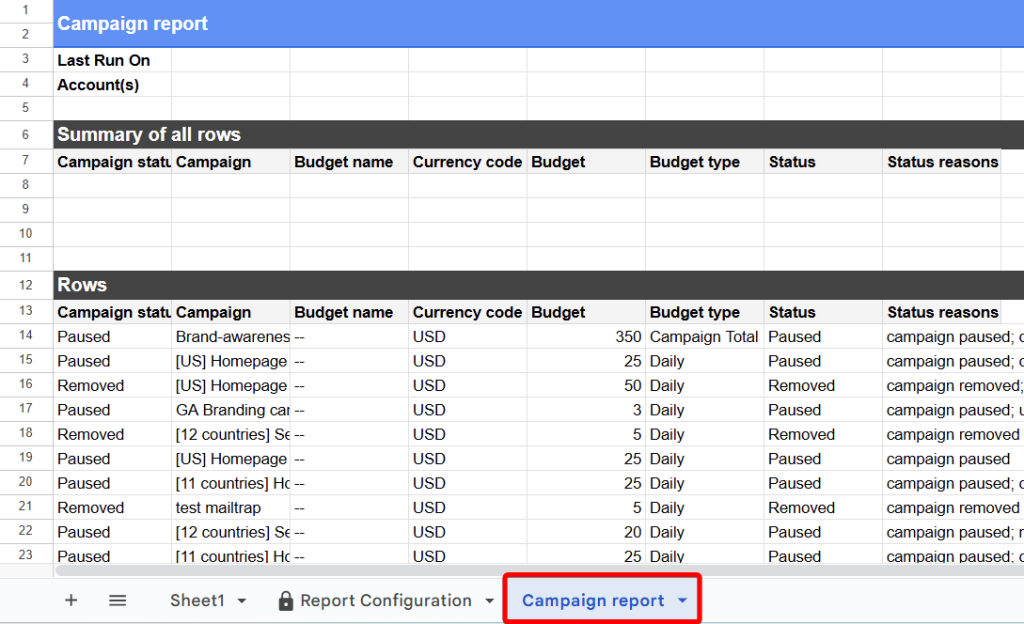
Once that’s done, the UI shows another set of buttons — you can refresh your reports or edit the report you’re seeing in this particular document. For your recurrent reports, you’re going to have to set the schedule to avoid refreshing it.
How to export Google Ads keyword report to a sheet
When you create another report, it’s going to be created in a new sheet. Let’s create a new report to see how it works. To export your list of keywords to a Google Sheet, go to Extensions > Google Ads, and click Create new report. Go to Select report type and choose Search keywords or Negative keywords.

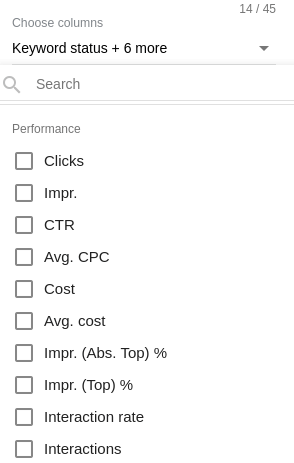
The standard report will contain the status of the keyword, the ad campaign associated with it, and several other columns. If you want to add more information to the report, click on the drop-down menu in the Choose columns and choose whatever data points you want.

Once you have the report ready, you can refresh it right from the Google Sheet. To do that, go to Extensions > Google Ads > Refresh report. You can also edit it or delete it if you want.
Why export Google Ads to Google Sheets or another destination?
Google Ads data provides you with insights into your users’ Acquisition => Behavior => Conversion cycle. So, you can understand how you acquire users, how they behave on your website or app, and what makes them convert. All this data is displayed on the Google Ads dashboard, and you even get recommendations on how to optimize your campaigns.

However, this format isn’t optimized for reporting. Yes, it gives you quick insights into the health of your campaigns, but it’s not suitable for detailed analysis or presenting findings to stakeholders.
Reporting with Google Sheets is much more flexible. You can build custom dashboards, create charts, and easily share them with stakeholders. Everything can be automated; no need for manual manipulations.
Additionally, you can use Google Sheets as a backup database and analytics dashboard for your business. Import data from other sources besides Google Ads to have everything in one place. For example, if you use Coupler.io, a data-importing solution, you can pull records from Xero, Pipedrive, Shopify, and many other apps and sources.
Besides, Coupler.io lets you pull data not only to Google Sheets but also to Excel, BigQuery, Looker Studio, and Power BI. For example, here is how you can connect Google Ads to Power BI, export Google Ads to BigQuery, Google Ads to Redshift, and even Google Analytics to BigQuery using this tool.
Optimize your workflow with an automated Google Ads to Google Sheets integration
Exporting Google Ads data manually or with the native add-on is a relatively hassle-free way of going about PPC analytics. If you want a more customizable option, you’ll have to export the data through a third-party app. This will not only give you a way to export anything and everything from your account but will also allow you to export data from dozens of different applications.
If you want a more customizable and automated option, you should export the data through a third-party app, such as Coupler.io. This will not only give you a way to export anything and everything from your account but will also allow you to export data from dozens of different applications. Good luck with your data!
Automate Google Ads reporting with Coupler.io
Get started for free