Creating custom dashboards or reports with Tableau is a convenient way to monitor and analyze your Google Ads performance. You can tailor your dashboard to display only the metrics and KPIs relevant to your marketing goals. It can also be useful to connect other ad sources to your dashboard to get a comprehensive overview of your advertising efforts.
In this article, we explore various methods for exporting your Google Ads data to Tableau, so you can choose the best option for your needs.
Ways to transfer your ad data to Tableau
There are a few methods you can use to load Google Ads data to Tableau.
- Exporting data automatically with Coupler.io
This reporting automation platform lets you collect, transform, and load your Google Ads data into Tableau with just a few clicks. Once you create the connection between the apps, Coupler.io will automatically refresh your ad data in Tableau according to the selected schedule. As a result, your Google Ads KPI dashboard will always display fresh, analysis-ready data. This option requires no coding, and you don’t need any tech knowledge to use it, which makes it a good choice for marketers.
- Transferring data with a downloadable connector
An alternative way is to download and configure a third-party connector like CData on your device. The major advantage of this method is that it gives you flexibility and control. You can use SQL queries to extract specific data from Google Ads and import it into Tableau Desktop. The limitation is that the setup and configuration process is somewhat complex and time-consuming. Also, many downloadable third-party connectors do not disclose their prices publicly, making it difficult to evaluate costs upfront.
- Using Google BigQuery Data Transfer Service
If you’re already using Google BigQuery, you can take advantage of BigQuery Data Transfer Service to move your Google Ads data to Tableau. This involves setting up two native connections: one in BigQuery to access your Google Ads data, and another in Tableau to transfer ad data from BigQuery. The advantage of this option is that you can transfer data on a schedule with native functionality, without third-party solutions. This multi-step process can be a viable option if you need to perform in-depth data analysis before visualizing your dataset. Otherwise, a direct connection from Google Ads to Tableau is more efficient and cost-effective.
- Building an integration with Google Ads API
This option is for those who are comfortable with coding. The Google Ads API lets you access and retrieve data from your Google Ads account and load it to Tableau. You can use programming languages like Python, Java, or JavaScript to write scripts that work with the API. This way, you can customize the data extraction process to fit your specific needs. This method gives you a lot of flexibility and control over your data, but it does require some good programming skills to set up and maintain.
- Exporting and importing data manually
If the data export between these apps is a one-time thing, then this method may be suitable for you. All you need to do is download your Google Ads data either as a CSV, XLSX, PDF, or TSV file and then manually upload it to Tableau. The downside is that your data will not be automatically updated. When you need to work with the latest data, you’ll have to repeat this process over and over again. This makes it time-consuming and labor-intensive.
Now, let’s look at how to use these options in detail.
Export Google Ads to Tableau automatically with Coupler.io
Connecting Google Ads to Tableau with Coupler.io can be done in three steps.
1. Extract your Google Ads data
In the widget below, we already pre-selected Google Ads as a data source and Tableau as a destination. To start transferring your data, click Proceed.

You will be asked to create a Coupler.io account first – it’s free, no credit card required.
Next, follow the onscreen instructions to connect your Google Ads account. Then, select the data category you want to export. Options include Ad group performance, campaign performance, and more.
If needed, set the start and end dates for the report period and define the conversion window for your data. The importer comes with default settings, but you can change them to fit your needs.

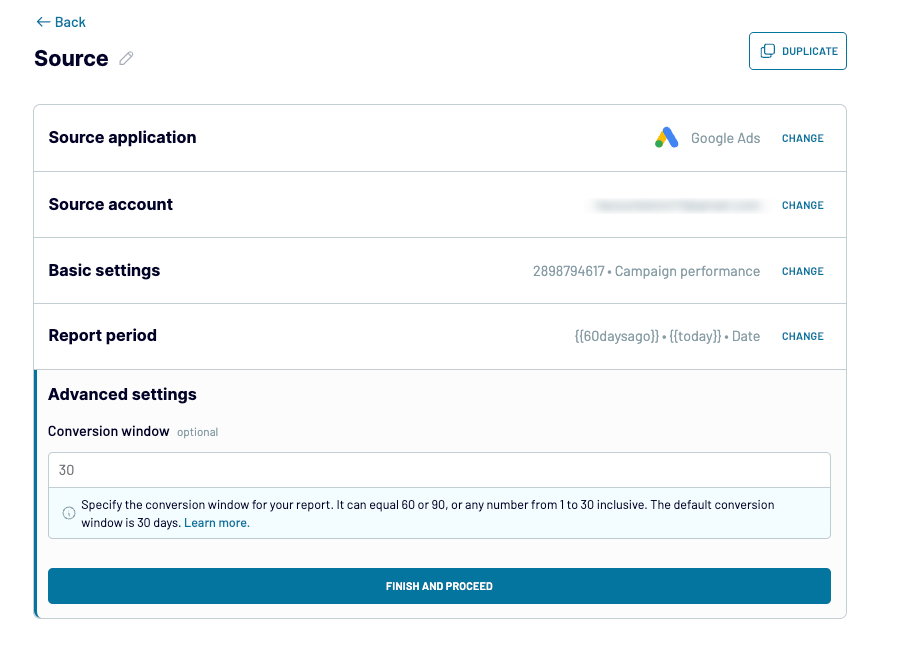
Once you’ve set these preferences, proceed to the next step.
2. Organize and transform your data
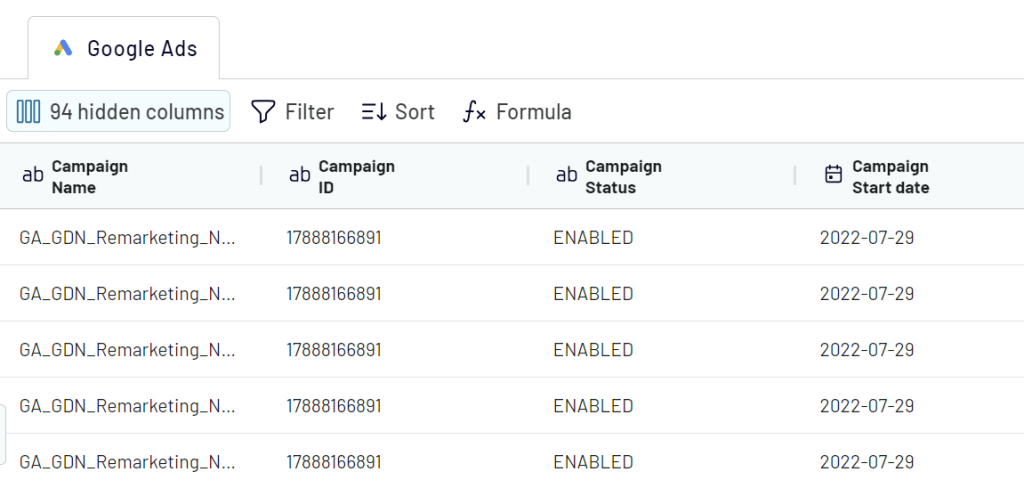
Before exporting, take a moment to preview your data to make sure it’s accurate. With Coupler.io’s ETL functionality, you can:
- Rename, rearrange, hide, or add columns.
- Filter and sort your data.
- Use formulas and perform calculations.
- Combine data from multiple accounts or applications (for example, from different Google Ads accounts or from several ad sources).

Once everything looks good, proceed to loading your data.
3. Load data and schedule updates
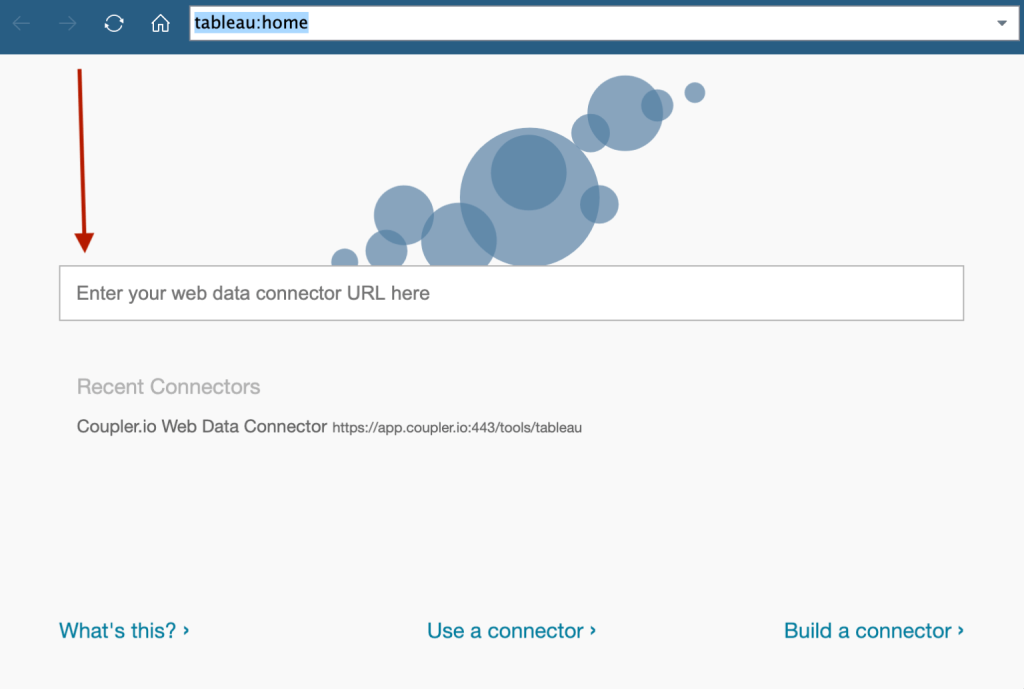
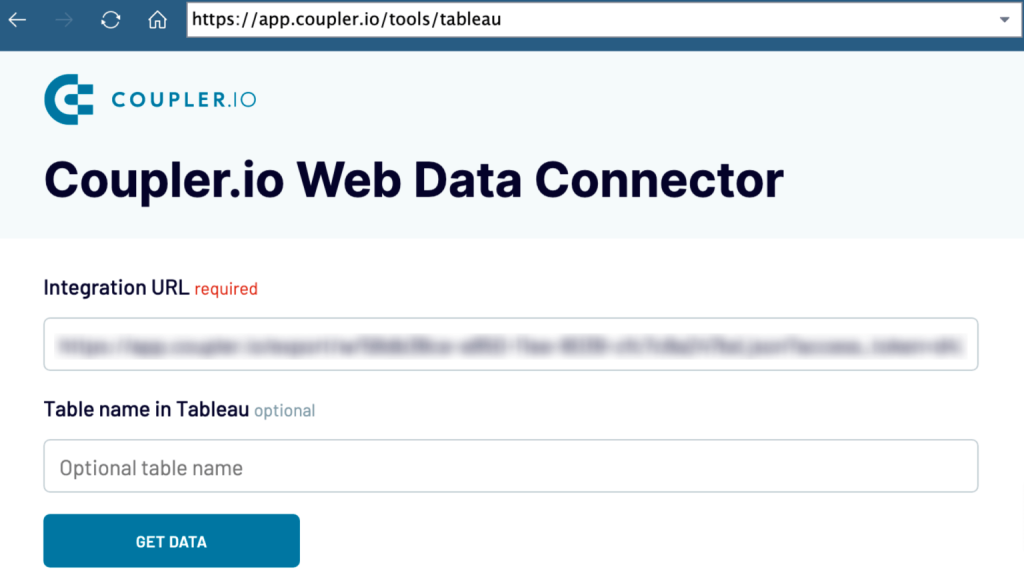
Open Tableau Desktop. In the Connect pane on the left, under To a Server select Web Data Connector. In the provided field for URL, paste this link: https://app.coupler.io/tools/tableau and hit enter.

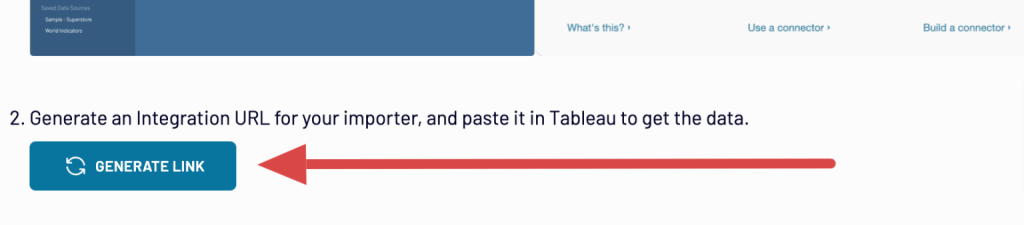
Go back to Coupler.io and click the Generate link button in the destination section. Copy and save the integration URL, you will need it a bit later.

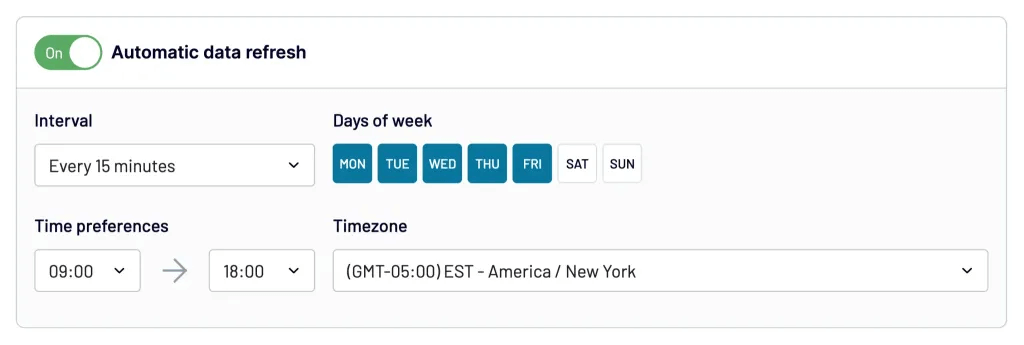
Then, enable Automatic data refresh to get near real-time updates of your Google Ads data in Tableau. Choose how often you want to refresh your information: monthly, daily, or every 15 minutes. Run the importer.

After that, on Tableau Desktop, paste the integration URL you copied earlier and click Get Data to import your Google Ads data into Tableau.

With your information now in Tableau, you can start visualizing it by using charts, graphs, maps, etc. For instance, you could set up a dashboard to monitor daily ad spend, conversion rates, cost per click, and CTR. Tableau makes it simple to convert your raw data into insights that can guide your marketing decisions.
How to visualize Google Ads data in Tableau using a dashboard template
You can quickly build a Google Ads dashboard in Tableau by visualizing your data automatically with a ready-made template.
Coupler.io offers a free PPC dashboard template to monitor ad campaign performance across multiple platforms including Google Ads. This dashboard provides an overview of the key metrics such as impressions, clicks, CTR, CPM, CPC, and more.

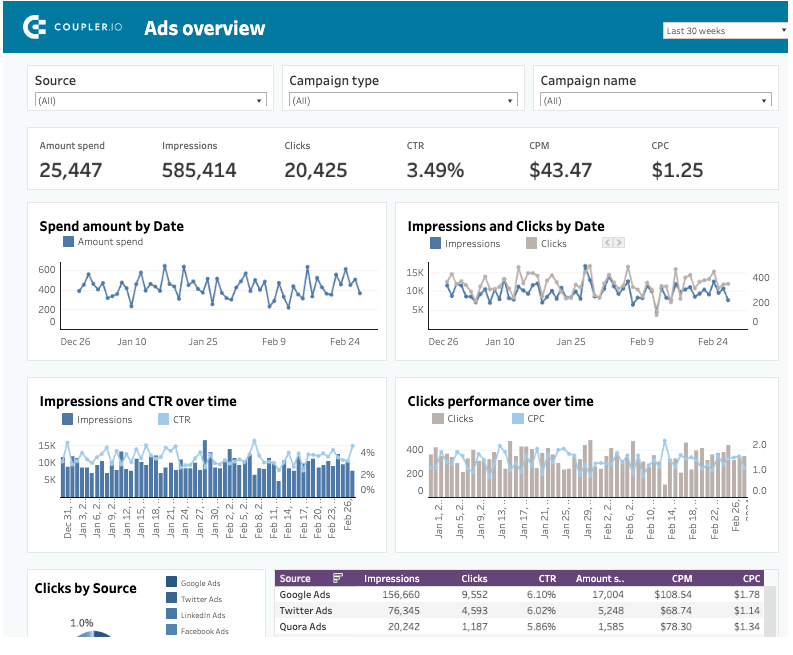
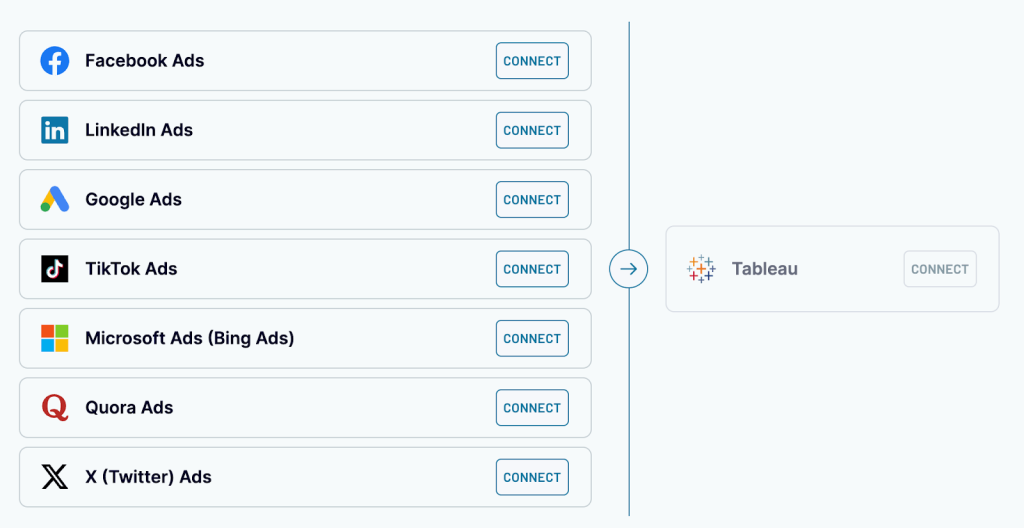
Apart from Google Ads, this template can be connected to other ad platforms: Facebook Ads, LinkedIn Ads, Twitter Ads, TikTok Ads, Microsoft Ads, and so on. This allows you to conduct cross-channel analysis – for example, to see how the same campaign performs on different platforms and where it gets the best CTR and CPC. But if that is not needed, you can connect only Google Ads.
To start using this dashboard, open the template and go to the Setup Guide tab. Then, follow the instructions to connect your Google Ads account and other ad data sources, if needed. You can connect as many as you require.

Once this is ready, copy the integration URL and run the importer. Then, download the template using the button in the Setup Guide. Finally, provide the integration link copied earlier in the Data Source section in Tableau.
This process takes just a few minutes. Once the connection is set, Coupler.io will populate the dashboard with your ad data.
Link Google Ads to Tableau using desktop connectors
While Coupler.io works in a browser, there are other solutions that can be downloaded on your computer. For example, cData provides a Google Ads connector for exporting your ad data to Tableau. Here are the steps to complete to set it up:
- Start by downloading the Google Ads driver. You can choose either the JDBC driver or ODBC driver, depending on what is compatible with your system.
- Follow the on-screen instructions to install the downloaded driver.
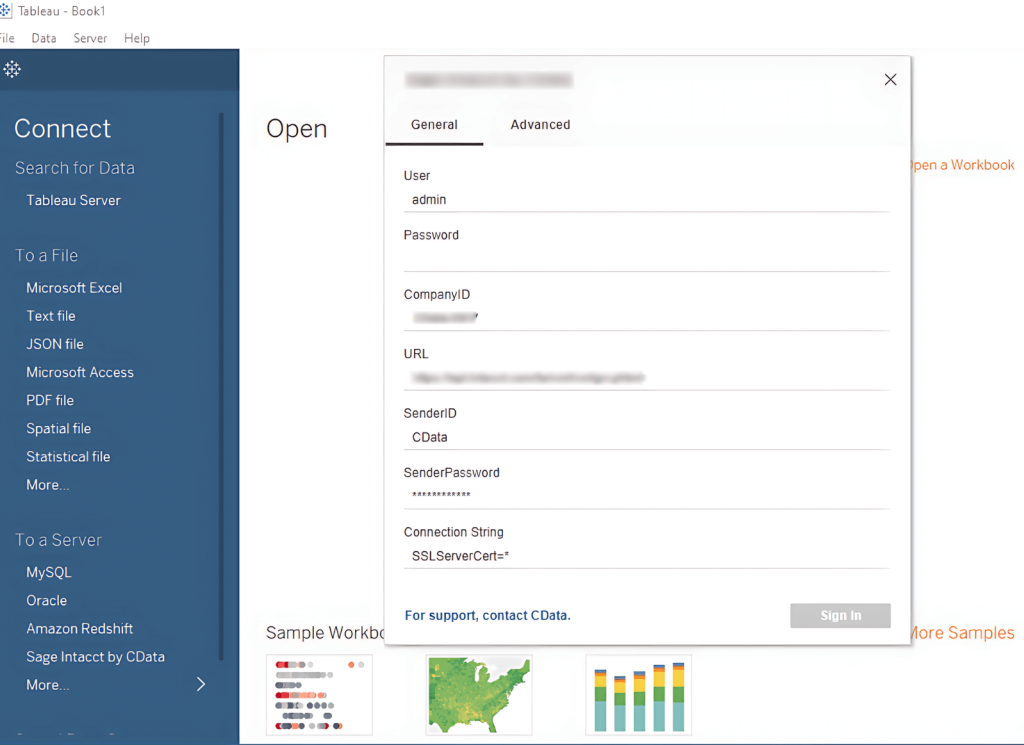
- Once installed, go to Tableau, click on To a Server, and select Google Ads by CData.
- In the connection window that appears, enter the necessary details to link your Google Ads account. Provide the API key, Client ID, and Client Secret, then click Sign In.

Once connected, drag and drop fields from your Table to build data visualizations. Alternatively, you can switch to writing custom SQL queries by clicking on Data > SQL Query to extract the needed data fields to a new sheet.
Transfer ad data using Google BigQuery Data Transfer Service
Tableau daoesn’t have a native Google Ads connector, but it offers one for BigQuery. At the same time, you can relatively easily send your Google Ads data to BigQuery as both apps are a part of Google infrastructure.
So, the data flow for this method is broken down into two parts. First, we move data from Google Ads to BigQuery. Then, we move Google Ads data from BigQuery to Tableau with a native connector.
1. Google Ads to BigQuery
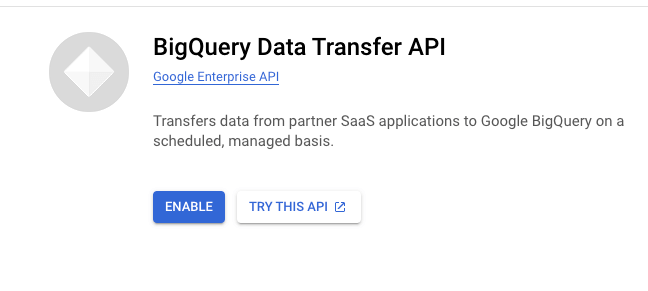
- Go to Google Cloud Console and navigate to the API library.
- Search for BigQuery Data Transfer Service API and enable it.

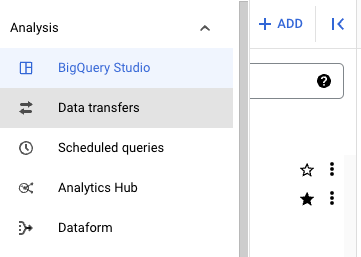
- Select a BigQuery project you want your data to be in. On the left, click Data transfers.

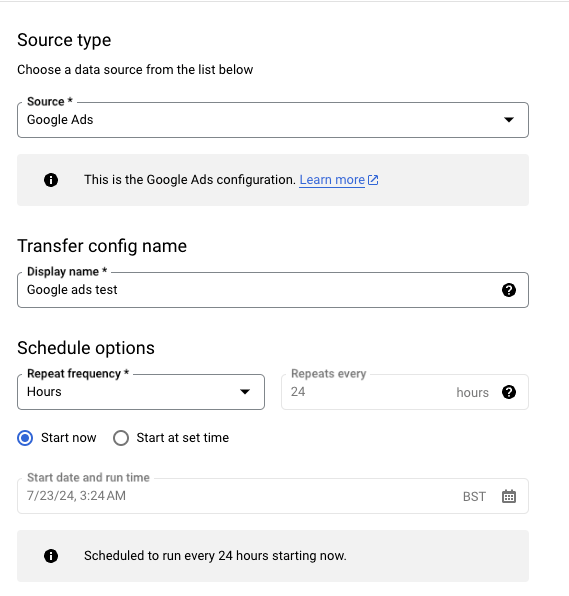
- Click Create a Transfer. In the Source type, select Google Ads as your data source.
- Set a schedule for how often you want the data to be transferred. The default is 24hrs.

- Configure the destination settings by following the onscreen prompts.

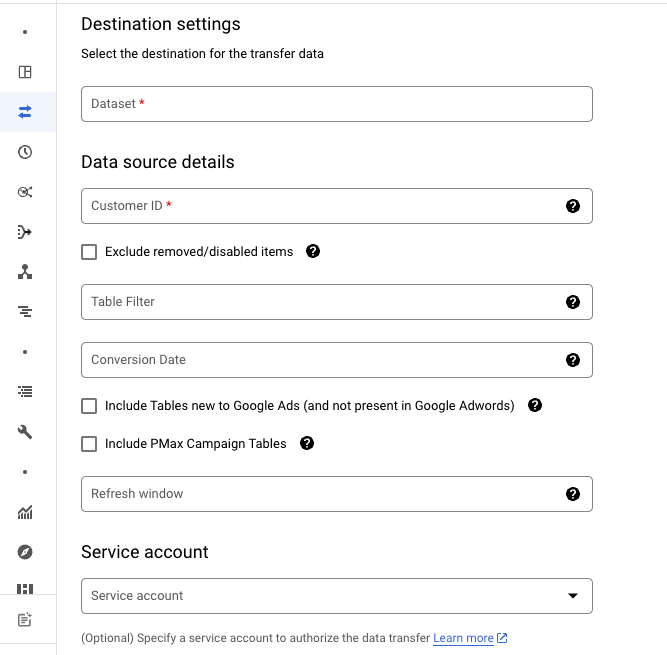
- Review your settings and save to start the transfer. Your Google Ads data will be moved to BigQuery.
2. Connect BigQuery to Tableau
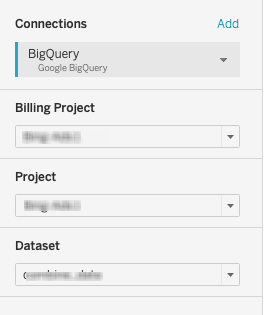
- Open Tableau Desktop and in the Connect pane on the left, under To a Server, select Google BigQuery as your data source.
- Next, authenticate your Google account to access your BigQuery project.
- Then, select your project and the dataset that holds your Google Ads data.

You can now work with your ad data in Tableau.
How to load your Google Ads data to Tableau manually
To export your ad data manually, you’ll need to:
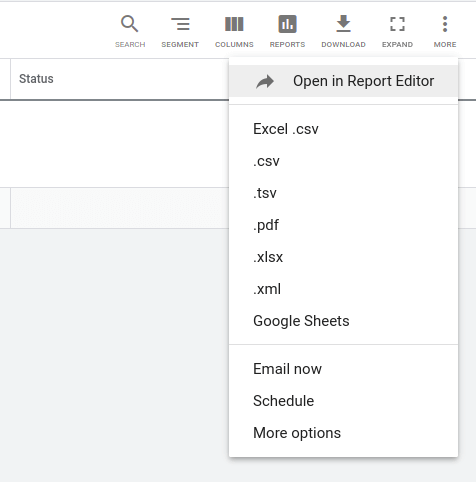
- Go to your Google Ads account and click on Campaigns.
- Click on Download and select either .csv, .tsv or .xslx from the list as they are Text file formats supported by Tableau.

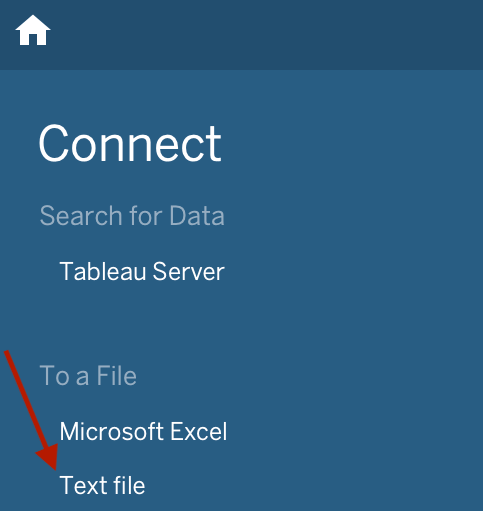
Open Tableau Desktop, click on the Text file, and upload your downloaded data. Once it’s imported, you can start visualizing your data.

Manual data export is simple but requires you to update your data by hand every time you need to work with the latest metrics.
Improve your Google Ads campaign analysis
Using BI tools like Tableau or Power BI is an effective way to visualize your Google Ads data and make informed decisions to optimize your advertising campaigns. However, for accurate decision-making, having the latest data is crucial, and automation is the key to achieving this. Coupler.io makes it easy to import your Google Ads data into Tableau efficiently and quickly. With a simple setup process and scheduled automated data refreshes, you’ll always have the latest data available for timely analysis.
Automate data export with Coupler.io
Get started for free