Google Analytics 4 is a free marketing analytics platform widely relied on to understand website and app users. This is especially relevant for agencies managing client projects, where expertise in GA4 is a must for delivering actionable insights into marketing efforts. But how exactly do they use it to analyze and report on their clients’ marketing performance?
We’ve worked with hundreds of agencies and studied their workflows to identify the key reasons they implement GA4. So, let us break down our findings and show you how to extract even more value from this platform, especially when combined with Coupler.io – a tool many agencies trust for automated reporting and deeper analytics.
Why your agency needs Google Analytics 4
Using Google Analytics might come down to one reason: your clients already have it, so what other option is there? ? But in all seriousness, this is one of the few tools that shows you for free which websites drive traffic to your site, plus there are many more reasons why you need it:
- Measure how well campaigns drive desired outcomes and track client revenue: By setting up conversions and goals in Google Analytics 4, you’ll track user behavior across touchpoints, attribute results to specific channels or campaigns, and define revenue. This will help you prove the value of your marketing efforts to the client.
- Keep your clients informed about marketing effectiveness: You can integrate your GA4 data and records from other marketing platforms into a single report in a spreadsheet or BI tool. By sharing this report with the client, you’ll provide them with a transparent, unified view of the marketing outcomes you achieved.
- Identify anomalies in your clients’ metrics and traffic as soon as they occur: With Google Analytics custom insights, you can set conditions for anomalies – like drops or spikes in metrics – and enable email alerts. This way, you’ll catch and fix issues before they impact marketing performance, ensuring the client receives consistent results.
- Provide clients with easily understandable and always accessible insights: Using prebuilt templates with built-in connectors for GA4 and other apps, you’ll have live dashboards created instead of building reports yourself. This lets you present key performance metrics in a way that clients can grasp without complex analytics.
And this doesn’t just stop at the reasons for using GA4 – there are numerous advantages to adopting this tool for your marketing analytics.
Benefits your agency can gain from GA4
Google Analytics 4 offers benefits like native integrations with other apps, custom analytics capabilities, data-driven attribution, and numerous tutorials (if you’re not experienced with this tool).
Native integrations
In addition to tracking user interactions on websites and apps, Google Analytics captures data from other platforms in real time. So you can analyze your client’s marketing results across various channels. For example, GA4 connects natively with tools like Google Ads for paid ad insights, Search Console for organic search data, and Firebase for app performance.
Additionally, there’s a built-in integration to connect GA4 to BigQuery for advanced data analysis. For the purpose of delivering meaningful reports to clients, you’re free to use a native GA 4 Looker Studio integration or one for Google Sheets.
Google Ads
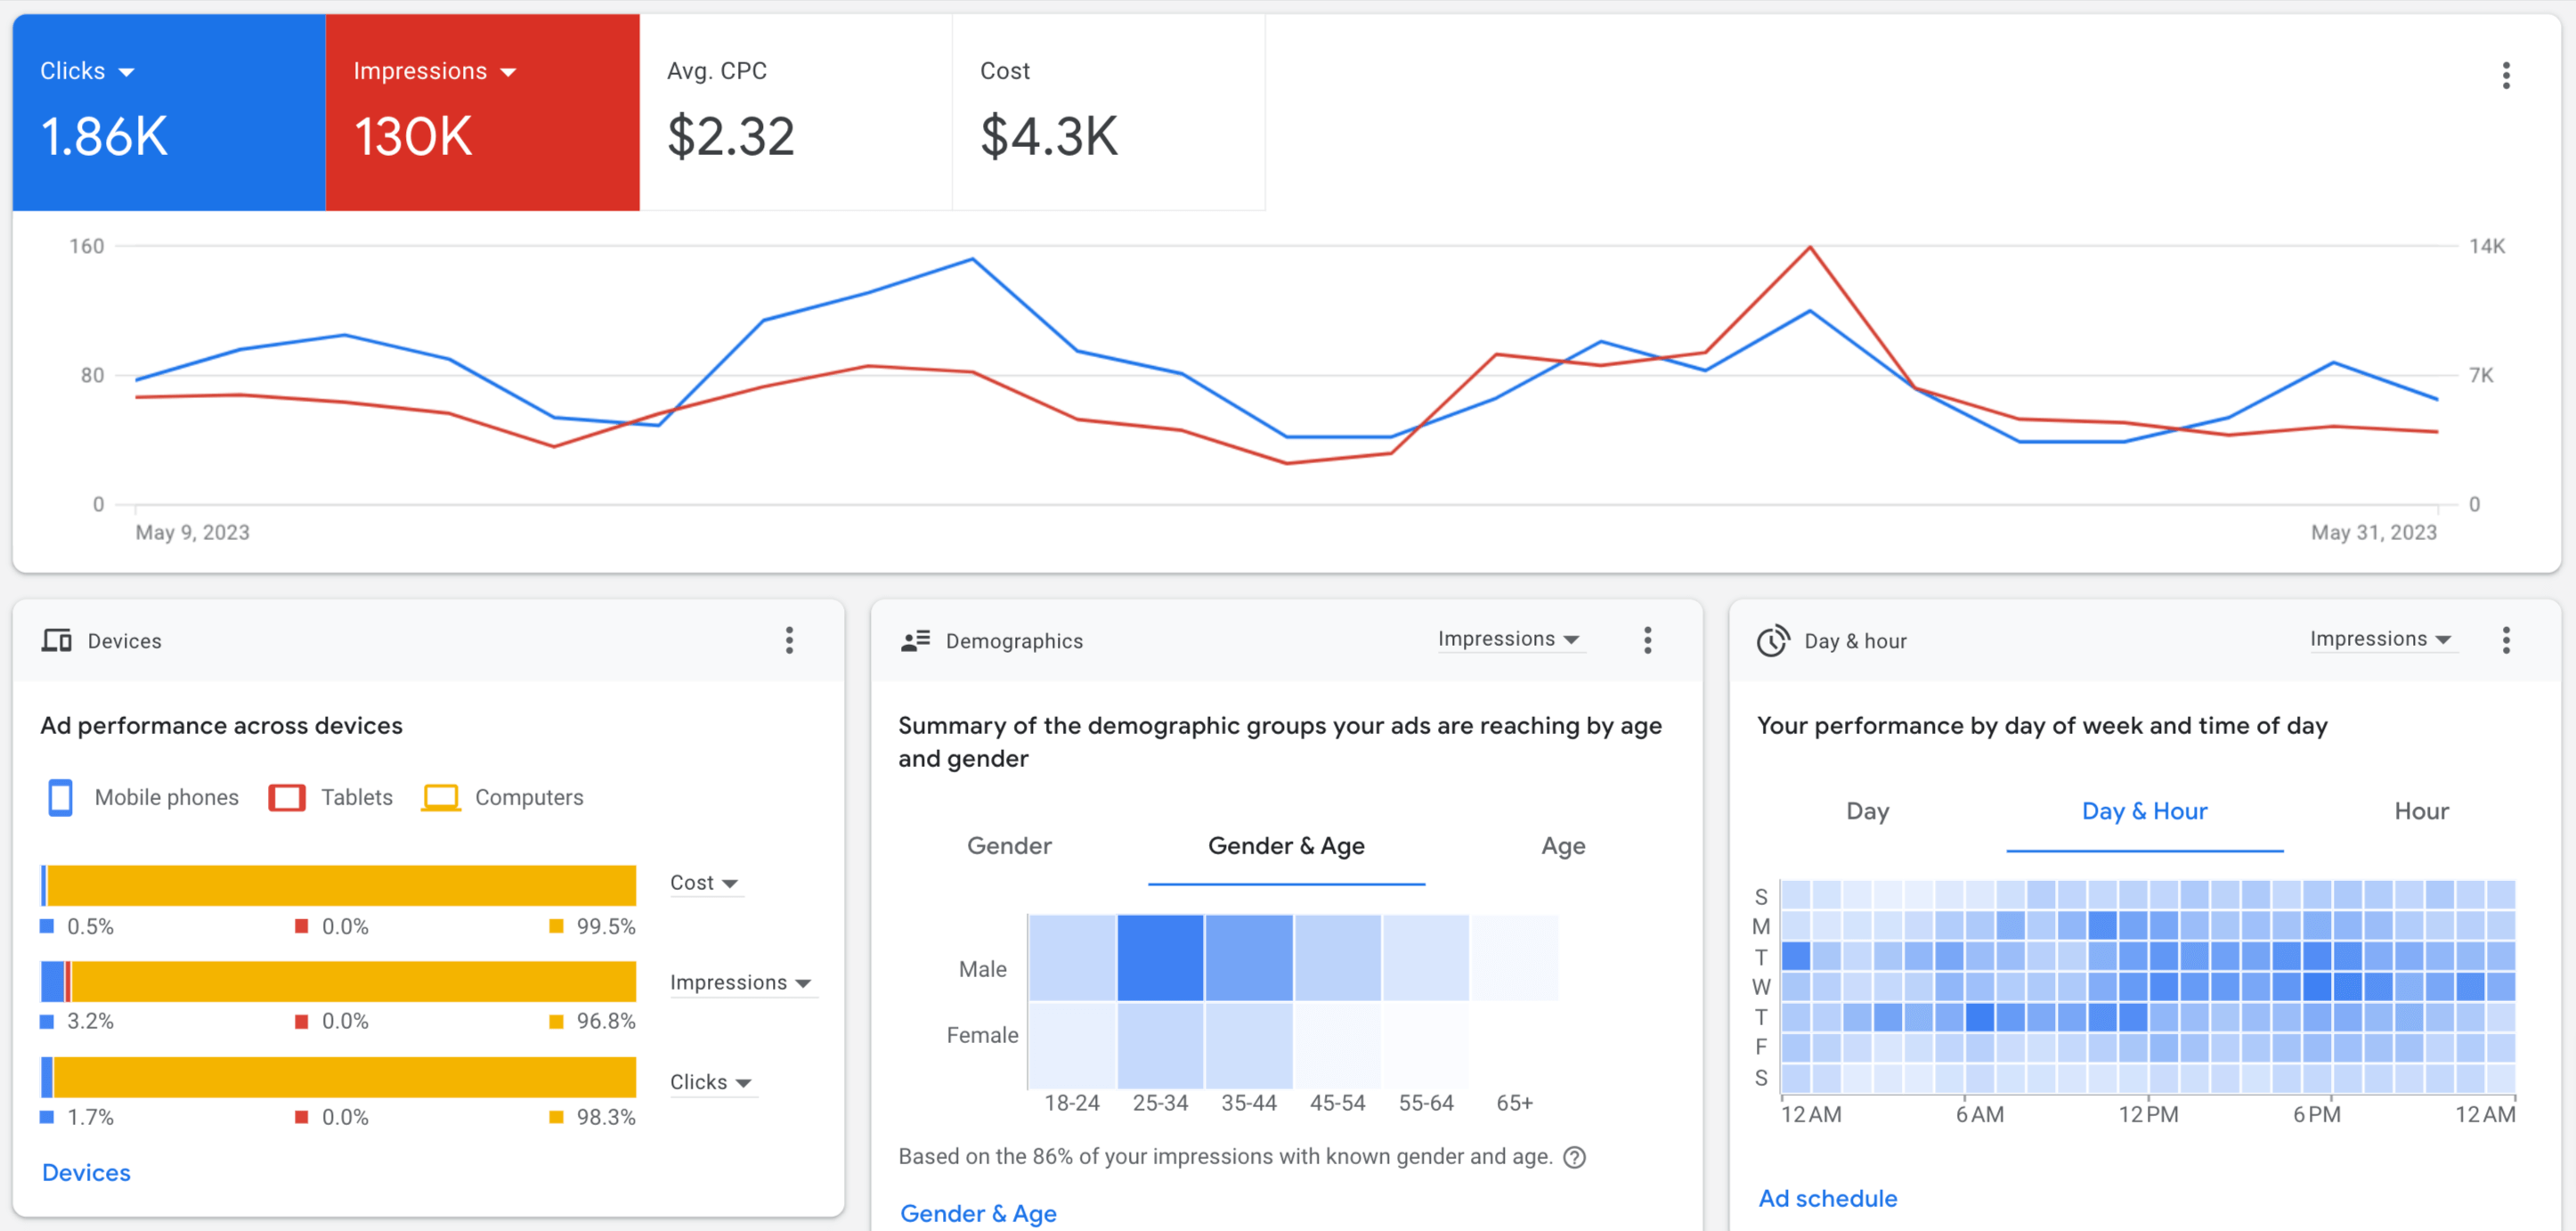
GA4 integration with Google Ads lets you understand the outcomes of the paid ad campaigns you run for your clients. You can track metrics such as clicks, impressions, and cost per click (CPC), gain insights into audience demographics and device performance, etc. All of this combined helps you make data-driven optimizations to the PPC campaigns, such as better targeting and bid adjustments.
Search Console
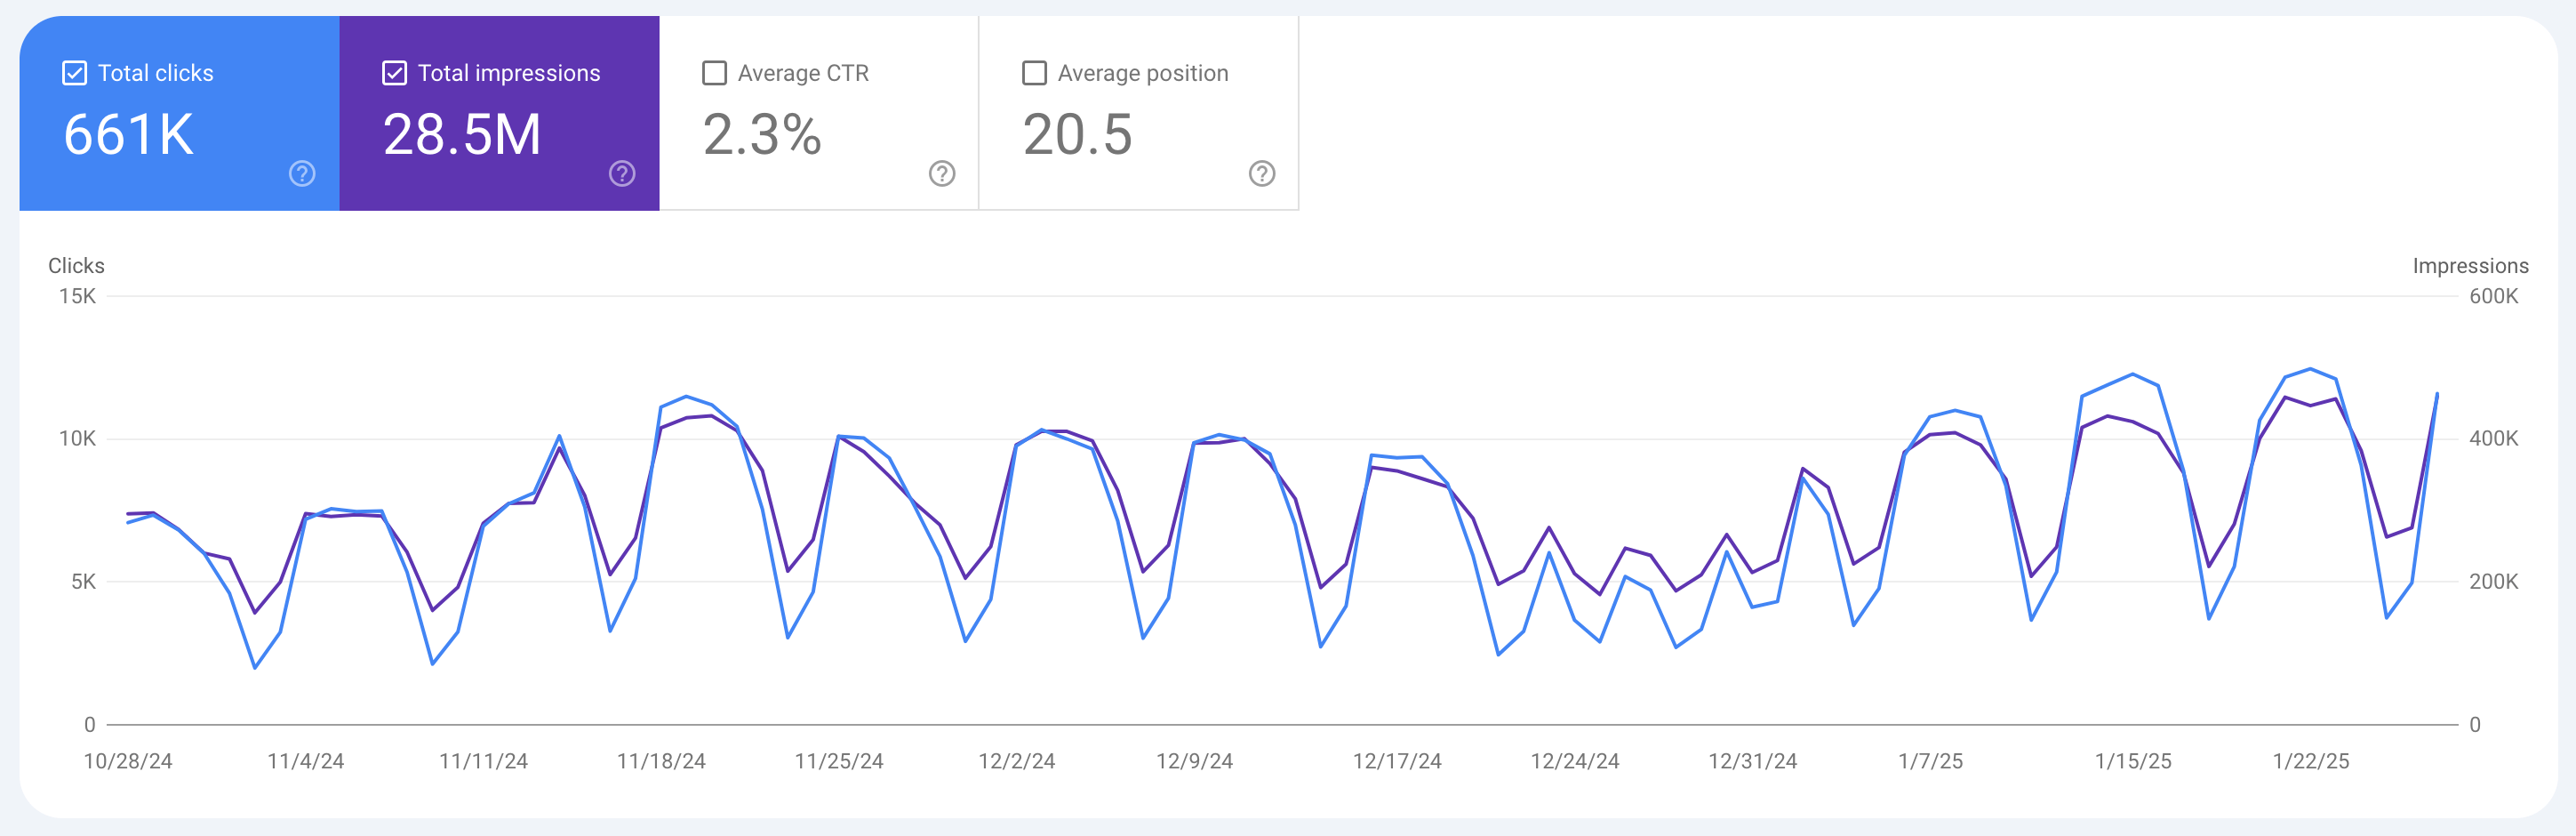
With GA4 connected to Google Search Console (GSC), you can overview the organic search performance of your client’s website in detail. You’ll be able to track clicks, impressions, queries driving traffic to the site, click-through rates (CTR), average position, and more. This lets you know how Google crawls and indexes the website, assess technical SEO health, and, thus, spot opportunities to optimize organic search traffic.
Firebase
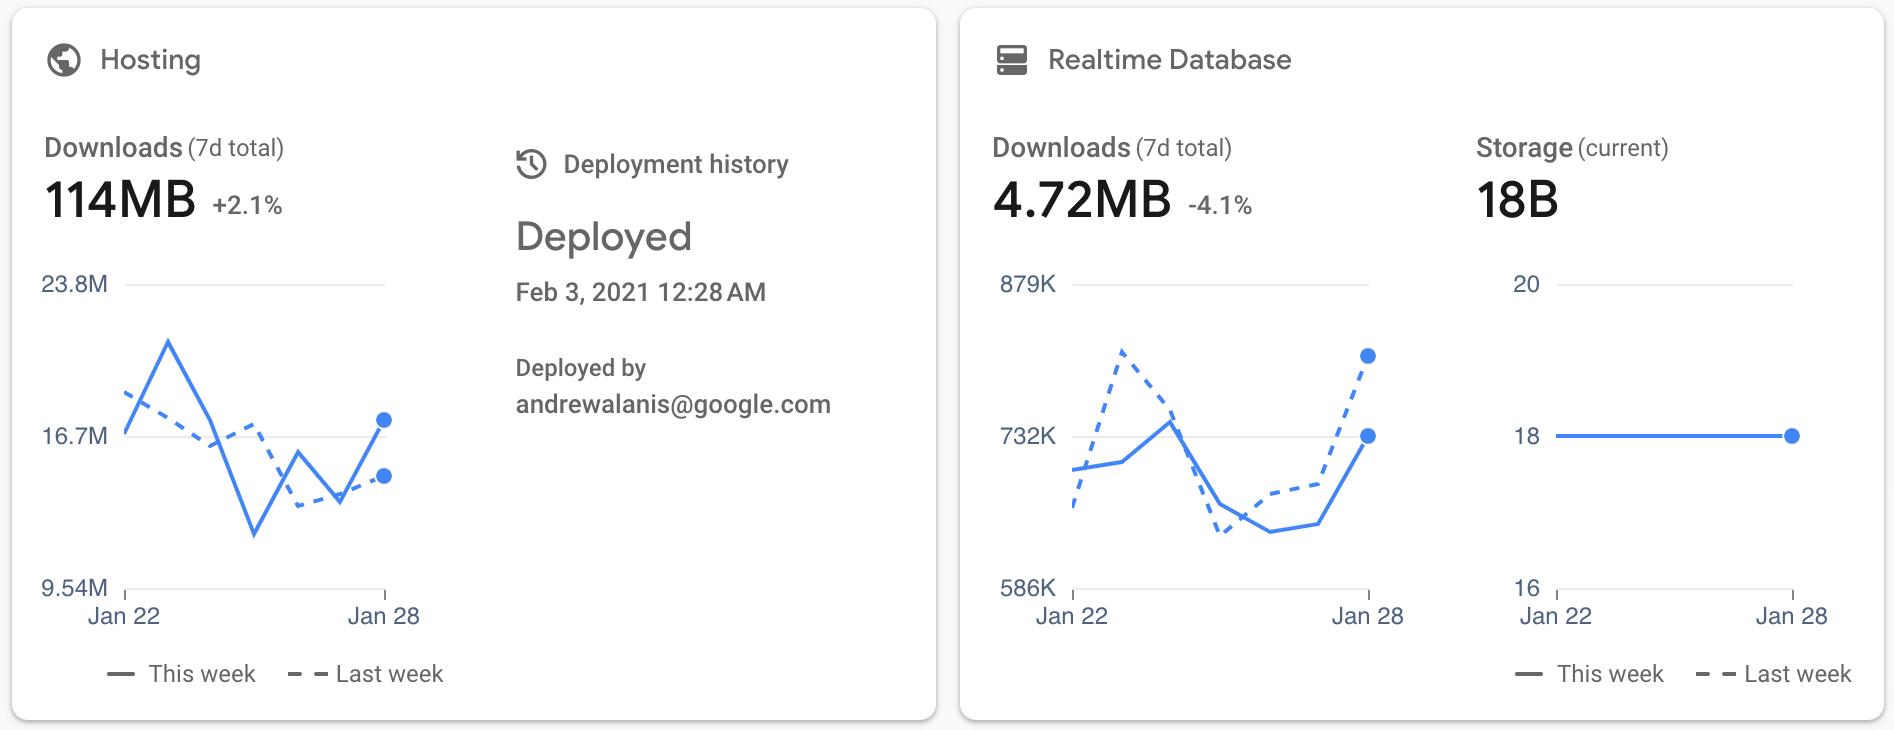
If connected to Firebase, Google Analytics 4 shows how people use your client’s web, iOS, or Android app. You’ll be able to capture events and user properties or define custom events to measure what matters most to the client’s business. GA4 will also present summary data, such as active users and demographics, as well as detailed metrics, like the most purchased items and others. These insights can be used to optimize the app to better serve the audience.
BigQuery
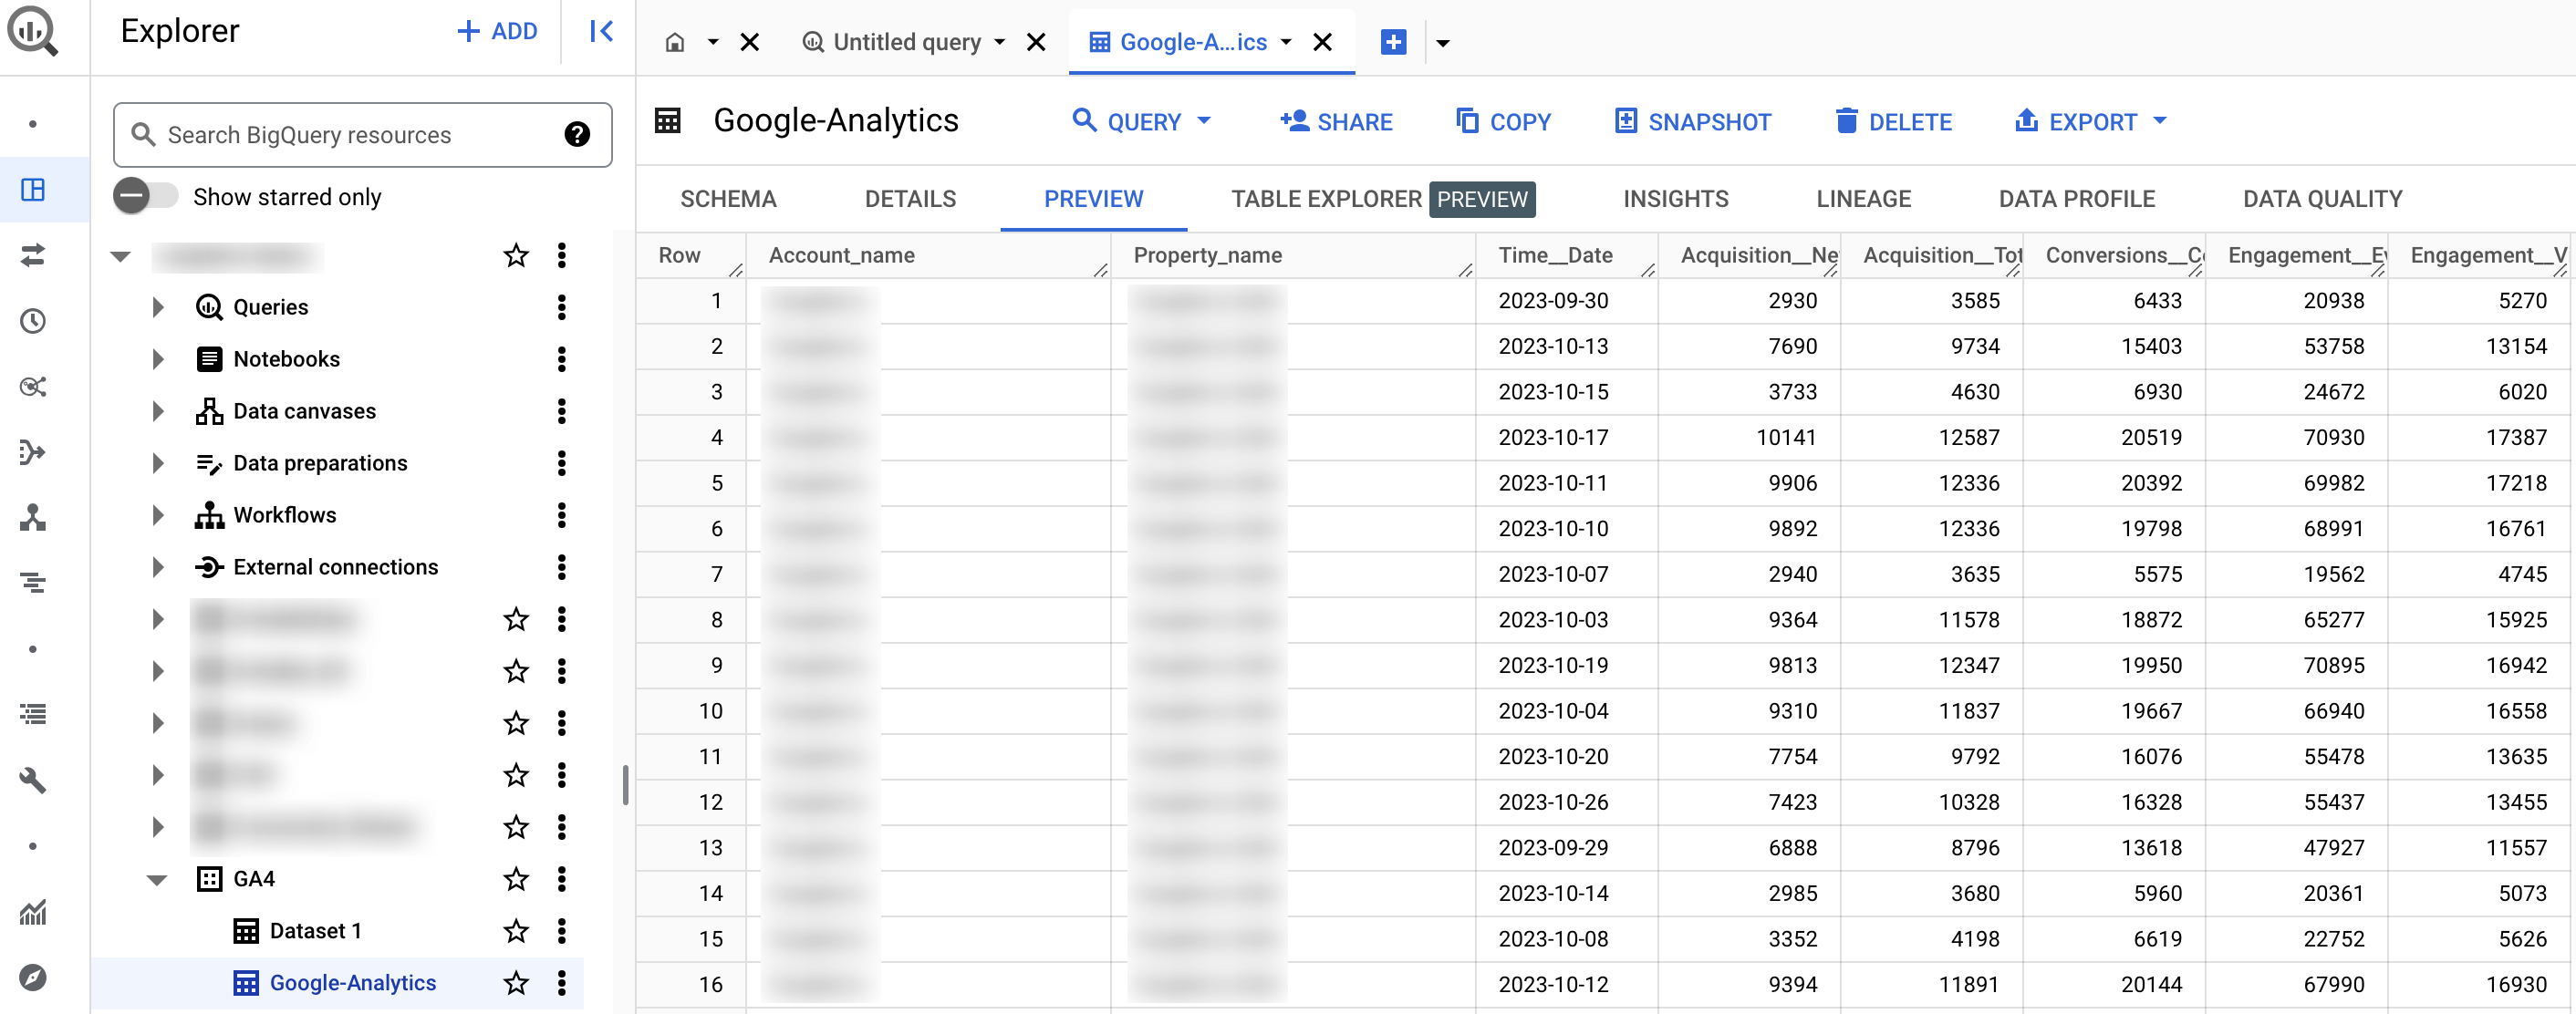
Whether you’re a small agency with a handful of clients or a large one managing hundreds of accounts – by exporting Google Analytics data to BigQuery, you can query and manipulate data at scale. This lets you drill down into vital events, filter out irrelevant or faulty fields, and make analysis more accurate.
Google Sheets
You can link GA4 with Google Sheets to create insightful reports for your clients. This makes it possible to organize data in spreadsheets, as well as apply formulas and functions. Google Sheets also enables you to visualize the data using charts, graphs, and tables, making it easier to present performance trends and practical recommendations to clients.
Looker Studio
To create more advanced dashboards for sharing with clients, you can connect Google Analytics with Looker Studio. This tool allows you to showcase data to the client in an easily digestible format with various visualizations and simplify navigation for them using interactive features like viewer filters and date range controls.
To integrate Google Analytics with other BI tools, you can use Coupler.io. It enables you to connect GA4 to Power BI or GA4 to Tableau without any hassle.
Custom analytics capabilities
While GA4 offers prebuilt reports, you’ll better understand customer behavior on your client’s website or app by creating custom ones using Explorations, which are advanced analysis techniques. They allow you to sort, refactor, and drill down into data, focus on the most relevant information with filters and segments, create segments and audiences, and more.
There are several types of explorations:
- Free-form: Analyze data in a familiar crosstab layout, where you can arrange and order the rows and columns as you like, add and compare metrics that matter most to your clients, visualize data as bar, pie, and line charts, scatter plots, geo maps, etc.
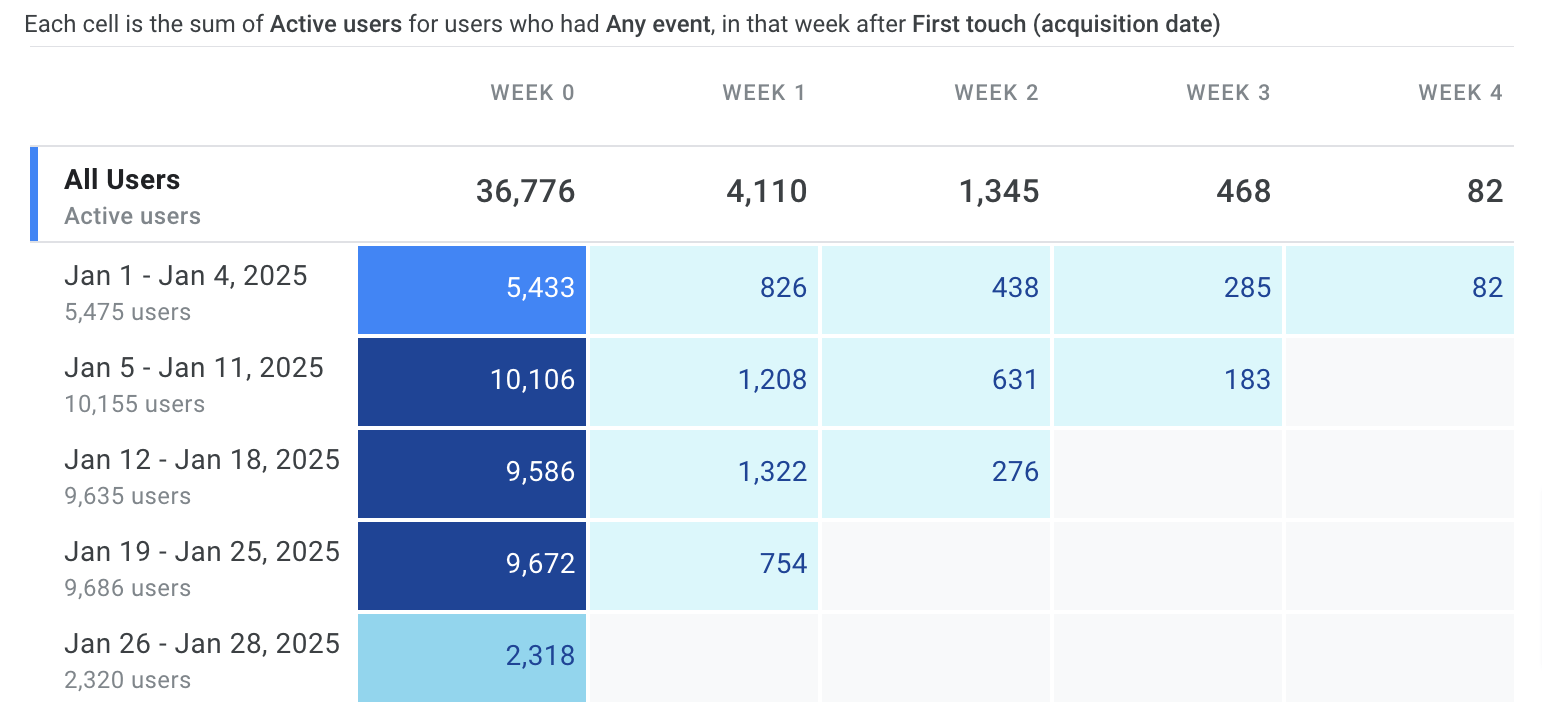
- Cohort: Look at the behavior and performance of user groups connected by common attributes, such as visitors on your client’s website who subscribed to a newsletter this week. Analyze how these groups change over time and what could affect their retention.
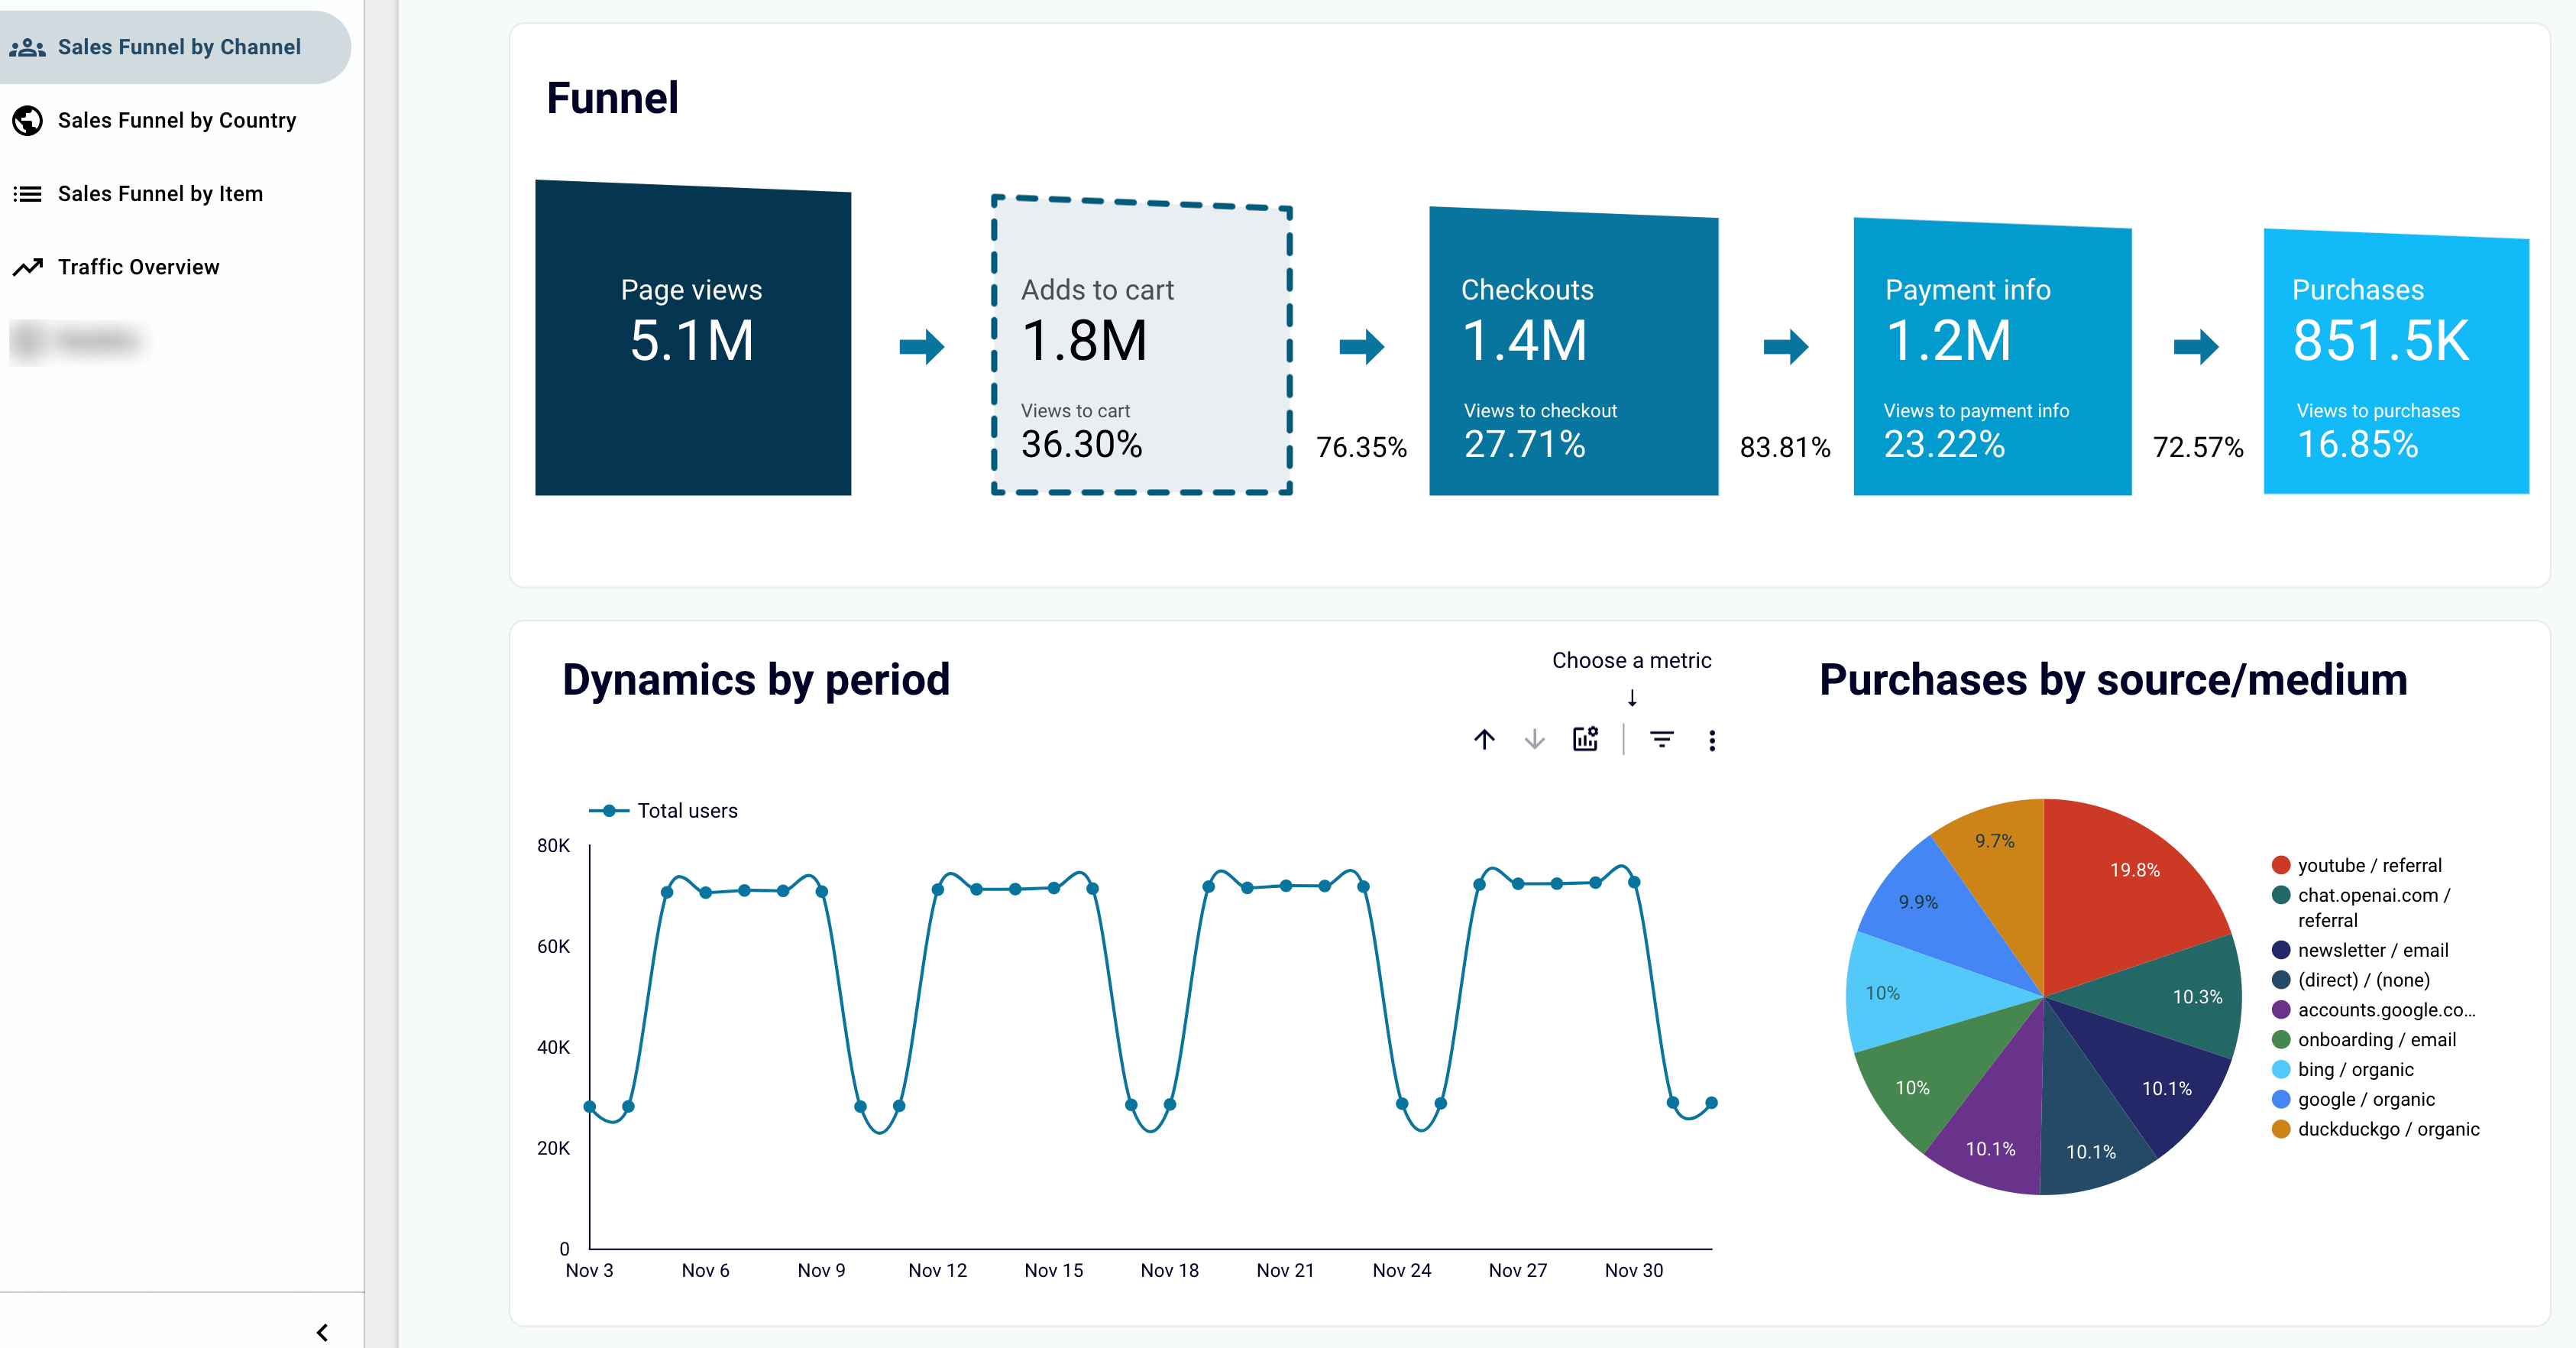
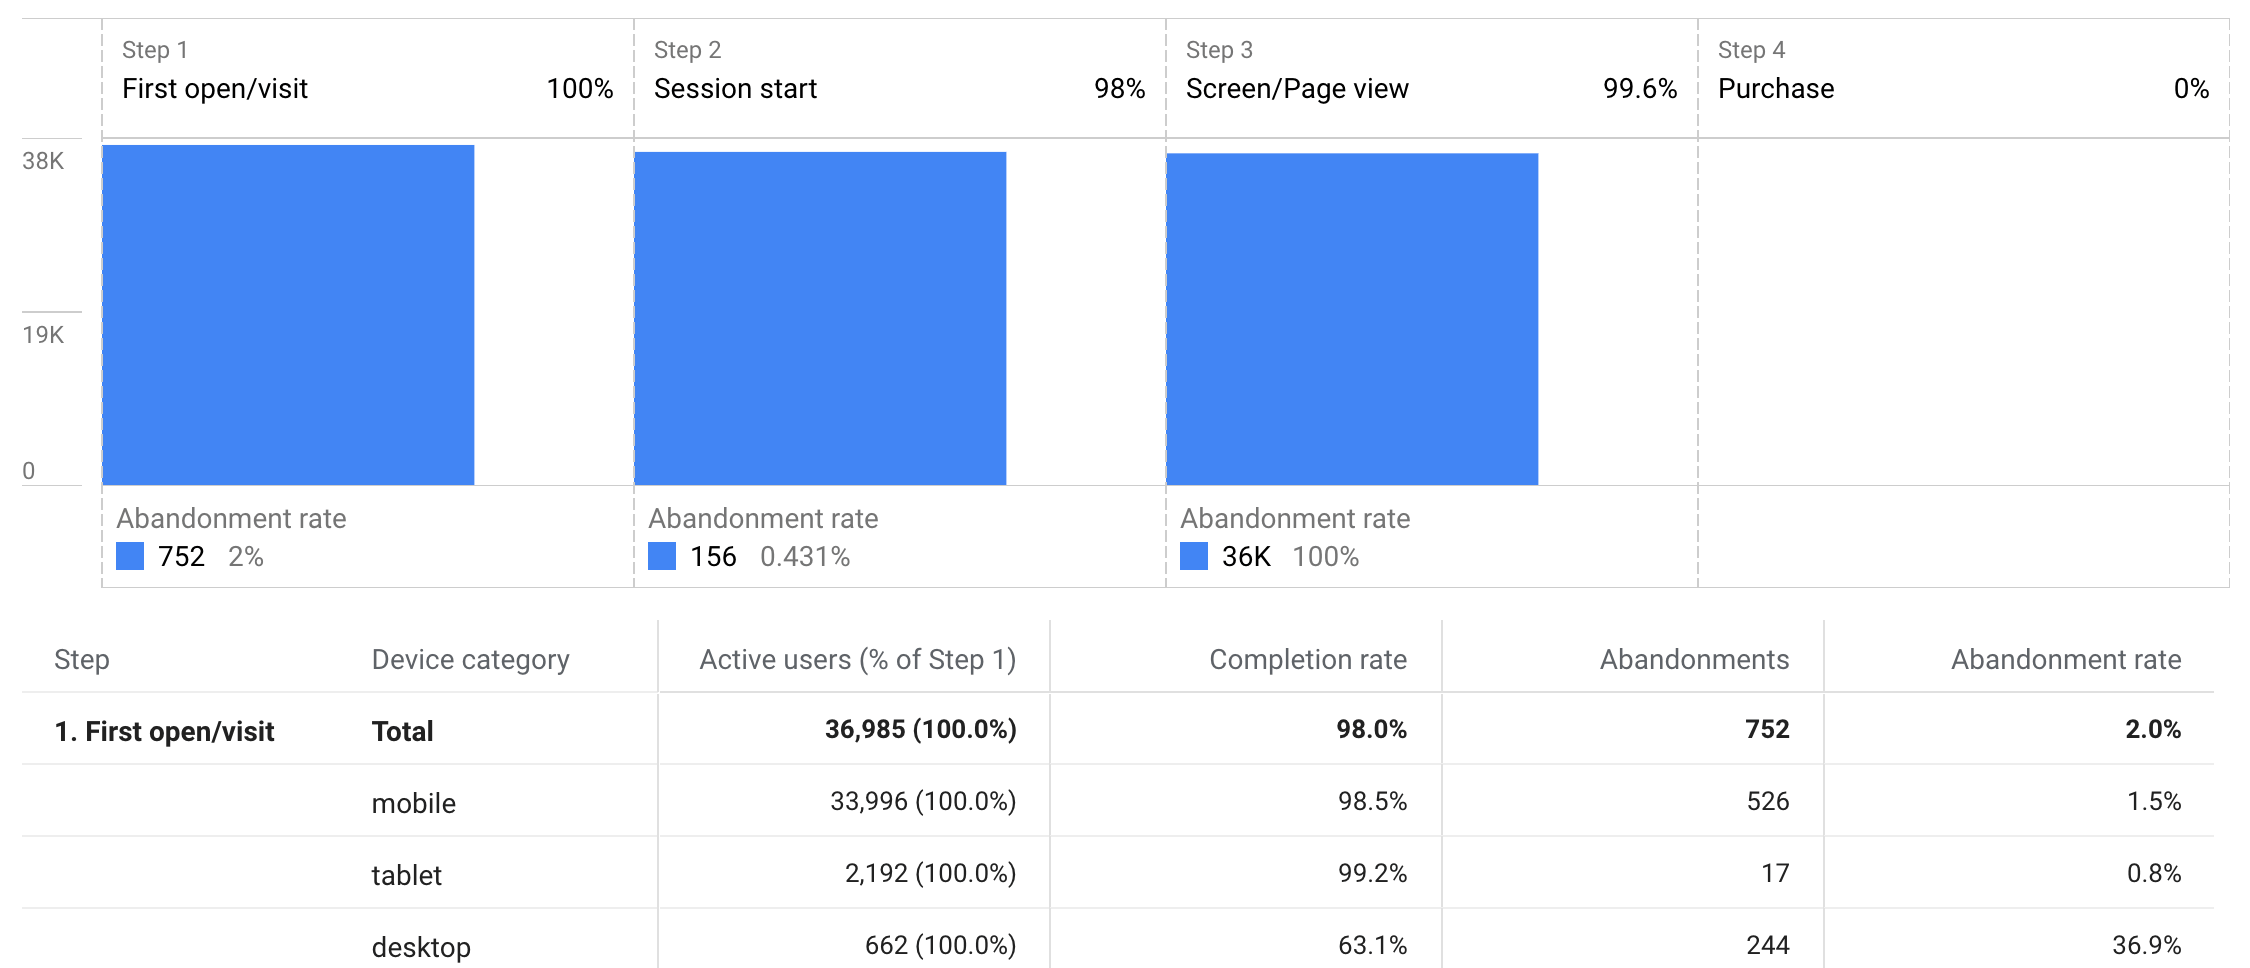
- Funnel: Visualize the steps users take to complete tasks on your client’s site or app. Pinpoint areas where users drop off, detect over- or under-performing audiences, and find opportunities to optimize the user experience.
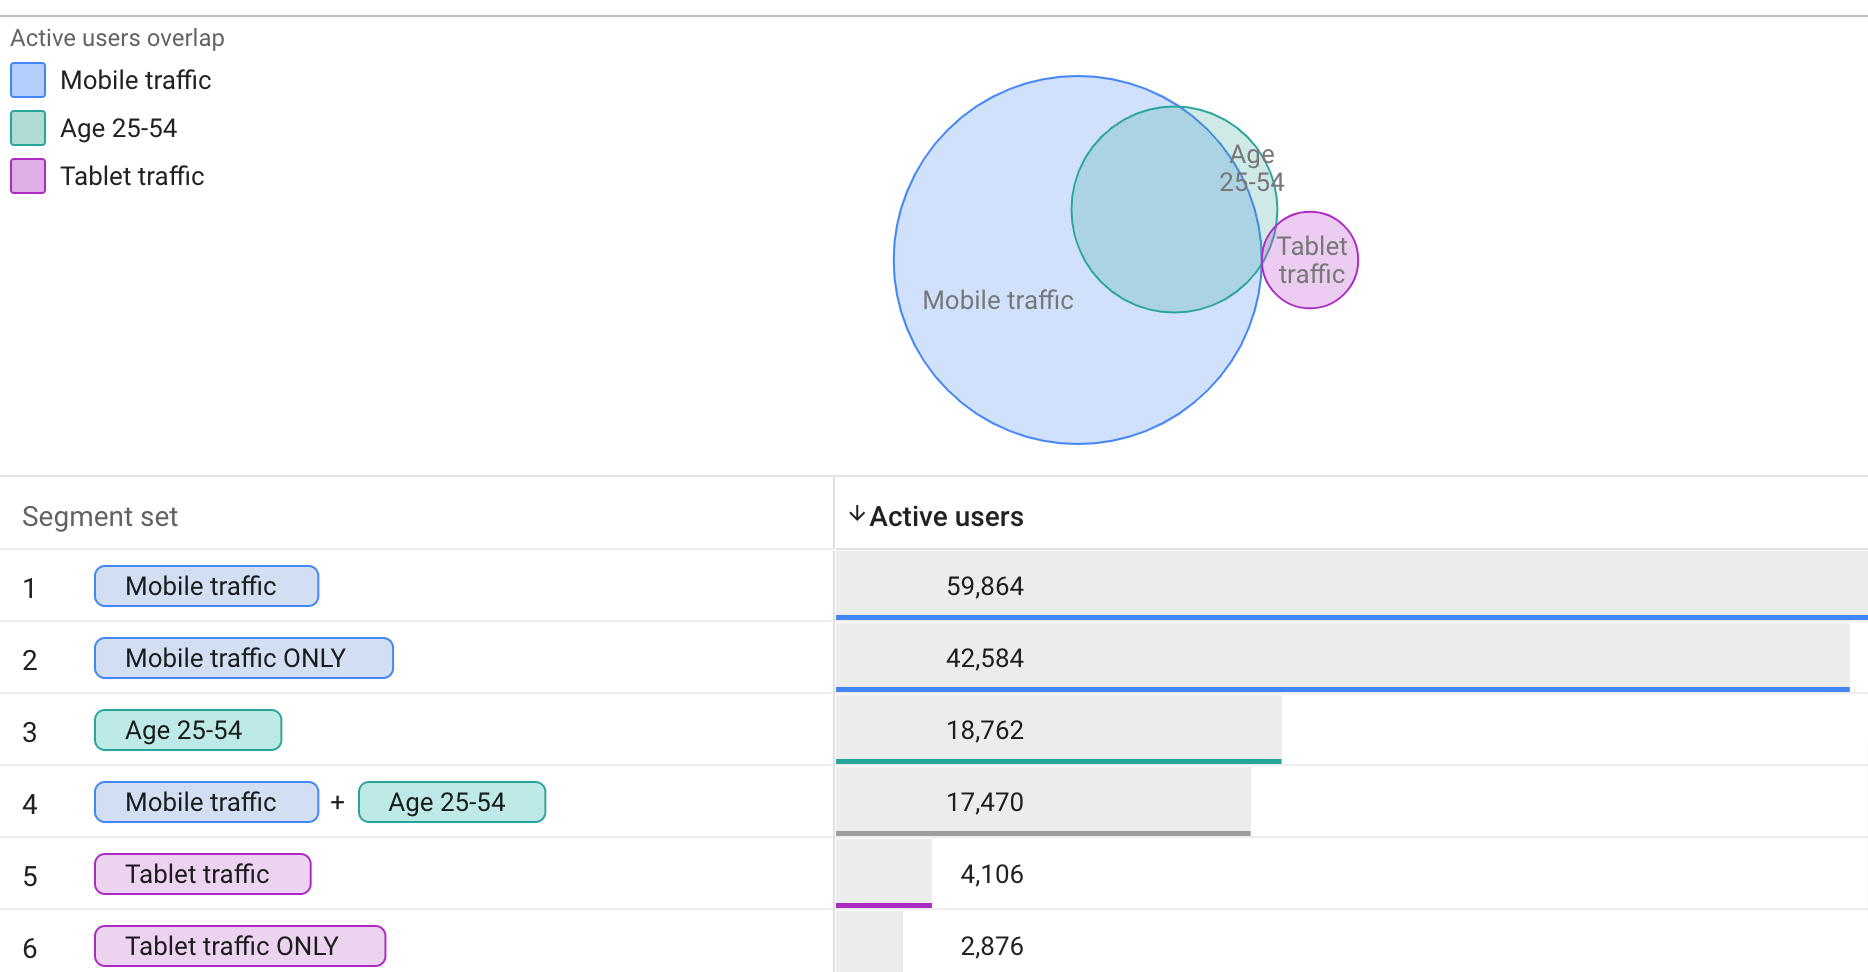
- Segment overlap: Create a GA4 dashboard to see how different user segments relate to each other and identify new ones that meet complex criteria. Refine targeting strategies and personalize user experiences accordingly.
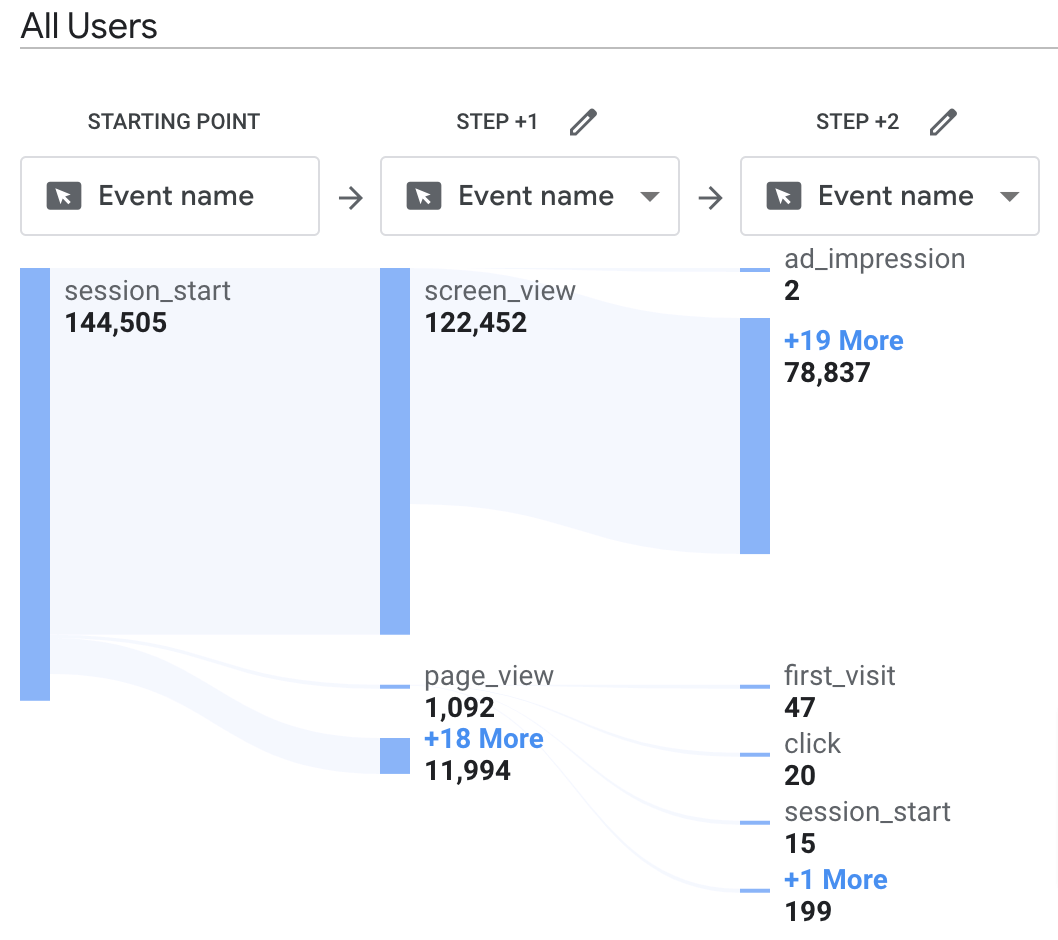
- Path: Map out the paths users take as they interact with your client’s website or application. Identify friction points to create a smoother path that encourages users to stay longer, interact more, and ultimately convert at higher rates.
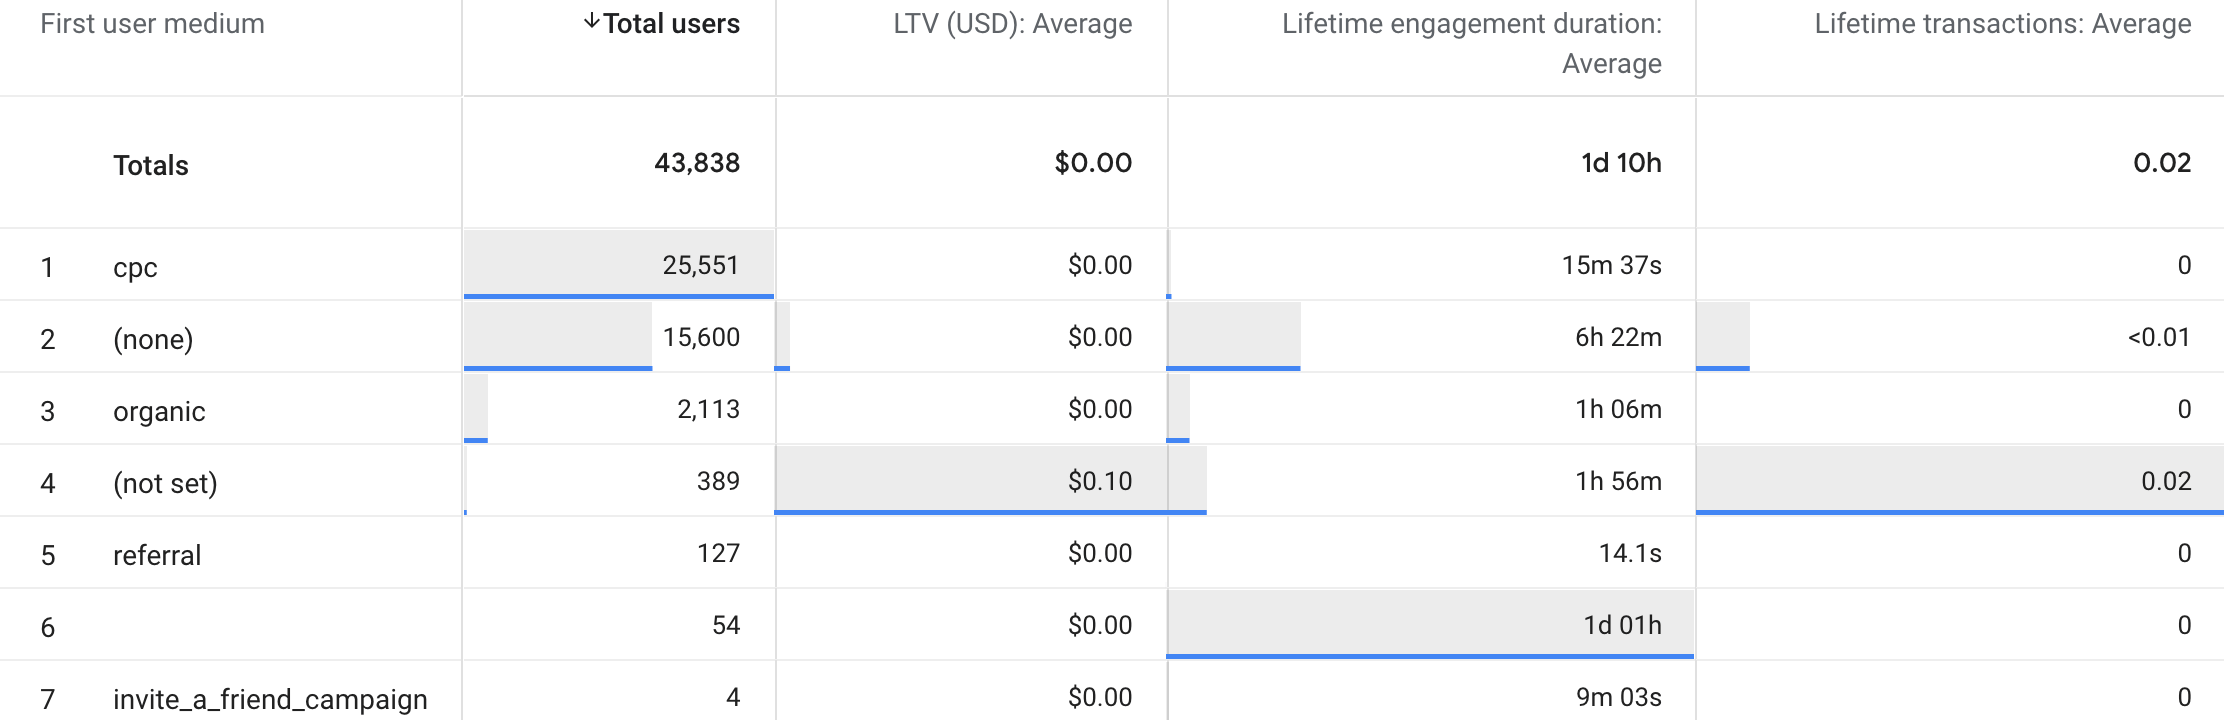
- User lifetime: Review user behavior across their entire journey on your client’s website or app, along with their lifetime value to the business, to inform strategies for nurturing relationships, improving retention, and maximizing long-term return on investment (ROI).
For more on using Explorations and other features, read our Google Analytics guide.
Data-driven attribution
Attribution is a way to determine which marketing efforts drive outcomes like sales, leads, or revenue. It works by assigning value to each customer interaction and connecting it to a specific result. Accordingly, an attribution model is a framework used to distribute credit among various interactions. GA4 offers two pre-built attribution models: last-click and data-driven.
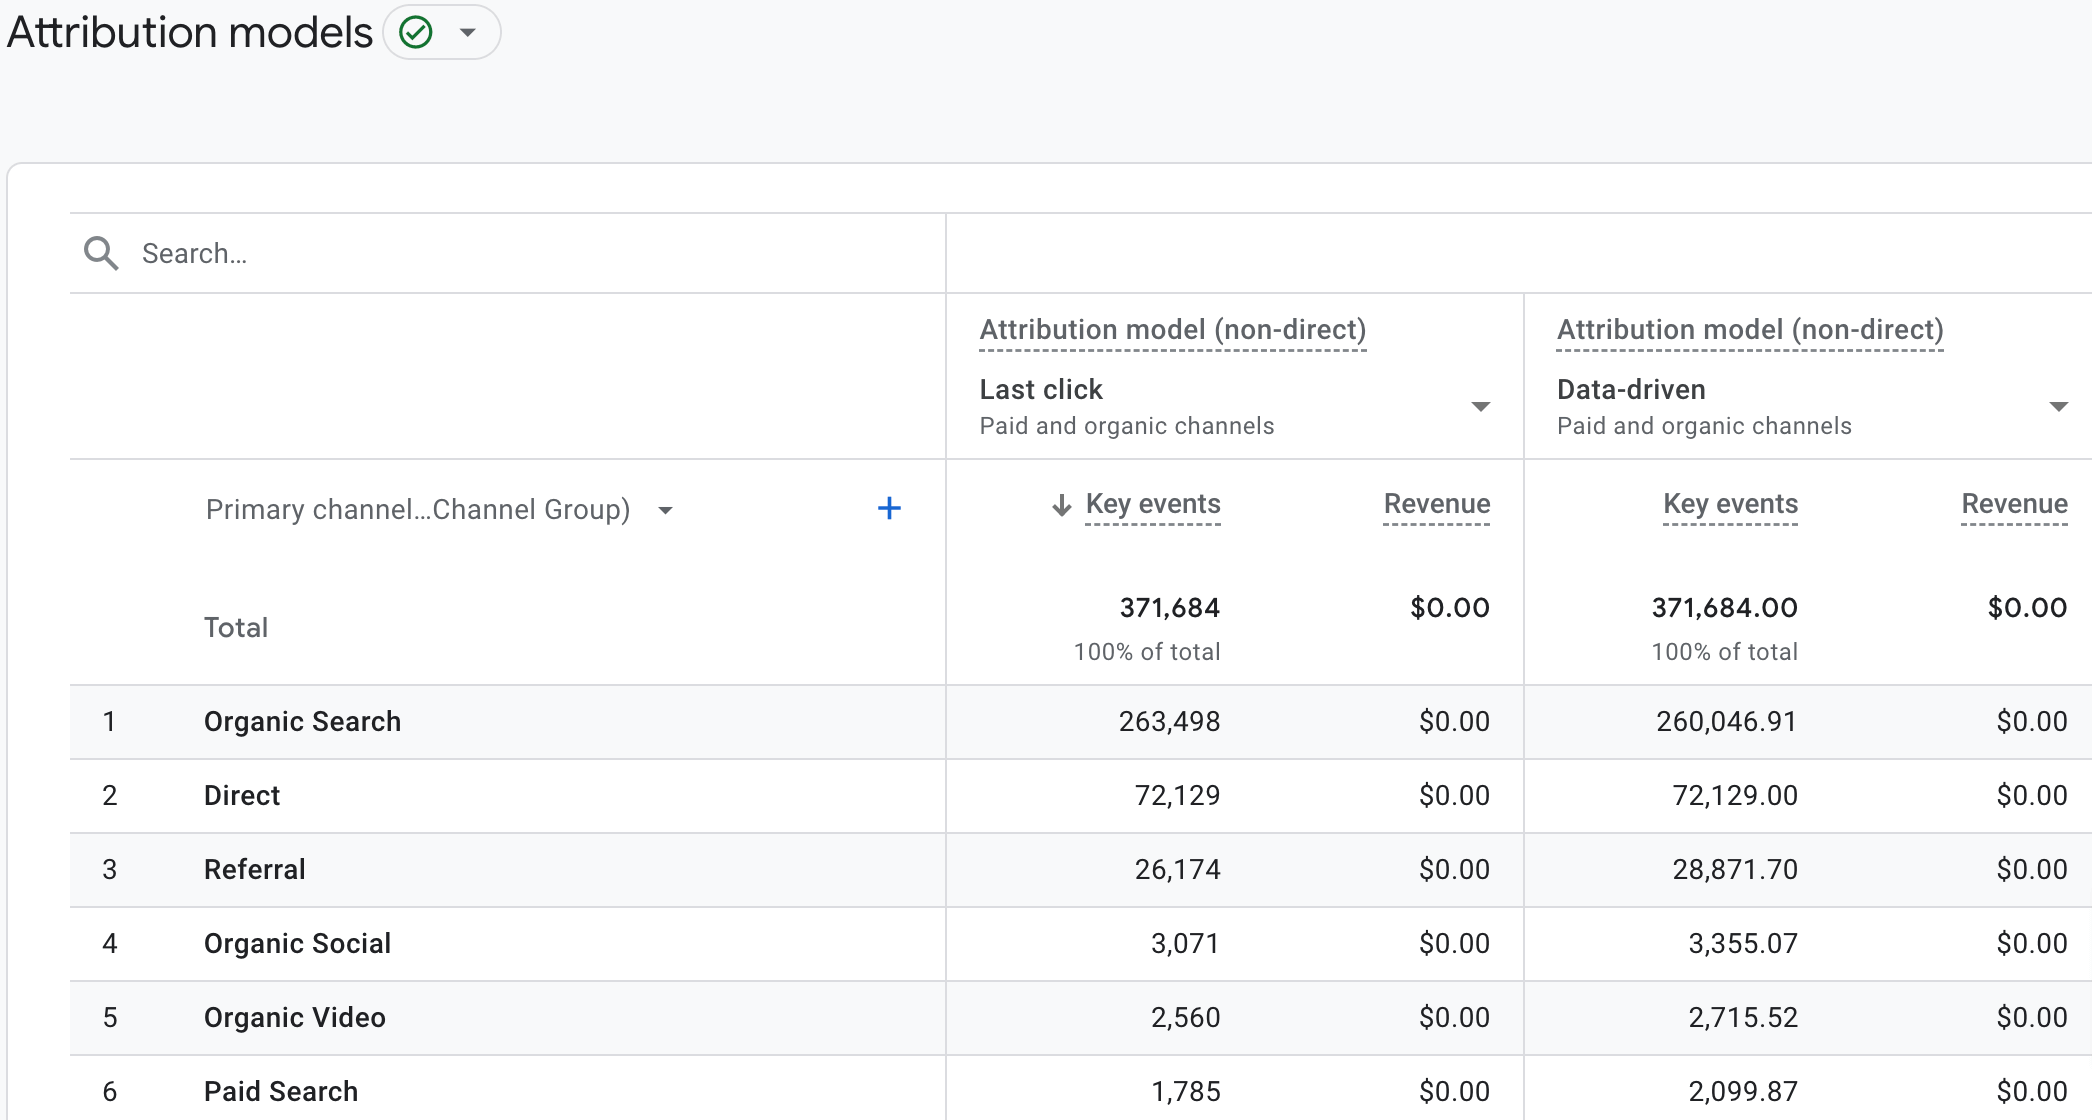
Let’s take a closer look at these models. Last-click allots credit to the latest touchpoint before a user converts. For instance, they discover your client’s brand through an organic blog post, later see a display ad, and finally click a search ad before making a purchase.
In this case, the search ad receives credit for this result, even though the blog post and display ad contributed to the decision. This can lead to overspending on search ads while underfunding brand awareness efforts.
Here’s where the data-driven model comes in. Through machine learning algorithms, it learns how different interactions impact conversion outcomes – by comparing what actually happened with what could have occurred. Based on this analysis, credit is given to the touchpoints that most likely led the user to convert.
This way, you can identify the most effective channels for your client, allowing them to allocate budget more efficiently and maximize conversions.
Previously, GA4 provided a variety of attribution models, including last-click, first-click, linear, time decay, and position-based. However, in 2023, Google deprecated most of these, leaving only last-click and data-driven available.
Numerous tutorials available
If your agency is just starting with GA4 or looking to grow your marketers’ expertise, there’s a multitude of free materials available across the web. They range from official Google tutorials and documentation to courses on external platforms like Coursera, along with numerous dedicated blogs. These resources offer a variety of learning options to suit different skill levels:
Analytics Academy
These Google Analytics video lessons on YouTube are part of an online course designed to help you get started with the tool. For advanced tutorials on using GA4 in your agency, choose from a complete course series on Skillshop.
Google Analytics 4 Tutorials
In this series of videos, you’ll receive code and configuration instructions for implementing GA4 on the website. It covers the initial setup, events, audiences, integrations, consent mode, and more.
Reporting in Google Analytics 4
Watch these video tutorials to get an overview of the tool’s interface and reports, understand how to track user sources and interactions, and how to validate your data collection.
Product Management Training Series
This advanced video training focuses deeply on the most important and newest GA4 features. Learn directly from the creators of Google Analytics to better set up and use the platform to achieve business goals.
Coupler.io blog
Explore best practices for using GA4 and managing its data, as shared by experts on the Coupler.io blog. Here, you’ll find guides on connecting Google Analytics to other tools for reporting, creating reports for clients, building dashboards based on your marketing data, etc.
Now that you know GA4 is a feature-rich tool with many advantages that favor its use, see how to make the most of its capabilities for your marketing agency reporting and analytics.
Google Analytics 4 tips for agencies
Let’s go over proven practices for:
- Setting up the proper conversions and goals – to measure how well campaigns drive the desired outcomes and track the client’s revenue.
- Creating custom insights with alerts in GA4 – to identify anomalies in your clients’ metrics and traffic as soon as they occur.
- Combining data from Google Analytics and other tools – to keep your clients informed about the marketing performance.
- Using dashboards built with BI platforms – to provide clients with easily understandable and always accessible insights. ?
Set up the proper conversions and goals
Google Analytics 4 is event-driven, which means that all interactions on the website are tracked as events. To monitor conversions, you need to set up specific events to capture desired user actions on the site. However, the types of events and how you configure them vary for each business.
If your client is an e-commerce business, it will be enough to add events to the website using Google Tag Manager.
But what if they are a subscription service with no direct sales? Set clear goals – such as MQLs (marketing qualified leads) with at least some website engagement and SQLs (sales qualified leads) who, for example, have scheduled a demo. Then, assign dollar values to these goals. So, let’s see how to do this using Google Analytics 4.
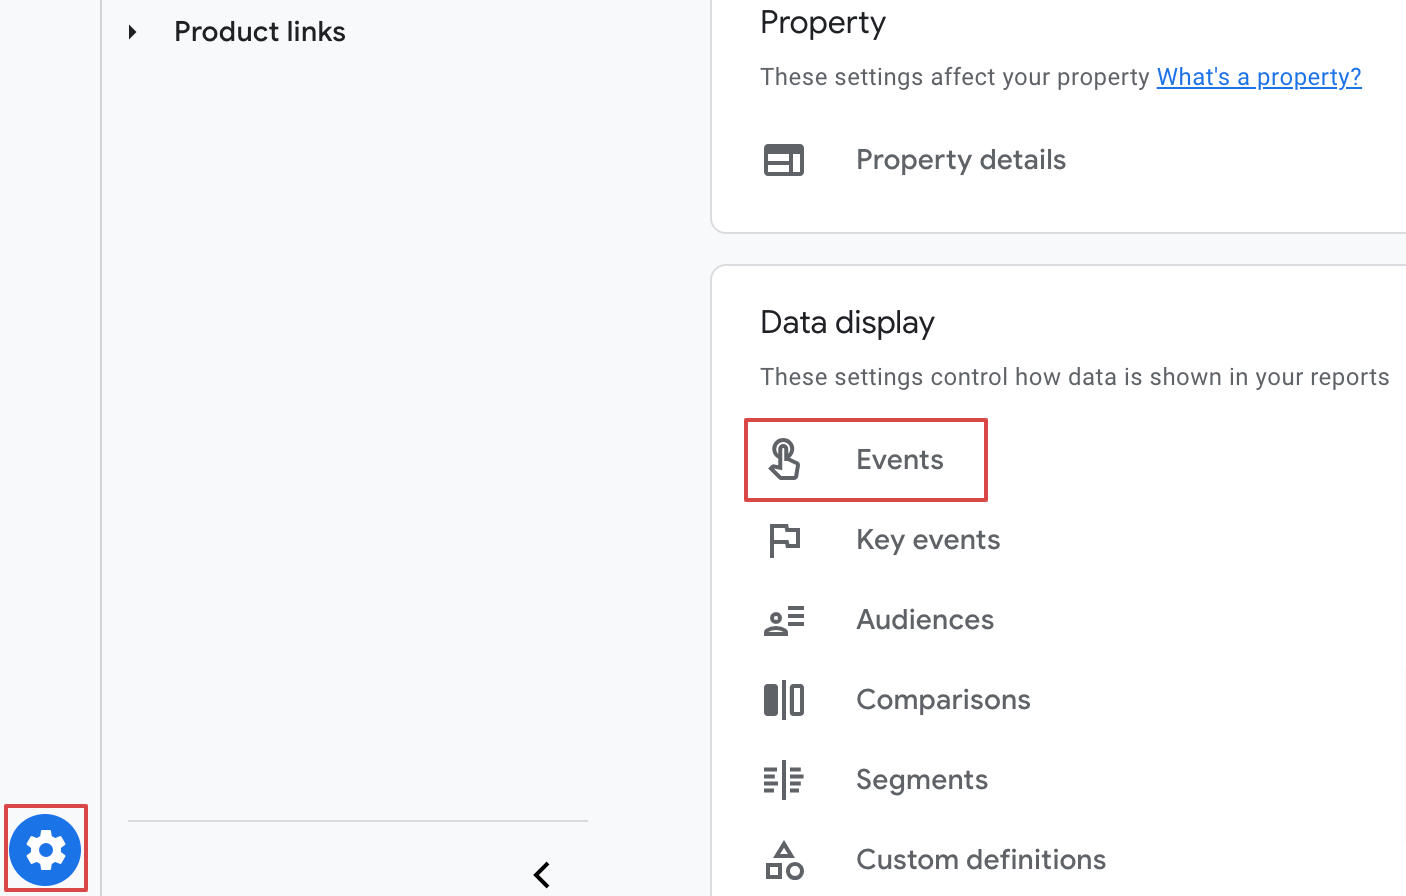
Go to GA4, click the bottom left icon, then Admin and Events.
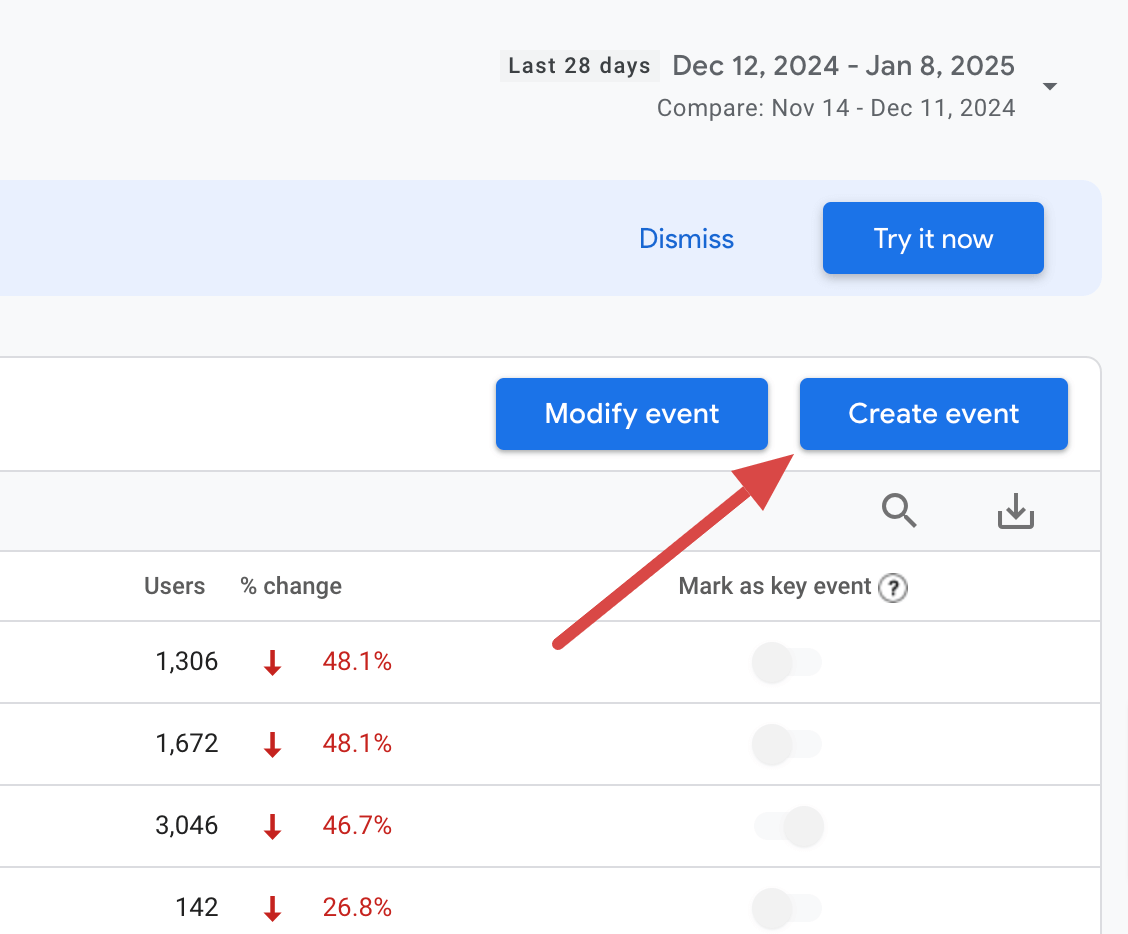
Click the Create event button.
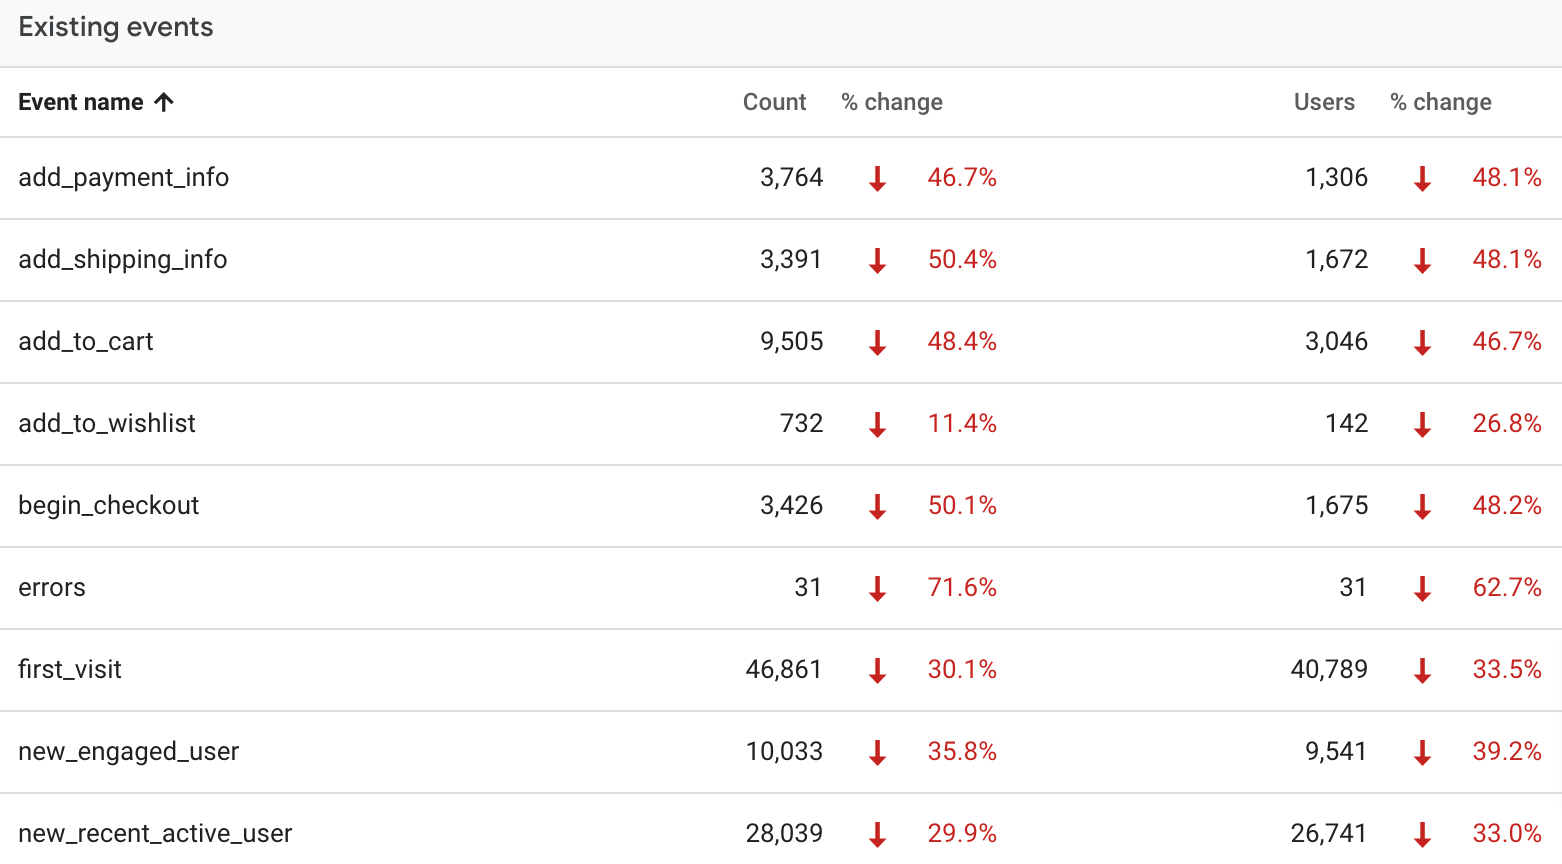
After creating conversion events, mark them as key events. These can include actions that contribute to your client’s success, such as form submissions, free trial signups, or visits to a specific page. For example:
Next, select Modify event and assign monetary values to each. Calculate these values using the formula:
Customer lifetime value (CLV) × Lead conversion rate
Where:
- CLV is the amount a customer is expected to spend with your client’s business over the average duration of their relationship.
- Lead conversion rate is the percentage of leads who convert into paying customers.
For example, if your client’s average CLV is $1,000 and the lead conversion rate is 10%, the event monetary value would be:
1,000 × 0.1 = $100
Every time the event is triggered, its value is counted as a conversion and added to your total revenue.
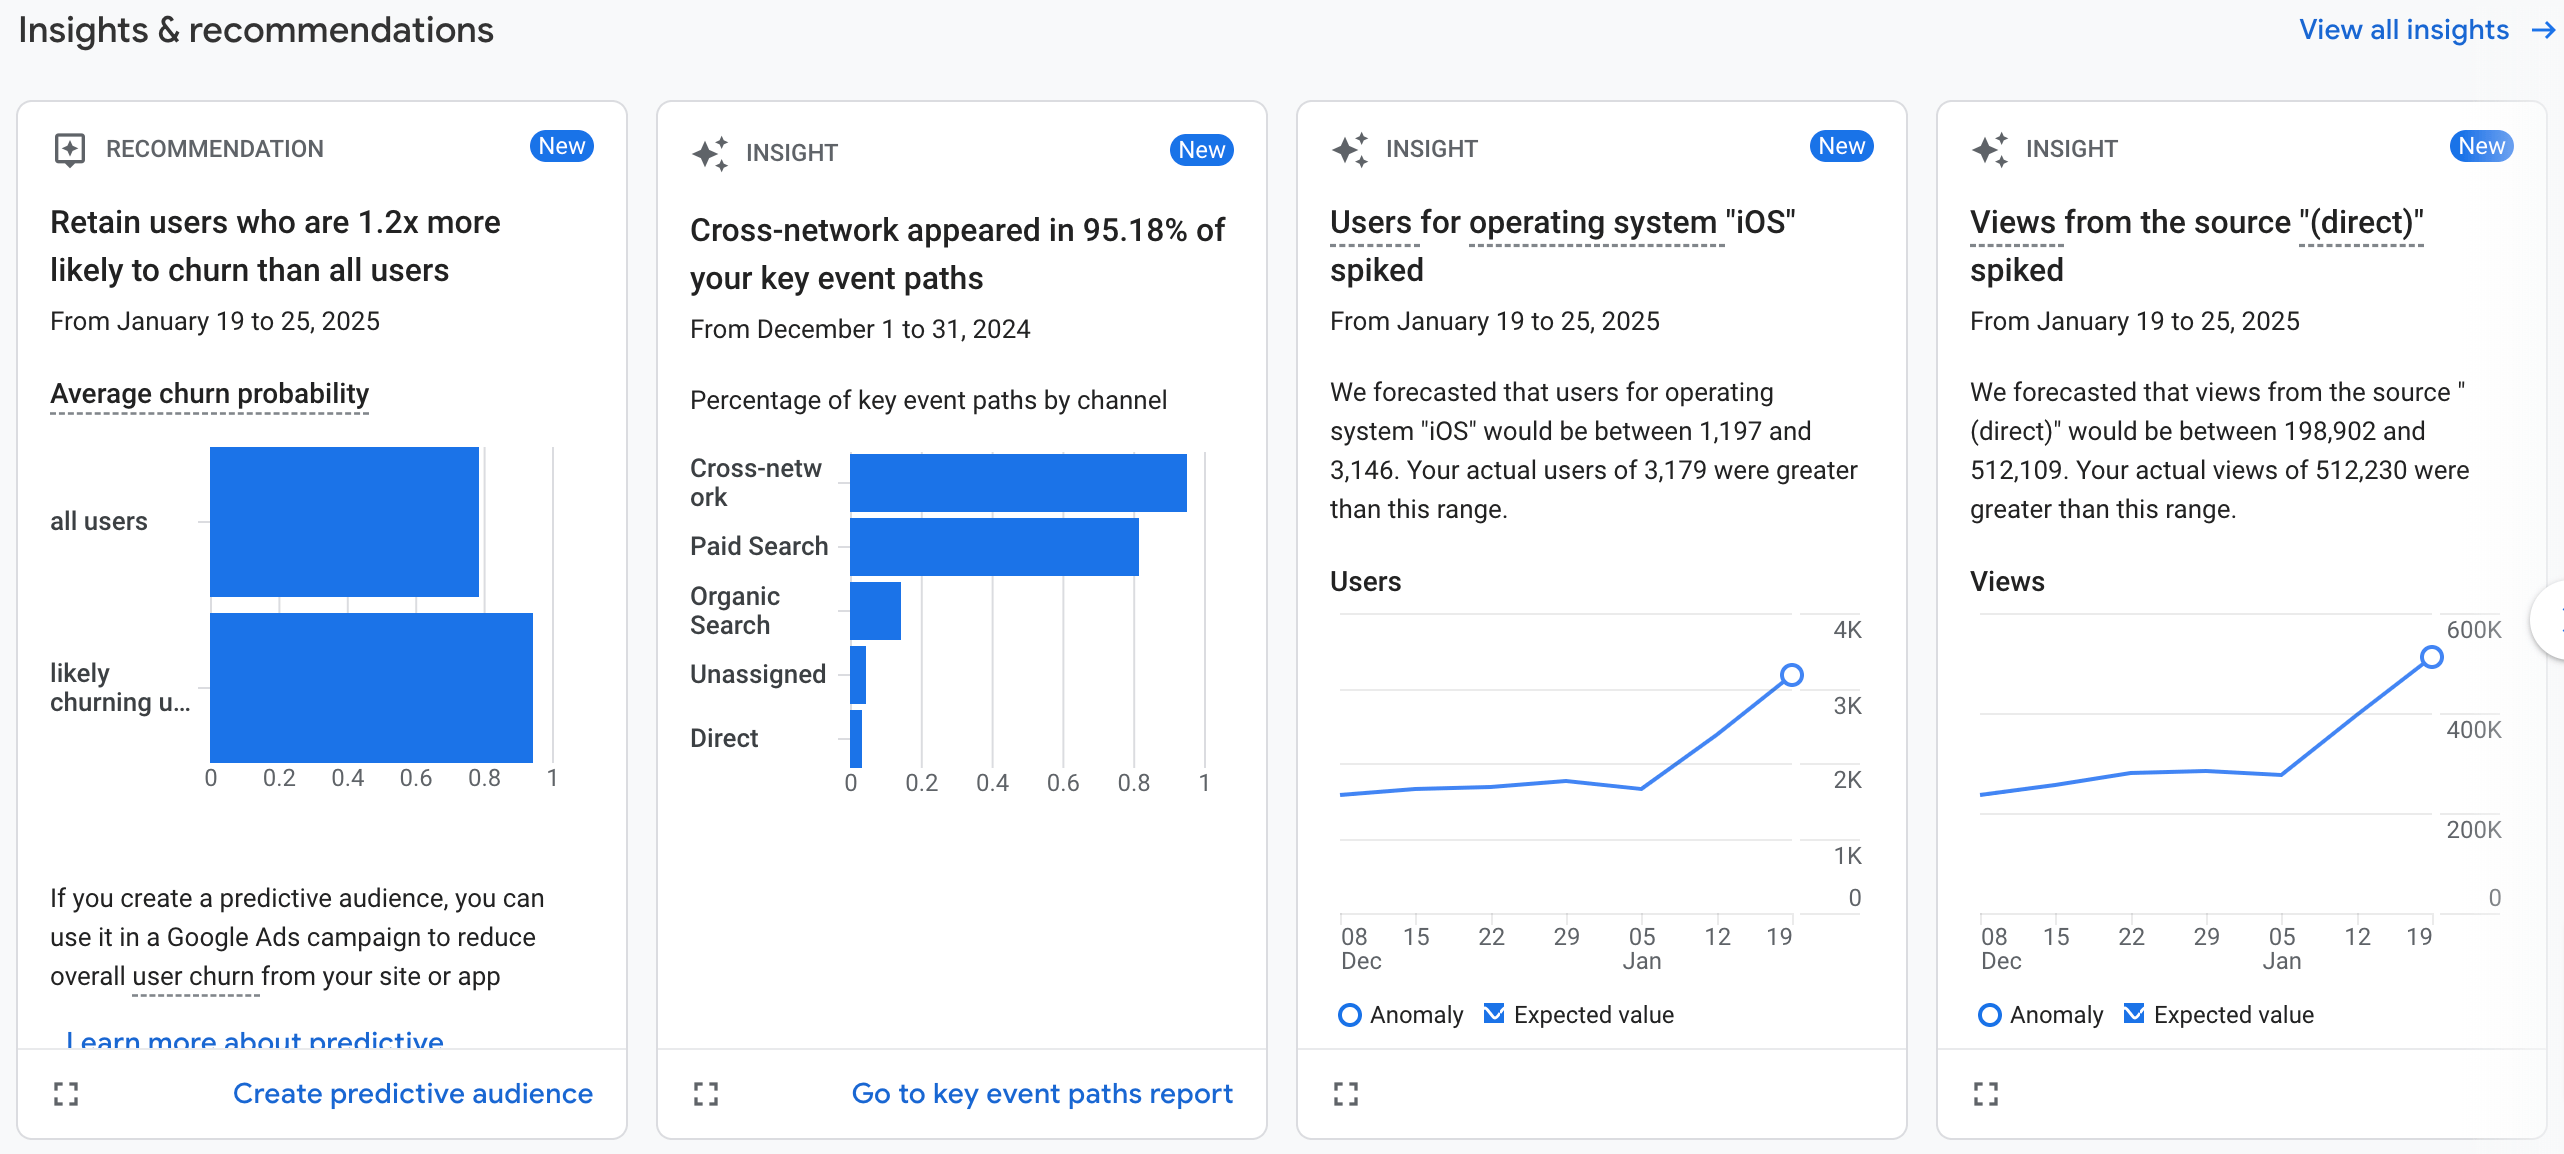
Create custom insights
Custom insights in Google Analytics is a feature that allows you to set up conditions for detecting significant changes or patterns in your data. When these conditions are triggered, the relevant data will appear on GA4’s Insights & recommendations dashboard, and you can also opt to receive email alerts.
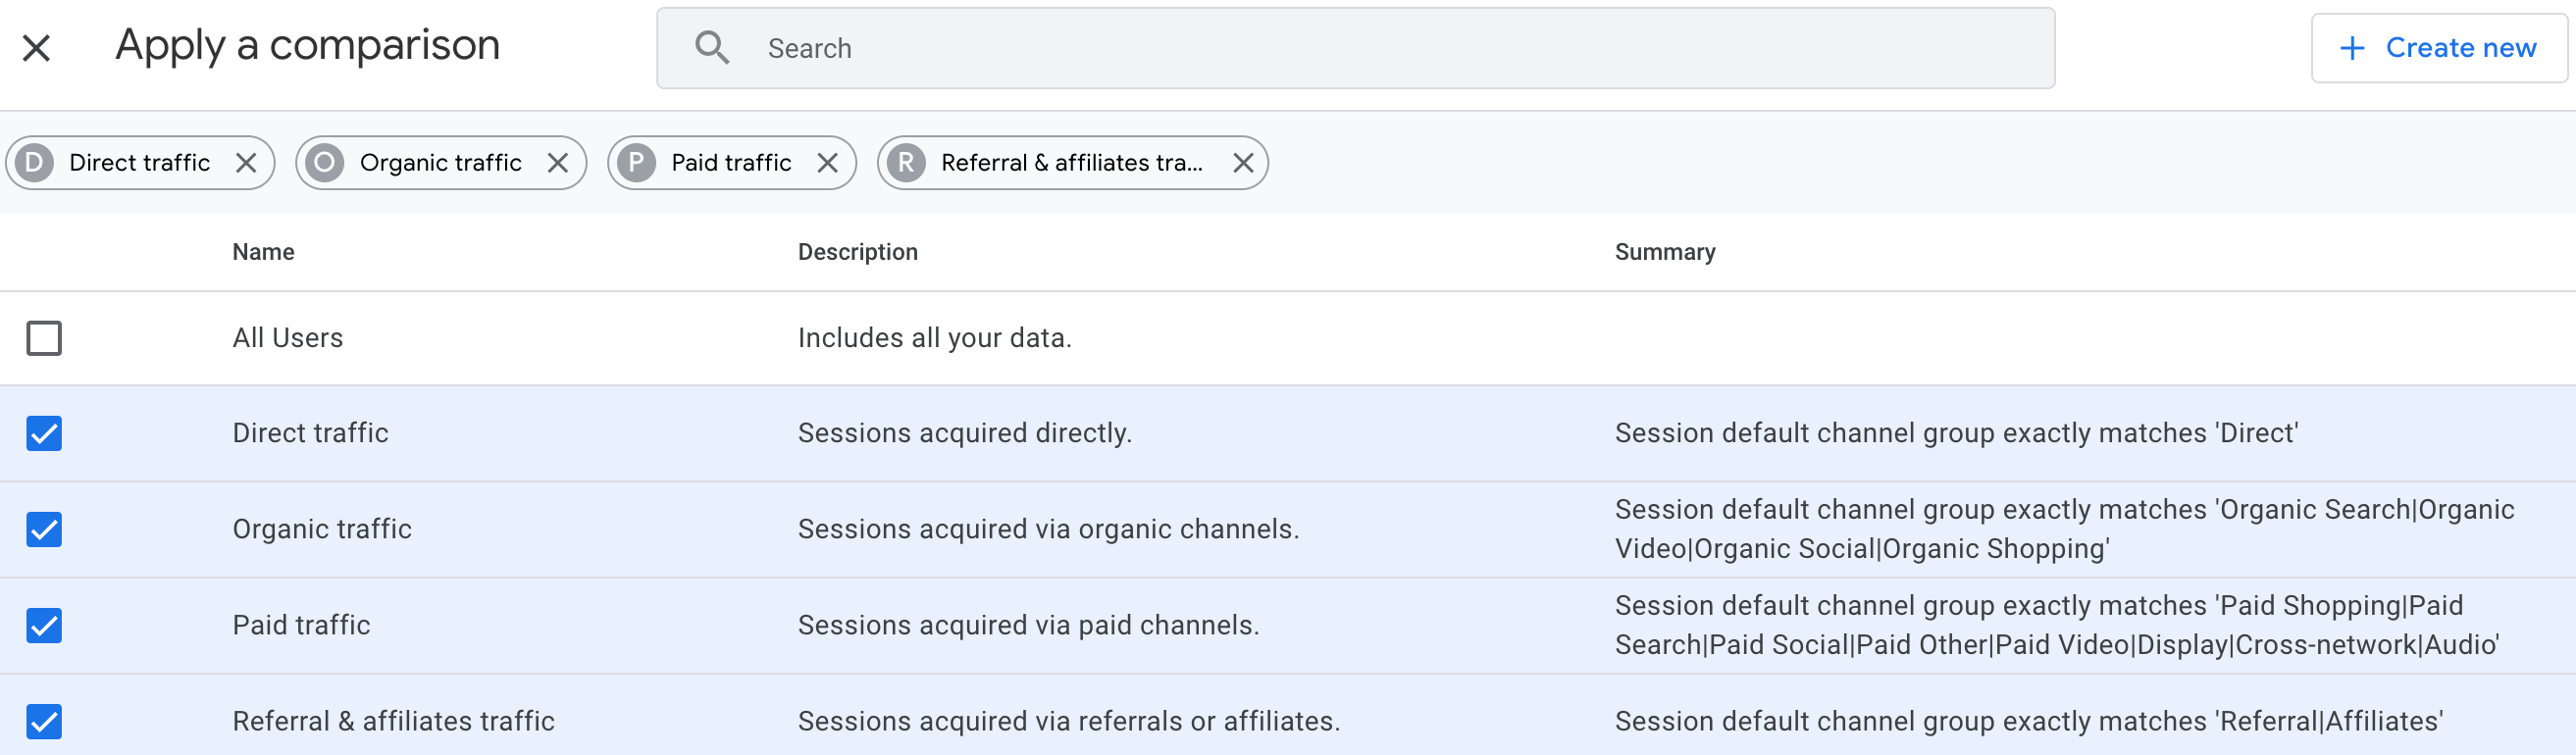
How can this be helpful? Imagine that you’re running an affiliate program for your client where third-party partners are rewarded for bringing in traffic to the website through unique referral links. In this case, you need to ensure they don’t run paid ads targeting your client’s branded terms to attract visitors to the site – as this could compete with the PPC campaigns you’re managing for the business and is commonly considered affiliate marketing fraud.
To track this in Google Analytics, set up a weekly custom insight that notifies you whenever paid ad traffic comes to your client’s site from affiliates – and enable email alerts. Next, connect GA4 to Google Sheets via Coupler.io to create a report with a page list and clicks from paid ads and load it into the spreadsheet.
So, when you receive an email notification about detected paid traffic, go to the report to see which specific affiliate is responsible for that.
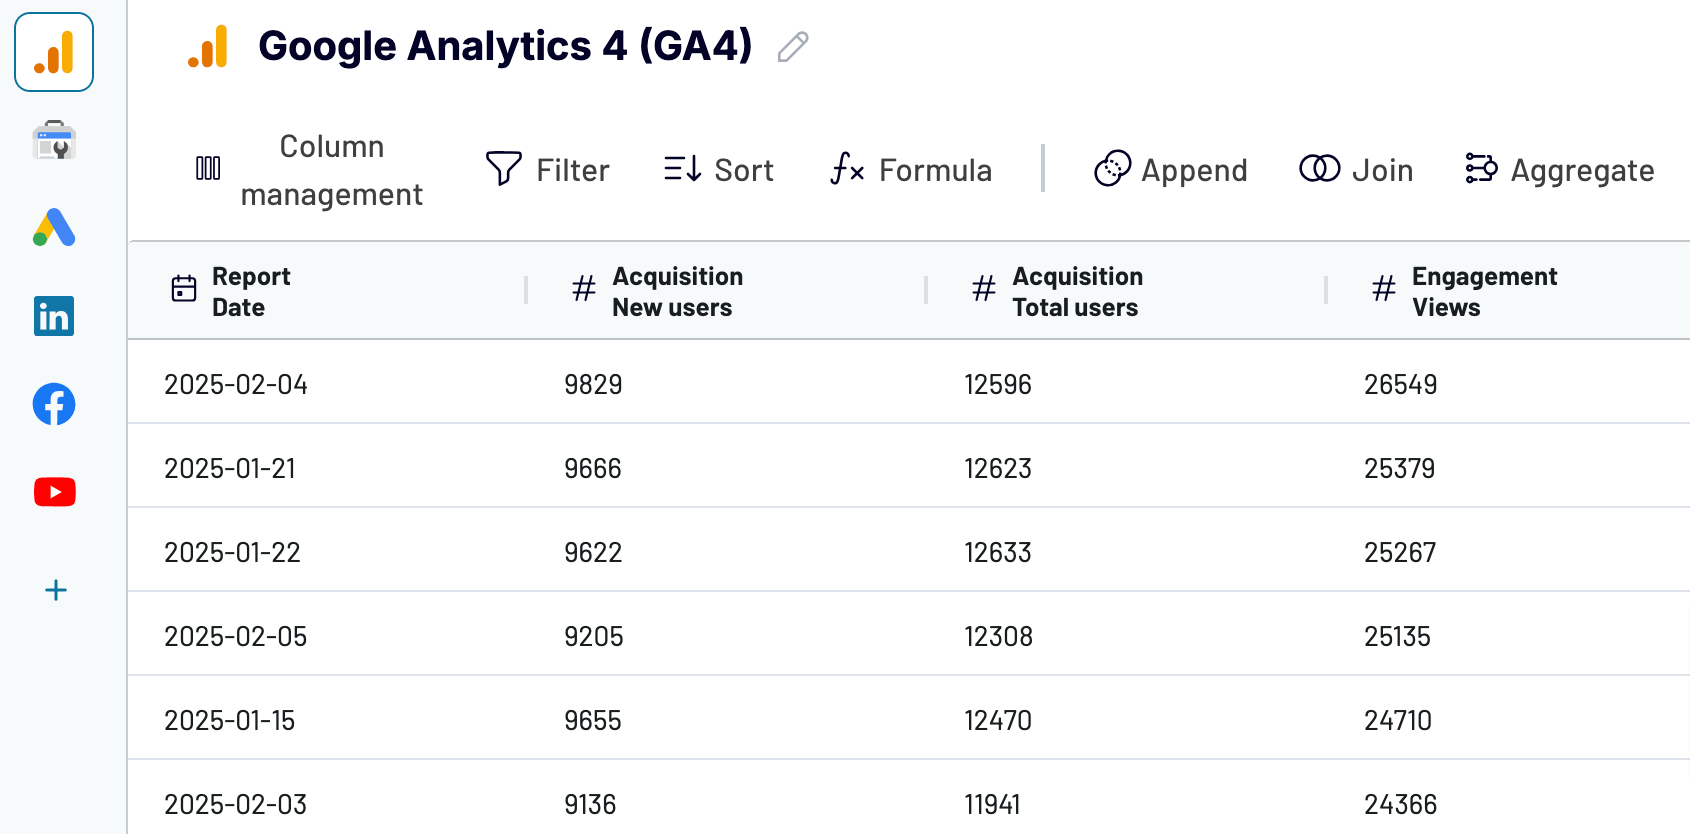
Combine data from GA4 and other tools
To give your client a holistic view of their marketing performance across channels, integrate GA4 data with records from CRMs, ad platforms, social media, email automation tools, accounting or billing systems, and more in one report.
With Coupler.io, you’ll bring all this data together, build a cross-platform report in minutes, and fetch it to spreadsheets or BI tools. Plus, your report will automatically update on your chosen schedule to reflect the most recent changes in the source.
Imagine you have a client for whom you’re running SEO campaigns (organic search channel), ads on Google and LinkedIn (paid search channel), and content on Facebook and YouTube (organic social channel). To create a report that shows how your client’s budget is being used and how your marketing efforts are delivering results, turn to Coupler.io to collect data from:
- Google Analytics – for traffic and conversions across each digital marketing channel.
- Google Search Console – for organic search impressions, click-through rates, etc.
- Google Ads and LinkedIn Ads – for ad spend, clicks, total users engaged, and more.
- Facebook Page Insights and YouTube – for the engagement metrics of your content.
Once collected, prepare a report by transforming and combining the data into a single view.
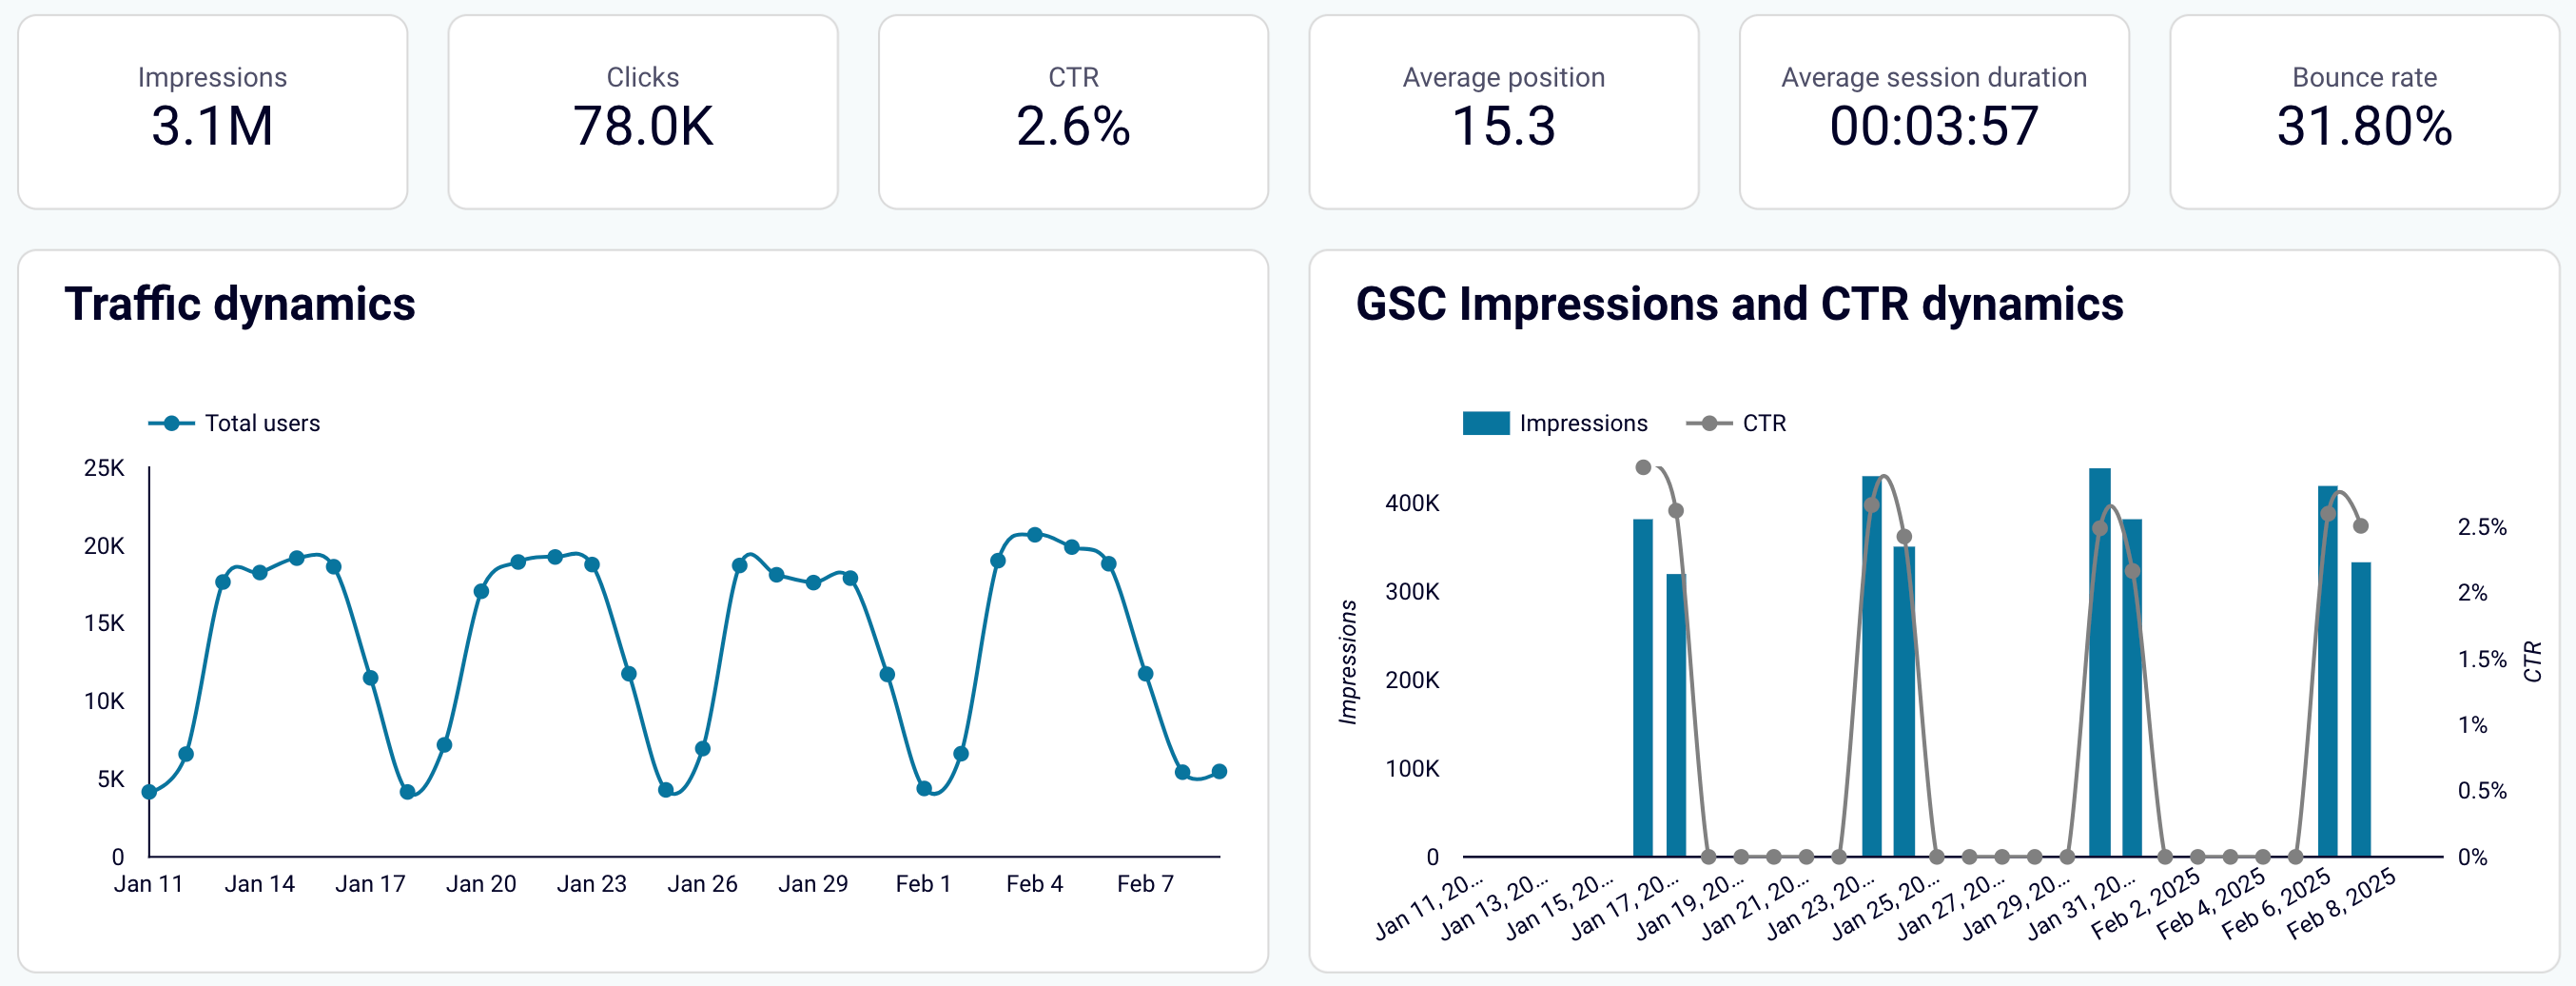
Next, load your report into your preferred spreadsheet app or BI tool to make the data easy for the client to understand. To show the performance of SEO campaigns, you can highlight key organic search metrics along with trends in traffic, impressions, and CTR over time.
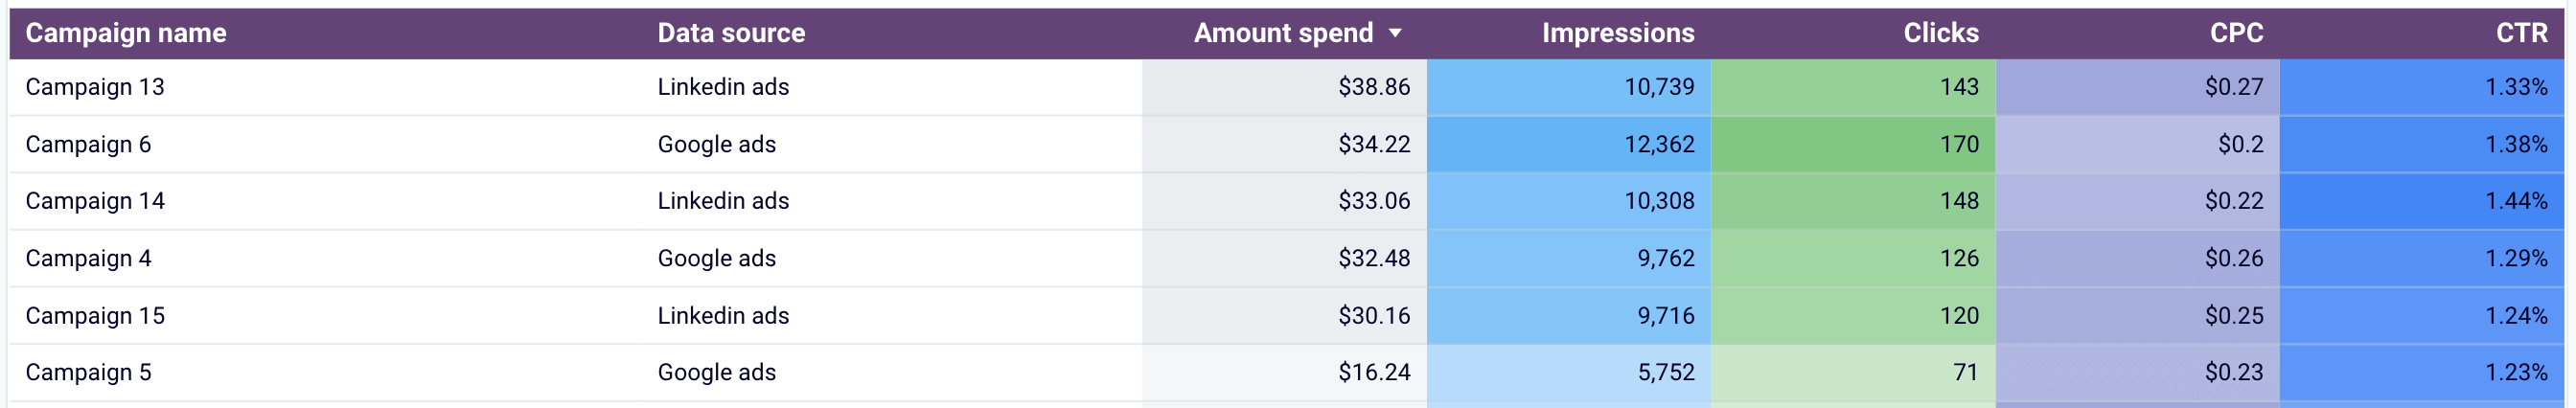
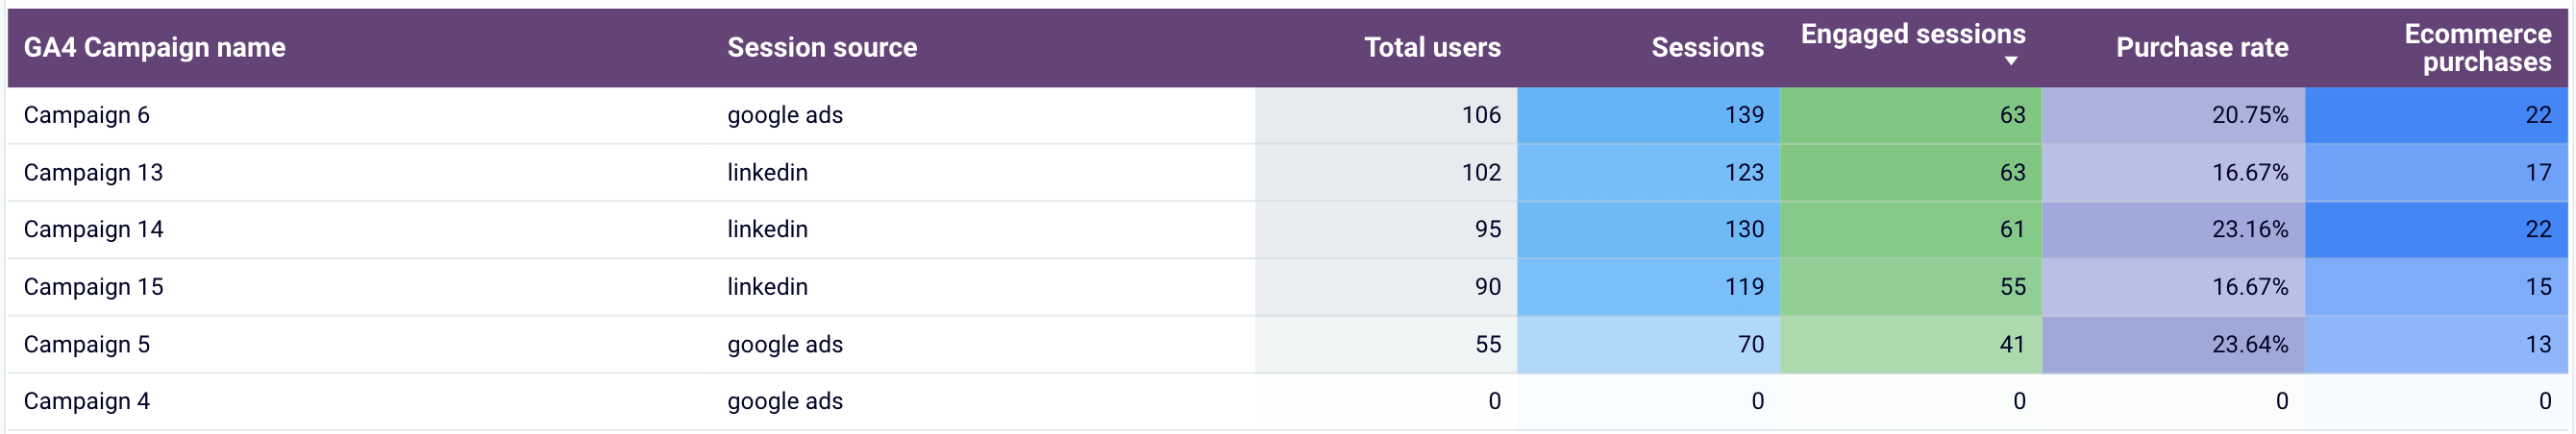
For the client to view spending on each Google and LinkedIn ad campaign in relation to the engagement they drove, place the amount spent alongside metrics like impressions, clicks, and CTR.
To illustrate the impact of these same campaigns beyond just clicks to the website – up to conversion – bring together metrics such as total users, engaged sessions, and purchases.
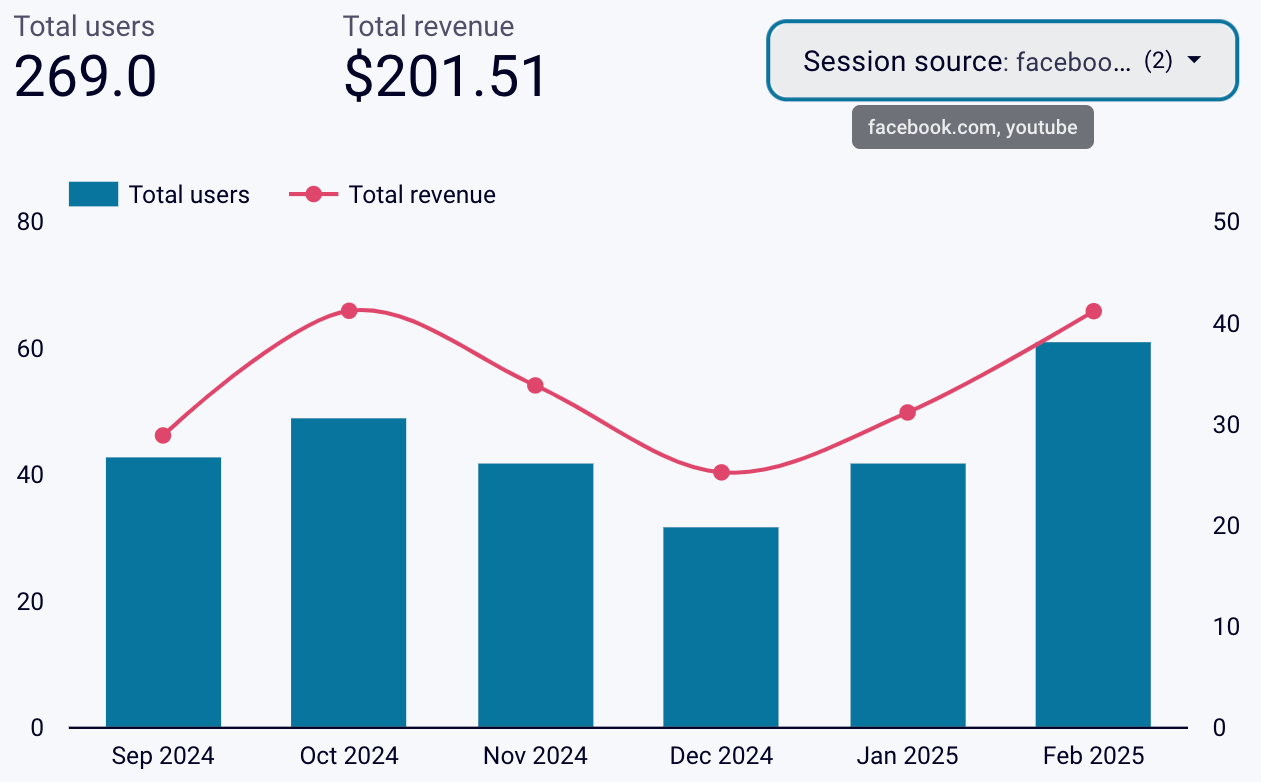
Regarding the outcome of your Facebook and YouTube content, present the total revenue and users it generated, along with the trends in these metrics over time.
Coupler.io allows you to create custom multi-channel reports and dashboards in spreadsheets and BI tools. You can also use it to collect and store data in data warehouses such as BigQuery.
The platform also provides a number of ready-to-use solutions for reporting. You can use a Google Analytics 4 dashboard template instead of creating a client report from scratch. It simply requires you to connect your data source using the built-in Coupler.io connector, and in a few moments, the dashboard will be populated with your data. Try the solution right away for free with no credit card required.
Automate reporting with Coupler.io
Get started for freeUse dashboards for data sharing
To create a report for sharing with clients or for in-house purposes, you need to collect data from GA4 and other sources, then combine and prepare it to be analysis-ready. Instead, to save time and effort, Coupler.io’s free white-label dashboard templates are available for you to use. Each template comes with a built-in Coupler.io connector, ensuring that the data is automatically loaded into the dashboard and visualized.
All-in-one marketing dashboard
This dashboard lets you show the client’s performance across various channels. It aggregates data from GA4, Google Search Console, ad platforms, social media, email tools, and YouTube.
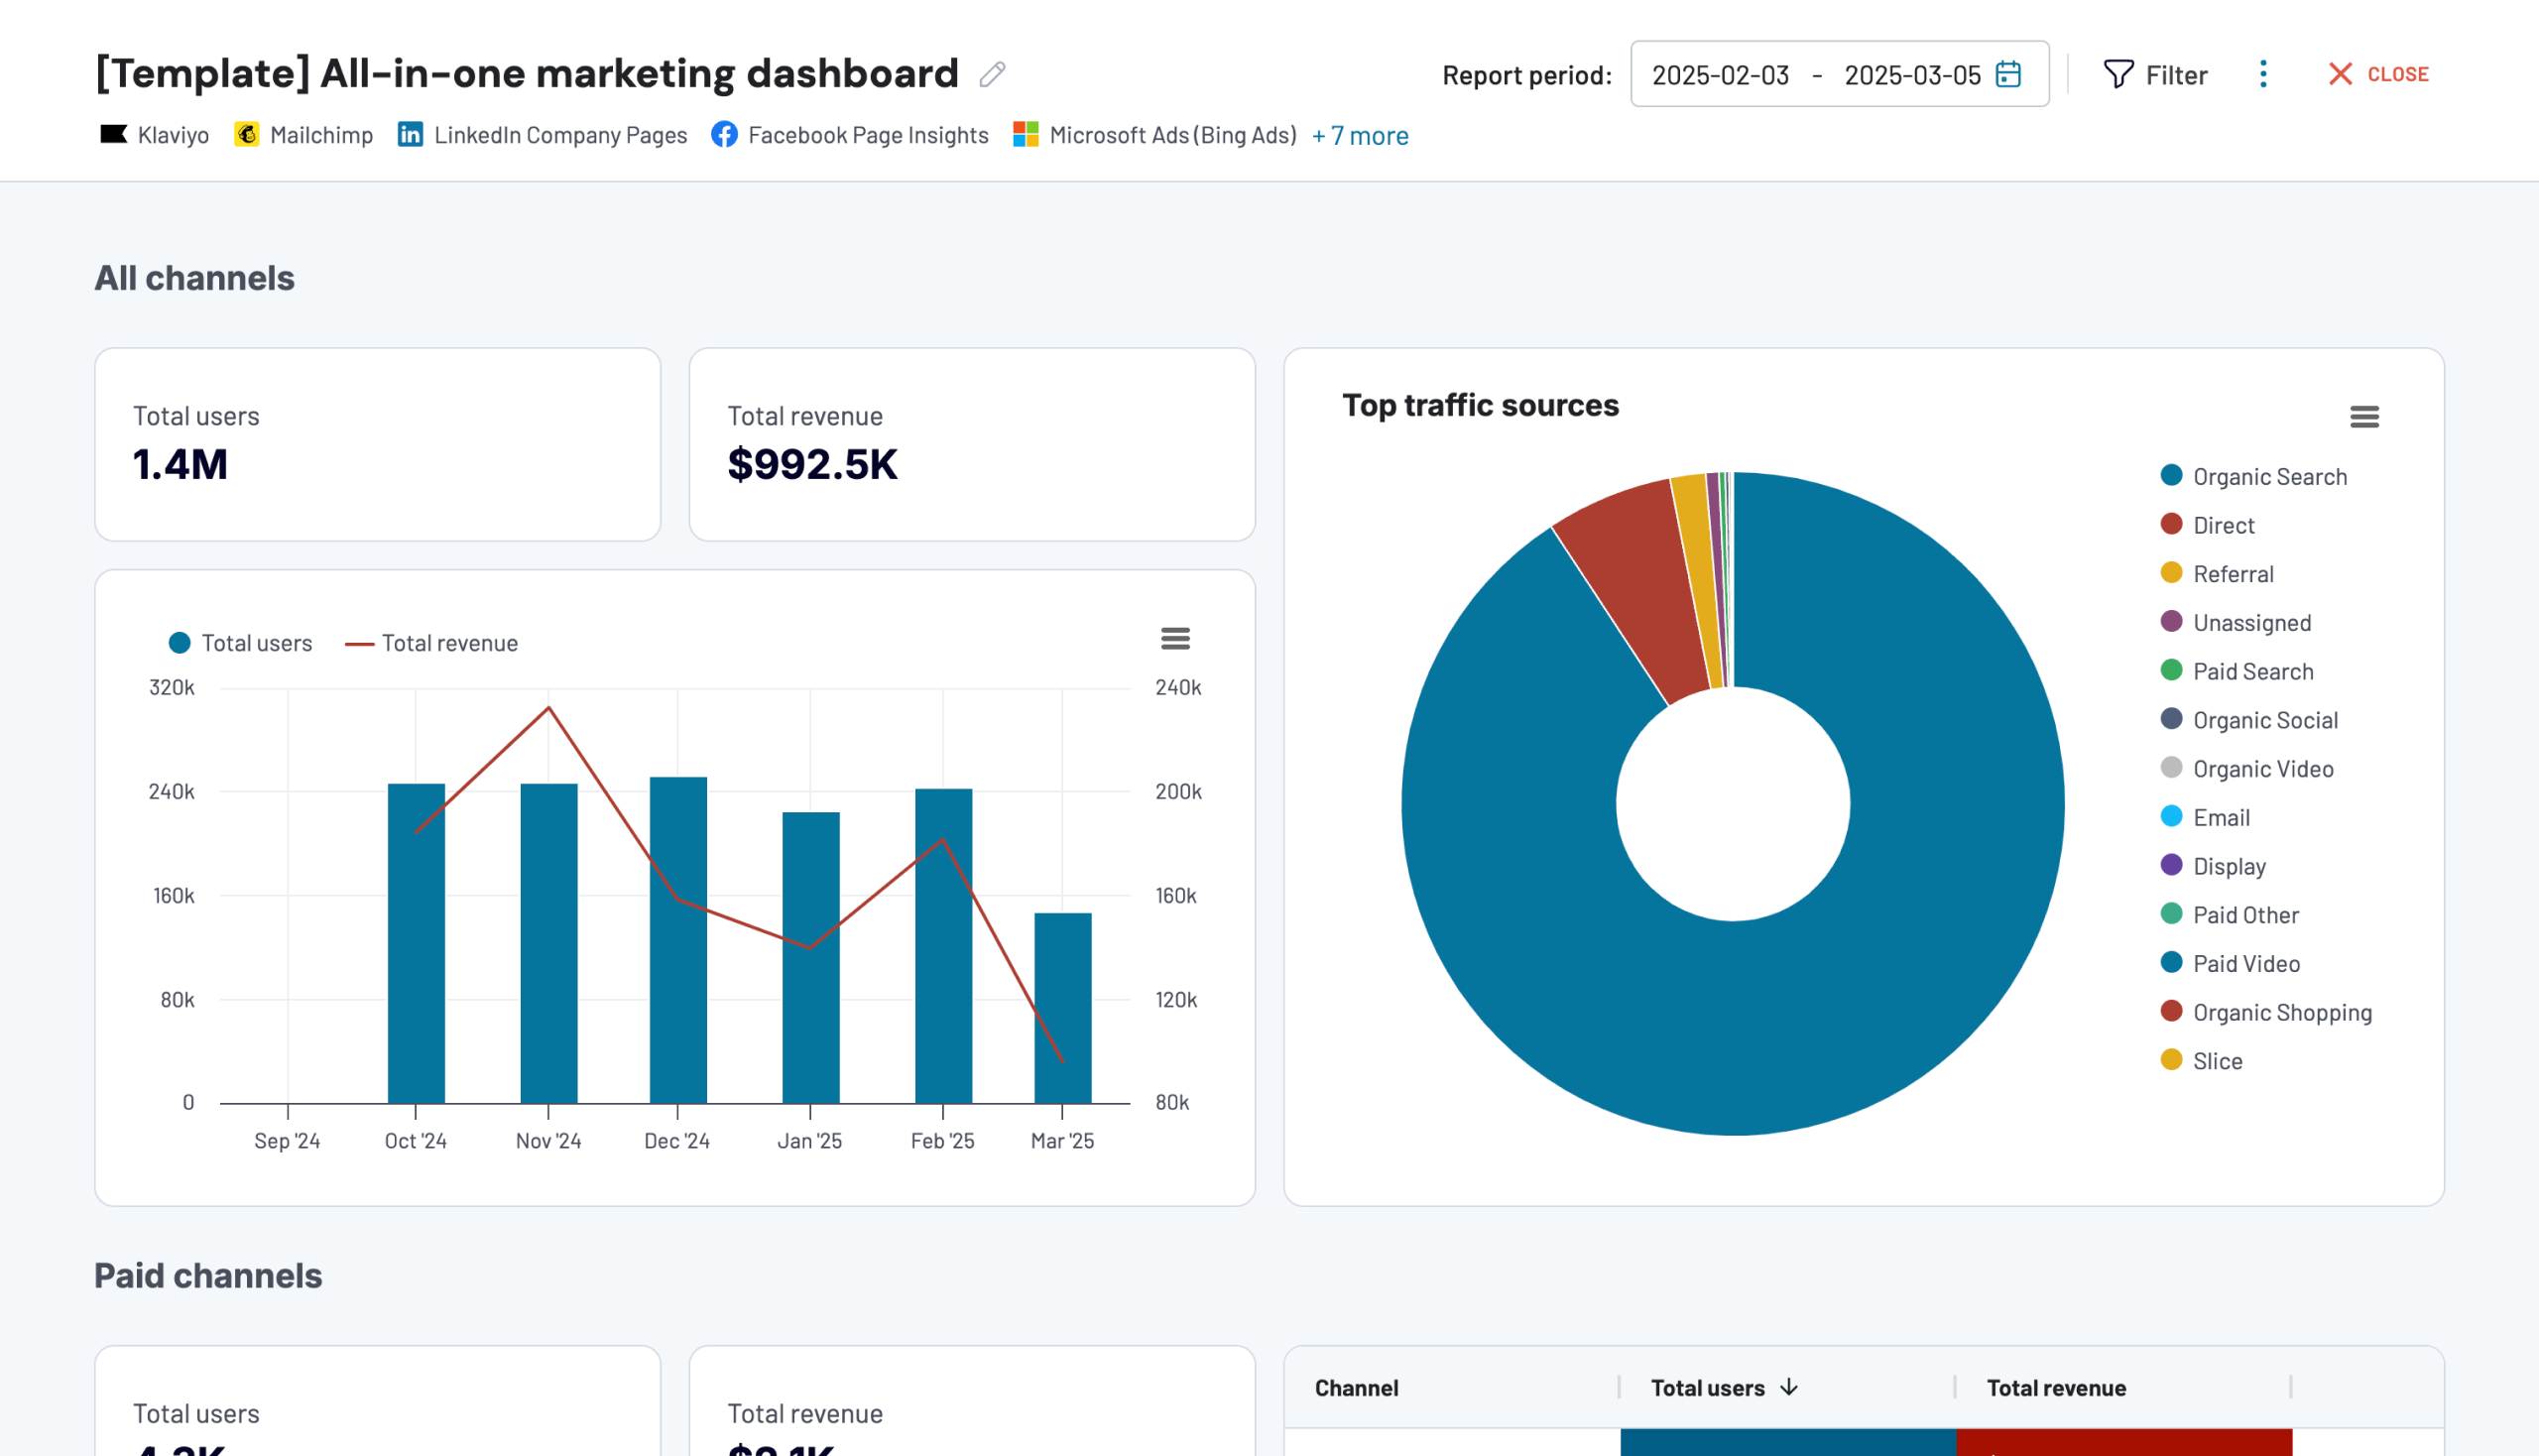
Key takeaways you’ll deliver using this dashboard:
- All channels’ overview: Provide a high-level summary of how your client’s marketing channels perform. Show each one’s contribution to the overall traffic.
- PPC analysis: Demonstrate the month-to-month performance of your client’s paid channels. Present results across all the platforms, plus your client can use filters to view them separately.
- Insights into organic traffic: Aggregate impressions, clicks, CTR, and average position from GSC. Let your client see total users and revenue specific to Google or other search engines, such as Bing, Yahoo, DuckDuckGo, etc.
- Social media performance: Break down your client’s social media channel data in detail. They will be able to look at impressions and page views across all of them or focus on specific platforms.
- Email metrics: Reveal the results of the email marketing campaigns you’re running for your client based on Klaviyo and Mailchimp data. Highlight metrics like emails delivered, open rates, bounces, unsubscribes, and clicks.
This report is available in Coupler.io and as a template in Looker Studio. Try it right away for free! To set up the Looker Studio dashboard template, go to the template’s Readme tab and follow the provided instructions.
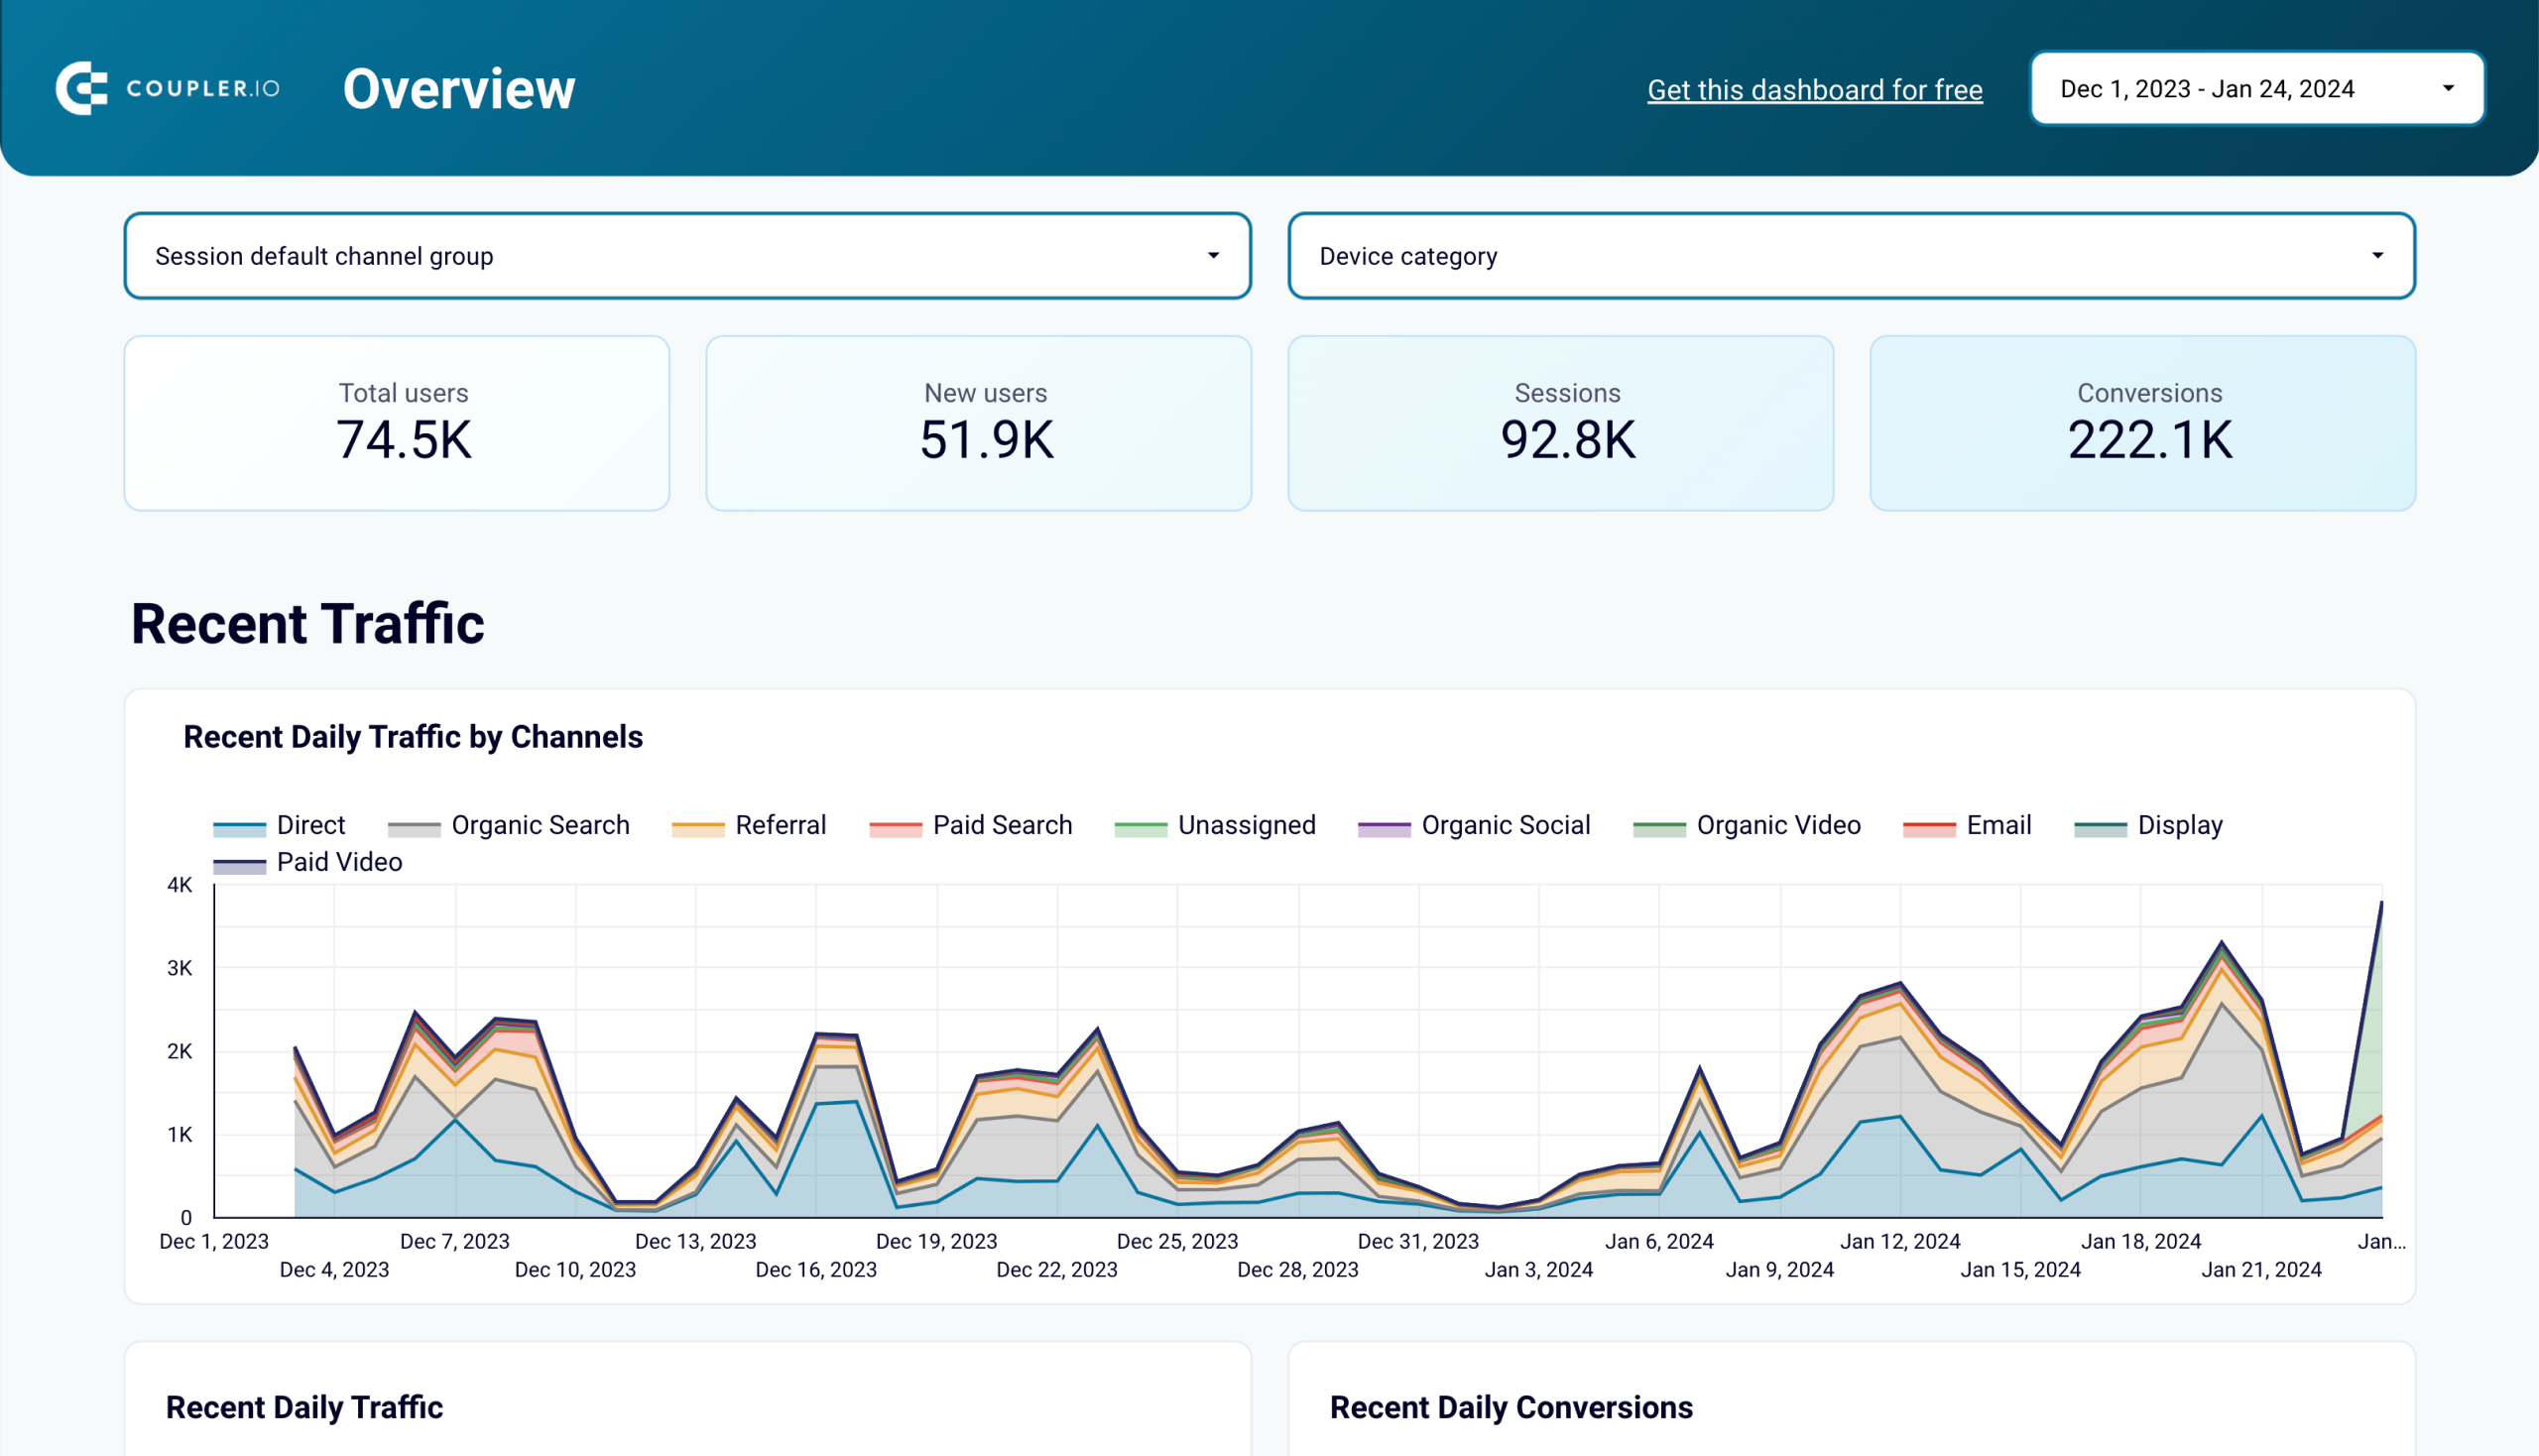
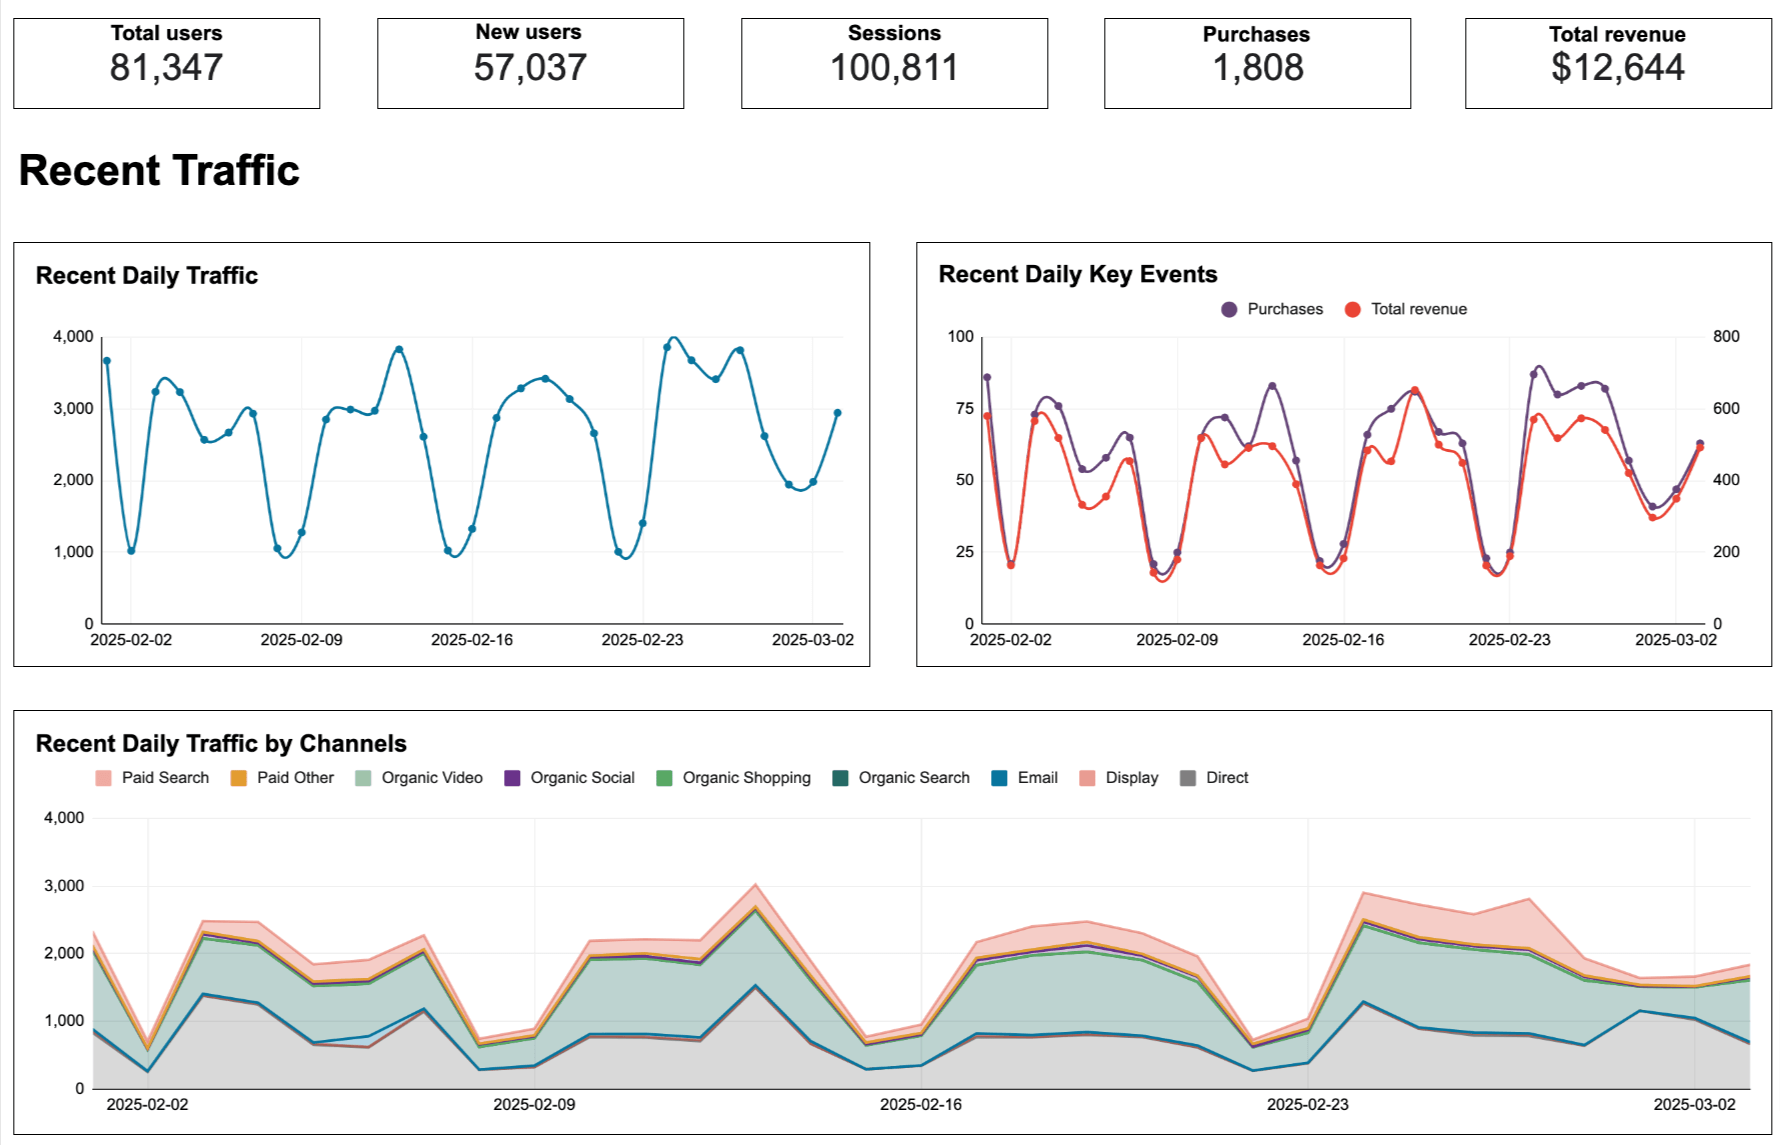
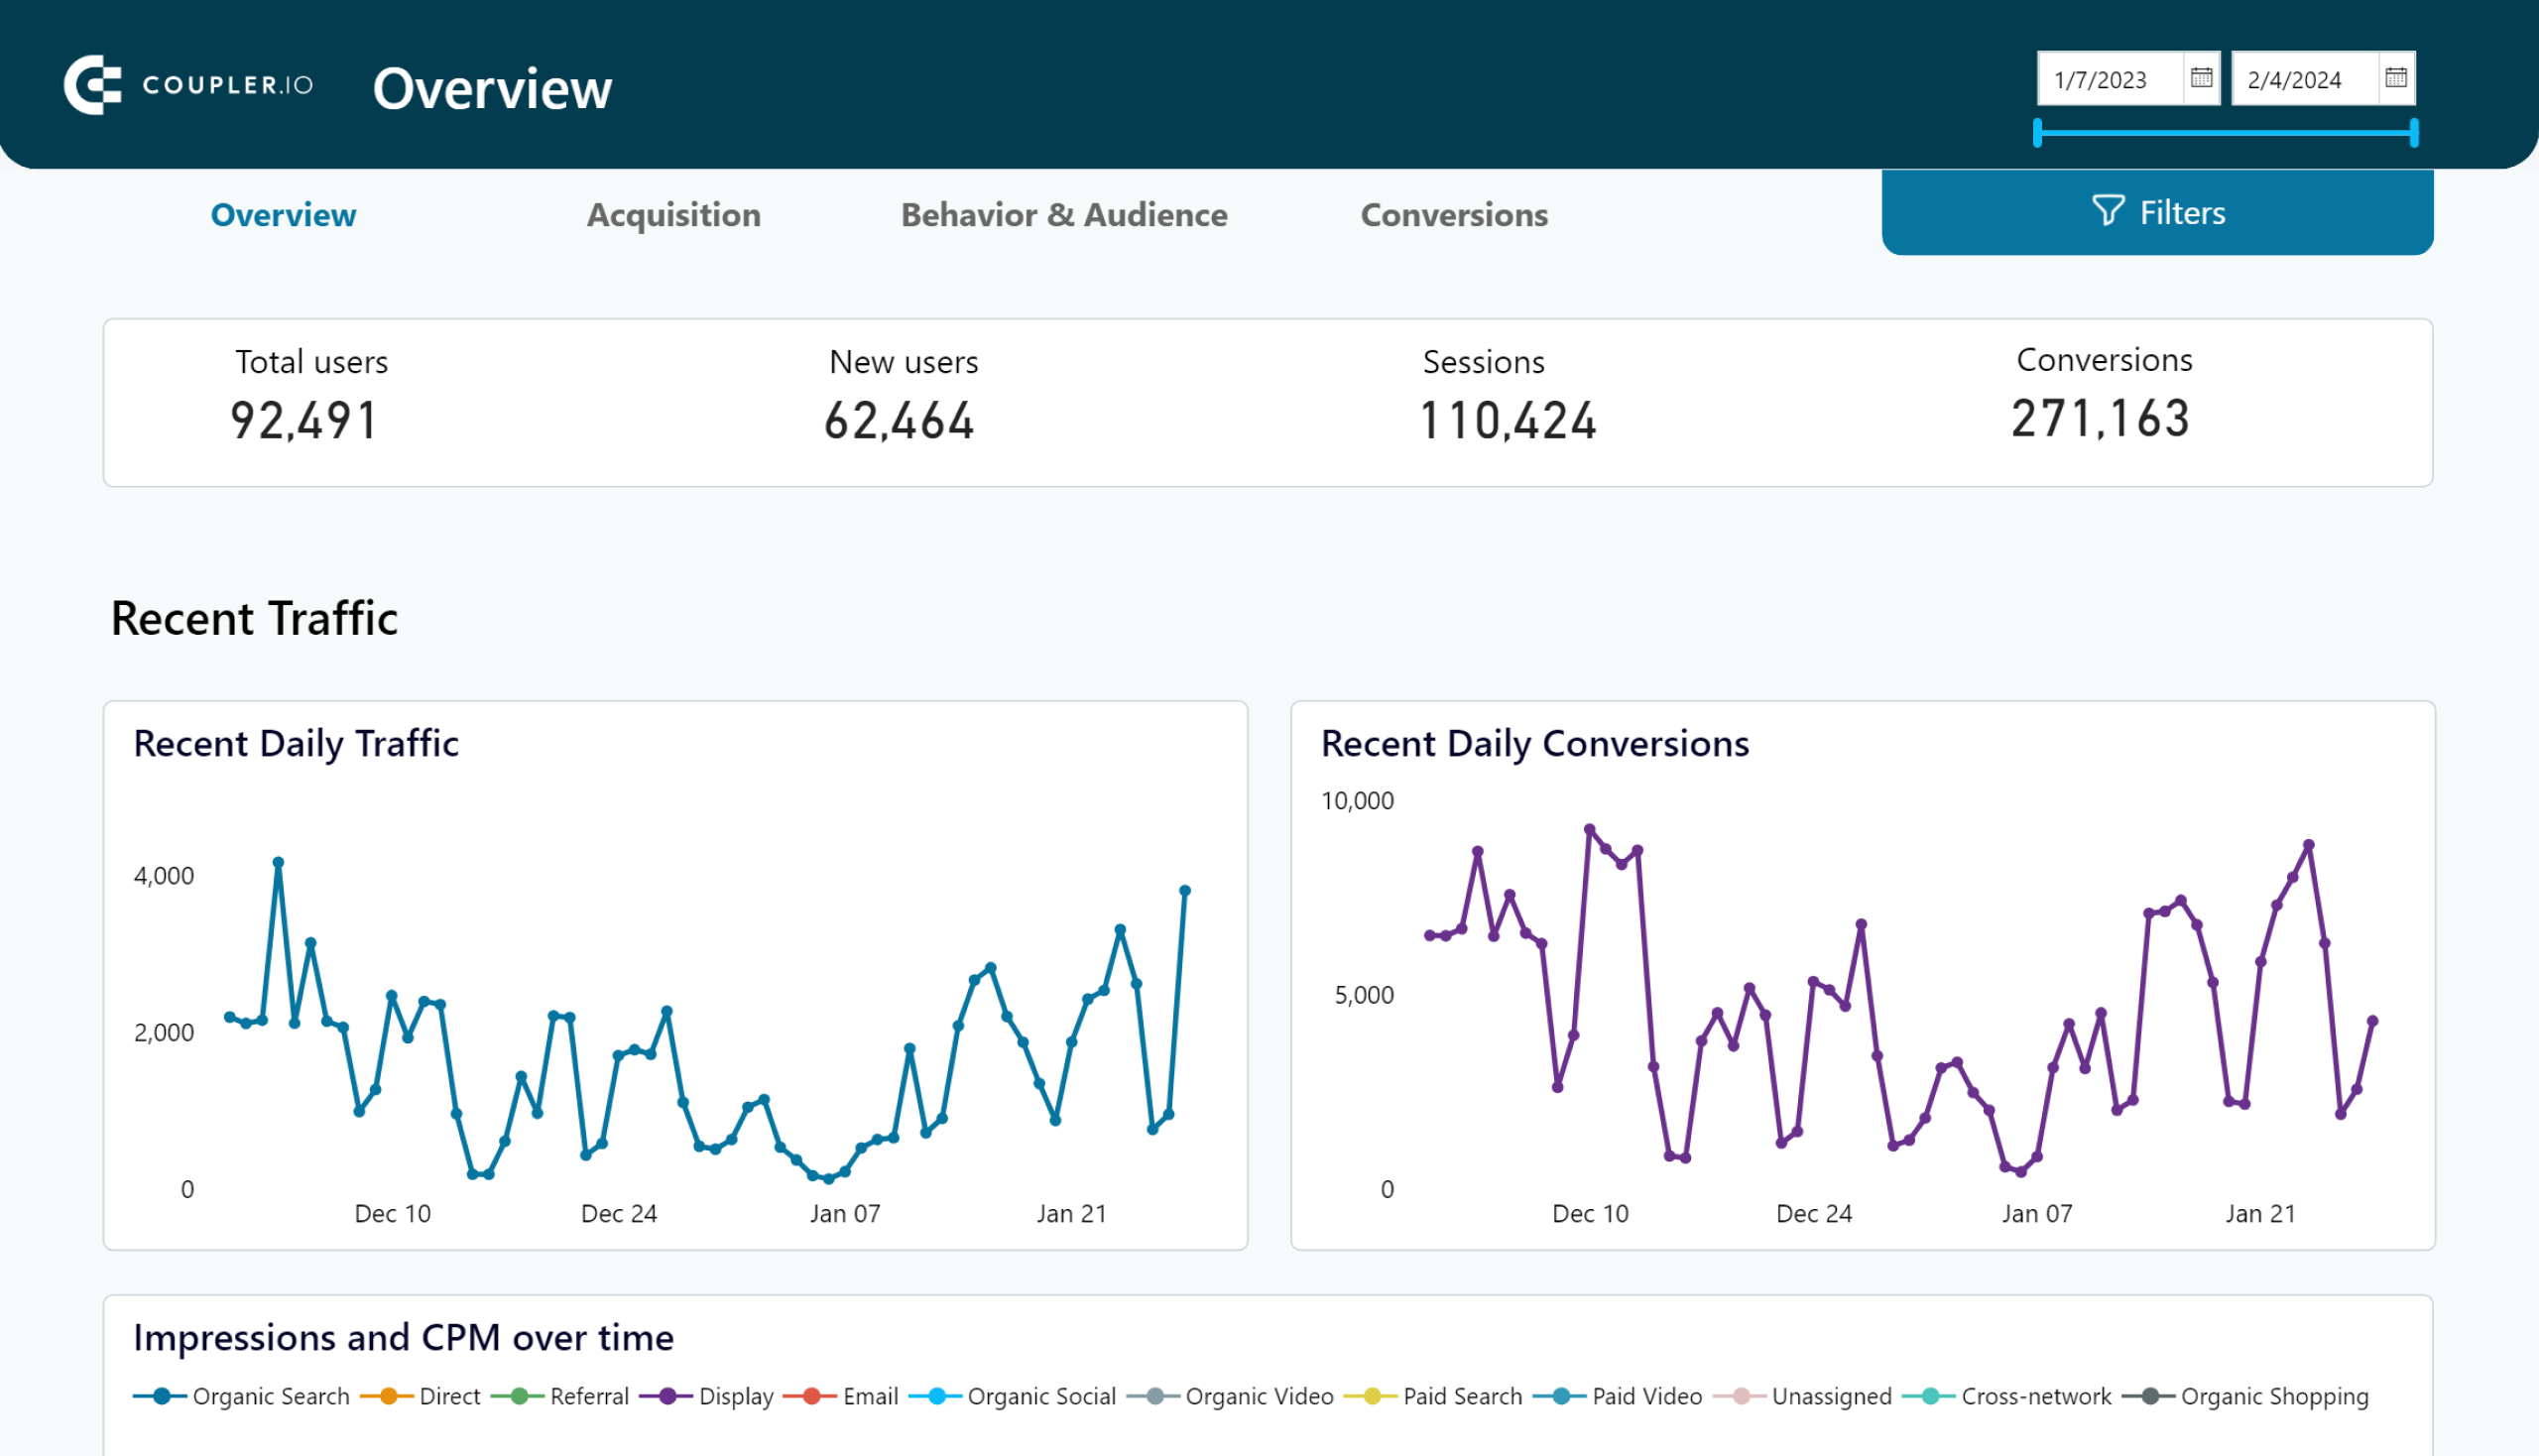
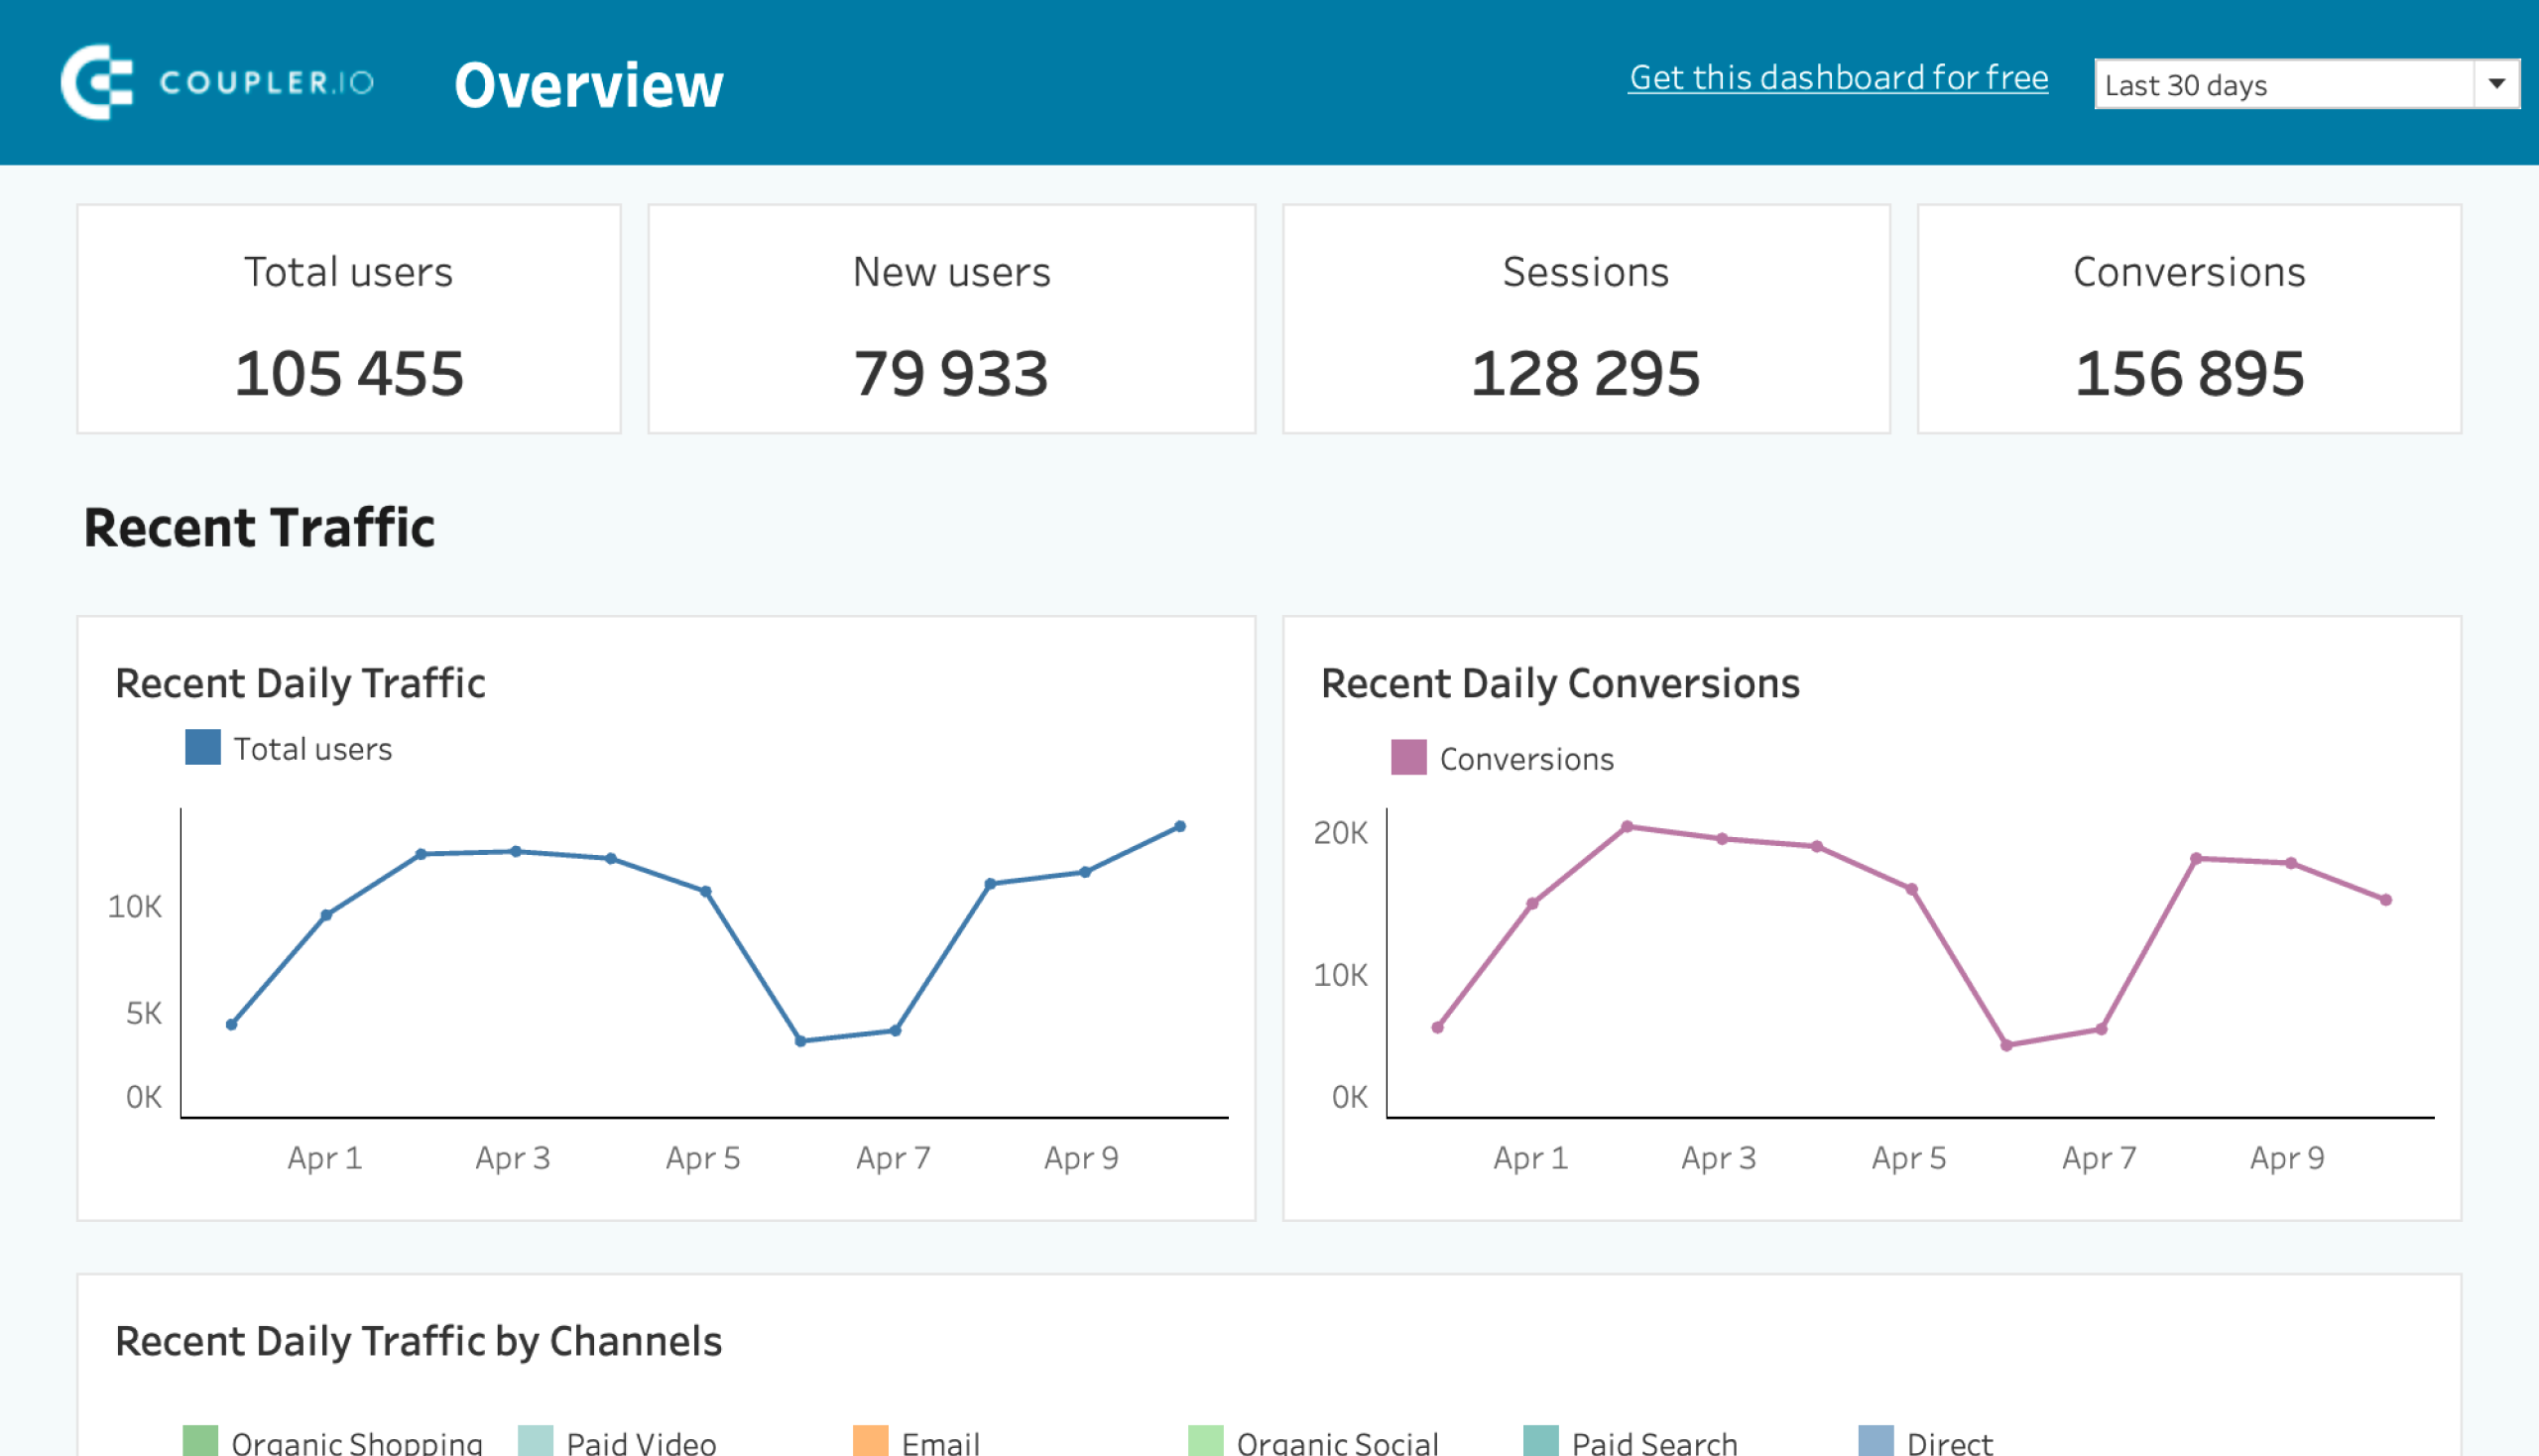
Web analytics dashboard
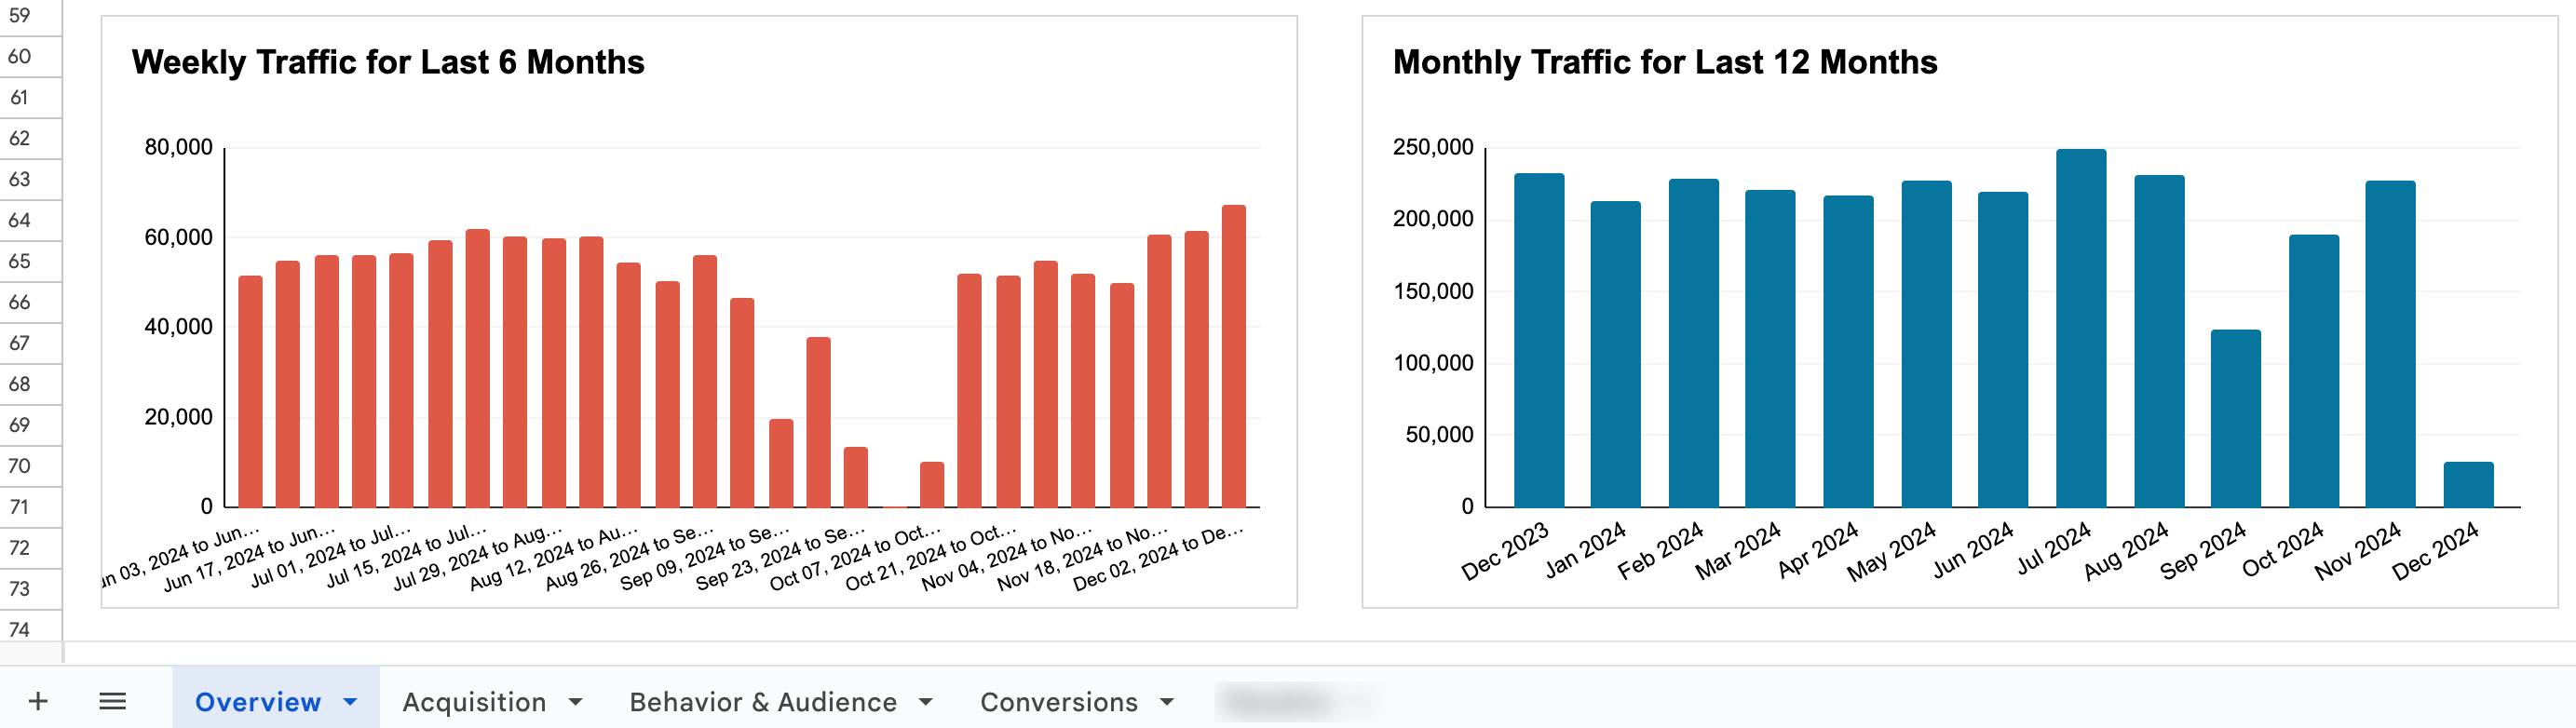
The web analytics dashboard provides an overview of day-to-day updates on essential product and marketing metrics. Your client can open it anytime to see the growth of their daily website traffic and conversions.
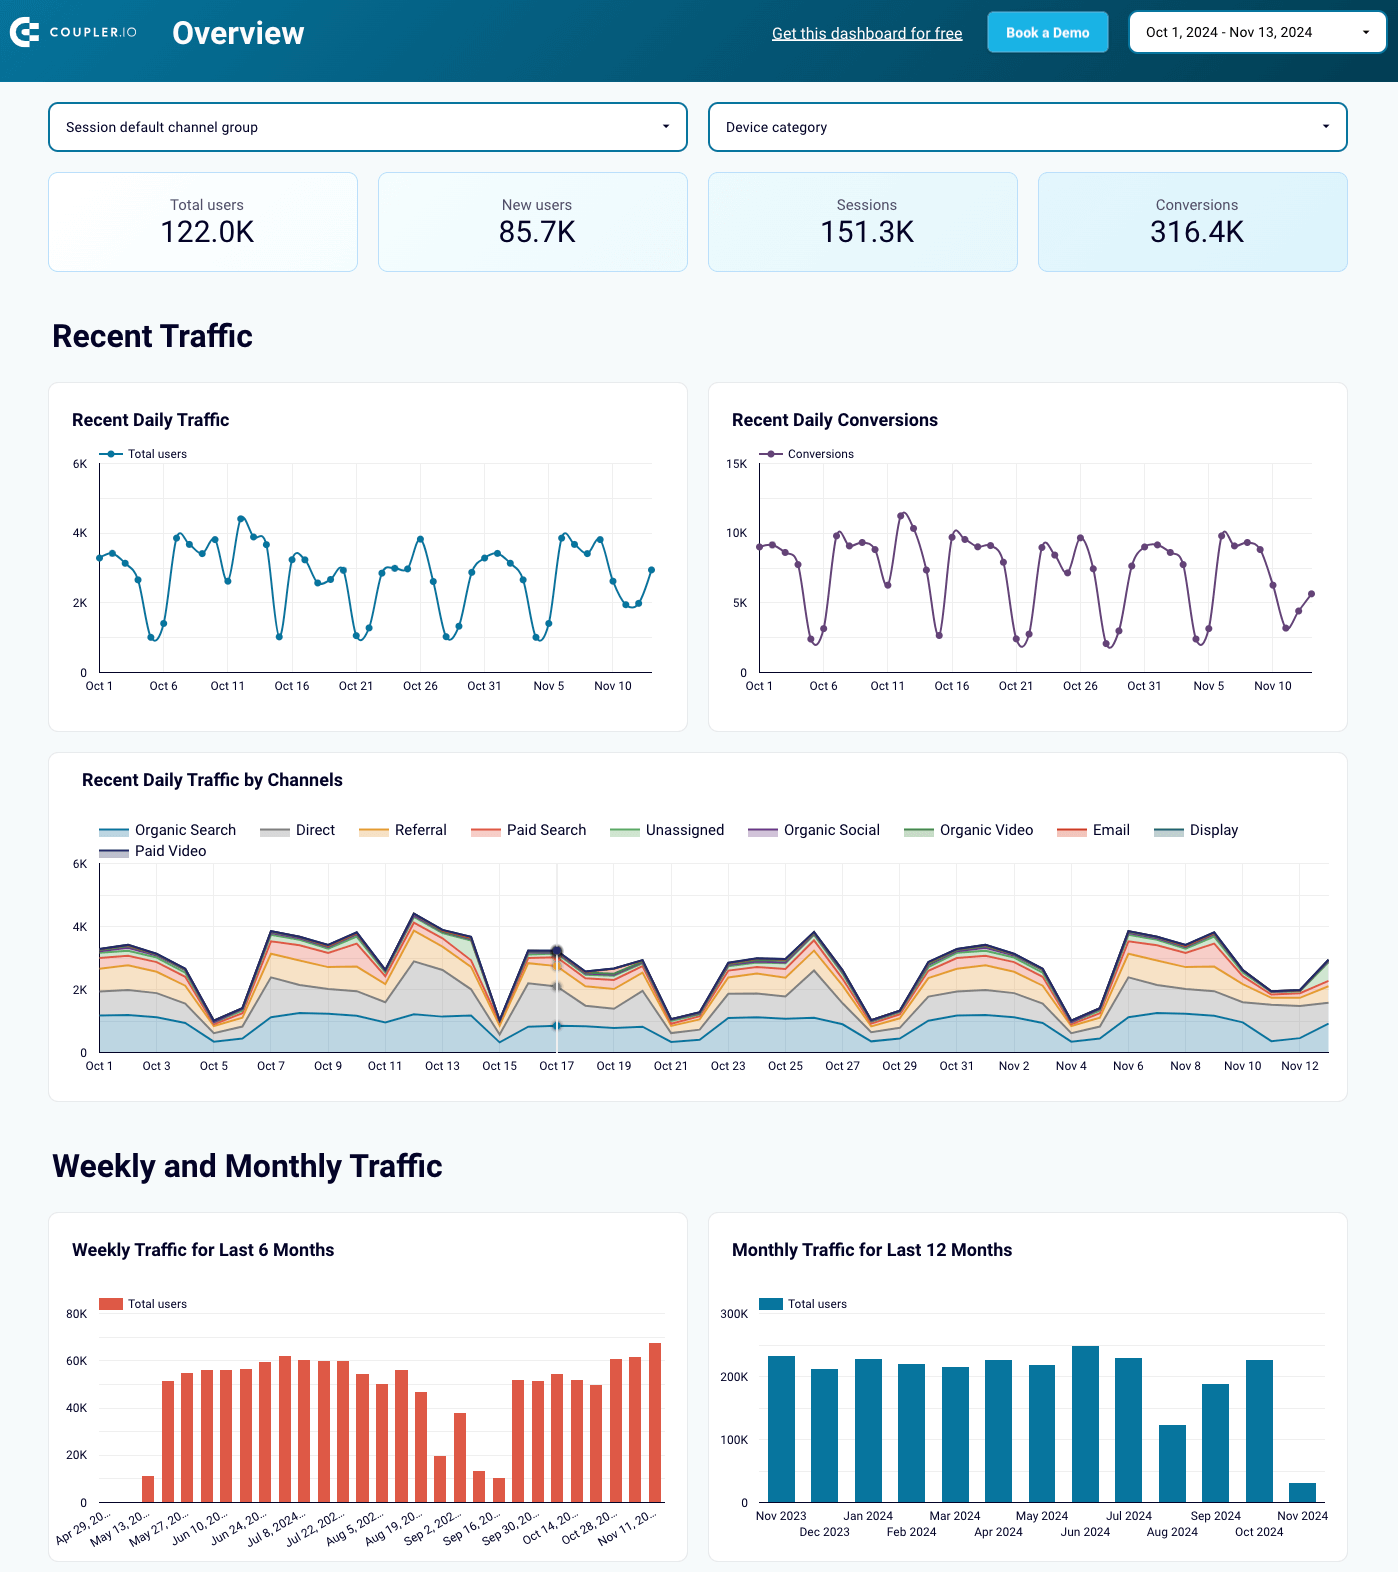
By using this dashboard, your client will be able to see their marketing performance from the following aspects:
- Acquisition: Identify where the audience comes from, including channels, countries, devices, and more.
- Behavioral analytics: Check out customer behavior and engagement. Look at metrics like average engagement time, views, number of engaged sessions per user, and others.
- Conversions: View details on how users convert, such as total users, conversion rates, total revenue, etc., and conversion dynamics.
The dashboard is offered in Looker Studio, Google Sheets, Power BI, and Tableau. Click Readme/Setup guide for step-by-step instructions and use it for your reporting needs.
Web analytics dashboard for Looker Studio
Use Google Analytics 4 data to display website traffic and the pages that resonate most with the audience.


Web analytics dashboard for Google Sheets
Demonstrate the website’s traffic sources, user interactions, and conversion metrics based on data from GA4.

Web analytics dashboard for Power BI
Let your client look at the website’s traffic acquisition, audience, and conversions with Google Analytics 4 data.

Web analytics dashboard for Tableau
Share traffic performance, conversion funnel, and other insights from Google Analytics 4 with your client.

Google Analytics 4 dashboard for multiple properties
This dashboard aggregates GA4 data from multiple websites on a single page in Looker Studio, so there’s no need to jump between browser tabs. If you’re managing marketing for several of the client’s websites, you can share the dashboard with them so they see the total traffic across all these sites. Besides client reporting purposes, you can use this dashboard in-house to track the marketing efforts run for each of your agency’s clients, all in a single view.
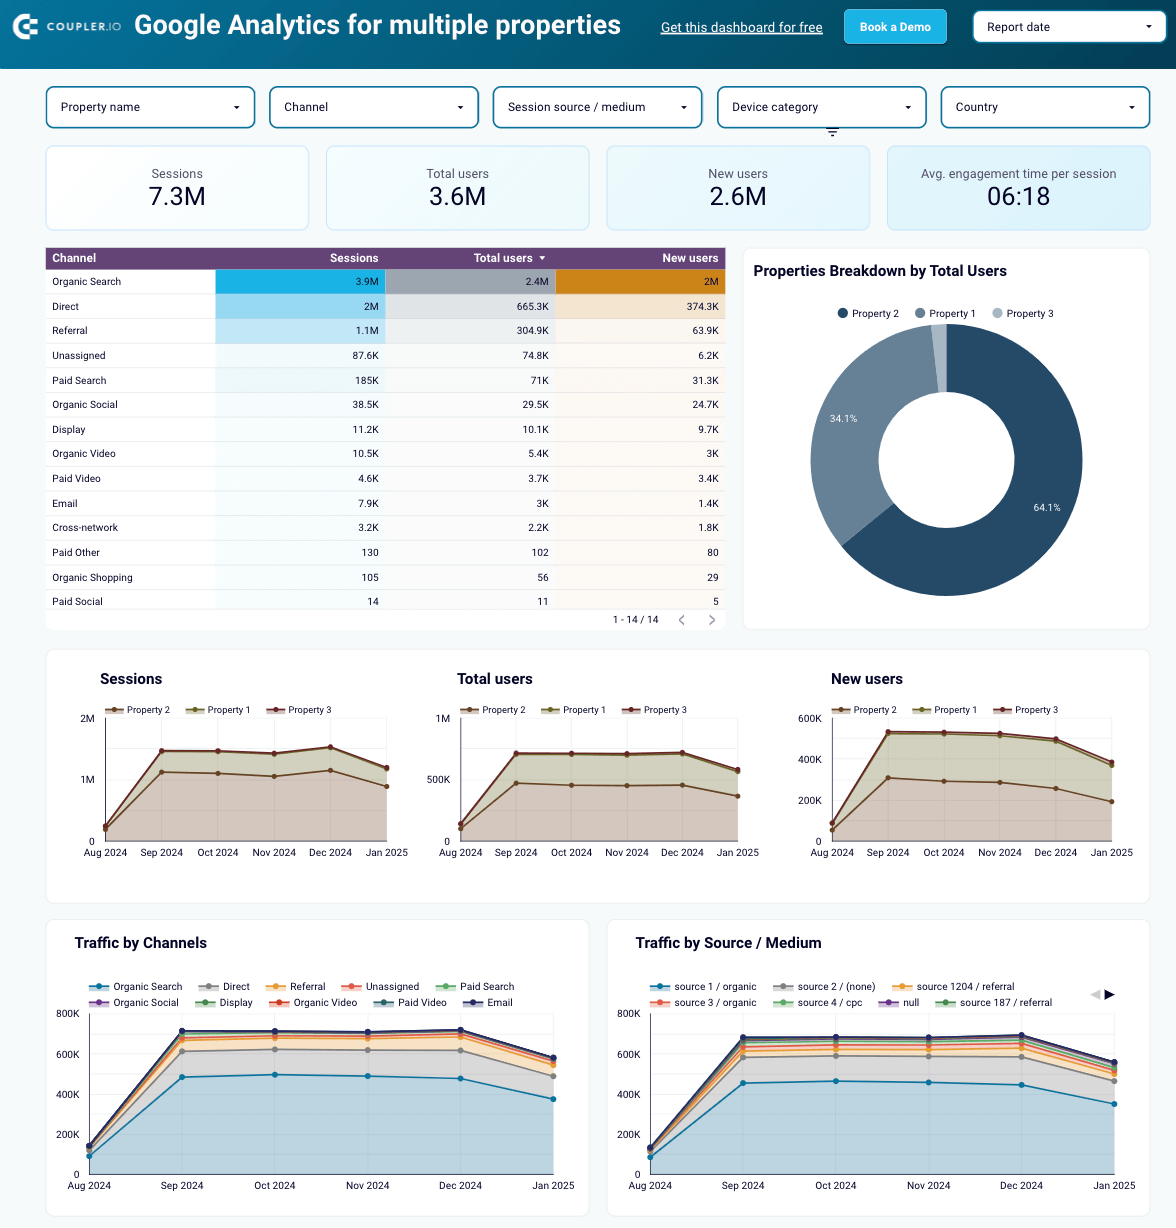
Set up this dashboard to inform the client about the following:
- Total performance overview + filters: Show key performance metrics and let the client filter them by properties (websites), channels, and other criteria.
- Performance dynamics: Reveal the traffic progress for all the client’s websites month by month.
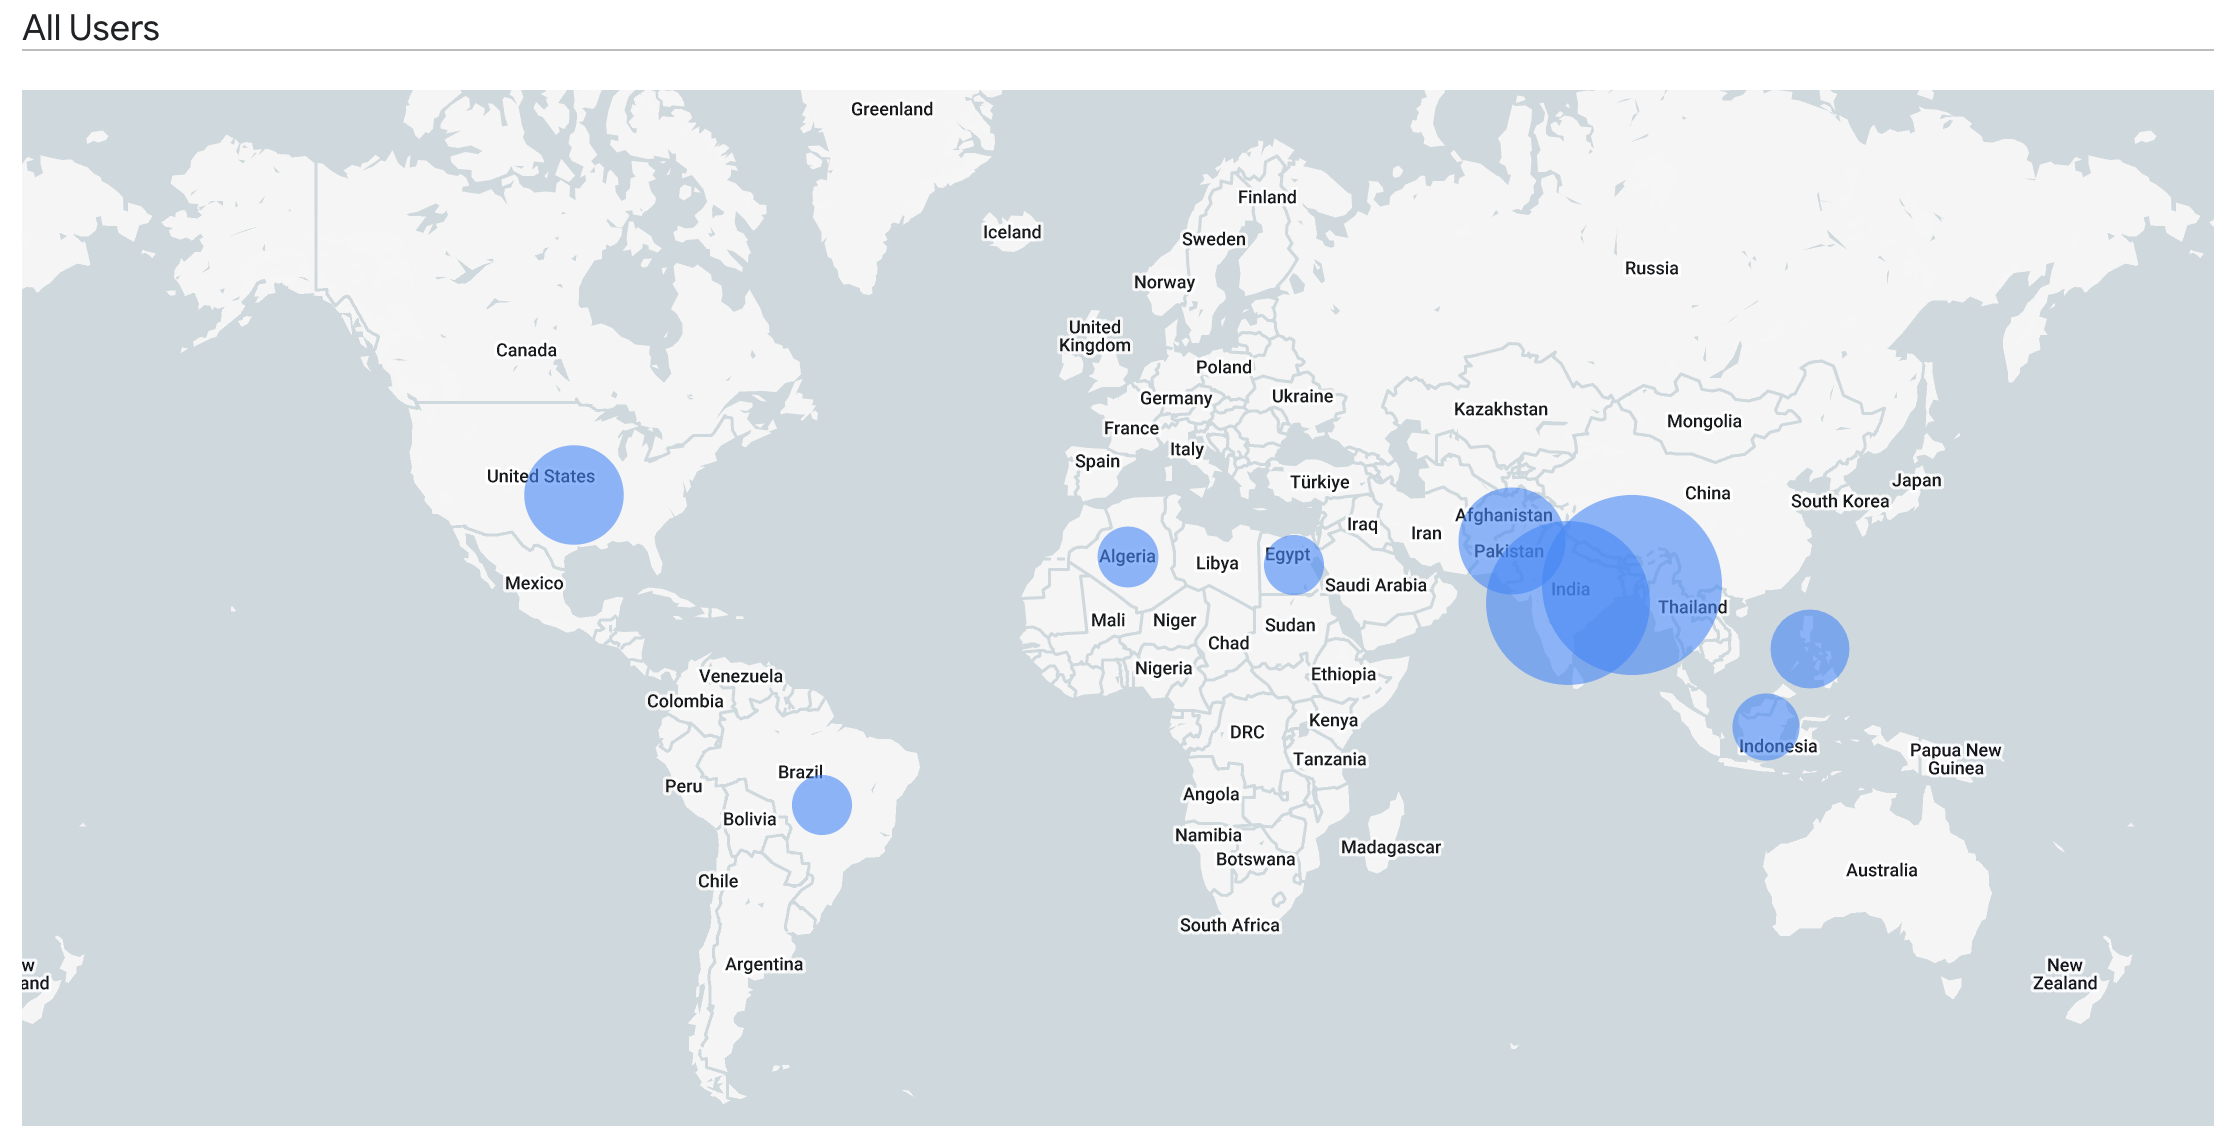
- Geo-specific performance: Illustrate where most of the traffic originates so the client can make smart decisions about localization efforts.
Navigate to the Readme tab inside the template to follow the instructions for implementing the dashboard.
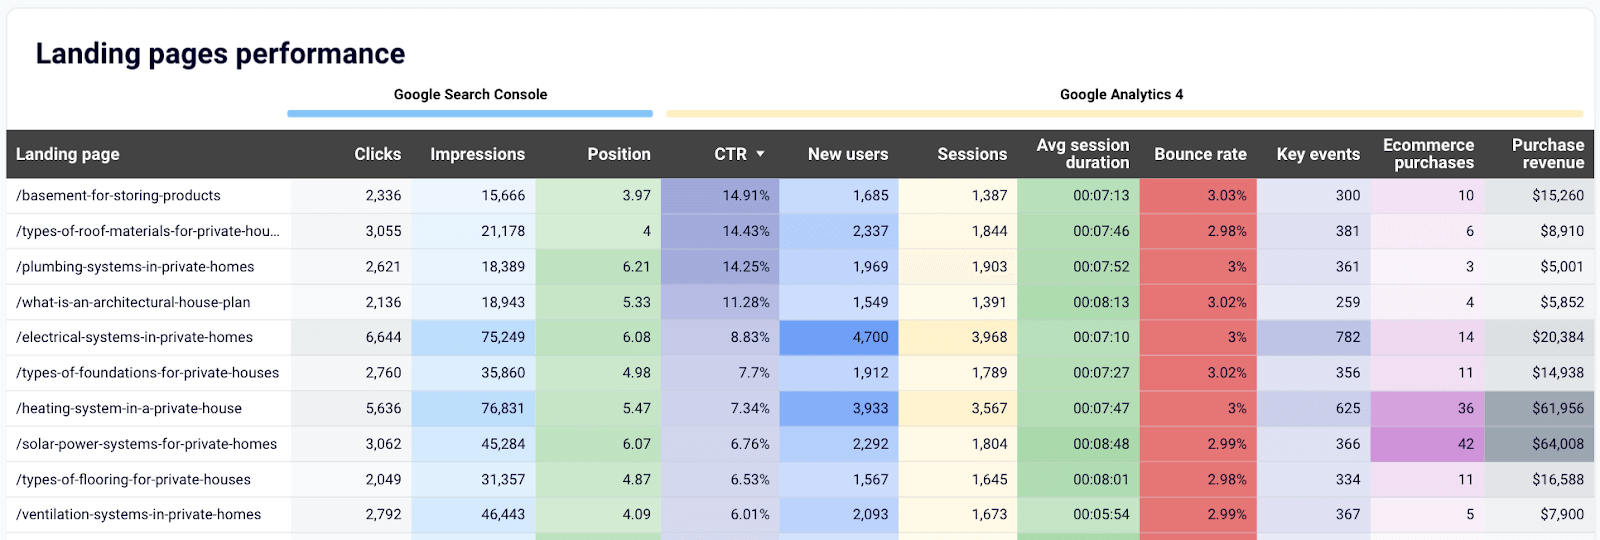
Landing page performance dashboard
This one-page dashboard will let your client know how effectively landing pages drive traffic, engage visitors, and convert them into customers based on data from GA4 and Search Console.
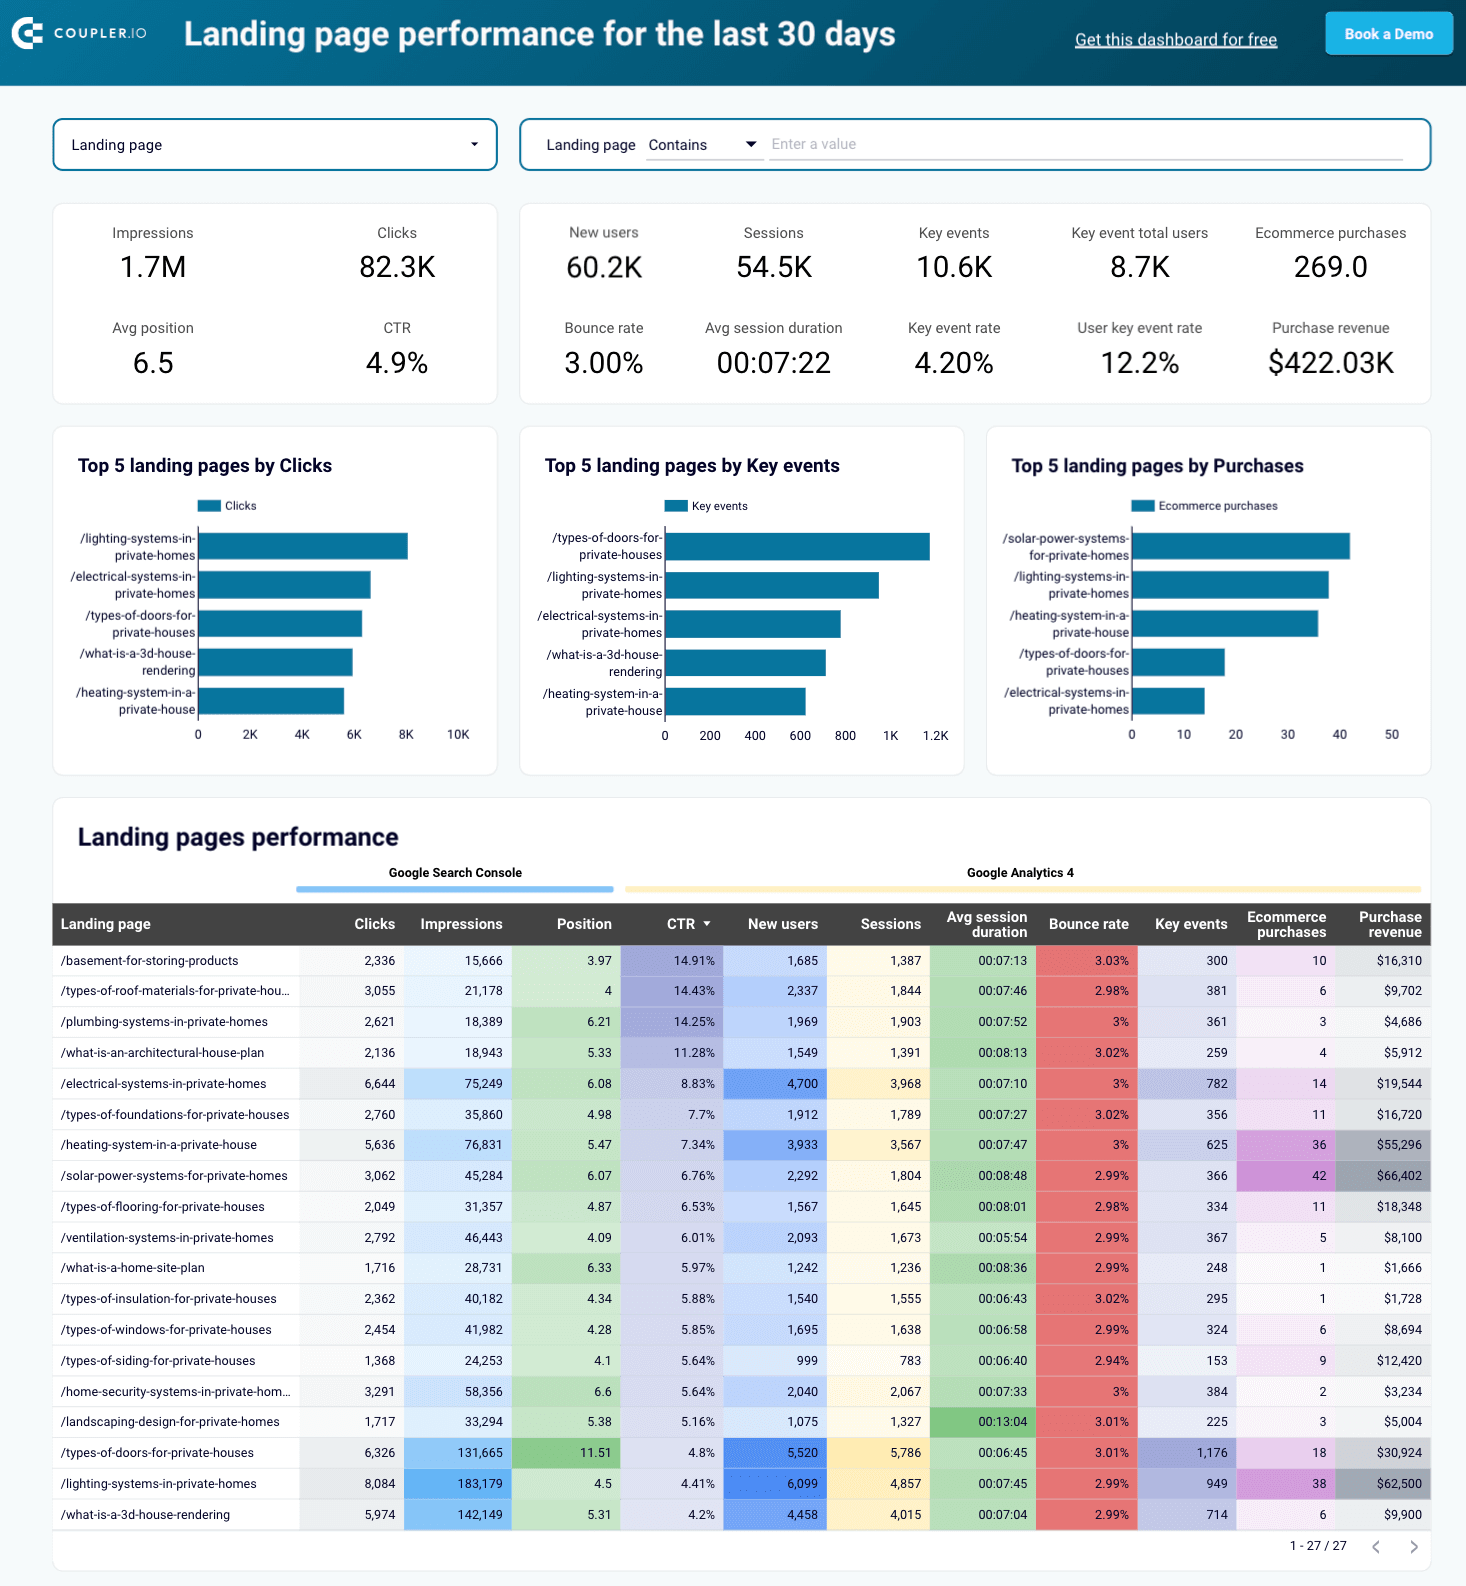
Through this dashboard, you’ll share the following insights with your client:
- Landing page performance: Show how each landing page is doing regarding metrics such as clicks, impressions, average position, and CTR. Demonstrate total users, sessions, and average session duration so the client can see user behavior.
- User engagement: Illustrate engagement with metrics like bounce rate, key event total users, and event count to point out which pages capture and retain the audience’s attention.
- Conversion and revenue impact: Display how landing pages contribute to business outcomes through key events, the user key event rate, and purchase revenue.
The dashboard has two versions: one for Google Sheets and another for Looker Studio. To start using either, click the template’s Readme tab and proceed with the straightforward setup guide.
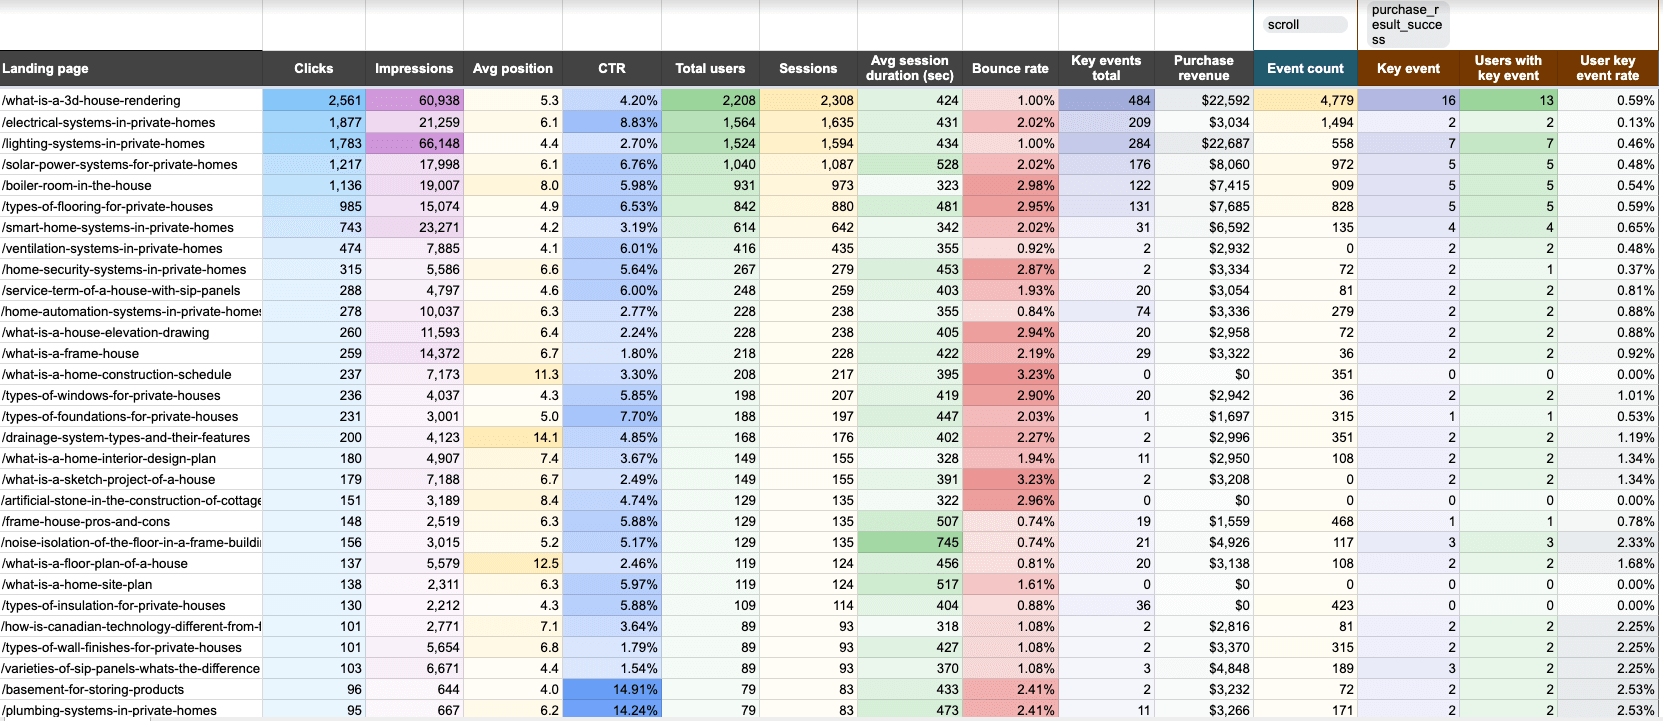
Landing page performance dashboard in Google Sheets
Show the effectiveness of landing pages, from traffic and engagement to conversions.

Landing page performance dashboard in Looker Studio
Reveal the performance of landing pages, including traffic, clicks, bounce rate, and more.
Customer acquisition dashboard
With the customer acquisition dashboard in Looker Studio, you can present your client with a visualized lead generation funnel, trends over time, and platform performance. It integrates Pipedrive/HubSpot data with metrics from GA4 and various ad platforms.
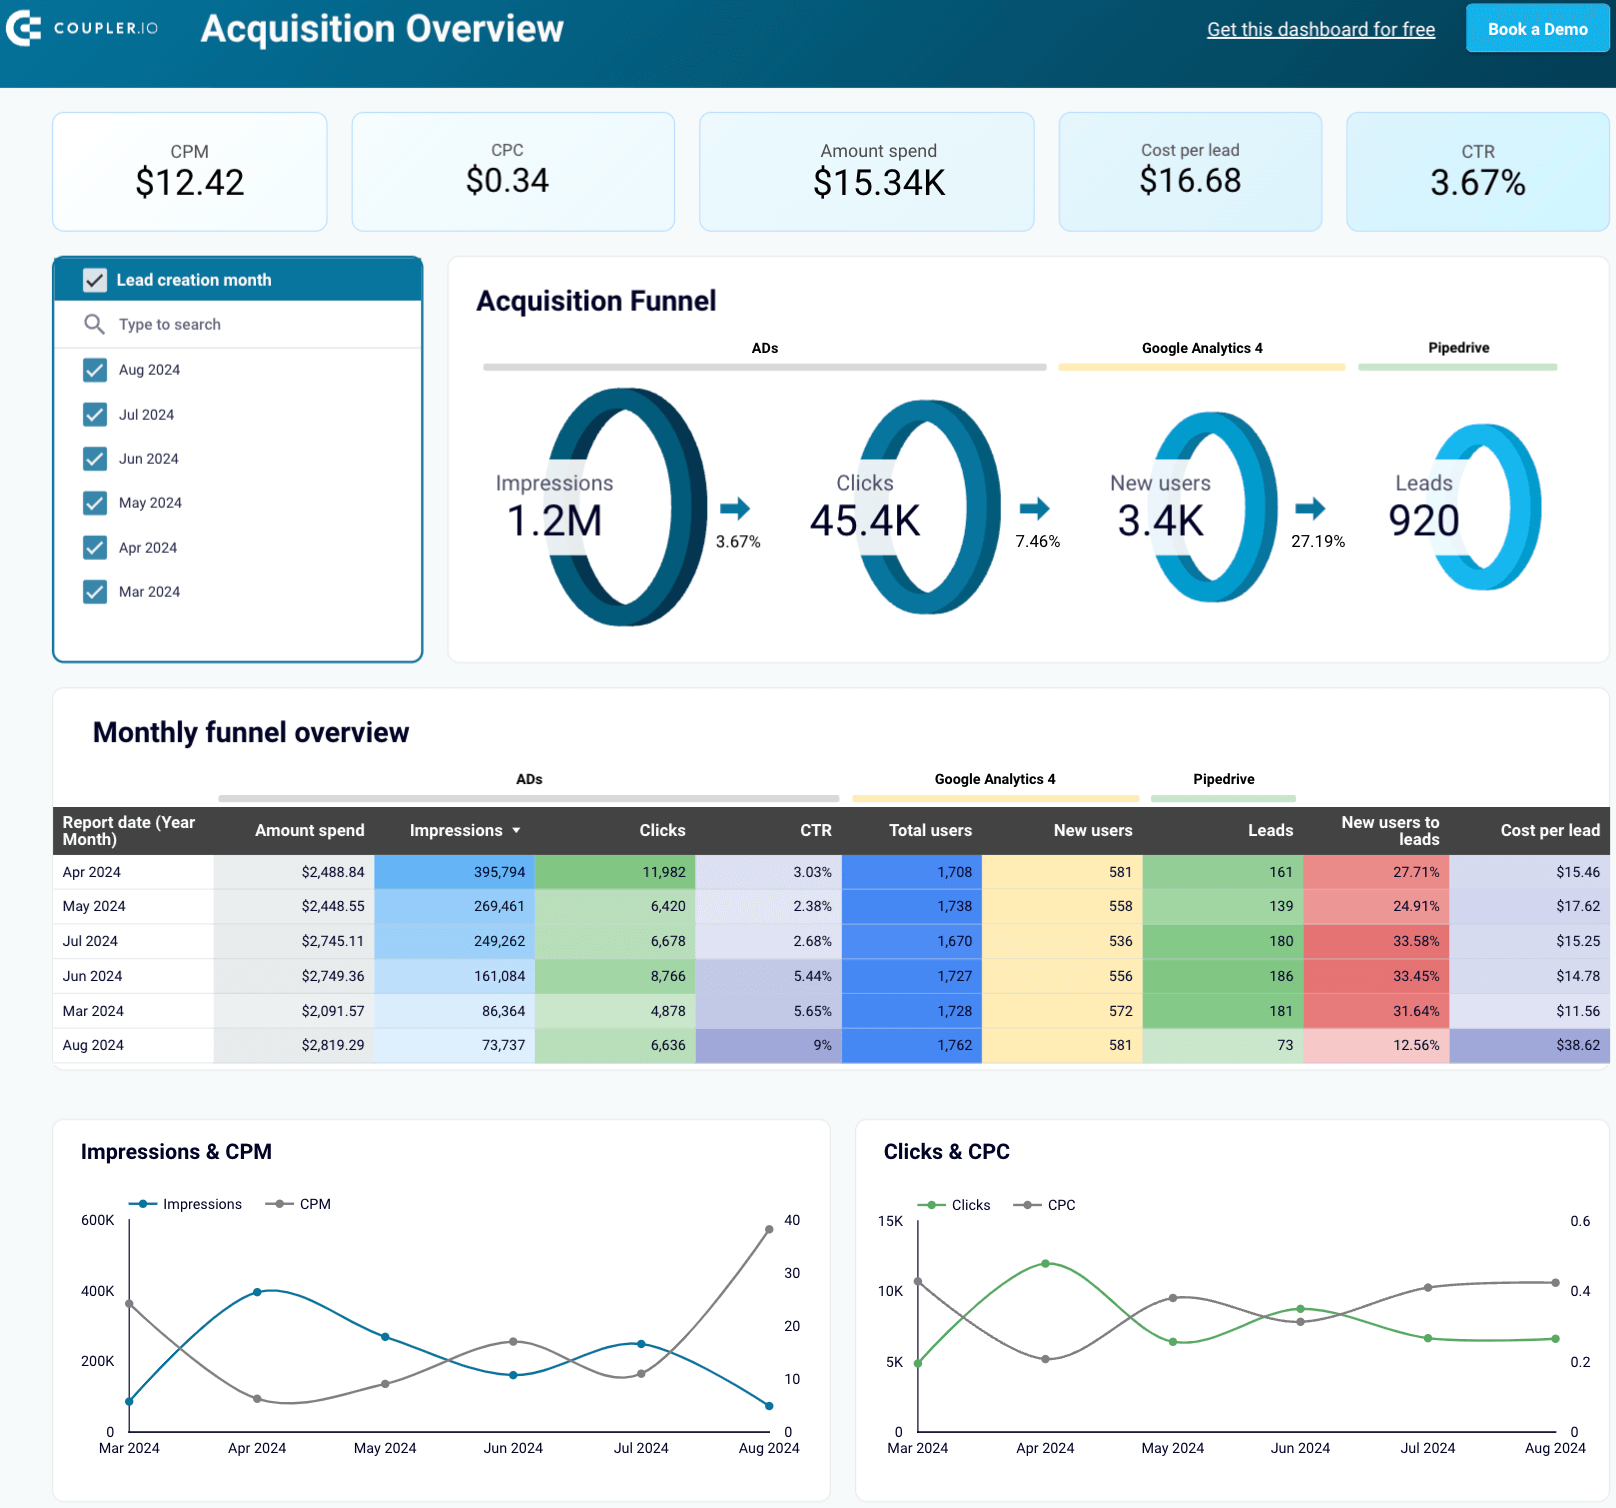
By sharing this dashboard, you can offer your client the following data points:
- Multi-source marketing funnel analytics: Show the impressions and clicks your ads generate, the number of users visiting the client’s website, and the leads entering their Pipedrive/HubSpot.
- Month-by-month funnel performance: Demonstrate monthly changes in the funnel to suggest correlations with marketing and lead generation activities. Pinpoint the best-performing months and the campaigns or activities that led to higher results.
- Spending and conversion: Provide a comparison of spending across different platforms with conversion rates during the same period to reveal the cost efficiency of your marketing efforts.
Each of the templates is compatible with a single CRM – either Pipedrive or HubSpot. Go to Readme to learn how to connect to the dashboard and get the data visualized.
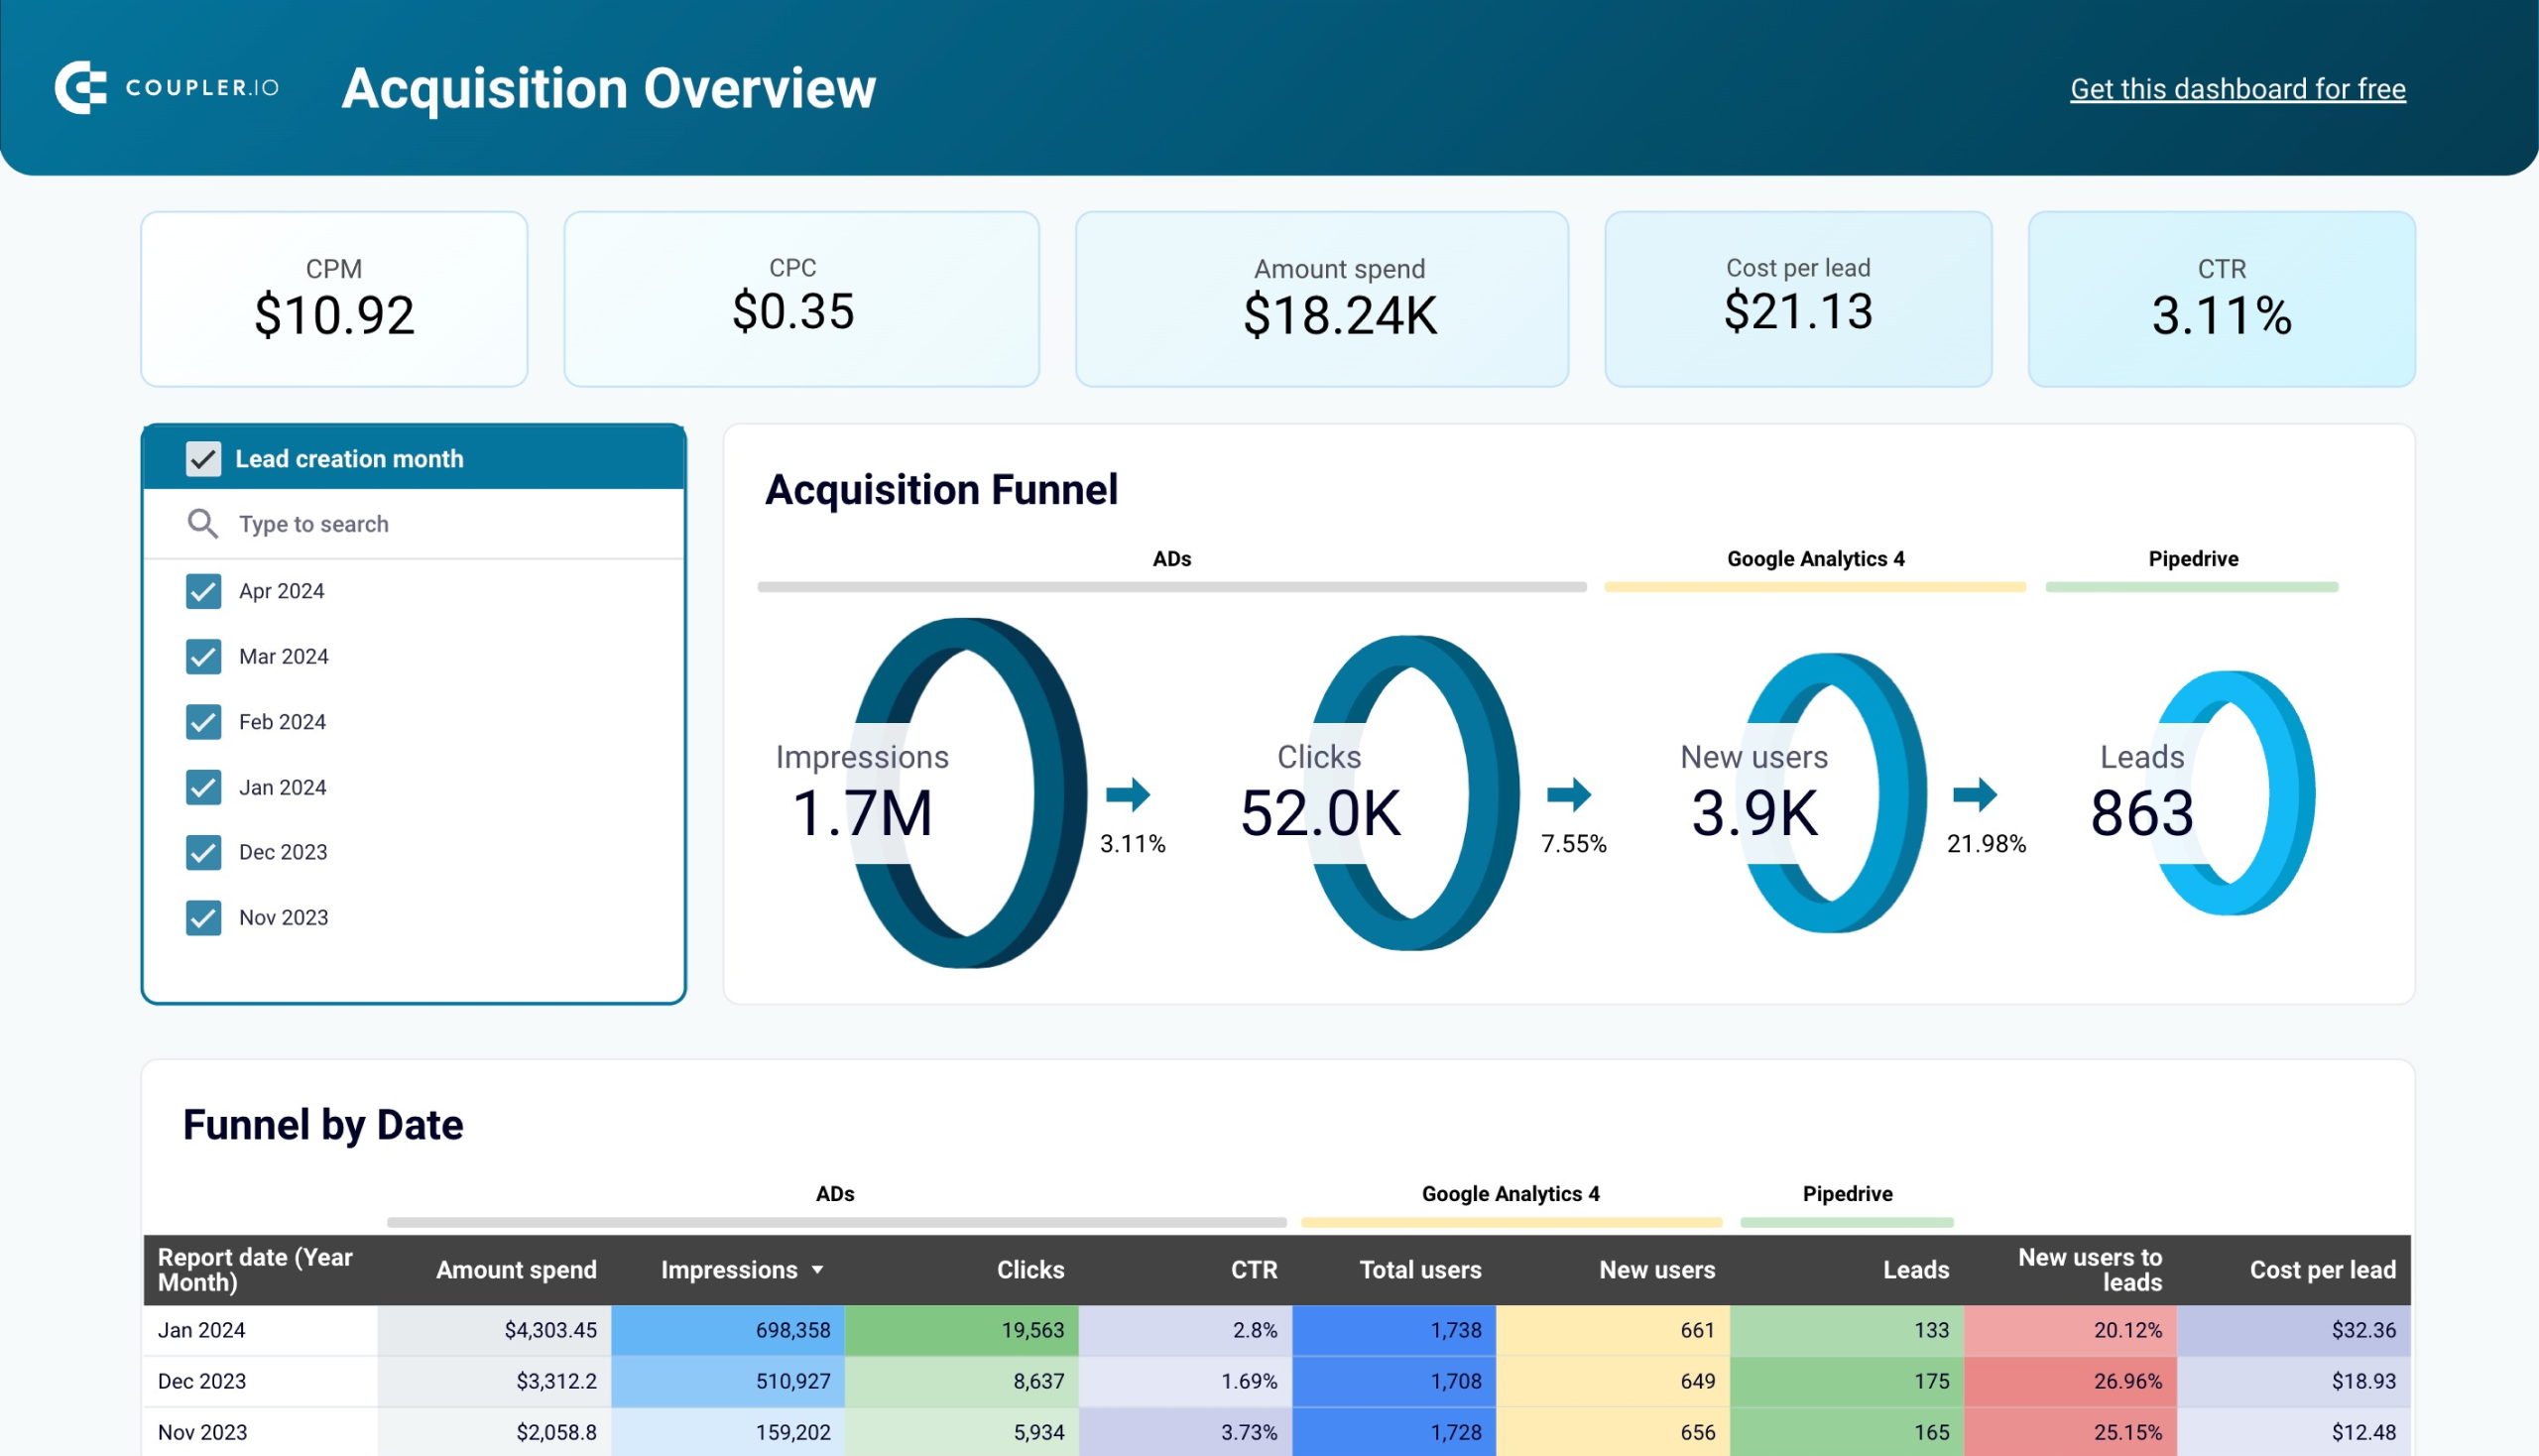
Customer acquisition dashboard for Pipedrive
Use this dashboard to illustrate the effectiveness of the Pipedrive acquisition funnel.


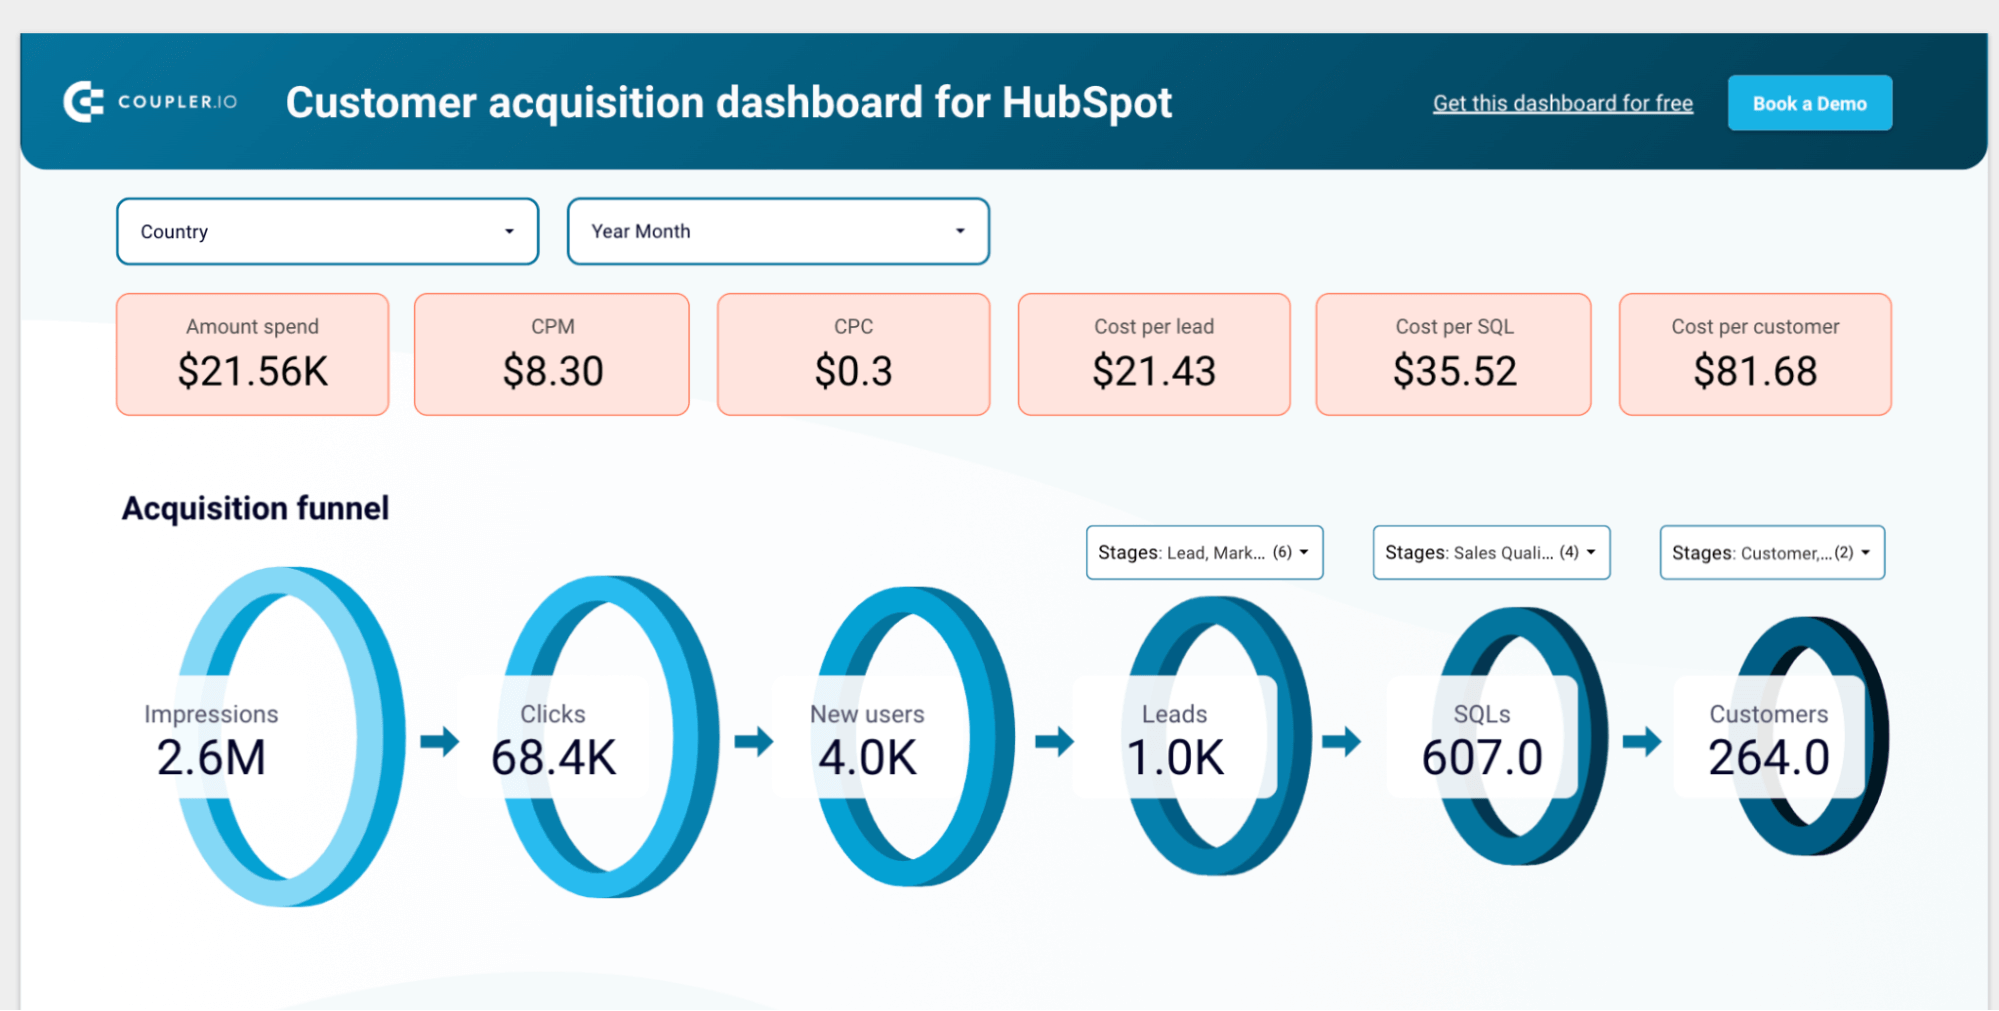
Customer acquisition dashboard for HubSpot
Visualize the acquisition funnel based on data from HubSpot, ad platforms, and GA4.

Common challenges faced when using Google Analytics 4
While Google Analytics offers powerful capabilities for marketing analytics, there are several challenges to be aware of. These range from the starting point – GA4 setup – to further usage aspects, such as interface design, data reporting, metrics, and dimensions.
Complexities of Google Analytics 4 setup
GA4’s event-based tracking model requires more manual setup than Universal Analytics. In UA, tracking was relatively simple: you would place tags on the website, and conversions were defined based on goals such as URL visits or time spent on a page.
In Google Analytics 4, however, tracking extends beyond page views and sessions. GA4 automatically tracks some fundamental interactions like page views and scrolls, but specific events, such as button clicks or adds to the cart, need to be manually set up. To track conversions – as shown earlier in the article – you must explicitly mark these interactions as key events.
While flexible, this requires a deeper understanding of event configuration to capture the interactions that matter most to business.
Issues with the new interface and reporting capabilities
GA4 introduces changes in how data is tracked, organized, and reported, which are likely to present a steep learning curve.
For example, Google Analytics 4 offers data streams to organize records from different sources (web, iOS, Android apps, etc.). Permanent filters are now applied directly to the data stream before records flow to a single property and appear in reports.
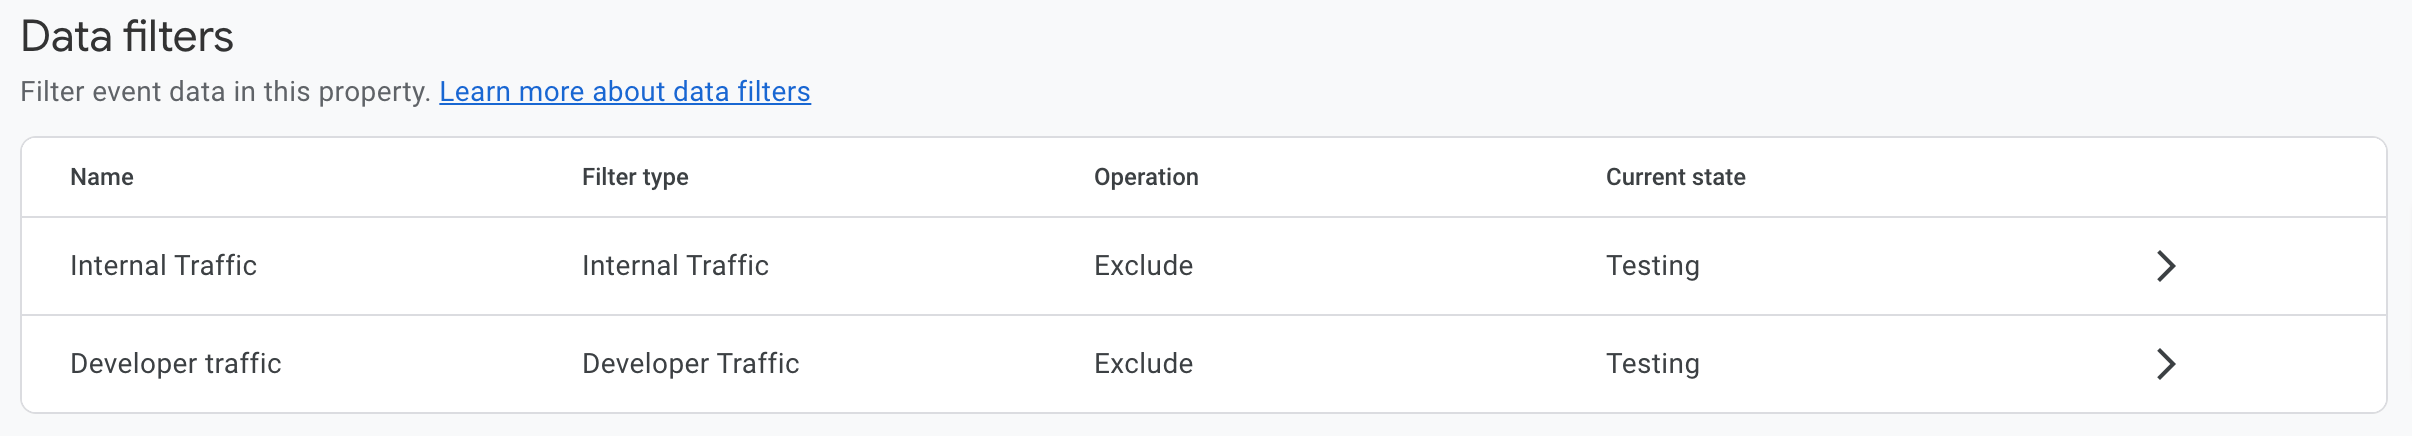
Any segmentation or filtering occurs at the reporting level, but this is temporary and only applies to the specific report or exploration session. As a result, you can no longer create different views with unique filter sets like it was possible in the previous version, Universal Analytics (UA).
Furthermore, some key features are missing in GA4 reporting. For example, regular expressions for parameter filtering and metric filters are unavailable in standard reports (available only in Explorations). Additionally, segments are not supported in standard reports, although limited comparison capabilities are provided.
Incompatibility between dimensions and metrics
Google Analytics 4 can’t combine specific dimensions and metrics under the following conditions:
- Mismatching dimensions and metrics: Some combinations of dimensions and metrics are stored separately and can’t be queried together. For instance, data from a Google Ads integration, like campaign cost, cannot be broken down by a dimension such as the event name.
- Incompatibility with visualization or technique: As Explorations offer advanced data analysis, not all combinations of dimensions and metrics are compatible with them. For example, the pathing technique only supports total users and event count metrics.
- Other compatibility limitations: Certain dimensions and metrics can’t be combined due to restrictions imposed by Analytics. For example, you may be trying to include demographics and interests dimensions along with user-generated content fields or custom dimensions that are no longer compatible.
While the best way to handle these challenges is to enhance your Google Analytics expertise, you can still simplify data tracking and reporting with Coupler.io – let’s sum up how.
Tool for Google Analytics 4 reporting: Coupler.io
Using Coupler.io, you’ll improve your GA4 data reporting in the following ways:
- Automate your reporting on clients’ marketing performance: Using the Coupler.io no-code reporting automation platform, you reduce the time you’d otherwise spend on manual data collection. This minimizes the risk of human error and prevents formatting inconsistencies across team members and clients.
With reports built in spreadsheets or BI tools using Coupler.io, you eliminate the need to download and email them to clients. What’s more, scheduled self-updates ensure they have transparent access to data on marketing progress and achievements, which contributes to trust and satisfaction with your agency.
- Analyze data from different Analytics properties in a single view: After you connect GA4 to Coupler.io, you’re free to specify multiple properties from which to extract data and create a report based on that. This makes it easier for you as an agency to track how all your clients’ projects are growing or (hopefully not) the other way around.
- Combine GA4 data with records from other sources: Coupler.io allows you to build a single custom report based on merged data from Analytics and many more applications, including:
- Ad platforms: Google, Amazon, Apple Search, Microsoft (Bing), Meta (Facebook + Instagram), LinkedIn, Pinterest, Quora, Snapchat, TikTok, and X (Twitter) Ads.
- CRMs: HubSpot, Intercom, Pipedrive, and Salesforce.
- Email marketing tools: Klaviyo and Mailchimp.
- Accounting and billing systems: QuickBooks, Xero, and Stripe.
- Get your data visualized as dashboards to share with clients: With prebuilt GA4 report templates for Google Sheets, Looker Studio, Power BI, and Tableau, it only takes a few minutes to transform data into insightful dashboards – featuring charts and other visualizations that illustrate marketing performance from different angles.
Try Coupler.io for free and let GA4 reporting drive your client’s – and, in turn, your agency’s – success!
If you require a tailored solution for client reporting or want to understand the specifics of using Coupler.io for agency needs, reach out to our data experts.
Talk to our data experts
Get started for free