Did you know that well-prepared Google Analytics reports can provide marketers with a unique advantage in creating lasting impressions with clients? Although often overlooked, it’s a powerful way to stand out and demonstrate your value and expertise.
Drawing from our extensive experience in preparing GA4 reports, we thought we’d share how to deliver marketing reports that impress and empower clients.
If you’re preparing reports for businesses, keep reading to learn how to overcome challenges and craft reports your clients will truly appreciate.
Why should marketers use Google Analytics reports?
The current version of Google Analytics (GA4) represents a major update. It meets the changing needs of today’s marketers. Beyond its global adoption, here are additional reasons why Google Analytics reports should be in your toolkit:
- Presenting Results to Clients: While GA4 is great for tracking data, sharing these insights with clients can be tricky. Standard GA4 reports are useful, but they usually don’t offer enough flexibility or clear visuals. The best way is to join GA4 data with other sources for a more complete view. Tools like Coupler.io make this easier by letting you create custom visualizations. Unlike GA4’s built-in tools, Coupler.io gives you more control and makes reports clearer for clients.
- Future-Ready Analytics: GA4 introduces features that adpat to the latest changes in analytics, such as privacy tracking and cookieless tracking, making it a future-ready tool for modern marketers.
- Versatility and Integration: Google Analytics reports are perfect for tracking and improving marketing efforts, especially when those efforts are scattered across different channels. This is with the help of multiple integrations, including:
- Google Ads
- Google Search Console (SEO)
- BigQuery for advanced data analysis
These tools help create a unified and effective marketing strategy.
- Different Business Objectives: Google Analytics reports cater to a variety of goals, whether you’re focused on e-commerce performance or lead generation. Depending on the industry category you choose when creating a GA4 property, reports can be organized specifically around these and provide industry benchmarks.
Main issues with Google Analytics reports for clients
We’ve discussed the advantages of creating Google Analytics reports directly within the platform. However, there are situations where these reports may not be the best fit, such as:
- Analytics maturity
- GA4 knowledge level
- Time constraints
We’ll break down these scenarios and show you how to handle them.
Analytics maturity
The organization’s experience level with analytics may require (or not) more tailored reports. For example, a client who only cares about basic answers, such as “How many visitors did I have this month?” won’t benefit much from a sophisticated report. Simplifying the report for these clients saves time and resources, allowing you to concentrate on higher priorities.
Standard reports or Explorations in GA4 are beneficial for clients of all types. However, some might feel overwhelmed by all the options. In such cases, starting with data from the Standard Reports is a good approach.
For clients who are more comfortable with GA4, advanced reports (e.g., Path Exploration or Funnel Analysis) become essential. We’ll cover these reports in more detail in the following sections.
GA4 knowledge level
Despite its popularity, many people don’t know how to use or understand Google Analytics data. This lack of knowledge can create challenges when working with clients, impacting both the preparation of reports and their ability to recognize the value of your work.
Additionally, there is a significant difference in how reports are created and used between Universal Analytics (UA) and GA4. In the old approach (UA), you got ready-to-use reports right away. These reports made it easy to make quick data-driven decisions without much extra work.
In contrast, the new approach (GA4) gives you more powerful customization options. However, this comes at the cost of fewer reports being available right out of the box, and you often need additional setup to get the same insights.
This shift can leave users feeling like more work is required to get useful results. Thankfully, Coupler.io brings the best of both worlds. This reporting automation platform allows you to create custom reports based on GA4 data and offers pre-built GA4 report templates. It doesn’t require any sophisticated knowledge of Google Analytics native reporting. All you have to do is select the metrics and dimensions from dropdown menus to include in your report.
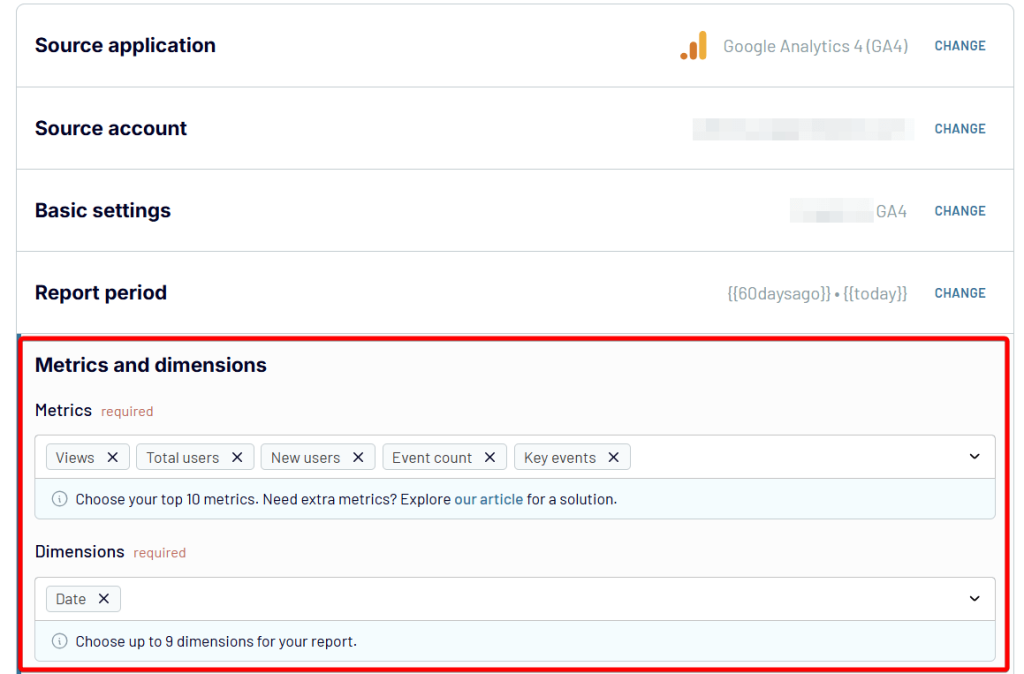
The GA4 report templates make it easier to get clear and useful information, combining the simplicity of the old way with the power of the new one.
With Coupler.io, you don’t need to teach an entire GA4 course to create insightful reports for clients. Focus on the basics they will encounter in the reports and show them how to use that information. This makes it easier for them to understand the value without feeling overwhelmed.
Time constraints
If you’ve ever come across a report that amazed you or truly provided value, remember that it didn’t happen by chance. Well-crafted reports are the product of:
- Extensive collaboration, both internally and externally, to identify the right data.
- Careful planning for how this data should be collected, integrated, and connected.
- Consideration of the technology involved and the costs and resources required.
Anyone can create a report, but producing one that truly stands out and delivers next-level insights requires effort and expertise.
For marketing agencies or professionals managing multiple clients, creating tailored reports from scratch for each one is not only time-consuming but also challenging to sustain. Accelerating this process is crucial for efficiency and scalability.
What is the value of custom GA4 reporting?
Google Analytics 4 (GA4) is a reliable tool to monitor website performance, yet its built-in reporting options can sometimes feel limiting or overly complex.
As your data needs grow, you might face situations where GA4’s standard tools no longer meet your requirements:
- Data Volume: Large datasets may require moving data to a warehouse for efficient handling.
- Client Preferences: Some clients might prefer reports presented in tools like Tableau or Power BI instead of Google’s ecosystem.
- Data Integration: Combining GA4 data with other sources can be challenging within GA4 itself.
These challenges highlight the importance of flexible solutions that enable you to work with data across different platforms and formats.
How you can automate GA4 reporting for clients with Coupler.io
Coupler.io helps address these issues with a straightforward platform for automating data integration and reporting. You can create custom GA4 reports within the platform and load them to Google Sheets, Looker Studio, Power BI, or Tableau. This makes it easier to analyze and visualize data according to your needs. To extract data from your GA4 account and turn it into an insightful report, you only need to take three steps:
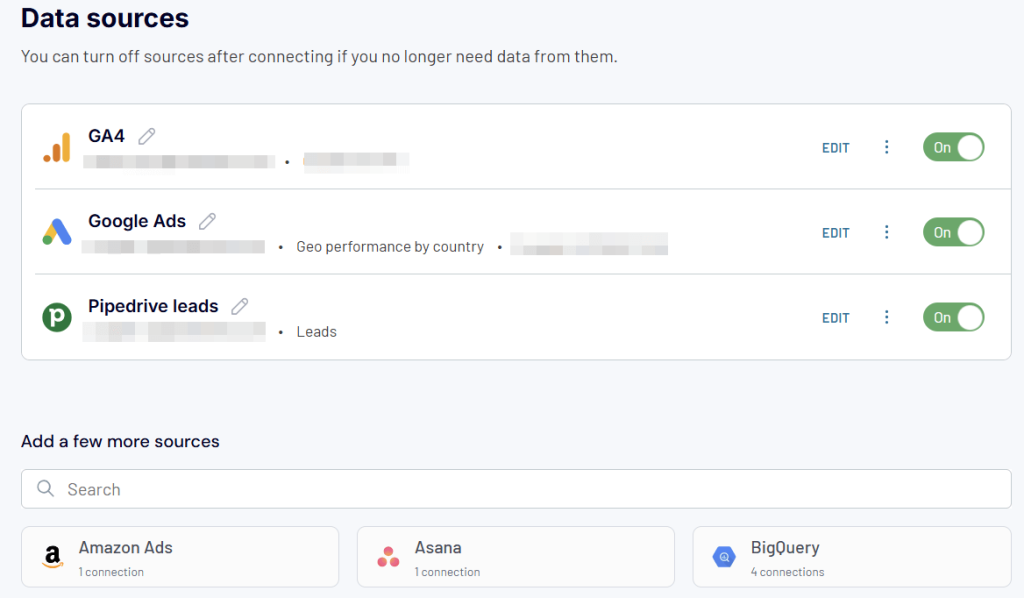
1. Collect data from GA4 and connect other sources you want to include in the report.
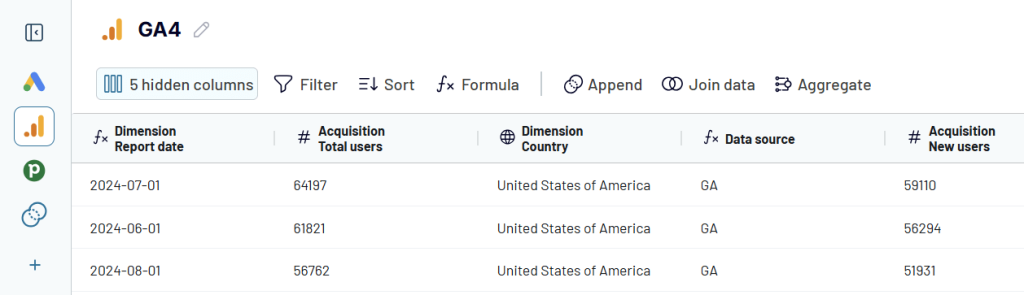
2. Transform and prepare data for analysis. You can manage columns, apply filters, sort records, create new custom formulas, and join data if you’ve connected multiple sources.
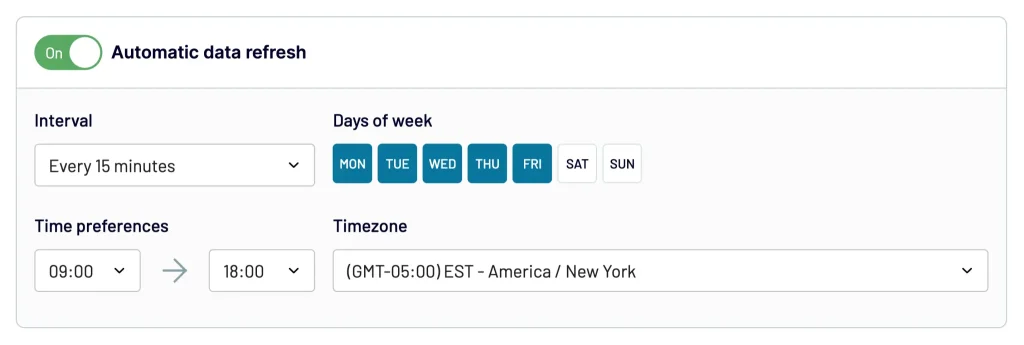
3. Load reports to the desired destination and enable the automatic data refresh. This feature ensures your reports are always up-to-date according to the configured schedule.
You can try it out straight away for free. Just select the desired destination app for your GA4 report in the form below and click Proceed.
Coupler.io also provides a selection of white-label report templates. These pre-designed options save time by offering a strong starting point for creating customized reports. You can adapt them to match your brand’s visual identity and cater to specific data requirements. We’ll introduce the best examples later in the text.
How to plan reports for clients
One pro tip is to talk with your clients before starting to build a report. The goal is to gather as much information as possible.
From experience, these conversations might not always yield any significant insights. But when they do, they can provide crucial details that save you from endless back-and-forth revisions later.
Here are some key questions to ask your clients:
- Do you already use reports? If so, they might only need minor updates instead of a brand-new one.
- What are your most important metrics? Knowing their top priorities will guide your focus.
- What terminology do you prefer? For example, some clients might say “conversions” instead of key events, or “traffic” instead of Total users.
Understanding these preferences gives you a head start and ensures the final report meets their expectations.
Pro Tip: Showing examples of reports can be a winning strategy to spark ideas. For inspiration, tools like Coupler.io offer a wide library of attractive reports and dashboards tailored for different marketing channels and platforms. Feel free to explore Coupler’s dashboards examples and reporting templates.
Types of Google Analytics 4 reports
Google Analytics has many reports that can be divided into two groups:
- Standard Reports
- Explorations
If you want to learn how these work, the next sections will quickly explain them.
1. Standard reports
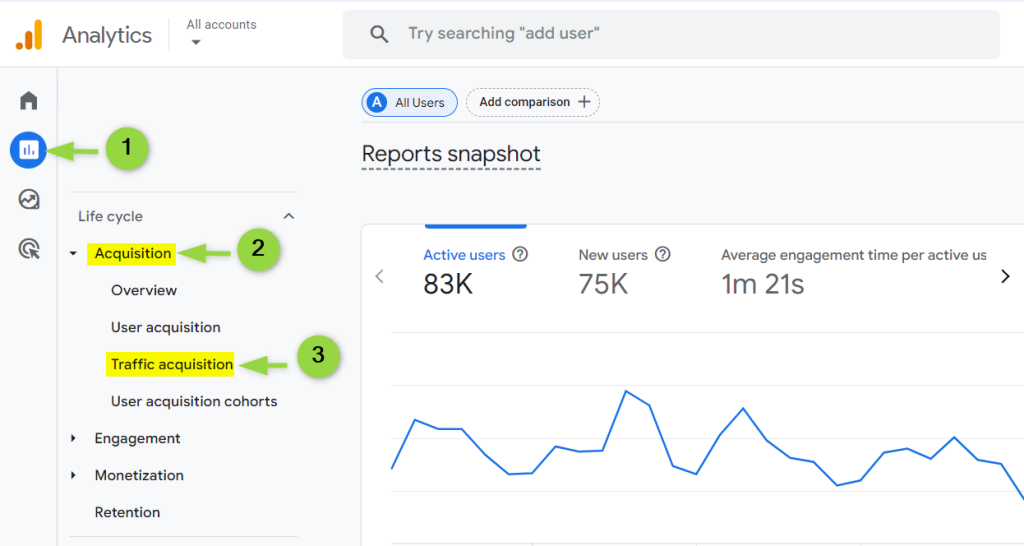
To access a report:
- Hover over the left navigation panel and click Reports.
- Expand a Topic
- Select a report.
In our example, we expanded the Acquisition topic to access the Traffic Acquisition report.
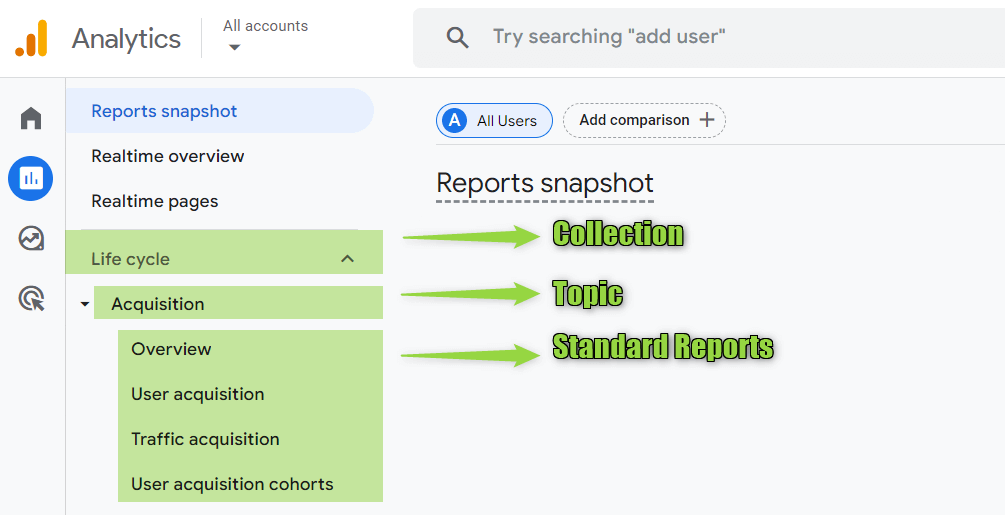
To get started, it’s important to understand the structure of GA4 reports. They follow a hierarchy:
- Collections: The main themes.
- Topics: The categories within those themes.
- Reports: The detailed data views.
Reports under Topics make up what is known as Standard Reports.
Let’s take a closer look at each level.
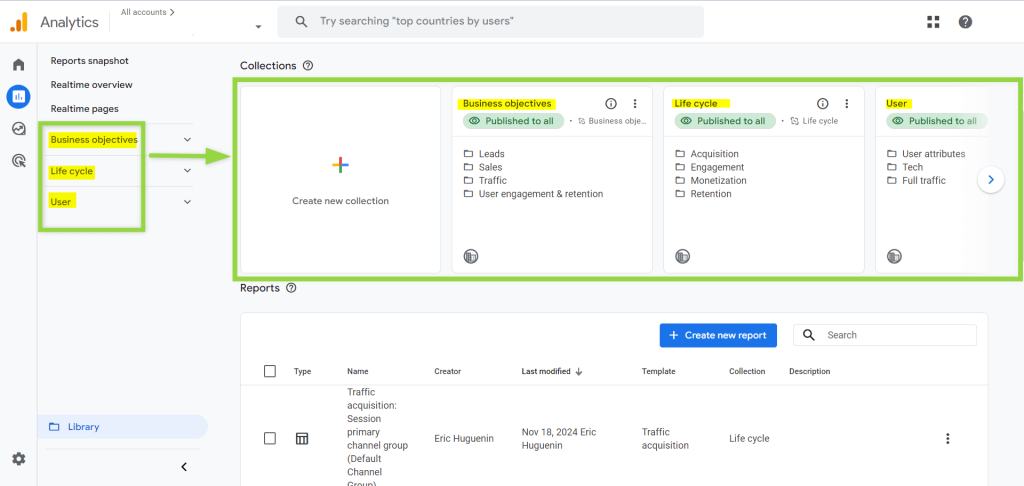
1. Collections
Collections are exactly what they sound like. They are groups of reports organized based on the information you provided when setting up GA4 for your website.
For example, here are the main Collections you’ll see in GA4:
| Collection | Description |
| To understand stages in the customer journey from Acquisition to Retention | It provides a tailored set of reports based on information you had about your business when you first set up Google Analytics. |
| Business objectives | Provides a tailored set of reports based on information you have about your business when you first set up Google Analytics. |
| Games reporting | Game-related information to help you measure customer behavior across the user funnel and develop metrics about your mobile gaming apps. |
| Life cycle | It allows you to understand stages in the customer journey from Acquisition to Retention. |
| User | It allows you to understand the people who use your websites and apps, such as their ages, interests, devices, and app versions. |
2. Topics
Each Collection contains Topics, which act as the categories of a theme (Collection). Every Topic has one Overview report and several Detailed reports.
For example, the Acquisition Topic includes:
- Overview
- User Acquisition
- Traffic Acquisition
- User Acquisition Cohort
Topics structure data and help you navigate reports.
3. Reports
Reports are the standard views in GA4 that allow you to analyze your data. They are typically what you imagine when thinking of “reports,” with charts and tables that display key metrics.
GA4 Standard Reports include two types:
- Overview Reports: These give a high-level summary of a Topic using summary cards to highlight key dimensions and metrics.
- Detailed Reports: These dive deeper, usually with two charts at the top and a table at the bottom where you can filter by dimensions and metrics.
2. Explorations
So far, we have discussed standard reports. These are great to view your data at a glance and keep track of trends. However, when you need deeper insights or want to address more complex questions, you’ll want to use an Exploration.
Explorations provide access to advanced analysis tools that go beyond Standard Reports. They include additional dimensions, metrics, and methods that help you understand user behavior more thoroughly.
With Explorations, you can go from tracking metrics to uncovering why and how users interact with your site or app.
Techniques in GA4 Explorations
Explorations offer several techniques to analyze data. Each one is designed for a specific type of question or insight:
- Free-form exploration: Customize your analysis however you like.
- Cohort exploration: Study groups of users over time.
- Funnel exploration: Identify where users drop off in a process.
- Segment overlap: See how user segments overlap or differ.
- User exploration: Focus on individual user journeys.
- Path exploration: Visualize the steps users take.
- User lifetime: Examine long-term user behavior and value.
These methods enable a deeper analysis of your data and uncover patterns or opportunities that Standard Reports can’t show. Although termed advanced, Explorations are practical tools that everyone can benefit from. You can:
- Use unique dimensions and metrics unavailable in Standard Reports
- Minimize data sampling, making results more accurate.
- Analyze up to 10 million events quickly and efficiently.
If you’re handling large datasets or need more accurate results, Explorations are an essential tool.
How to access Explorations
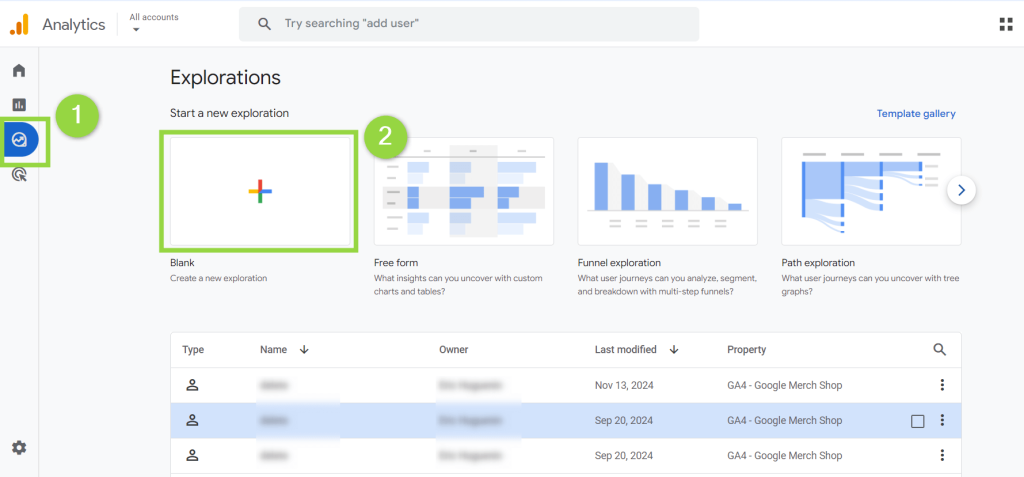
Getting started is simple:
- Click Explore in the left-hand menu.
- Click the Blank card with the plus sign to start from scratch or pick a template from the gallery.
Adding dimensions and metrics
To visualize your data, you’ll need to add dimensions and metrics:
- In the Variables pane, click the + sign next to Dimensions or Metrics.
- Search for the one you want and select it.
- Click Confirm.
- To use the data: Double-click the dimension or metric, or Drag and drop dimensions into Rows and metrics into Values.
Once your data is added, you’ll see it appear in your canvas, ready for analysis.
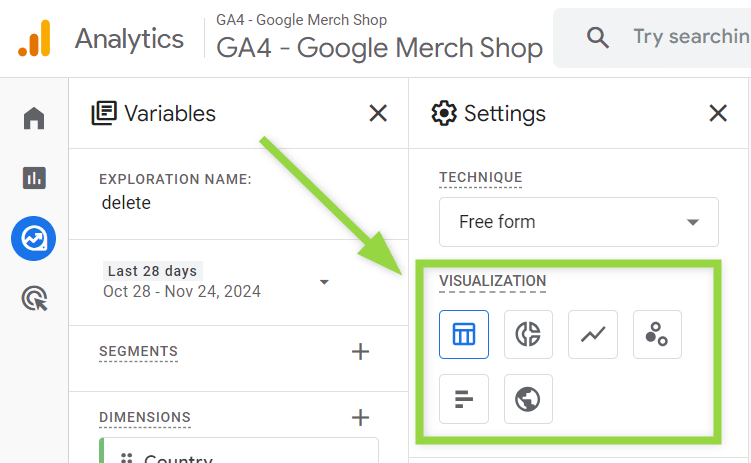
Customizing visualizations
Explorations let you tailor how your data is displayed. You can:
- Switch between techniques, like Free-form or Funnel exploration.
- Adjust charts in the Visualization area to match your analysis needs.
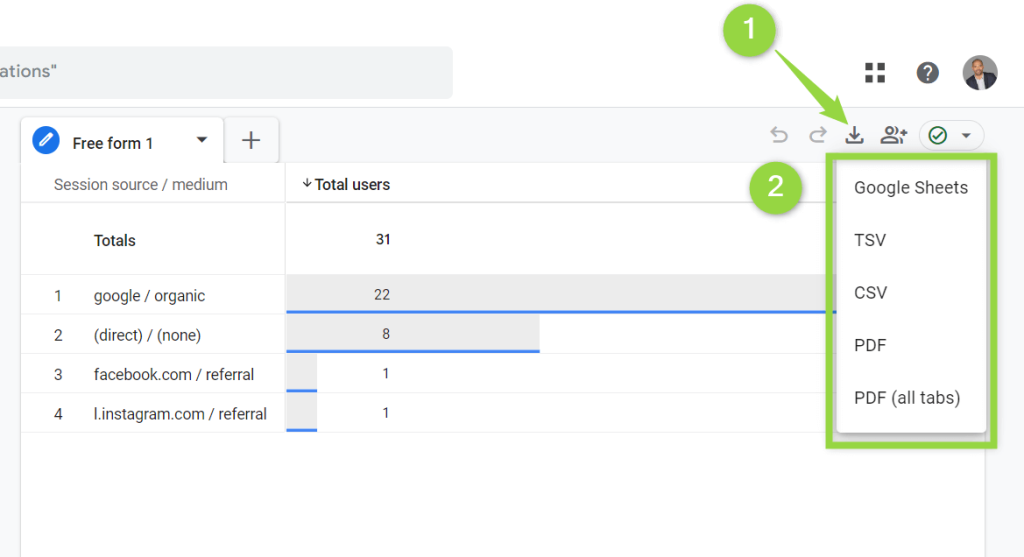
Exporting your findings
You can share your findings in multiple formats:
- Click the Export arrow in the top-right corner.
- Choose your format:
- Google Sheets
- TSV
- CSV
- PDF (all tabs)
Customize your Google Analytics reports
You can customize nearly every aspect of Google Analytics reports, including their hierarchical structure. If the navigation panel does not fit your business model, you can adjust it by changing collections in the Report Library.
Customizing the report library
You can find the Report Library at the bottom of the navigation panel.
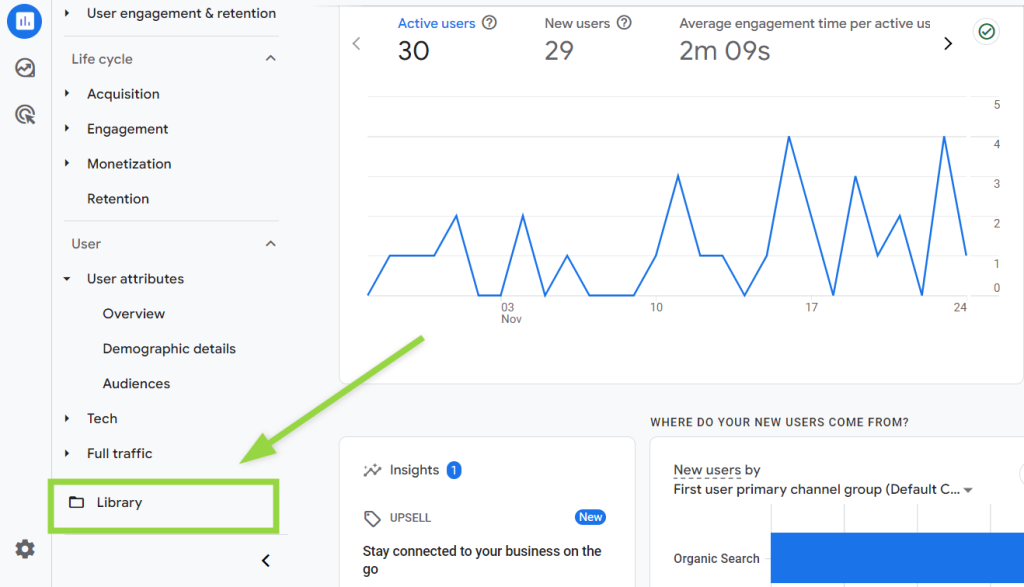
Make sure your Google account has the right permissions to view and edit it.
From the Library, you can:
- Create new collections.
- Modify existing collections.
- Reinstate previously removed collections.
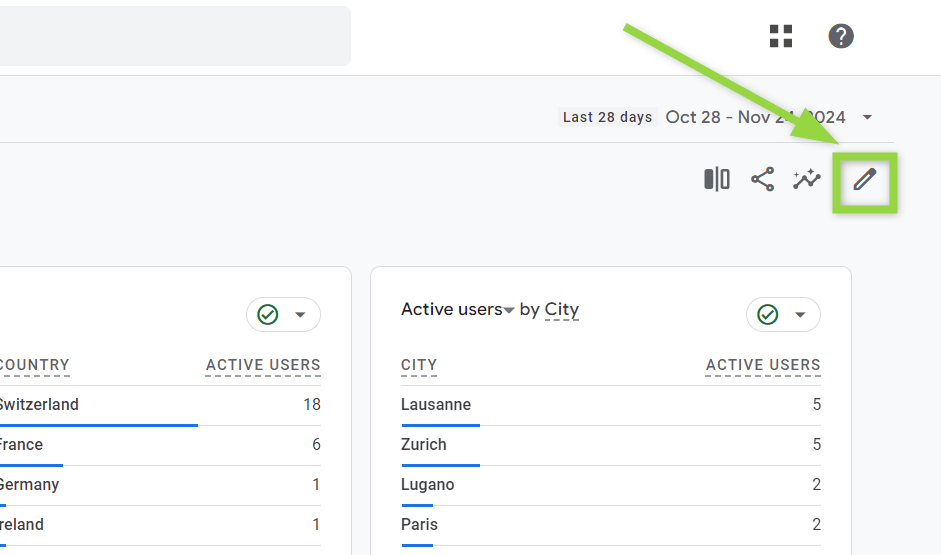
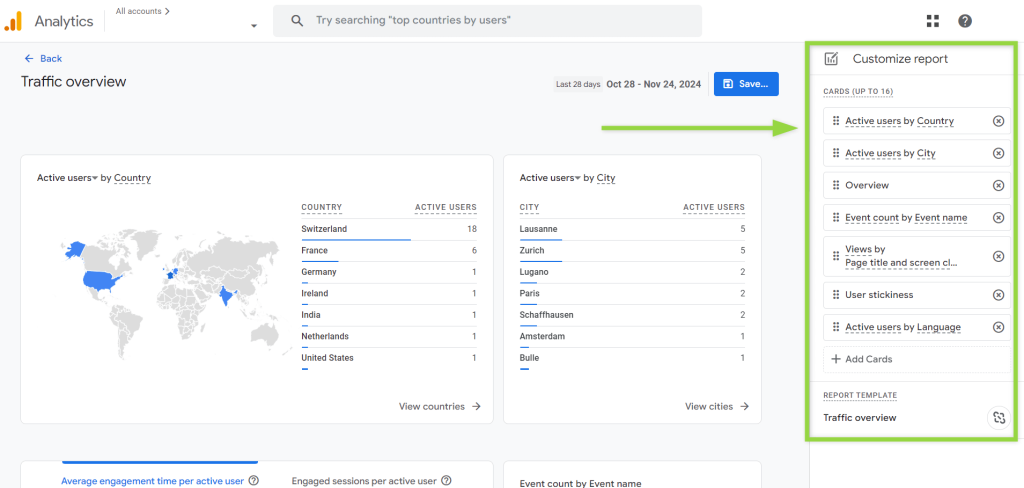
Customizing standard reports
To customize individual reports, such as Overview or Detailed reports:
- Click the pencil icon in the top-right corner of the report.
- This will open the Customize Report features.
From there, you can:
- Edit report elements directly.
- Adjust metrics, dimensions, or visualizations to fit your needs.
Limitations of Google Analytics reports
GA4 dashboards have their limits. You can’t add guiding elements like text, annotations, comments, or colors. These features help clients understand KPIs and make faster, informed decisions based on data.
Another factor to consider is design. While reports should stay simple to focus on value, design becomes crucial in specific cases.
For example:
- When you sell dashboards as a product
- When reports are used in large companies
- When reports are shared publicly
In these situations, it is important to include elements like logos and brand colors to maintain a consistent brand identity. This is something GA4 does not allow.
Google Analytics report templates by Coupler.io
Creating effective reports or dashboards for clients requires several steps, especially when connecting Google Analytics 4 (GA4) to other tools. Different platforms often require unique designs and integrations, which can add complexity to the process.
To simplify this, we’ve developed a suite of customizable dashboard templates that cater to various analytical needs. Here are some examples:
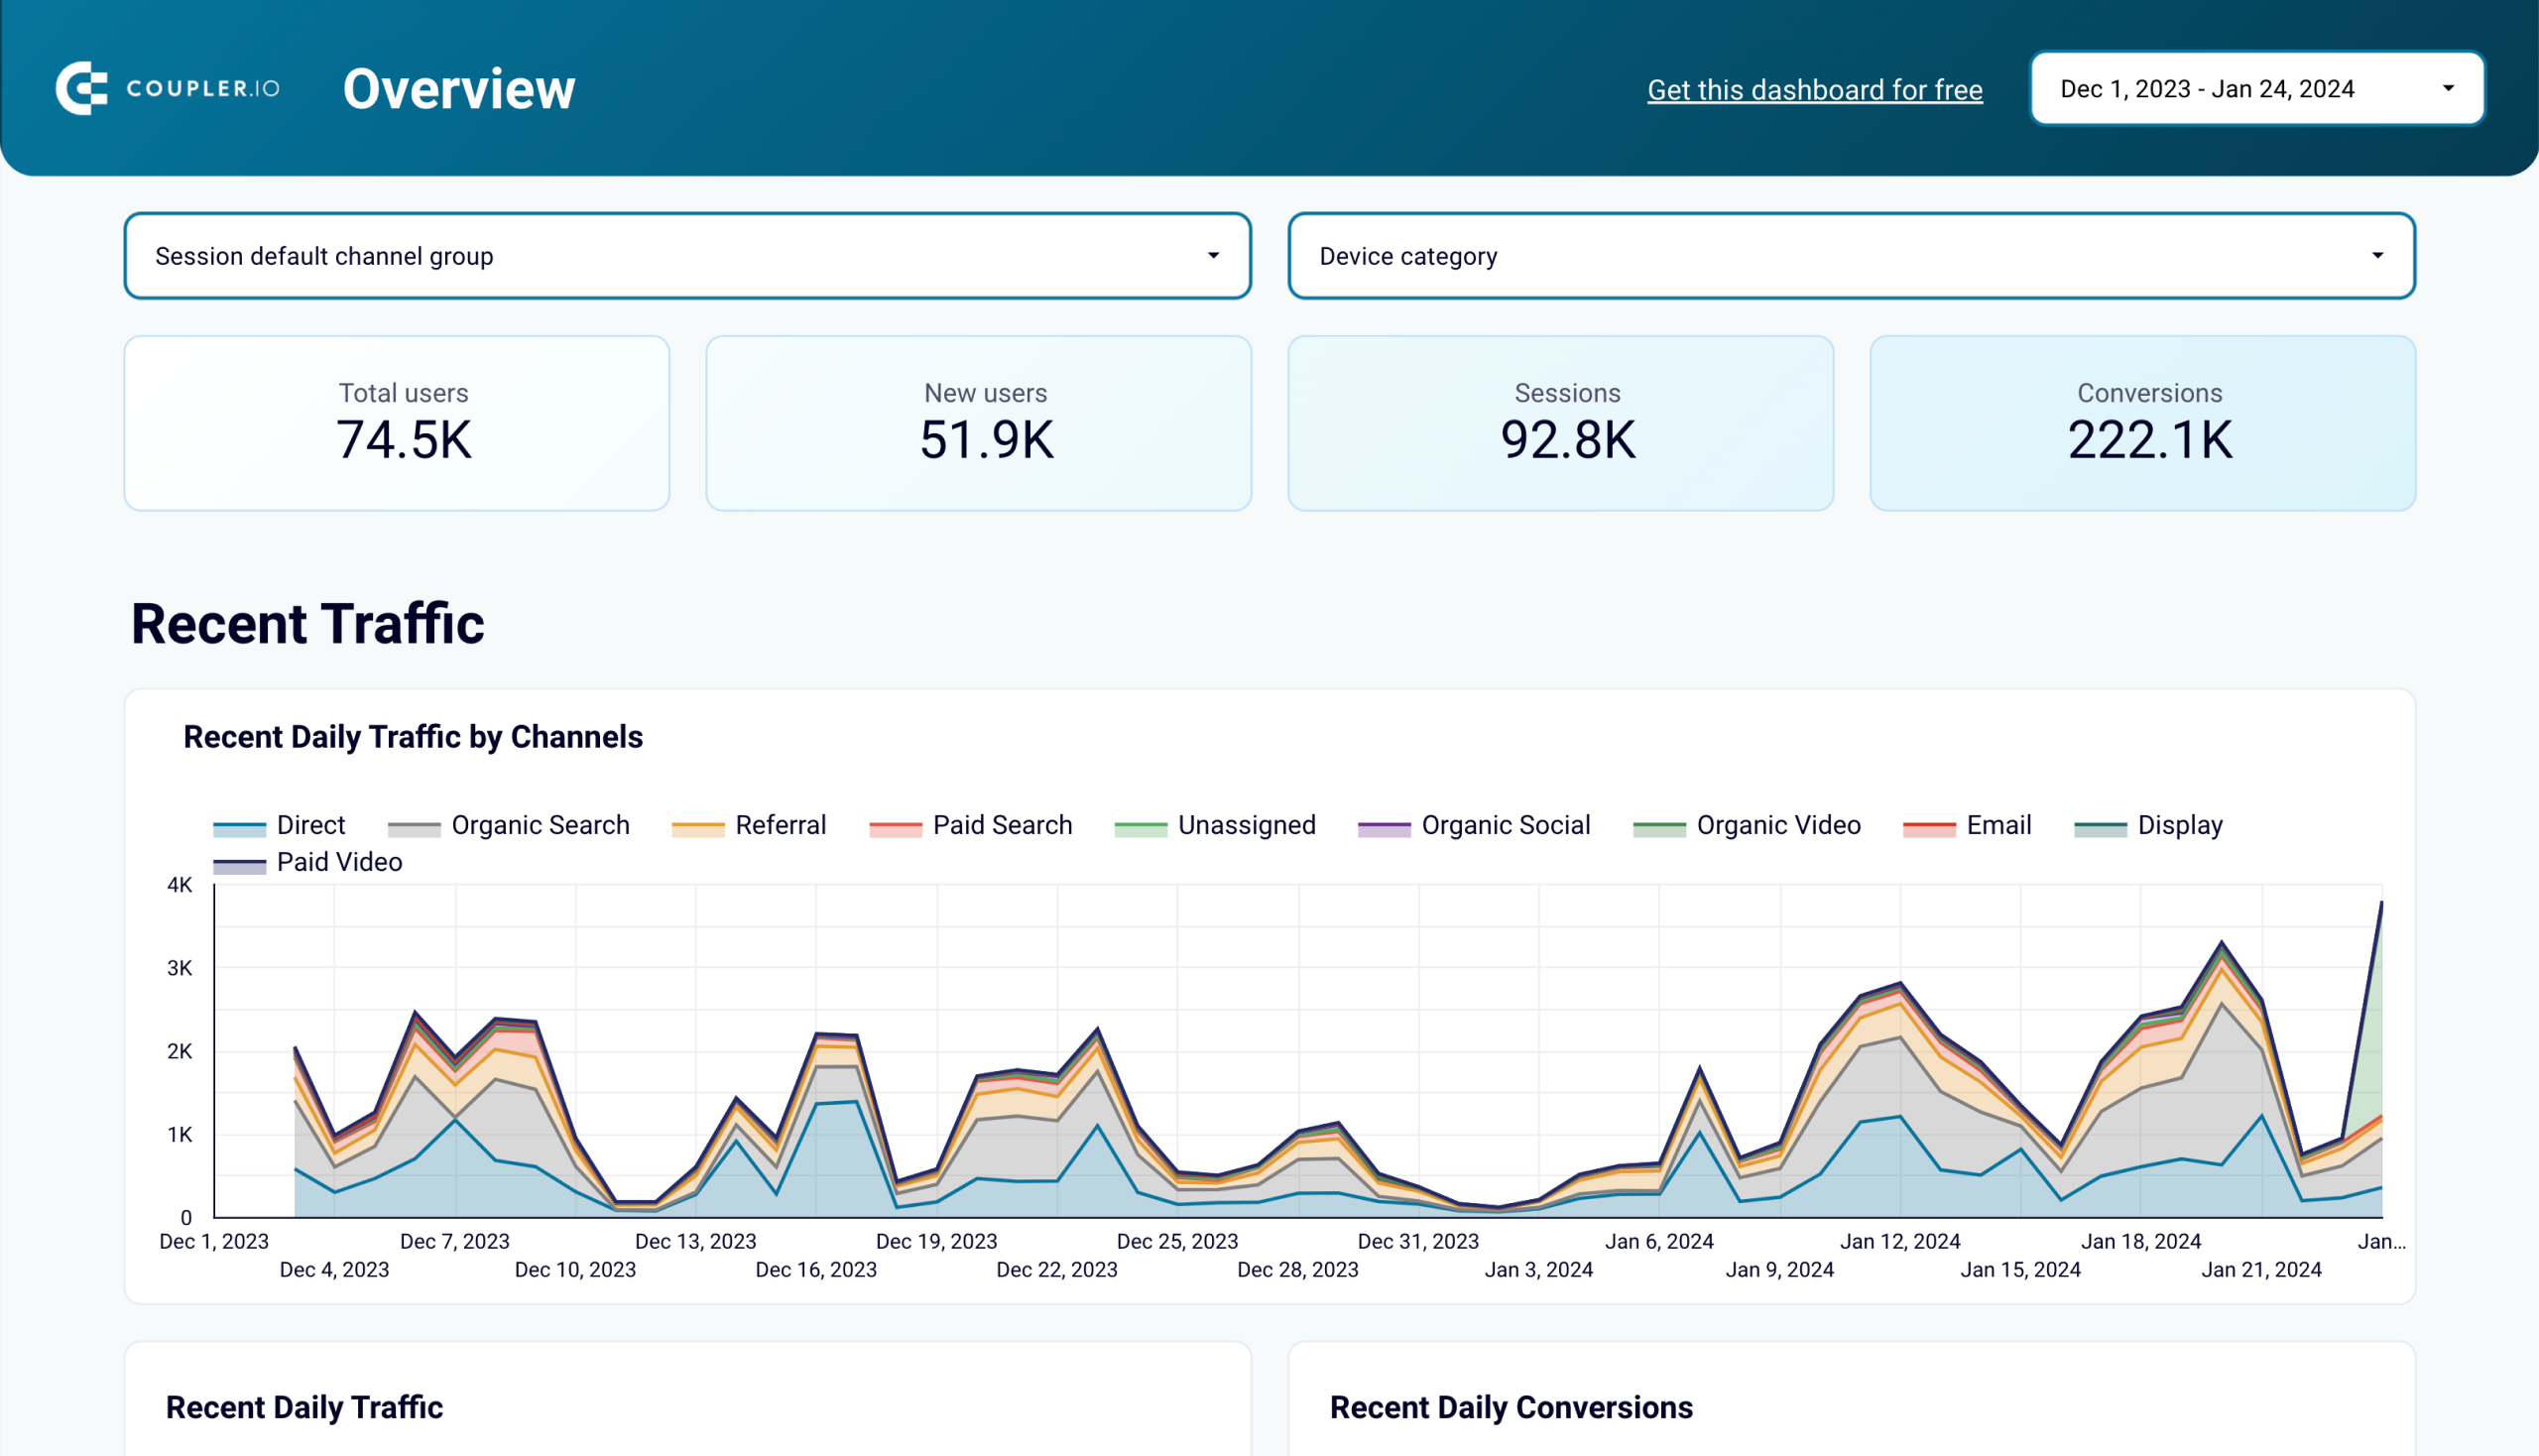
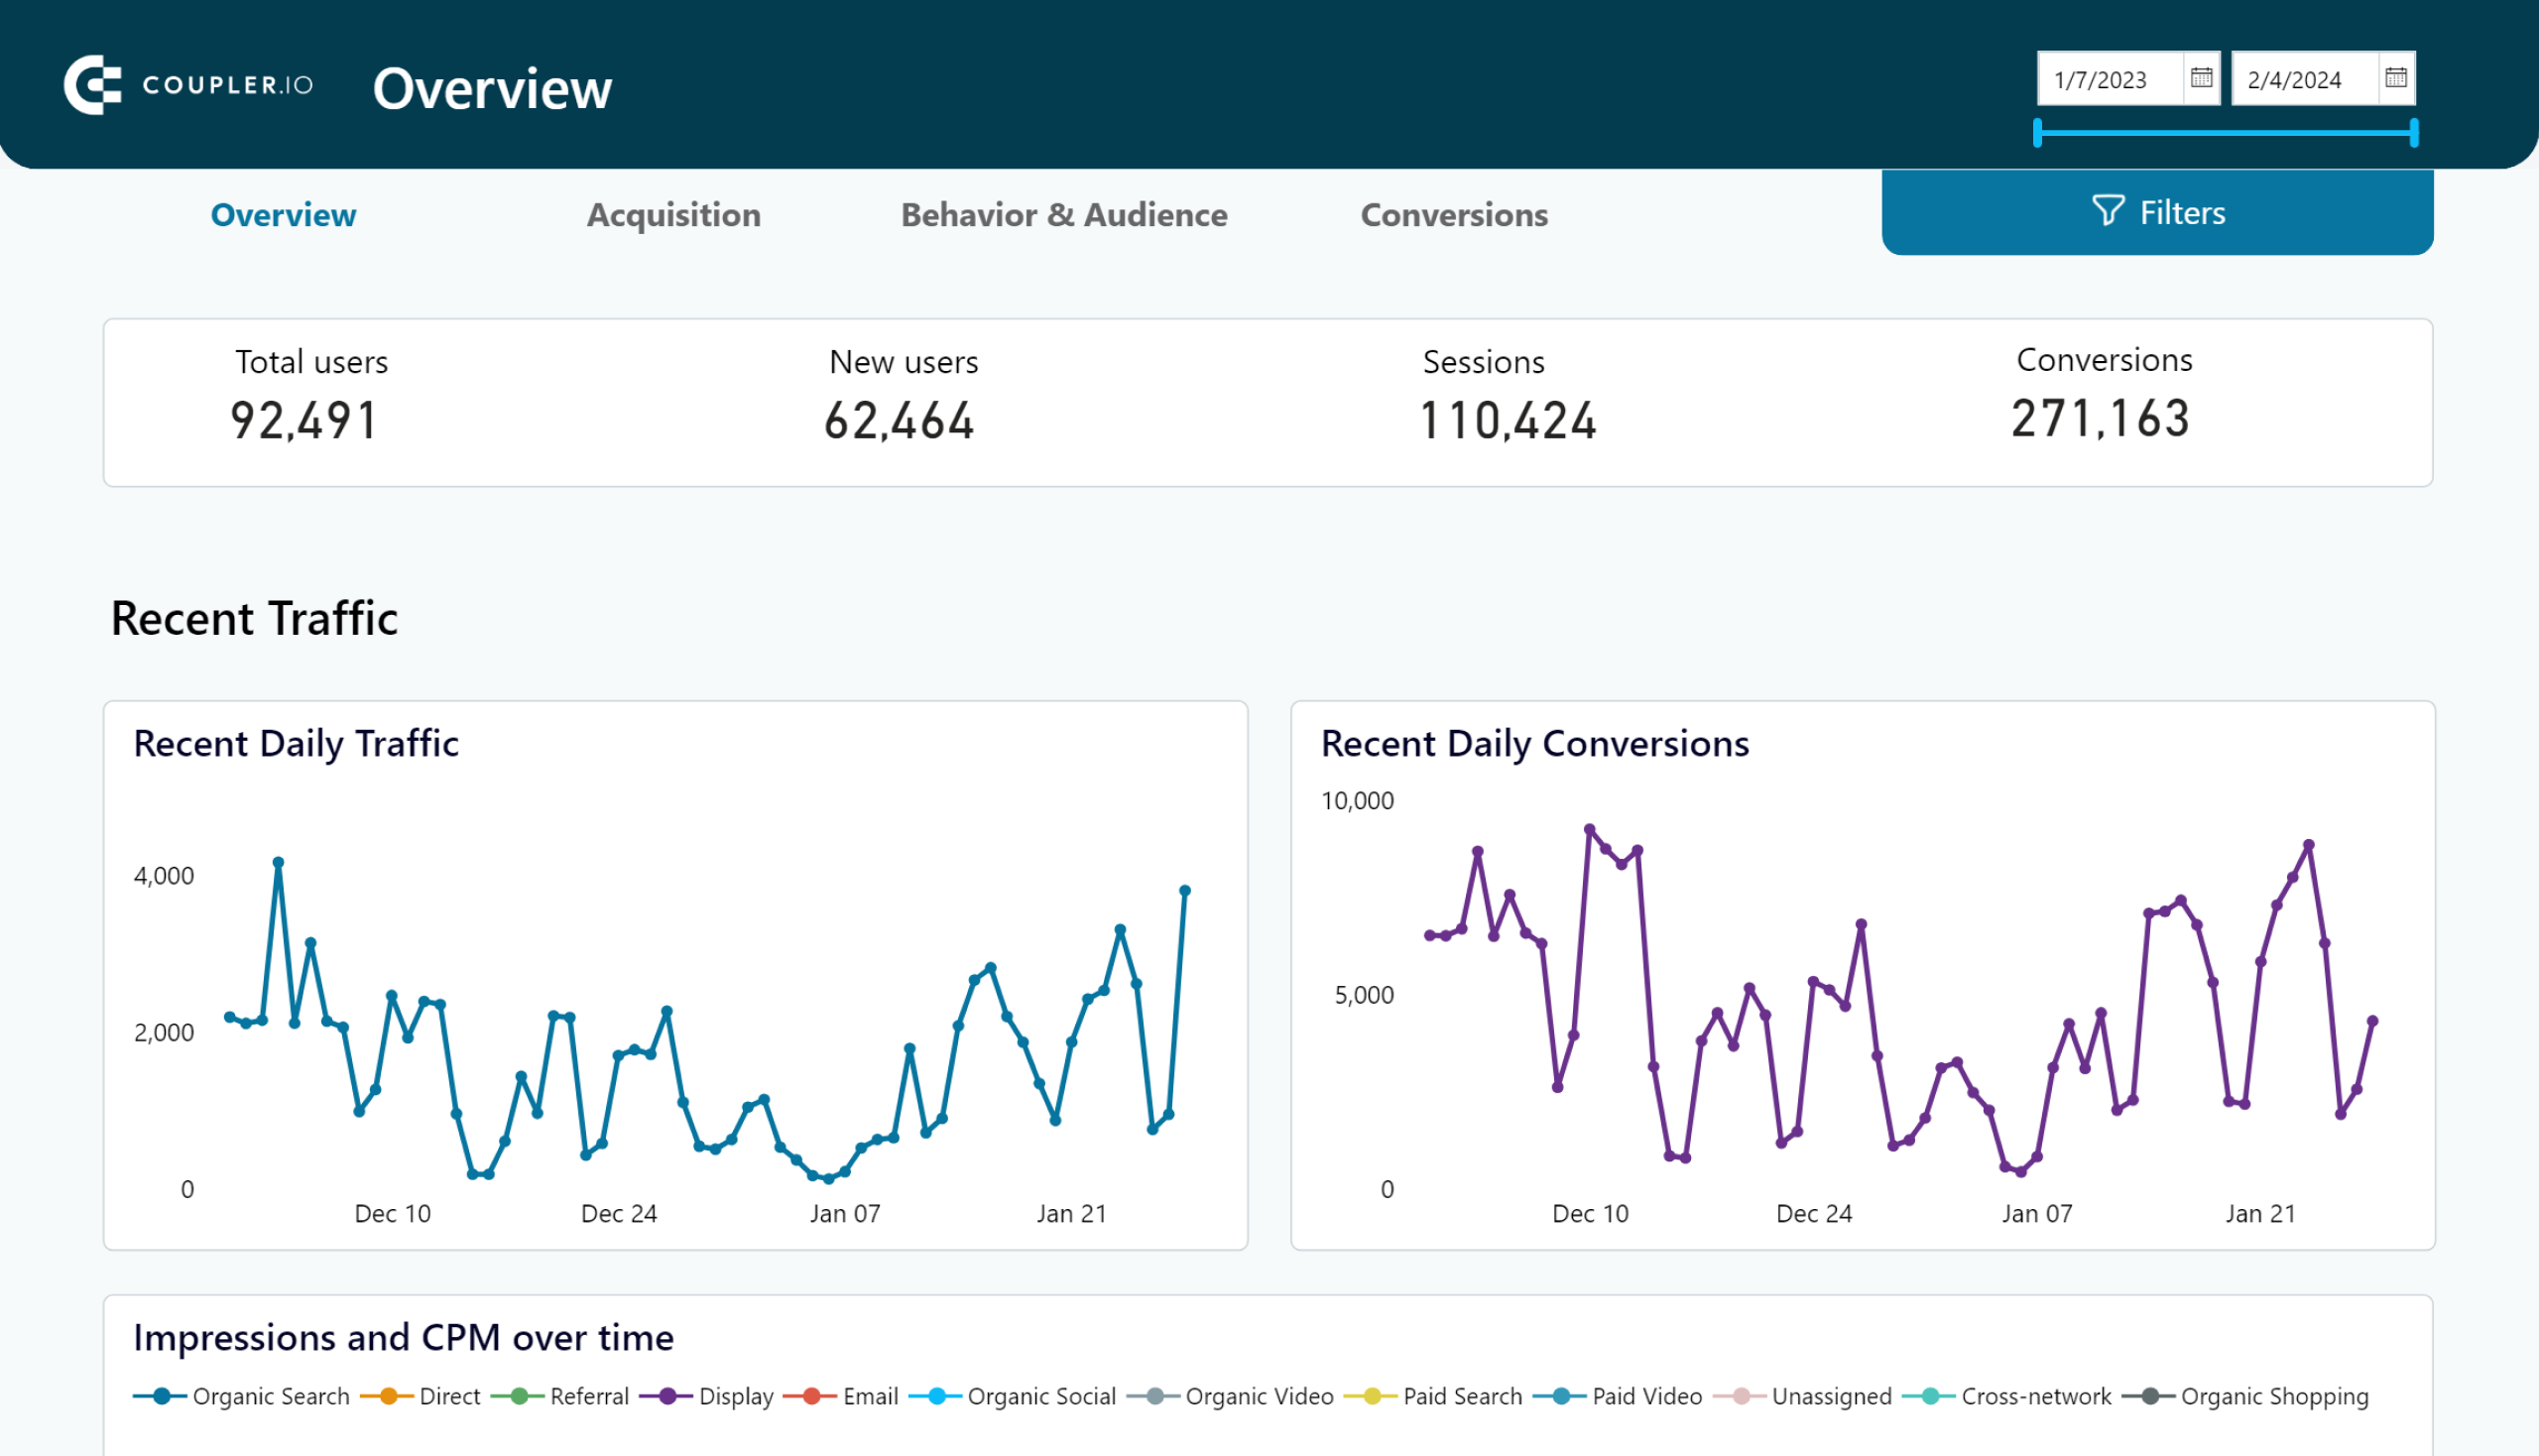
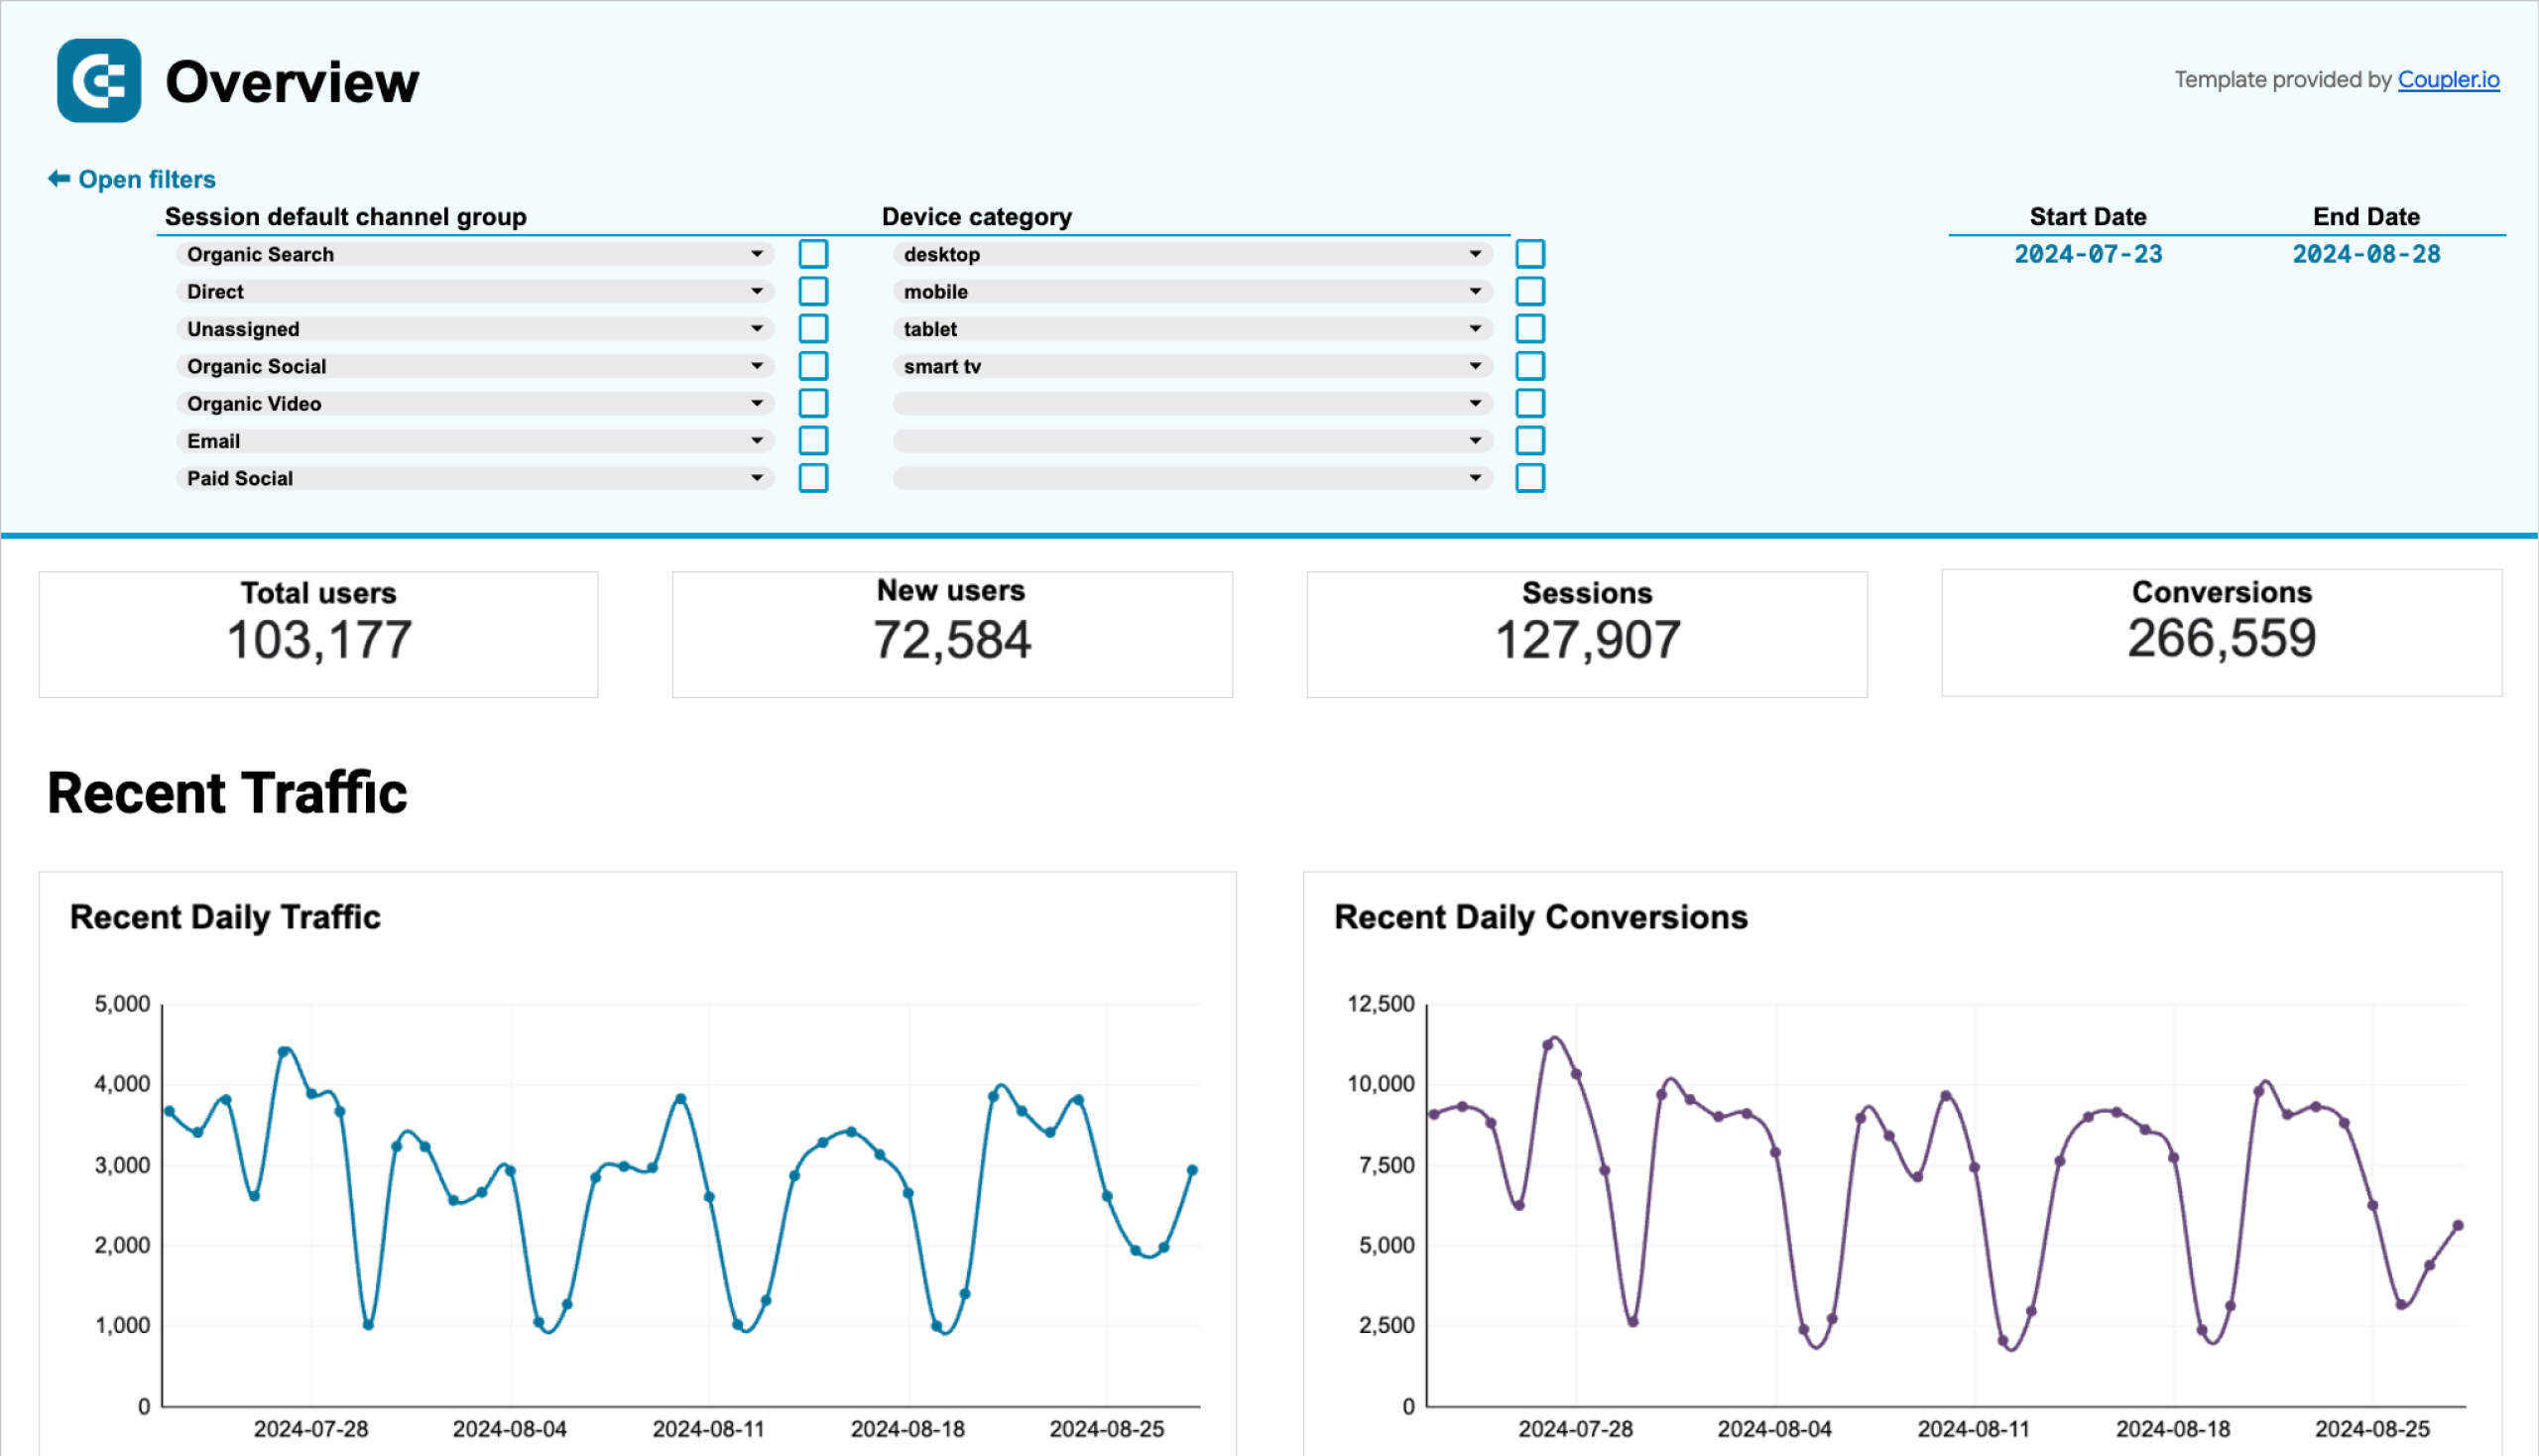
Web analytics dashboard template
This web analytics dashboard template gives you a detailed overview of your website traffic performance. This is everything from where (and how) new users are coming from to their conversion.
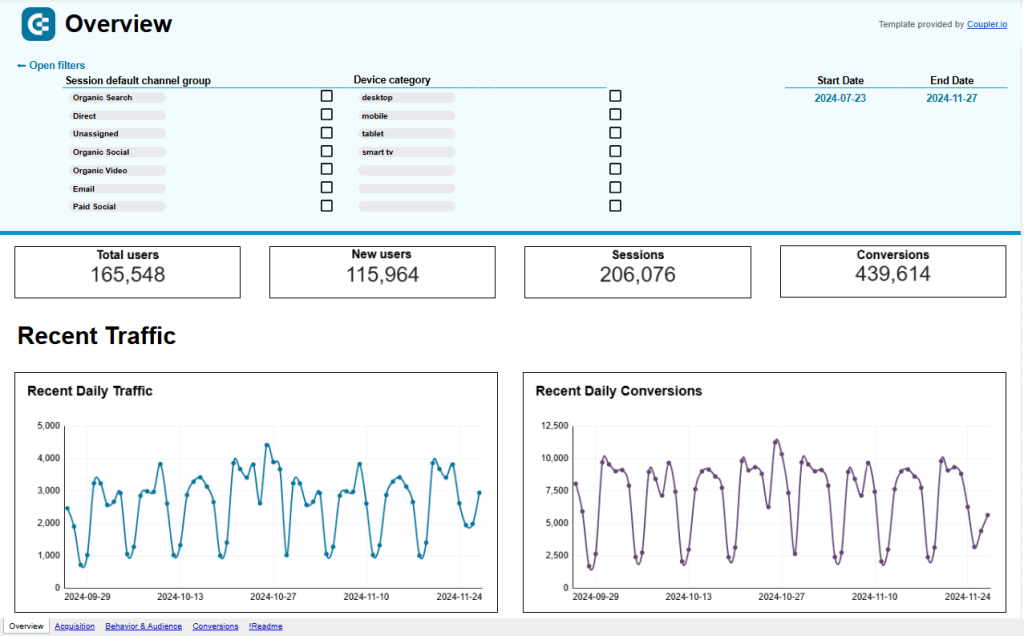
This template connects to your GA4 property through a dedicated connector by Coupler, which is available in Power BI, Tableau, Looker Studio, and Google Sheets.
Web analytics dashboard in Looker Studio
Use the insights based on the data from GA4 to monitor your website traffic and discover which pages resonate most with your audience.


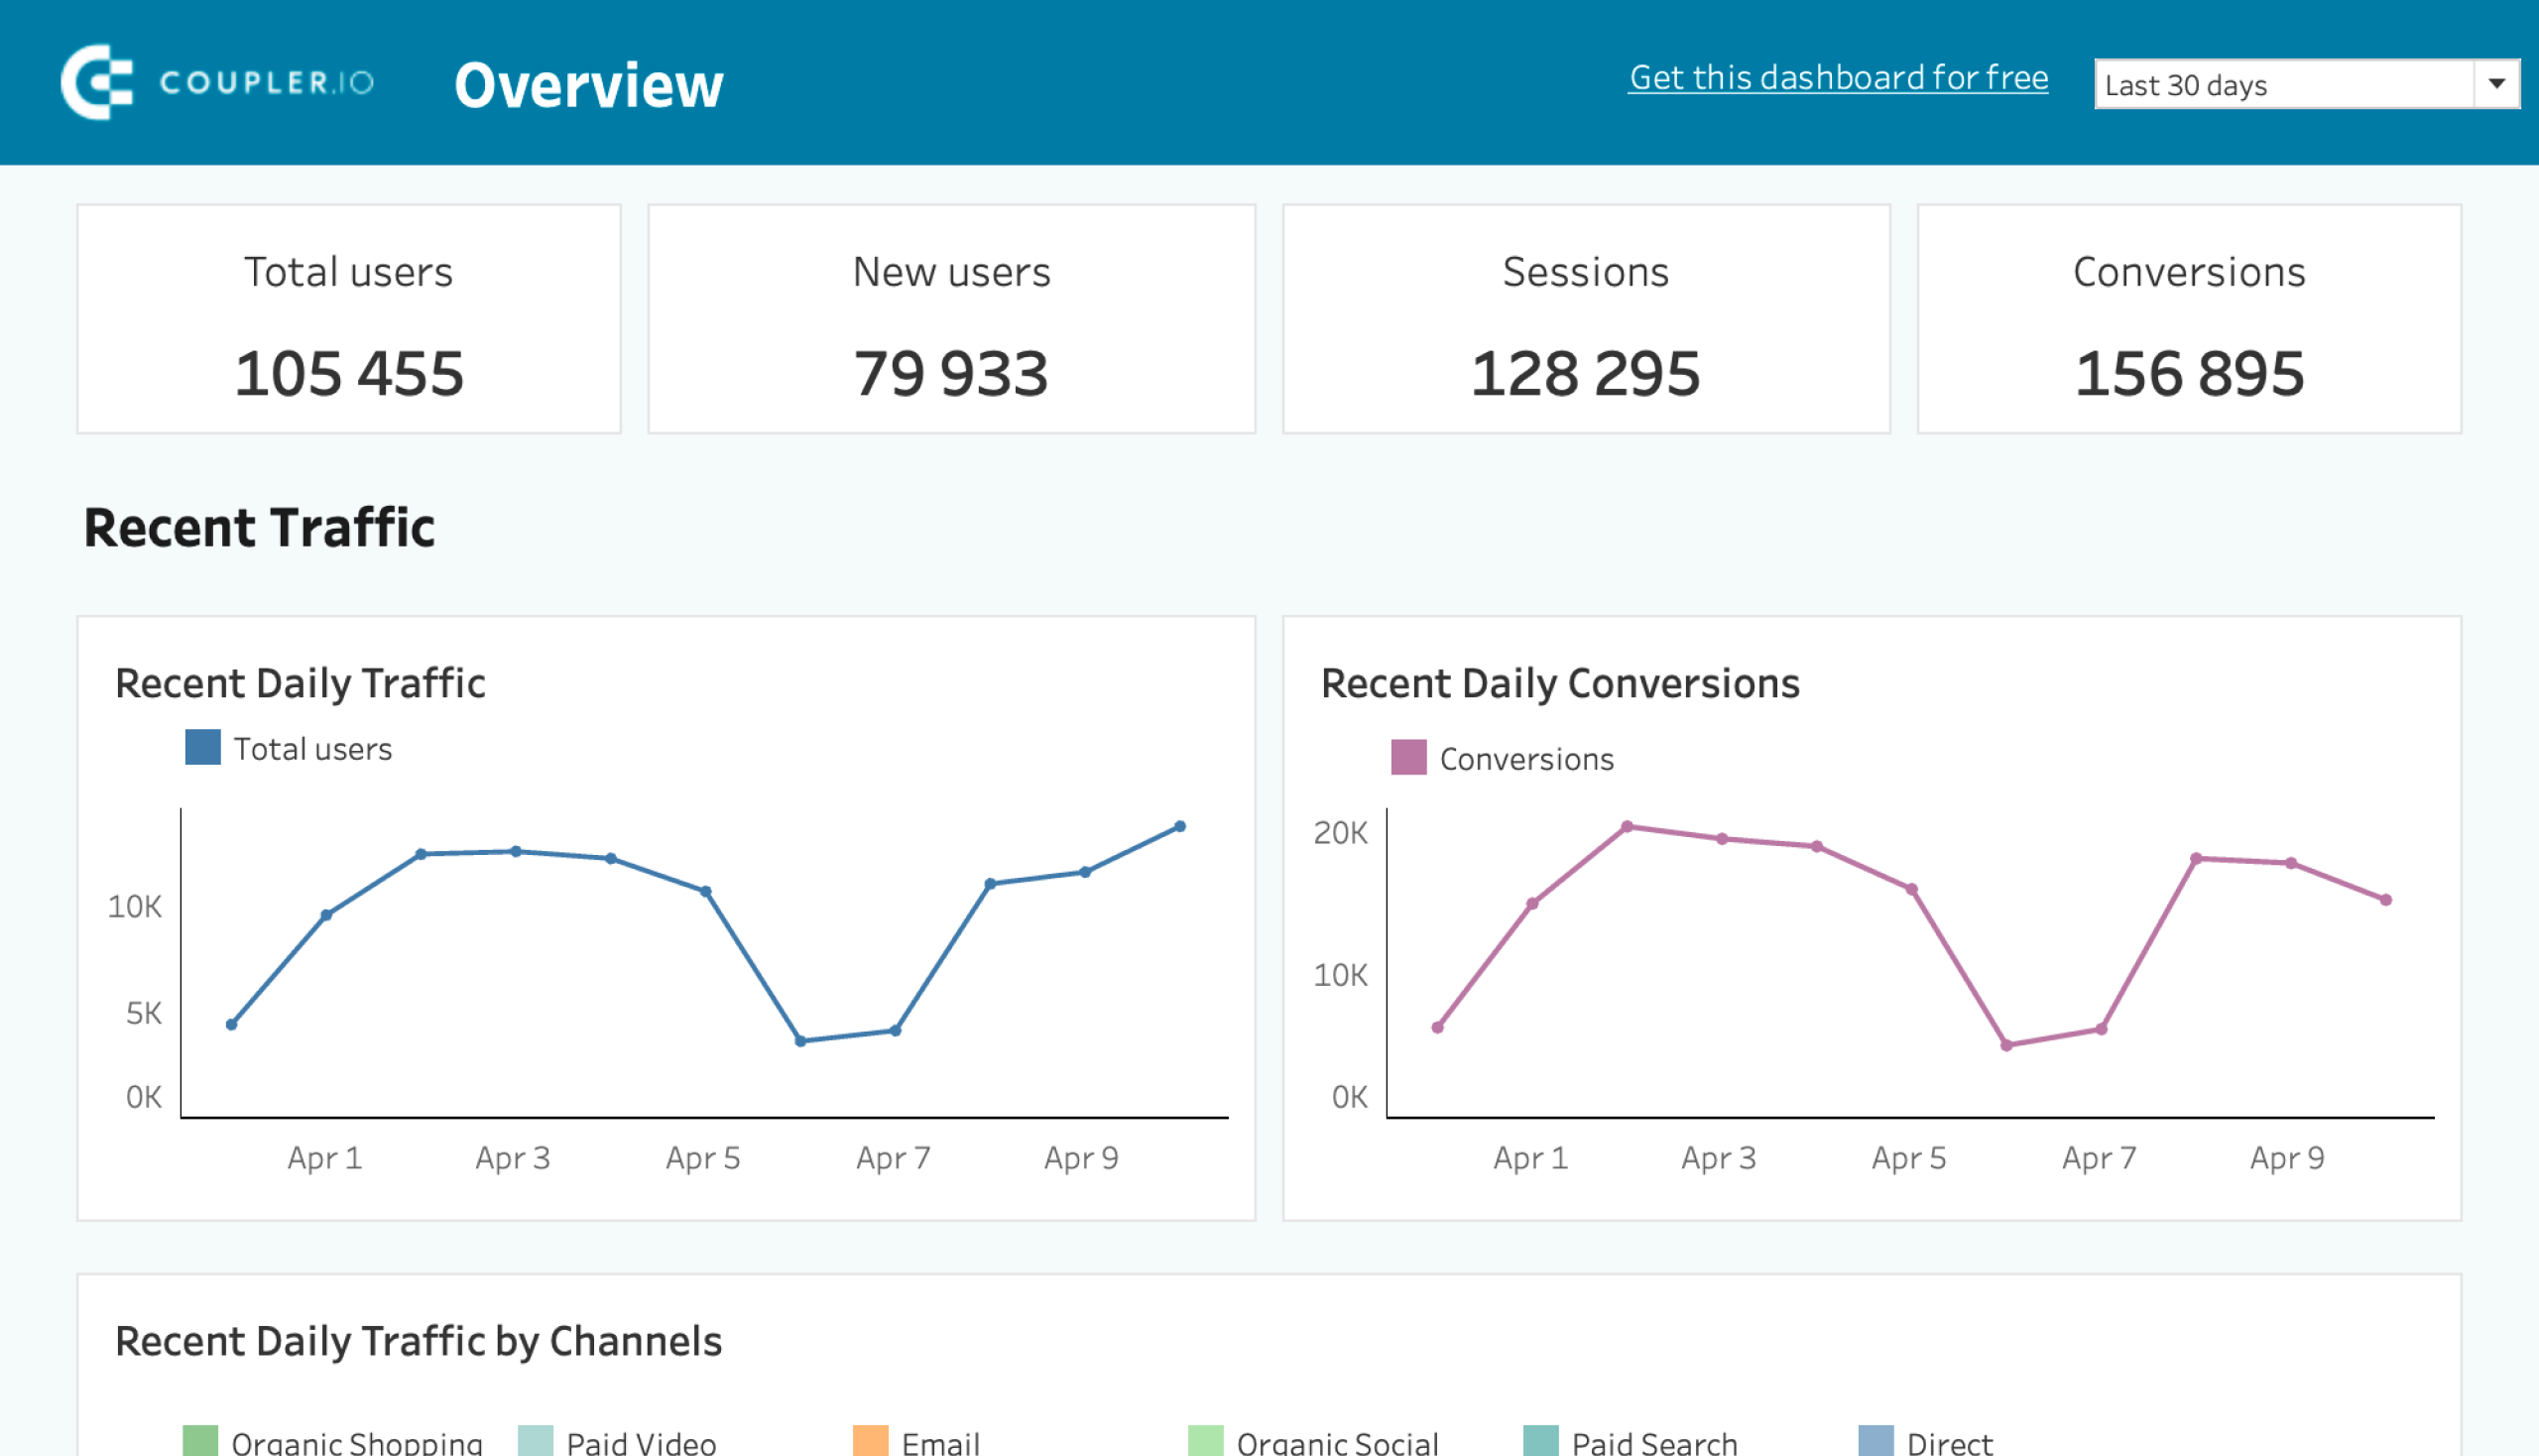
Web analytics dashboard in Tableau
Monitor the performance of your traffic, analyze the conversion funnel, and derive other insights from Google Analytics 4.

Web analytics dashboard in Power BI
Discover insights into your website’s traffic acquisition, audience, and conversions with Google Analytics 4 data seamlessly connected to our Power BI dashboard template.

Web analytics dashboard in Google Sheets
Gain valuable insights into your website’s traffic sources, user interactions, and conversion metrics based on data from GA4.

Google Analytics multiple properties dashboard
The Google Analytics multiple properties dashboard helps businesses that run more than one website or app. It puts data from all your sites in one place, making it really convenient to compare and understand.
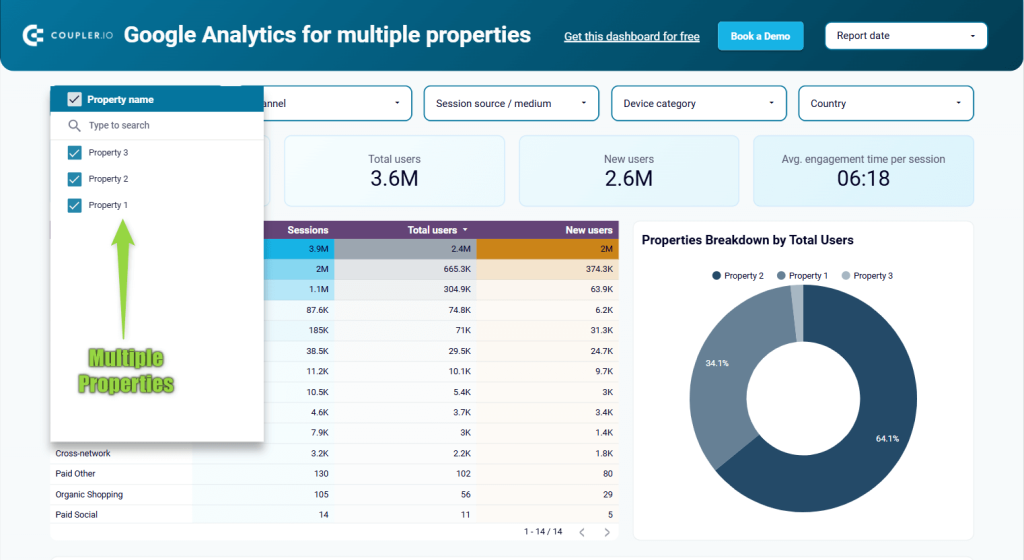
The report template is designed in Looker Studio and equipped with Coupler.io connector to automate data load from your Google Analytics account.
Google Analytics PPC dashboard template
If you’re running paid campaigns across different platforms, you’ll love this GA4 PPC dashboard. It allows you to analyze two acquisition channels: your PPC data through the eyes of Google Analytics.
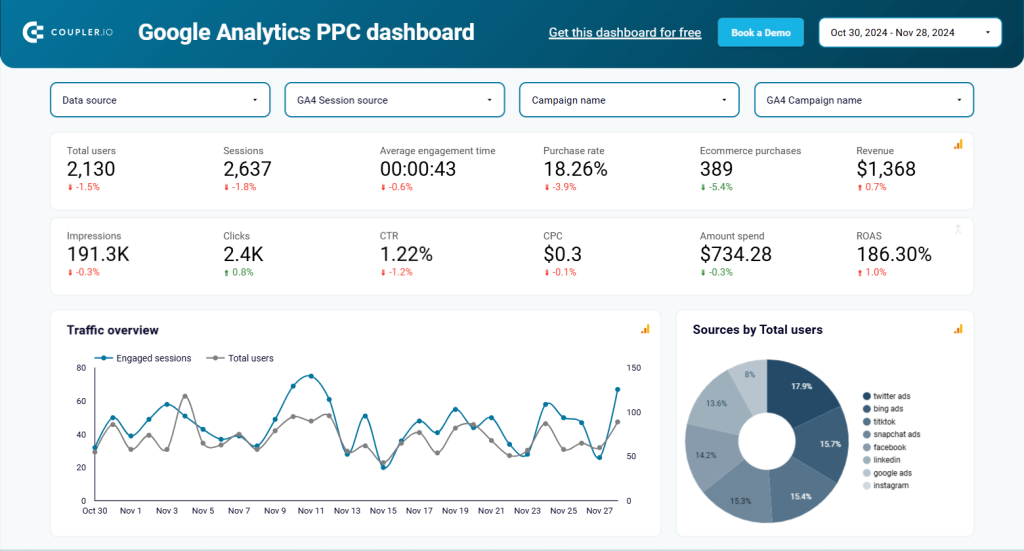
In contrast to paid media tools, GA4 is typically less biased and allows you to gain deeper insights into the behavior of paid traffic, such as what they do after converting. This includes ads on LinkedIn, TikTok, Google, etc.
The report template is available in Looker Studio. Use the enclosed instructions to connect your GA4 account and load data to your report copy.
GA4 key event insights dashboard
Understanding how users interact with key elements of your website is useful to optimize user experience and drive conversions. The GA4 key event insights dashboard provides a structured view of user interactions. It allows you to analyze event completions, engagement trends, and conversion paths in one place.
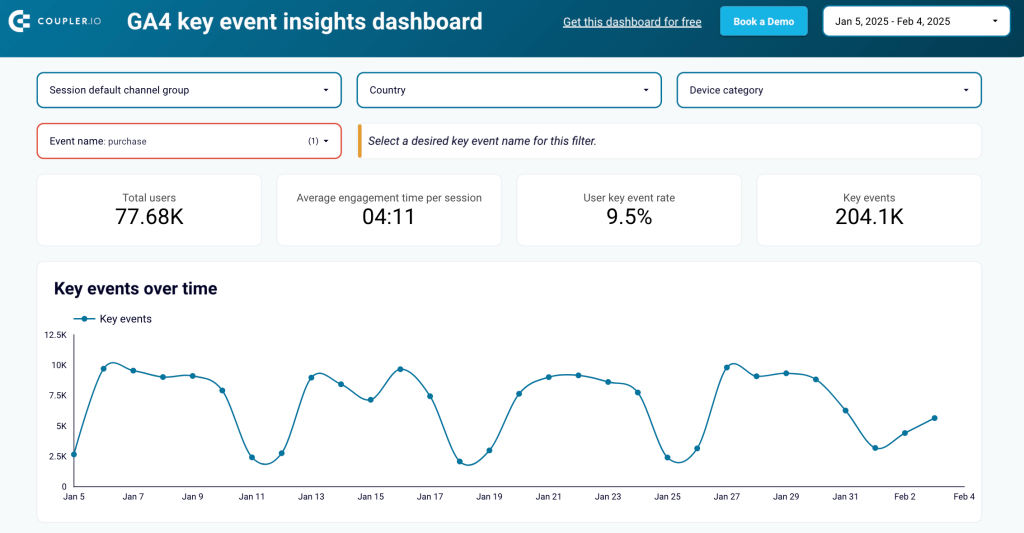
With this dashboard, you can track high-priority user actions like form submissions, purchases, video views, and other key interactions. It allows you to measure event performance over time, identify high-converting traffic sources, and understand behavioral patterns that influence engagement.
The GA4 key event insights dashboard connects to Looker Studio through Coupler.io for automated updates. Follow the instructions in the Readme tab, connect your GA4 account, and the dashboard loads your data for instant analysis.
Referral traffic performance dashboard template
If you need to demonstrate how referral sources contribute to your client’s website growth, use this referral traffic dashboard. It gives you an easy way to track referral performance and dig deeper into user behavior beyond just clicks.
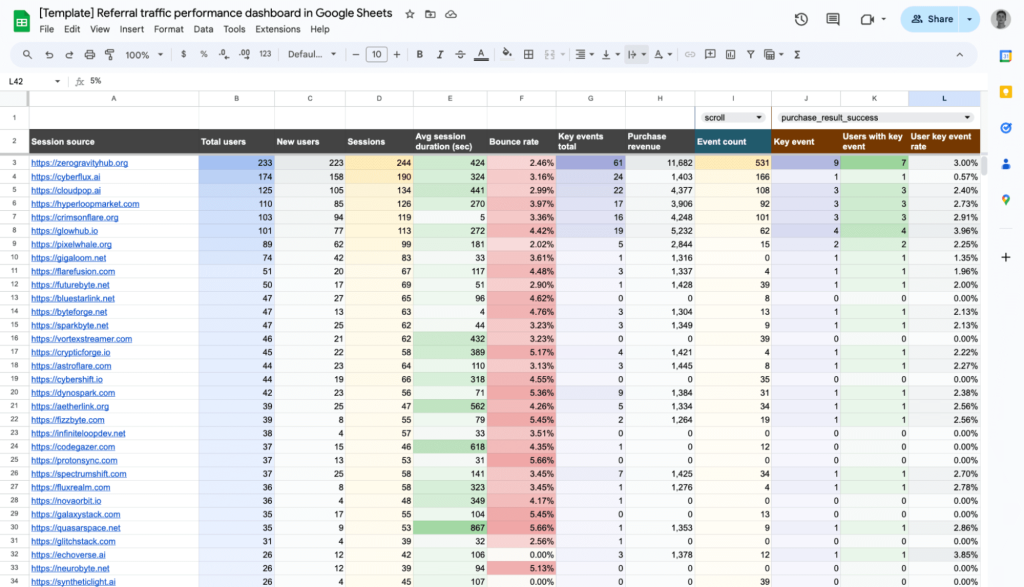
It looks like a regular spreadsheet, yet it provides valuable insights into key metrics to evaluate the performance of your referral traffic sources. The report template is designed in Google Sheets. Simply follow the included instructions to connect your GA4 account and start exploring your referral data.
Landing page performance dashboard template
Want to know how well your landing pages are doing? This landing page report gives you a detailed look at the performance of your pages for the last 30 days based on the data collected from GA4 and Google Search Console.
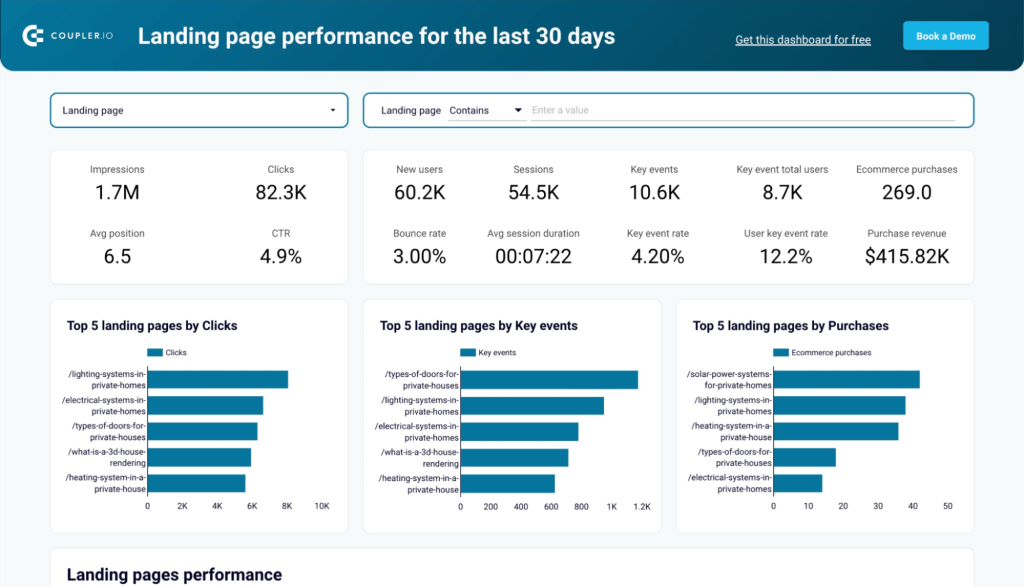
GA4 helps you go beyond surface-level data, showing you how users engage with your pages, what drives conversions, and potential drop-off points. GSC provides information on organic search, including clicks, impressions, and the ranking position of landing pages.
Learn the difference between Google Search Console vs Google Analytics.
The report template is available in Google Sheets and Looker Studio. Use the step-by-step guide to connect your GA4 account and get started with your own copy.
These reporting dashboards are tailored to take the pain out of most reporting scenarios so you can put data-driven analytics into the hands of your clients quickly. At the same time, Coupler.io offers more ready-to-go GA4 reporting solutions, so feel free to check out our template library.
How to present a Google Analytics report
For large-scale reporting, such as consolidating data for a franchise or a small business, it is essential to walk clients through how the report works and how to find insights.
You can do this by:
- Presenting the report during a meeting to explain key insights.
- Including a short introduction video that provides a quick tour of the report.
Consider if there are any hidden features clients might overlook. For example, optional metrics in Looker Studio are a valuable feature that may not be immediately obvious.
Many people simply send or share Google Analytics reports without much explanation, which can leave clients feeling lost. Tools like Coupler.io include detailed guides on the purpose and functionality of their report templates, helping clients understand their value.
By preparing your reports as outlined earlier, you not only deliver clear and actionable insights but also generate excitement among your clients, who will enjoy seeing the results of your collaboration.
The best way to prepare Google Analytics reports for clients
We saw how creating high-quality Google Analytics reports for clients comes with challenges. Issues such as tool complexity, data integration issues, handling large datasets, technical expertise, and time constraints can make the process overwhelming, even with top solutions available.
Fortunately, Coupler.io helps clear all of these hurdles by offering dashboards and templates that address technical challenges while staying user-friendly and easy to use.
These ready-made dashboards are an obvious win when reporting on Google Analytics for agencies. They not only deliver value to clients but also leave a lasting impression and serve as effective tools for client retention.
The question is, why wait?
Automate Google Analytics reporting for clients with Coupler.io
Get started for free