Your website visibility is the foundation of your online success.
Understanding your site’s search performance starts with gathering detailed insights. There’s no better way to get these than by building custom SEO dashboards. The Google Search Console API makes this possible by giving you access to a wealth of data. Equipped with this data, you can craft smarter optimization strategies for your SEO efforts.
Here’s the good news—you don’t need to be tech-savvy to extract data via this API. With the right tool, it’s easier than you might think. In this article, we’ll show you how to do this.
Why use API to get data from GSC?
The Google Search Console (GSC) has a web interface, so why bother with the API?
Sure, the web interface is great for quick insights, but it’s limited if you are trying to conduct advanced SEO analysis. Moreover, the interface doesn’t offer an option to build custom dashboards. This is where the GSC API comes in handy.
The API allows you to manage and analyze data without the interface’s default limitations. For example, you can extract more granular details about your website’s performance. These include search queries, clicks, impressions, and click-through rates (CTR) over longer periods or for specific segments. You can also spot and resolve issues like sitemap errors or indexing problems quickly and efficiently.
Another key advantage? With the raw data obtained from the API, you can create custom dashboards with tools like Looker Studio, Power BI, or other destinations. You can combine this data with other sources for more detailed insights and better reporting—something the web interface doesn’t allow.
Google Search Console API features
The Google Search Console API provides programmatic access to the most popular reports and functionalities in your Search Console account and more.
Here’s a list of its features:
- Search Analytic: Query traffic data for your site.
- Sitemaps: Manage all of your sitemaps.
- Sites: Manage properties from your Search Console account.
- URL Inspection: This feature inspects any URL in your site and is equivalent to URL Inspection in the Search Console interface.
Now, let’s go through each of them to better understand what this API can do.
Search Analytics
This feature is particularly useful if you’re looking to build custom dashboards. It provides one single endpoint:
- query: This method lets you retrieve search traffic data for your site. The results are sorted by click count, from highest to lowest.
Search Analytics lets you use filters for querying. For example, you can:
- Specify a date range for your analysis.
- Group the results to see how your site’s performance varies across dimensions like country, device, date, etc. If you group by date dimension, any days without data are omitted from the results.
- Filter by device types to see if users prefer mobile or desktop.
It’s important to note that this service might not return all data rows. The API has limits and only returns the top data rows.
Sitemaps
This feature is especially useful for sites that frequently update content or add new pages. It lets you optimize your site’s structure visibility on search engines with these four main methods:
- list: Lists all sitemaps submitted for your site or included in a sitemap index file.
- get: Retrieves detailed information about a specific sitemap, such as submission dates, warnings, errors, and the number of URLs it contains.
- delete: Removes a sitemap from your site.
- submit: Uploads a new sitemap to ensure it’s processed and indexed by search engines.
Some practical uses of Sitemaps service include:
- Monitor errors or warnings in a sitemap.
- Track when the sitemap was last submitted and downloaded.
- Analyze the types of content included, like images or videos.
- Delete problematic sitemaps and submit updated versions if issues are found.
- Check if the sitemap is still pending processing.
- Verify the number of URLs submitted and indexed.
With this service, you can ensure that your website remains up-to-date in the eyes of search engines. This boosts your site’s visibility and ranking potential.
Sites
If you’re managing multiple websites, this feature can help you simplify their management. It offers four methods:
- add: Adds a new site to your Search Console account for monitoring and management.
- delete: Removes a site from your account.
- get: Retrieves detailed information about a specific site, including its URL and permission level.
- list: Lists all the sites associated with your account in a single, organized list.
With this service, you can automate website management tasks like adding and removing properties or monitoring access permissions. It’s ideal for businesses with various domains or agencies managing multiple clients.
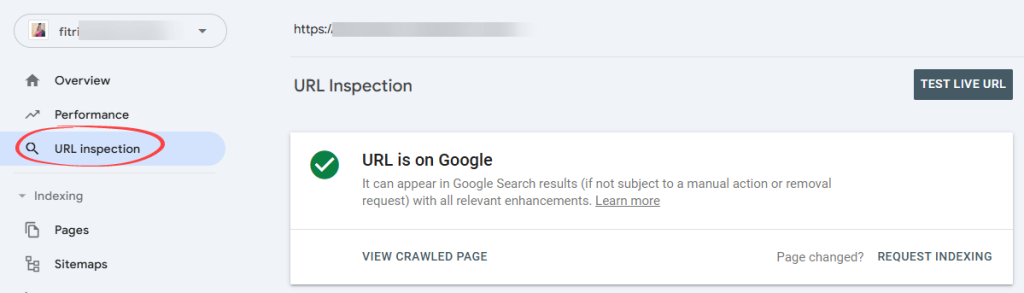
URL Inspection
The URL Inspection service is a valuable tool for understanding how your web pages are performing in Google’s index. It allows you to analyze individual URLs, providing detailed insights into their indexing and crawlability.
The functionality is equivalent to URL Inspection in the Search Console web user interface.
URL Inspection provides one method:
- index.inspect: This method lets you analyze the indexing status of a given URL. It delivers detailed information on whether the URL is indexed, any errors encountered, and potential areas for improvement.
With this service, you can:
- Check if a specific URL is indexed and view any associated issues.
- Identify indexing errors, mobile usability issues, or problems with structured data for rich results.
- Gain insights to enhance your URLs’ performance in Google Search.
The URL Inspection service allows you to maintain healthy and indexable pages. It ensures your content reaches its full potential in search rankings.
Google Search Console API limits
When using the API, you might encounter certain limits and constraints. Understanding these can help you plan and optimize your queries effectively.
Usage limits
The API limits the number of queries and the amount of data you can retrieve, impacting how frequently and extensively you can use the API each day. Here’s a quick breakdown:
Here’s a quick breakdown:
QPS = queries per second; QPM = queries per minute; QPD = queries per day.
| Feature | Per-site limits | Per-project limits | Per-user limits |
| Search Analytics | 1,200 QPM | 40,000 QPM;30,000,000 QPD | 1,200 QPM |
| URL Inspection | 600 QPM; 2,000 QPD | 15,000 QPM;10,000,000 QPD | N/A |
| Other resources | N/A | 100,000,000 QPD | 20 QPS; 200 QPM |
Tips for handling query limits:
- If you hit short-term quotas (measured in 10-minute chunks), your application should wait 15 minutes and try again.
- Spread your API calls across the day to stay within usage quotas.
- Focus on smaller date ranges if your queries are too “heavy.”
- Avoid querying the same data repeatedly. Instead, store data locally for later reference.
- Reduce grouping or filtering by “page” and “query” can significantly increase query costs.
Data availability delays
The GSC API doesn’t provide real-time data. Typically, there’s a delay of 2-3 days before new performance data becomes available. For efficiency, you can schedule your data pulls accordingly.
Keyword data sampling
Like the GSC web interface, the keyword data you get from the API is sampled. Instead of giving you the whole picture of every search query users make, the API delivers a smaller, representative slice of the data.
While this is great for identifying trends, it may not give a super-accurate representation of your audience’s search behavior. Keep this in mind when working with your reports.
No backlink insight
The API gives you a lot of useful info, but it doesn’t cover everything.
Unlike the web version of Google Search Console, the API doesn’t provide backlink data. You won’t see lists of external or internal links like you do in the web version of Google Search Console.
If backlinks are part of your SEO strategy, you’ll need another tool. For example, tools like Ahrefs or SEMrush can give you the backlink details you need.
Getting started tutorial
The API is exposed as an HTTP REST service that you can call directly. To simplify development, we recommend exploring Google’s client libraries, which provide seamless integration and are available in various programming languages such as Python, JavaScript, .NET, PHP, and more.
In this example, we’ll write simple code using Python to access the API. You will need technical skills to follow the step-by-step guide below.
Step 1. Enable the Google Search Console API
Before sending any request, you must enable the GSC API for your project on Google Cloud Console. Here’s how:
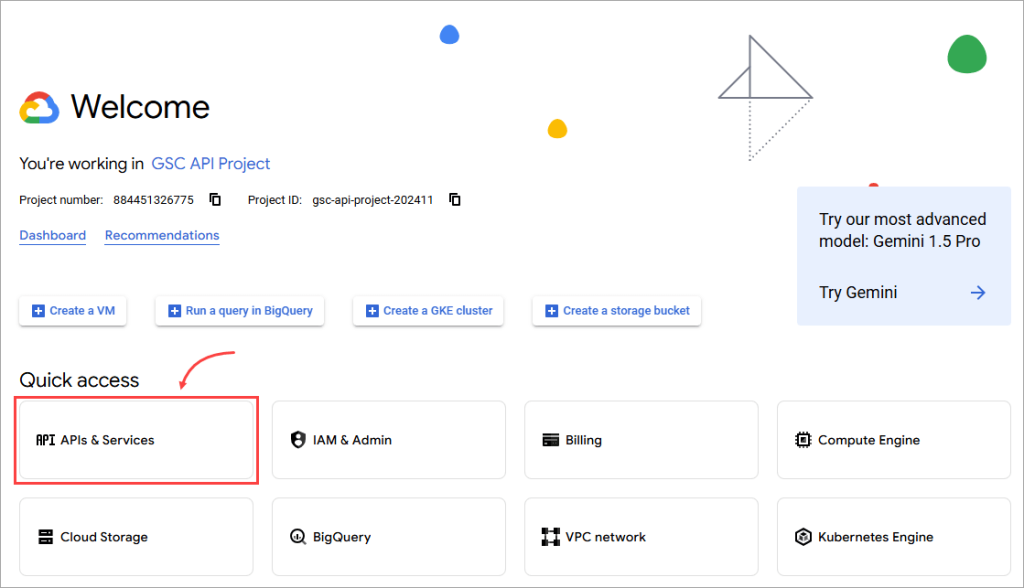
- Go to the Google Cloud Console and select an existing project. If you don’t have a project yet, create a new one.
- Click API & Services in the “Quick access” menu.
- Click Library.
- Use the search bar to find “Google Search Console API”. Click on it and hit the Enable button to activate the API for your project.
Step 2. Set up authentication
The GSC API uses OAuth 2.0 for authentication. This process requires you to create credentials (client ID and client secret) to verify your identity.
But before you do that, you must set up the OAuth consent screen. This step is important for transparency and meeting Google’s security policies. The consent screen shows users what data your app will access and why—so they can decide whether to grant permission or not. Here’s how you can set it up:
How to set up the OAuth consent screen
- Go to APIs & Services > OAuth consent screen in your Google Cloud project.
- For user type, select External (for apps accessible by public users) and click Create.
- On the OAuth consent screen configuration page, fill in the required details, such as “App name”, “User support email”, and “Developer contact information”. Once done, click Save and Continue.
- On the Scopes page, add these OAuth 2.0 scopes, then click Save and Continue.
https://www.googleapis.com/auth/webmasters
https://www.googleapis.com/auth/webmasters.readonly
- On the Test users page, add any users who will test the app while its publishing status is set to “Testing.” Then, click Save and Continue to finish.
How to create credentials
- Go to APIs & Services > Credentials in your Google Cloud project.
- Click on Create Credentials, then select OAuth client ID.
- For the application type, select Desktop App. Then, click Create.
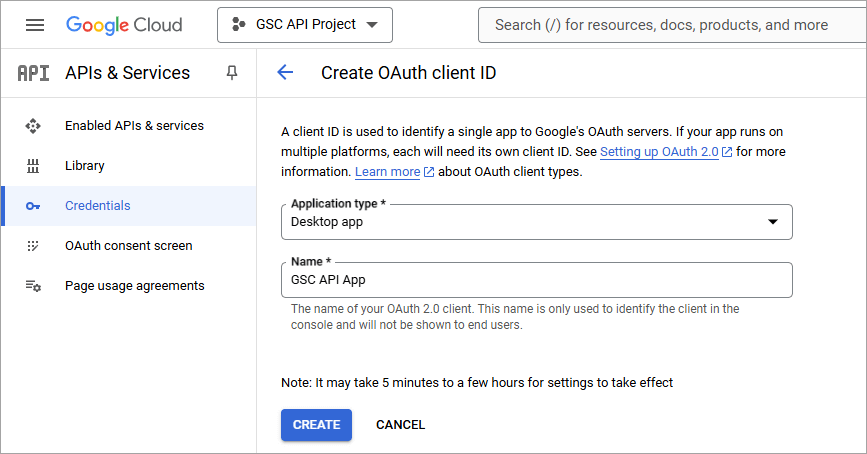
- On the popup window that appears, click Download JSON. This JSON file contains your client ID and client secret, which will be used later in the code.
- Rename the file as credentials.json.
Step 3. Make your first API request
Now, you’re ready to send a request to the GSC API.
Below is an example script in Python that gets data from the Sites service. We’ll get the list of sites. The code uses the JSON credentials file to authenticate—we’re not using a Google Search Console API key here.
Before running the code, install the necessary libraries with pip. Read the commented lines for the explanation of each step.
Example code:
import argparse
import httplib2
import requests
from collections import defaultdict
from dateutil import relativedelta
from googleapiclient.discovery import build
from oauth2client import client
from oauth2client import file
from oauth2client import tools
CLIENT_SECRET_FILE = "credentials.json"
SCOPES = ['https://www.googleapis.com/auth/webmasters.readonly']
def authenticate(json_file, creds="creds.dat"):
# Create a parser to be able to open the browser for Authorization
parser = argparse.ArgumentParser(
formatter_class=argparse.RawDescriptionHelpFormatter,
parents=[tools.argparser])
flags = parser.parse_args([])
# Create a flow object from the client secrets file
flow = client.flow_from_clientsecrets(json_file, scope = SCOPES,
message = tools.message_if_missing(json_file))
# Set up a storage object to hold the credentials
storage = file.Storage(creds)
credentials = storage.get()
# Run the OAuth2 flow if credentials are not available or invalid
if credentials is None or credentials.invalid:
credentials = tools.run_flow(flow, storage, flags)
# Authorize the HTTP object with the credentials
http = httplib2.Http()
http = credentials.authorize(http=http)
webmasters_service = build('searchconsole', 'v1', http=http)
print('Successfully authenticated with Google Search Console API.')
return webmasters_service
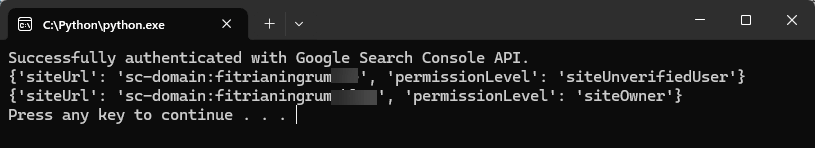
def list_all_sites(webmasters_service):
site_list = webmasters_service.sites().list().execute()
for site in site_list['siteEntry']:
print(site)
if __name__ == '__main__':
credentials_file = CLIENT_SECRET_FILE;
# Authenticate with Google Search Console API using your credentials
webmasters_service = authenticate(credentials_file)
# List all sites available in your Search Console
list_all_sites(webmasters_service)
Here’s an example result:
How to use API Explorer to test Google Search Console API
To familiarise yourself with Google Search Console API, the best place to start is the API Explorer. This tool enables you to experiment with Search Console API requests before integrating them into your applications.
What is the Google APIs Explorer?
The Google APIs Explorer is a web-based tool that lets you interact with various Google APIs without having to write any code. It provides an interactive interface to test API requests, adjust parameters, and view real-time JSON responses.
One of the APIs available in this tool is the Google Search Console API, which allows you to retrieve search performance data, check indexing status, and analyze key SEO metrics. Using the APIs Explorer, you can test different methods within the Search Console API, see the type of data they return, and refine your queries before integrating them into your workflows.
Getting started with the Google APIs Explorer
In the following section, we walk you through how to use the APIs Explorer to test the Google Search Console API, from selecting a REST method to executing your request.
Step 1: Select the Search Console API method
- Start by opening the Google Search Console API in your browser.
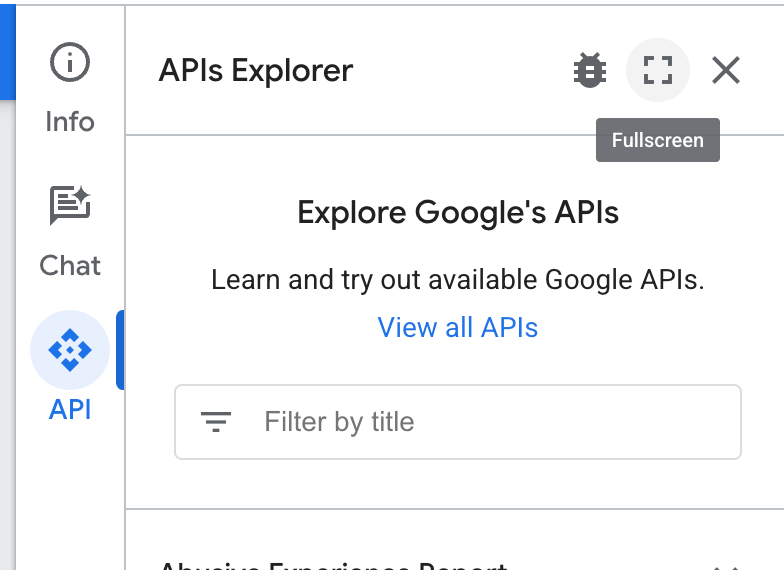
- On the right-hand side of the page, click the API button to open the APIs Explorer panel.
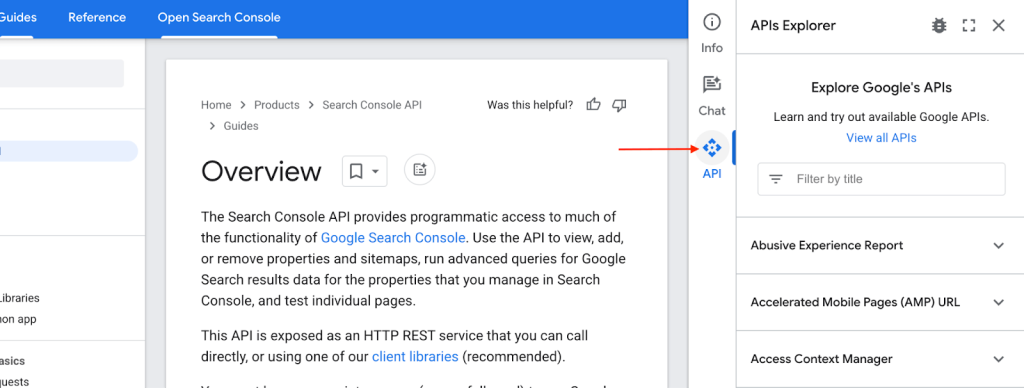
- Then, click the full-screen icon to expand the interface for a better view.
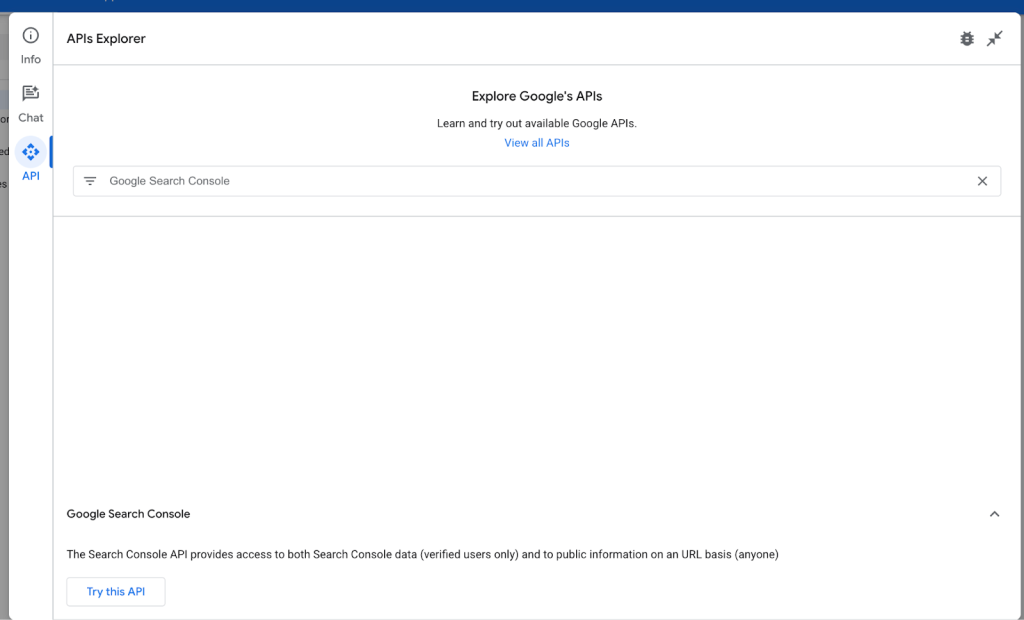
- Next, type Google Search Console into the search bar. Once it appears in the results, click Try this API to proceed.
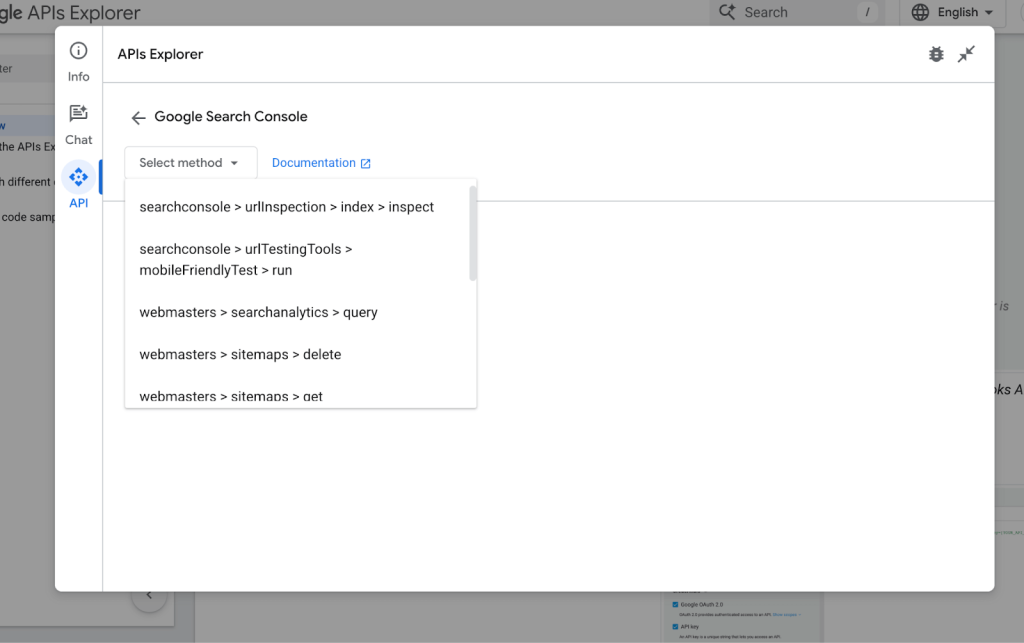
- Next, select the method you want to test. Here are a few options:
- searchconsole > urlInspection > index > inspect – Inspect the index status of a specific URL.
- webmasters > sitemaps > list – List all the sitemaps linked to your account.
- webmasters > sitemaps > get – Retrieve detailed information about specific sitemaps.
- webmasters > searchanalytics > query – Fetch performance metrics like clicks, impressions, and CTR.
- webmasters > sites > list – Retrieve a list of sites verified in Search Console for the authenticated user.
Each method provides different types of data, so you can pick the one that suits your needs.
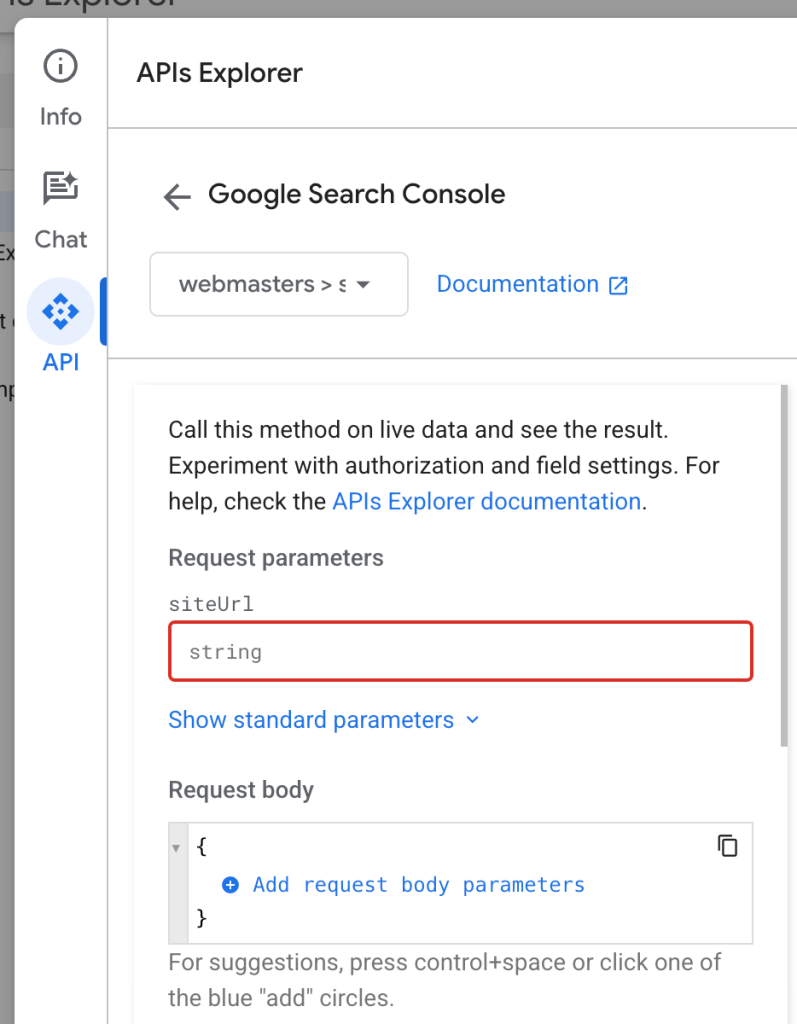
Step 2: Customize parameters
Once you’ve chosen a method, you’ll need to customize the request. The specific request parameters or request body you’ll add depends entirely on your selected method.
- Request Parameters: These are optional or required inputs that define the data you’re pulling and its source.
- Request Body: This is essential when working with POST requests. It contains the main details for your query, such as language code, dimensions, siteurl, and other settings.
Step 3: Set authentication and Credentials
To interact with the Search Console API, you must set up credentials to authenticate your requests. You can use either OAuth 2.0 or API keys. Here’s how to set them up:
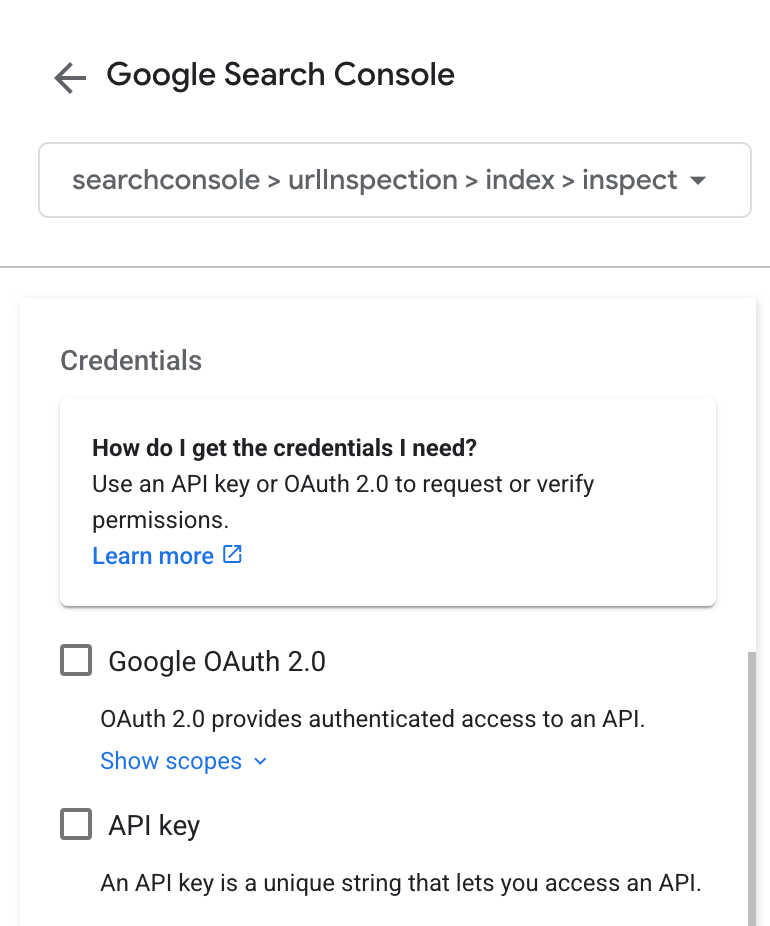
Setting Up OAuth 2.0 and API keys
- Open the Google Cloud Console and select an existing project or create one.
- Go to APIs & Services > Library, use the search bar to find Google Search Console API, and click Enable to activate it for your project.
- On the left nav, click on Credentials > + Create Credentials.
- For API Key: Select API Key, and it will automatically generate a unique identifier for your project. You don?t need to copy it, as it will be securely stored in your Google Cloud Console and can be accessed by the APIs Explorer.
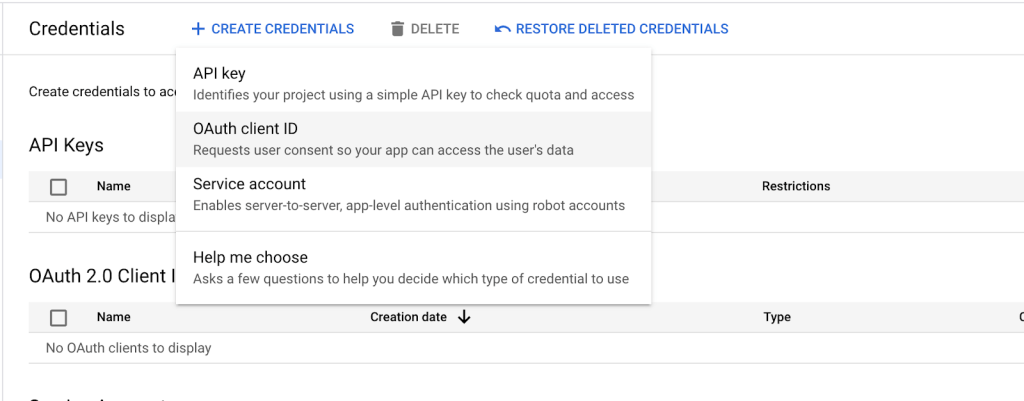
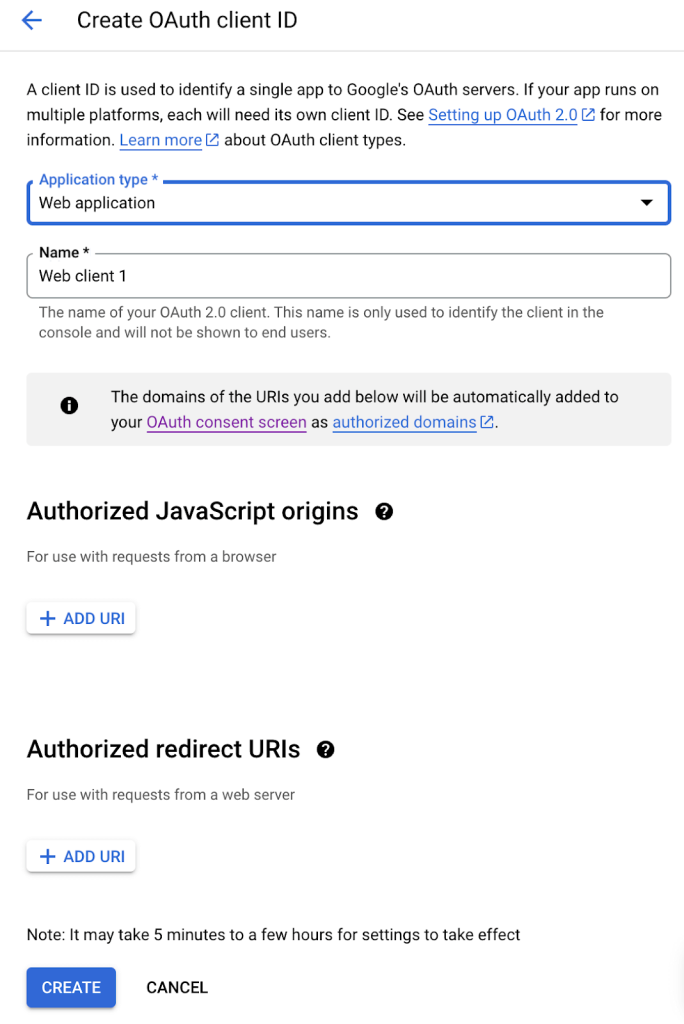
- For OAuth 2.0: Select OAuth Client ID, select your application type (e.g., Desktop App or Web Application), and click Create.
Step 4: Execute requests
Once everything is set up, click the Execute button to run your request.
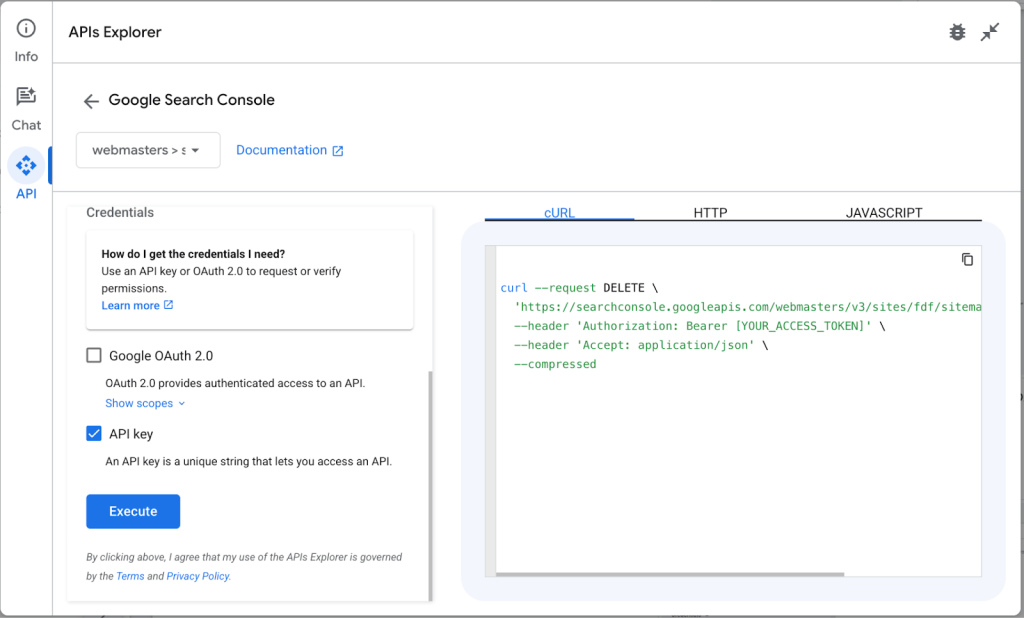
If successful, the APIs Explorer will display the response with a status code 200. The response will be in JSON format, giving you structured data to analyze. To make it easier to read or analyze, you can convert the JSON file to a CSV. You can also copy the automatically generated cURL or JavaScript snippet directly to your application.
Use dimensions in Google Search Console API
Search Analytics in the GSC API allows you to organize traffic data using dimensions.
Dimensions are like categories that help you break down data for clearer insights. For example, the “query” dimension reveals which search terms attract visitors, while the “device” dimension indicates whether users are on mobile or desktop. By using dimensions, you can better visualize how different factors impact your site’s performance, making it easier to interpret and act on your data.
Here’s a simple method that uses “country” and “device” as dimensions to group the data. This means the data will be organized by the user country, and then by their type of device.
def get_search_analytics_data(webmasters_service):
    # the website we want to get the data for
    website = "sc-domain:example.com"

    # build a request body
    request_body = {
        "startDate" : '2024-05-01',
        "endDate" : '2024-05-31',
        "dimensions" : ["country","device"],
    }
    # get the response using request body
    response_data = webmasters_service.searchanalytics().query(siteUrl=website, body=request_body).execute()

    for each in response_data['rows']:
        print(each)
You can then call the method from the main, as follows:
if __name__ == '__main__':
    credentials_file = CLIENT_SECRET_FILE;

    # Authenticate with Google Search Console API using your credentials
    webmasters_service = authenticate(credentials_file)

    # Get search analytics data
    get_search_analytics_data(webmasters_service)
Use URL Inspection in Google Search Console API
As mentioned previously, URL Inspection allows you to see how your web pages perform in Google’s index. Use it to know if a page is indexed, blocked by robots.txt, and much more.
To access it via API, you must provide your site URL and the specific page to inspect. Here’s an example method:
def url_inspect(webmasters_service):
    url_to_inspect = 'https://example.com/page/'
    website = 'sc-domain:example.com'

    request_body = {
        'inspectionUrl' : url_to_inspect,
        'siteUrl' : website
    }

    response = webmasters_service.urlInspection().index().inspect(body=request_body).execute()
    print(response)
Example of calling it from the main:
if __name__ == '__main__':
    credentials_file = CLIENT_SECRET_FILE;

    # Authenticate with Google Search Console API using your credentials
    webmasters_service = authenticate(credentials_file)
    # URL Inspection
    url_inspect(webmasters_service)
How to create Google Search Console reports without coding
So far, we know that the data retrieved from Search Console API is in JSON format, which isn’t ideal for reporting. To make it easier to work with, share, and analyze, you need an analysis-friendly tool.
With Coupler.io, you can collect data from Google Search Console and transform it into insightful reports on the go and then load these into spreadsheets, data warehouses, or BI tools. What’s more, this reporting automation solution does not require you to write a single line of code. It only takes a few clicks to schedule Google Search Console export data.
To get started, select your preferred destination from the dropdown list below and click Proceed. We have preselected Google Search Console as the data source.
You’ll be prompted to create a free Coupler.io account with no credit card required.
Step 1: Extract data from Google Search Console
Connect your Google Search Console account to Coupler.io. Once connected, select the site or sites from which you want to pull data, and choose the report type you’d like to generate.
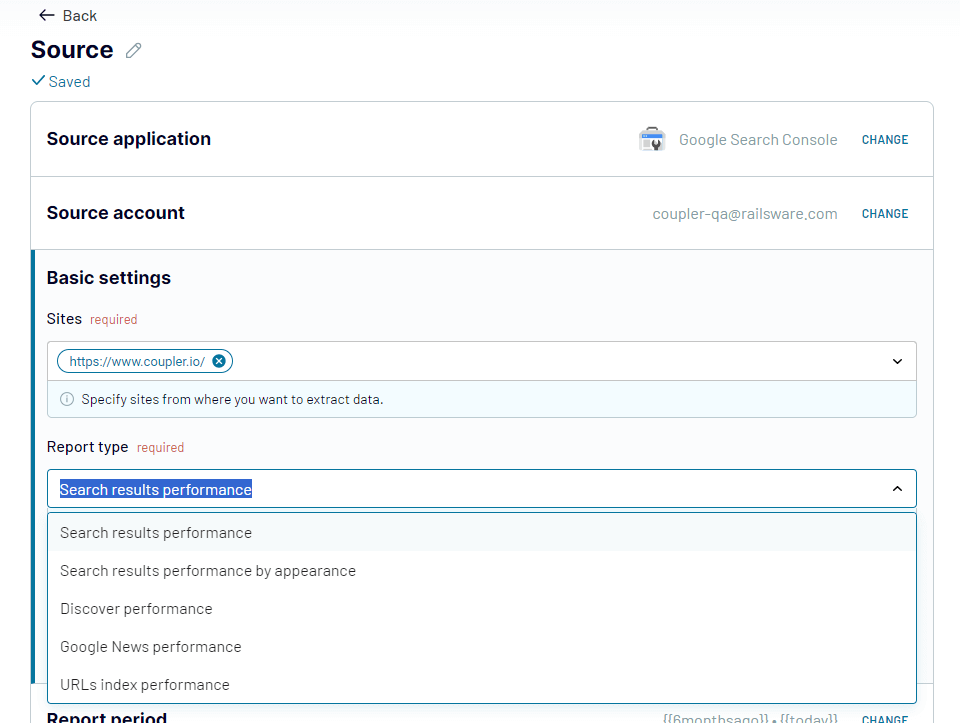
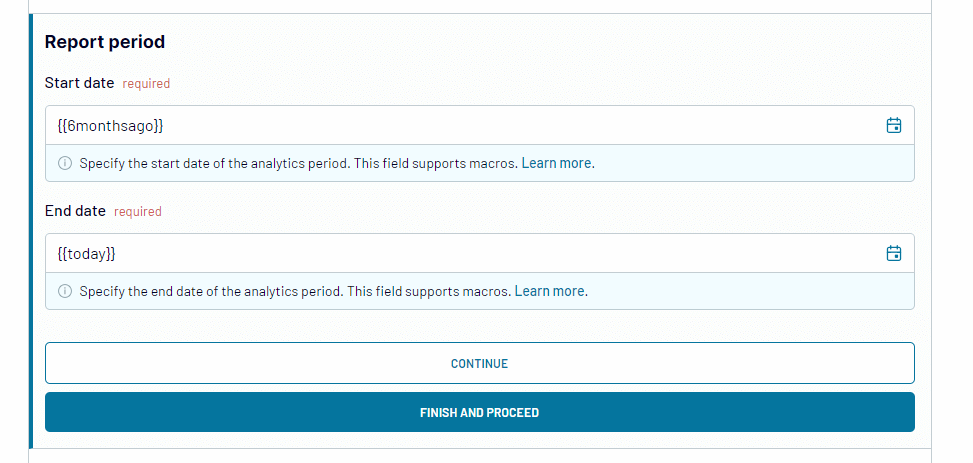
The reporting period is set to the past six months by default; you can adjust this as needed.
If you need to blend your GSC data with information from GA4 or other ad platforms, simply use the search bar to find the relevant source, click on it, and follow the steps to connect your source account.
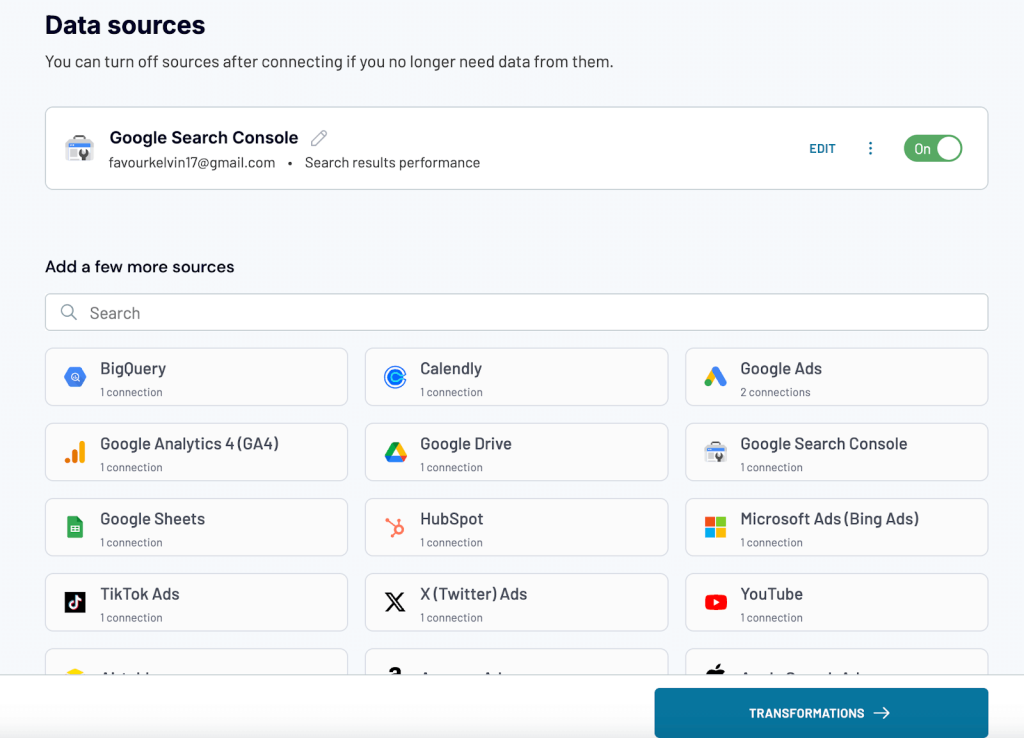
When all the source(s) are connected, move on to the Transformations step.
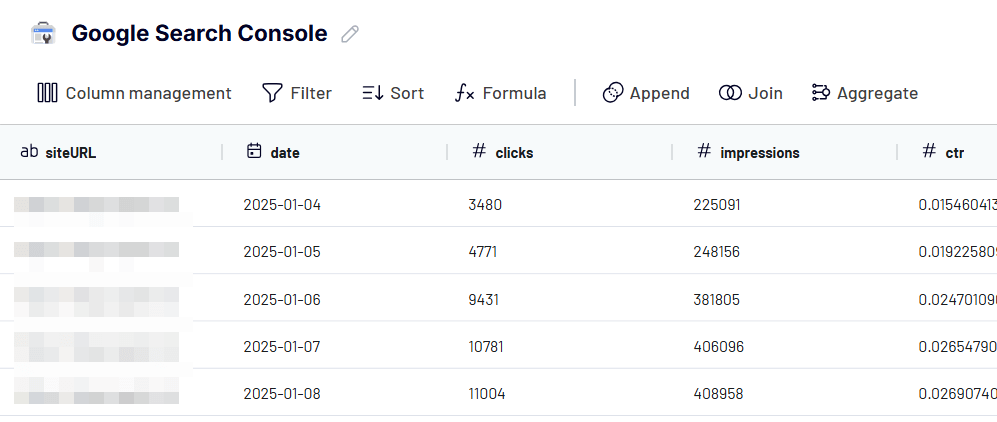
Step 2: Transform your data
Before loading the data to your destination, Coupler.io allows you to preview and transform it. This means you can:
- Rearrange, hide, or rename columns to prioritize key metrics.
- Add custom fields with formulas for enhanced analytics.
- Filter and sort the data to focus on specific performance metrics.
- Aggregate data to summarise key insights using functions like sum, count, average, min, or max.
If you’ve previously connected several sources, you can blend the data in the following manner:
- Append: Merge datasets with similar structures and columns matched by name.
- Join: Combine datasets with different structures and at least one matched column.
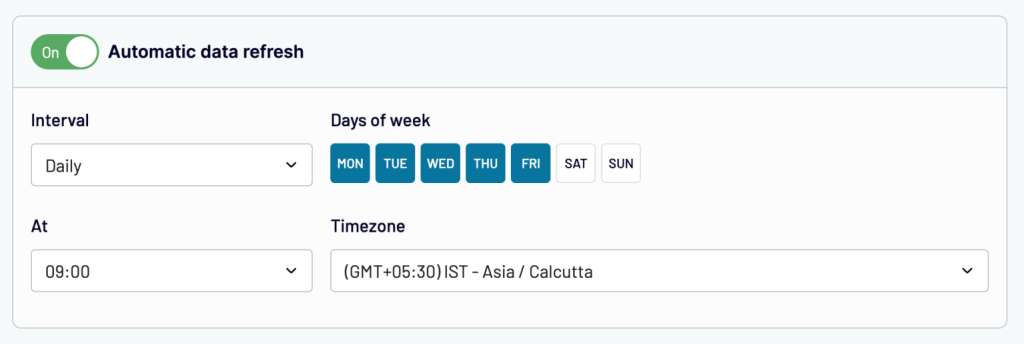
Step 3: Load data and schedule updates
Finally, load your data into your chosen destination by following the in-app instructions and running the importer. You can also enable automatic data refresh and set a schedule for your reports. Coupler.io offers flexible update intervals, including monthly, daily, hourly, or as frequently as every 15 minutes.
And that’s all it takes! Coupler.io simplifies the process of turning raw Google Search Console data into actionable reports, all without the need for coding or any technical headaches.
Coupler.io supports multiple destinations for your Google Search Console data, including:
Ready to use SEO dashboard templates for Google Search Console
An interactive dashboard makes it easier to track and analyze your SEO data at a glance. Coupler.io offers free SEO dashboards that turn your Google Search Console API data into clear, easy-to-read reports. Setup is rapid, takes less than five minutes, and gives you instant access to key SEO insights without manually formatting JSON responses.
To get started with any of the templates below, navigate to the Readme tab and follow the step-by-step instructions.
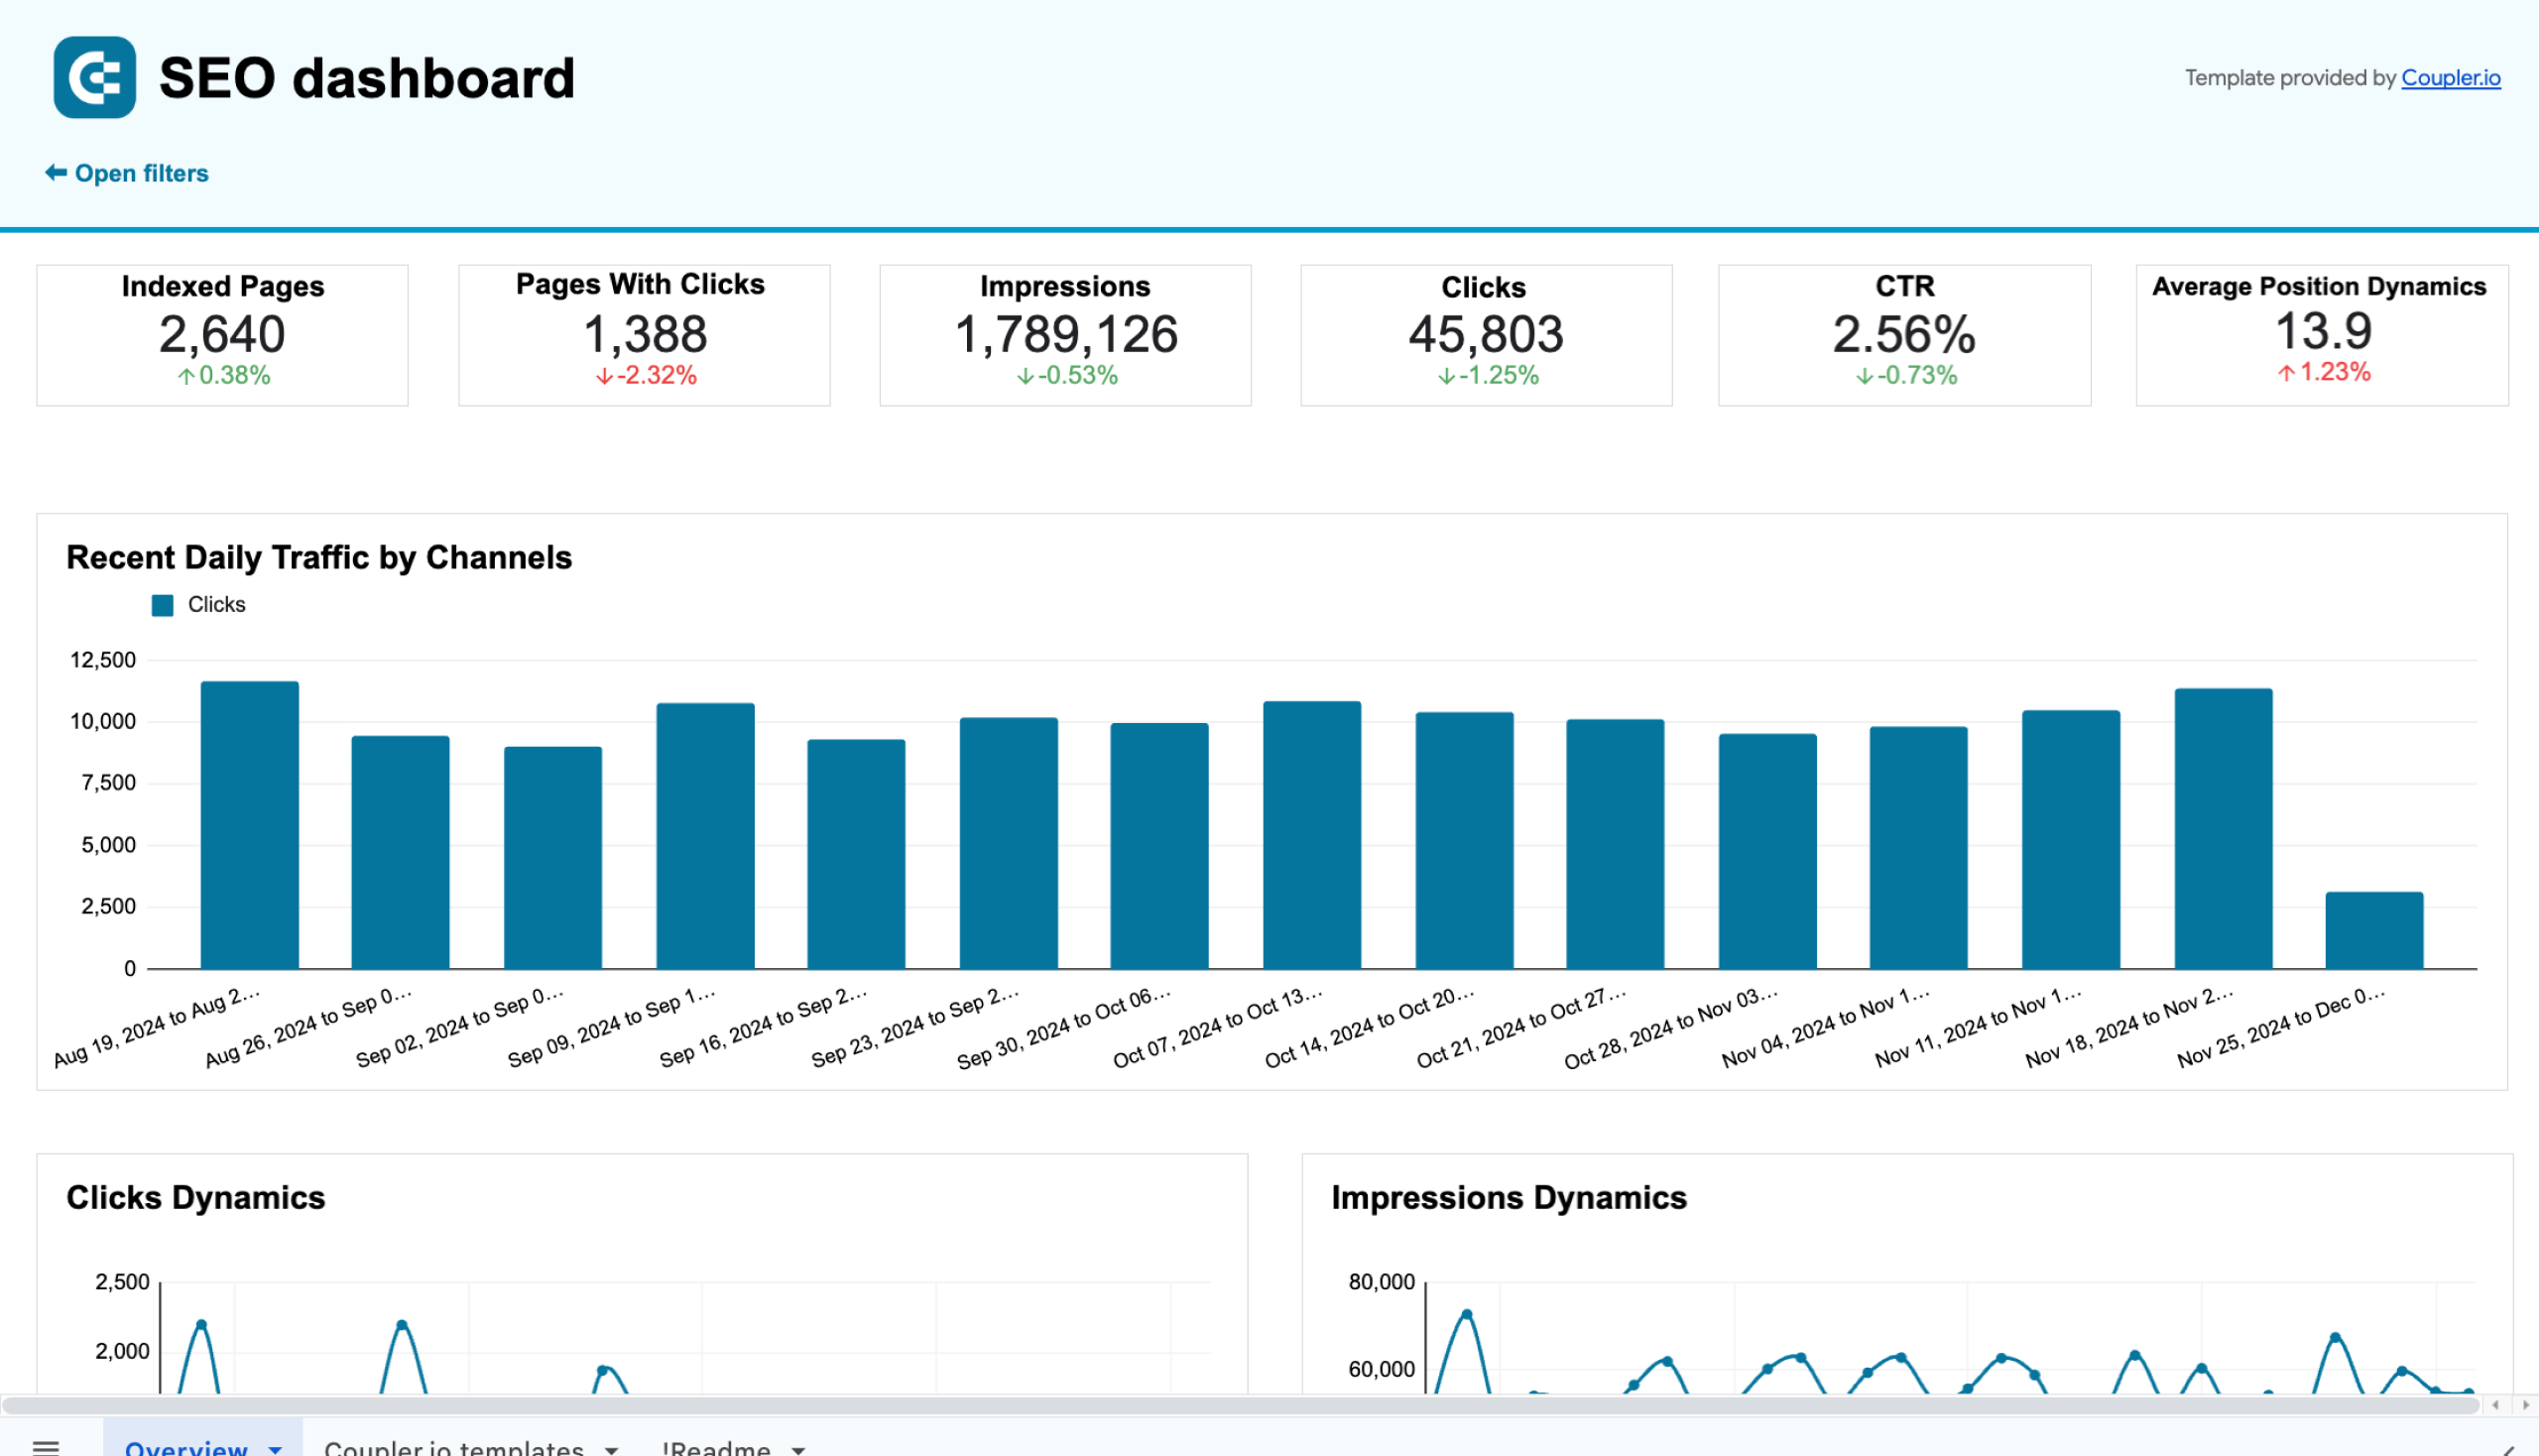
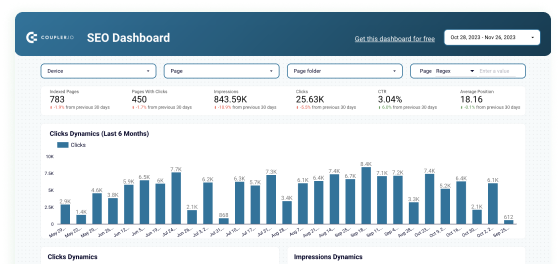
SEO dashboard
This dashboard offers a clear overview of your website’s SEO performance using data from Google Search Console. It visually presents key metrics like clicks, impressions, CTR, and average positions for quick insights. You can easily track trends and identify which pages or queries bring the most traffic.
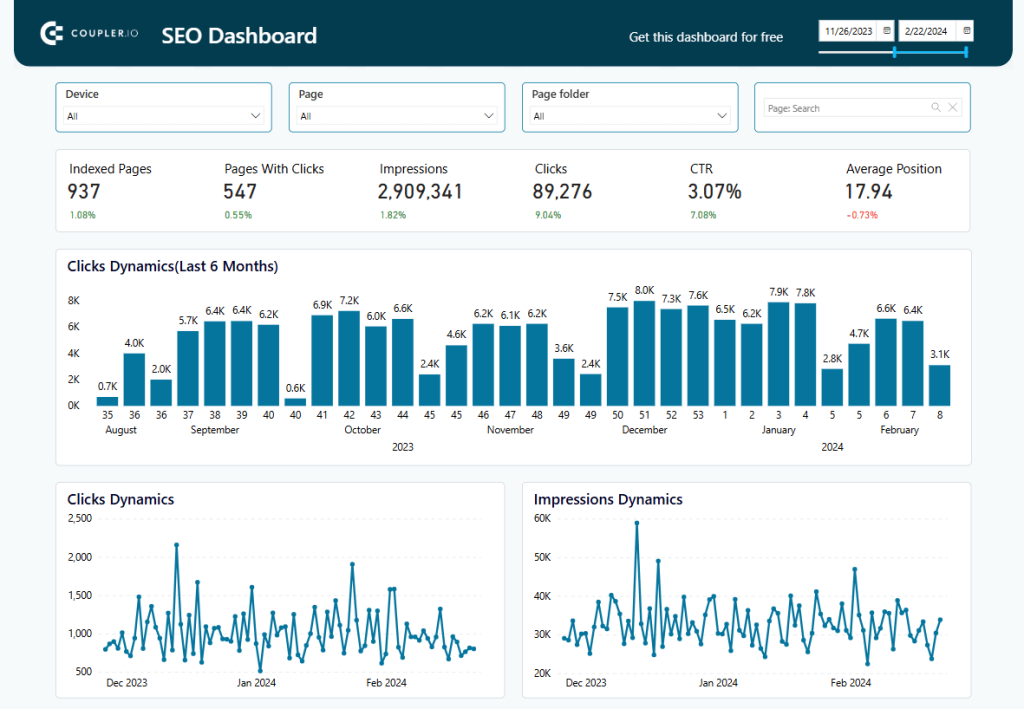
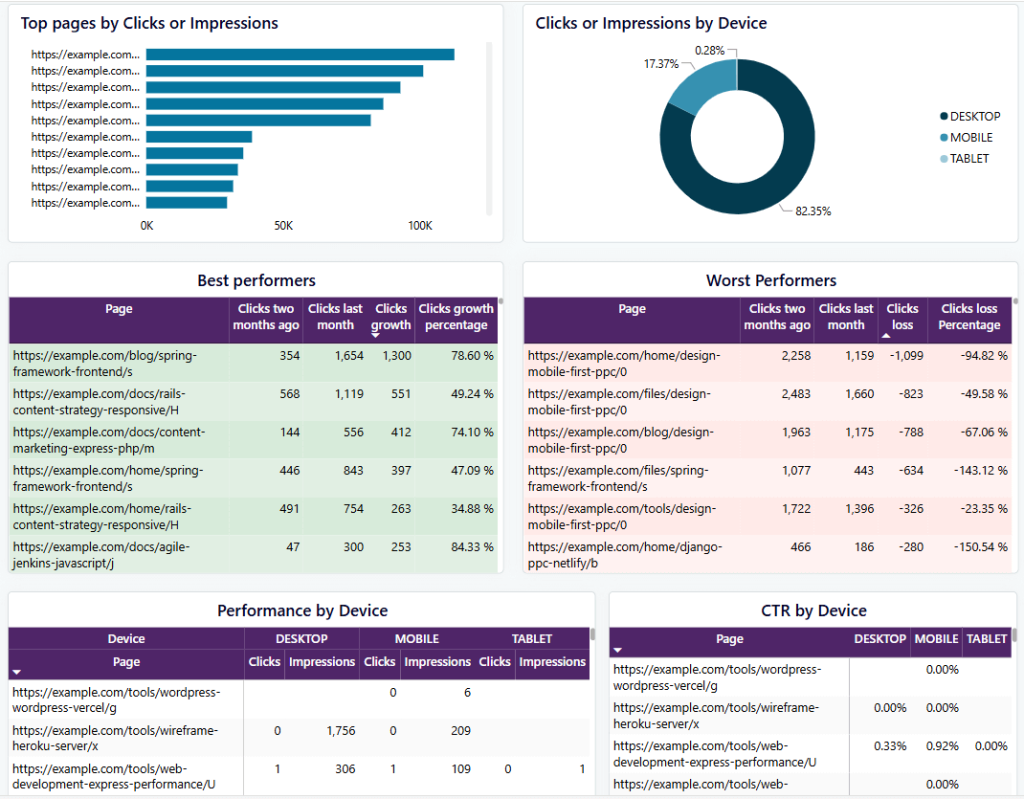
Scroll down a bit to check detailed breakdowns. For example, you’ll find clicks and impressions by page. You can also view performance by device—desktop, mobile, or tablet.
You can use the insights to boost pages with high impressions but low clicks. Try updating the title or meta description to make them grab more attention. If mobile performance is lacking, focus on improvements to make your site more mobile-friendly. The SEO dashboard is available for Google Sheets, Looker Studio, and Power BI. Choose your version and try it right away for free.
SEO dashboard for Google Search Console in Google Sheets
Get an overview and details of the key performance metrics from Google Search Console required for SEO of your websites.


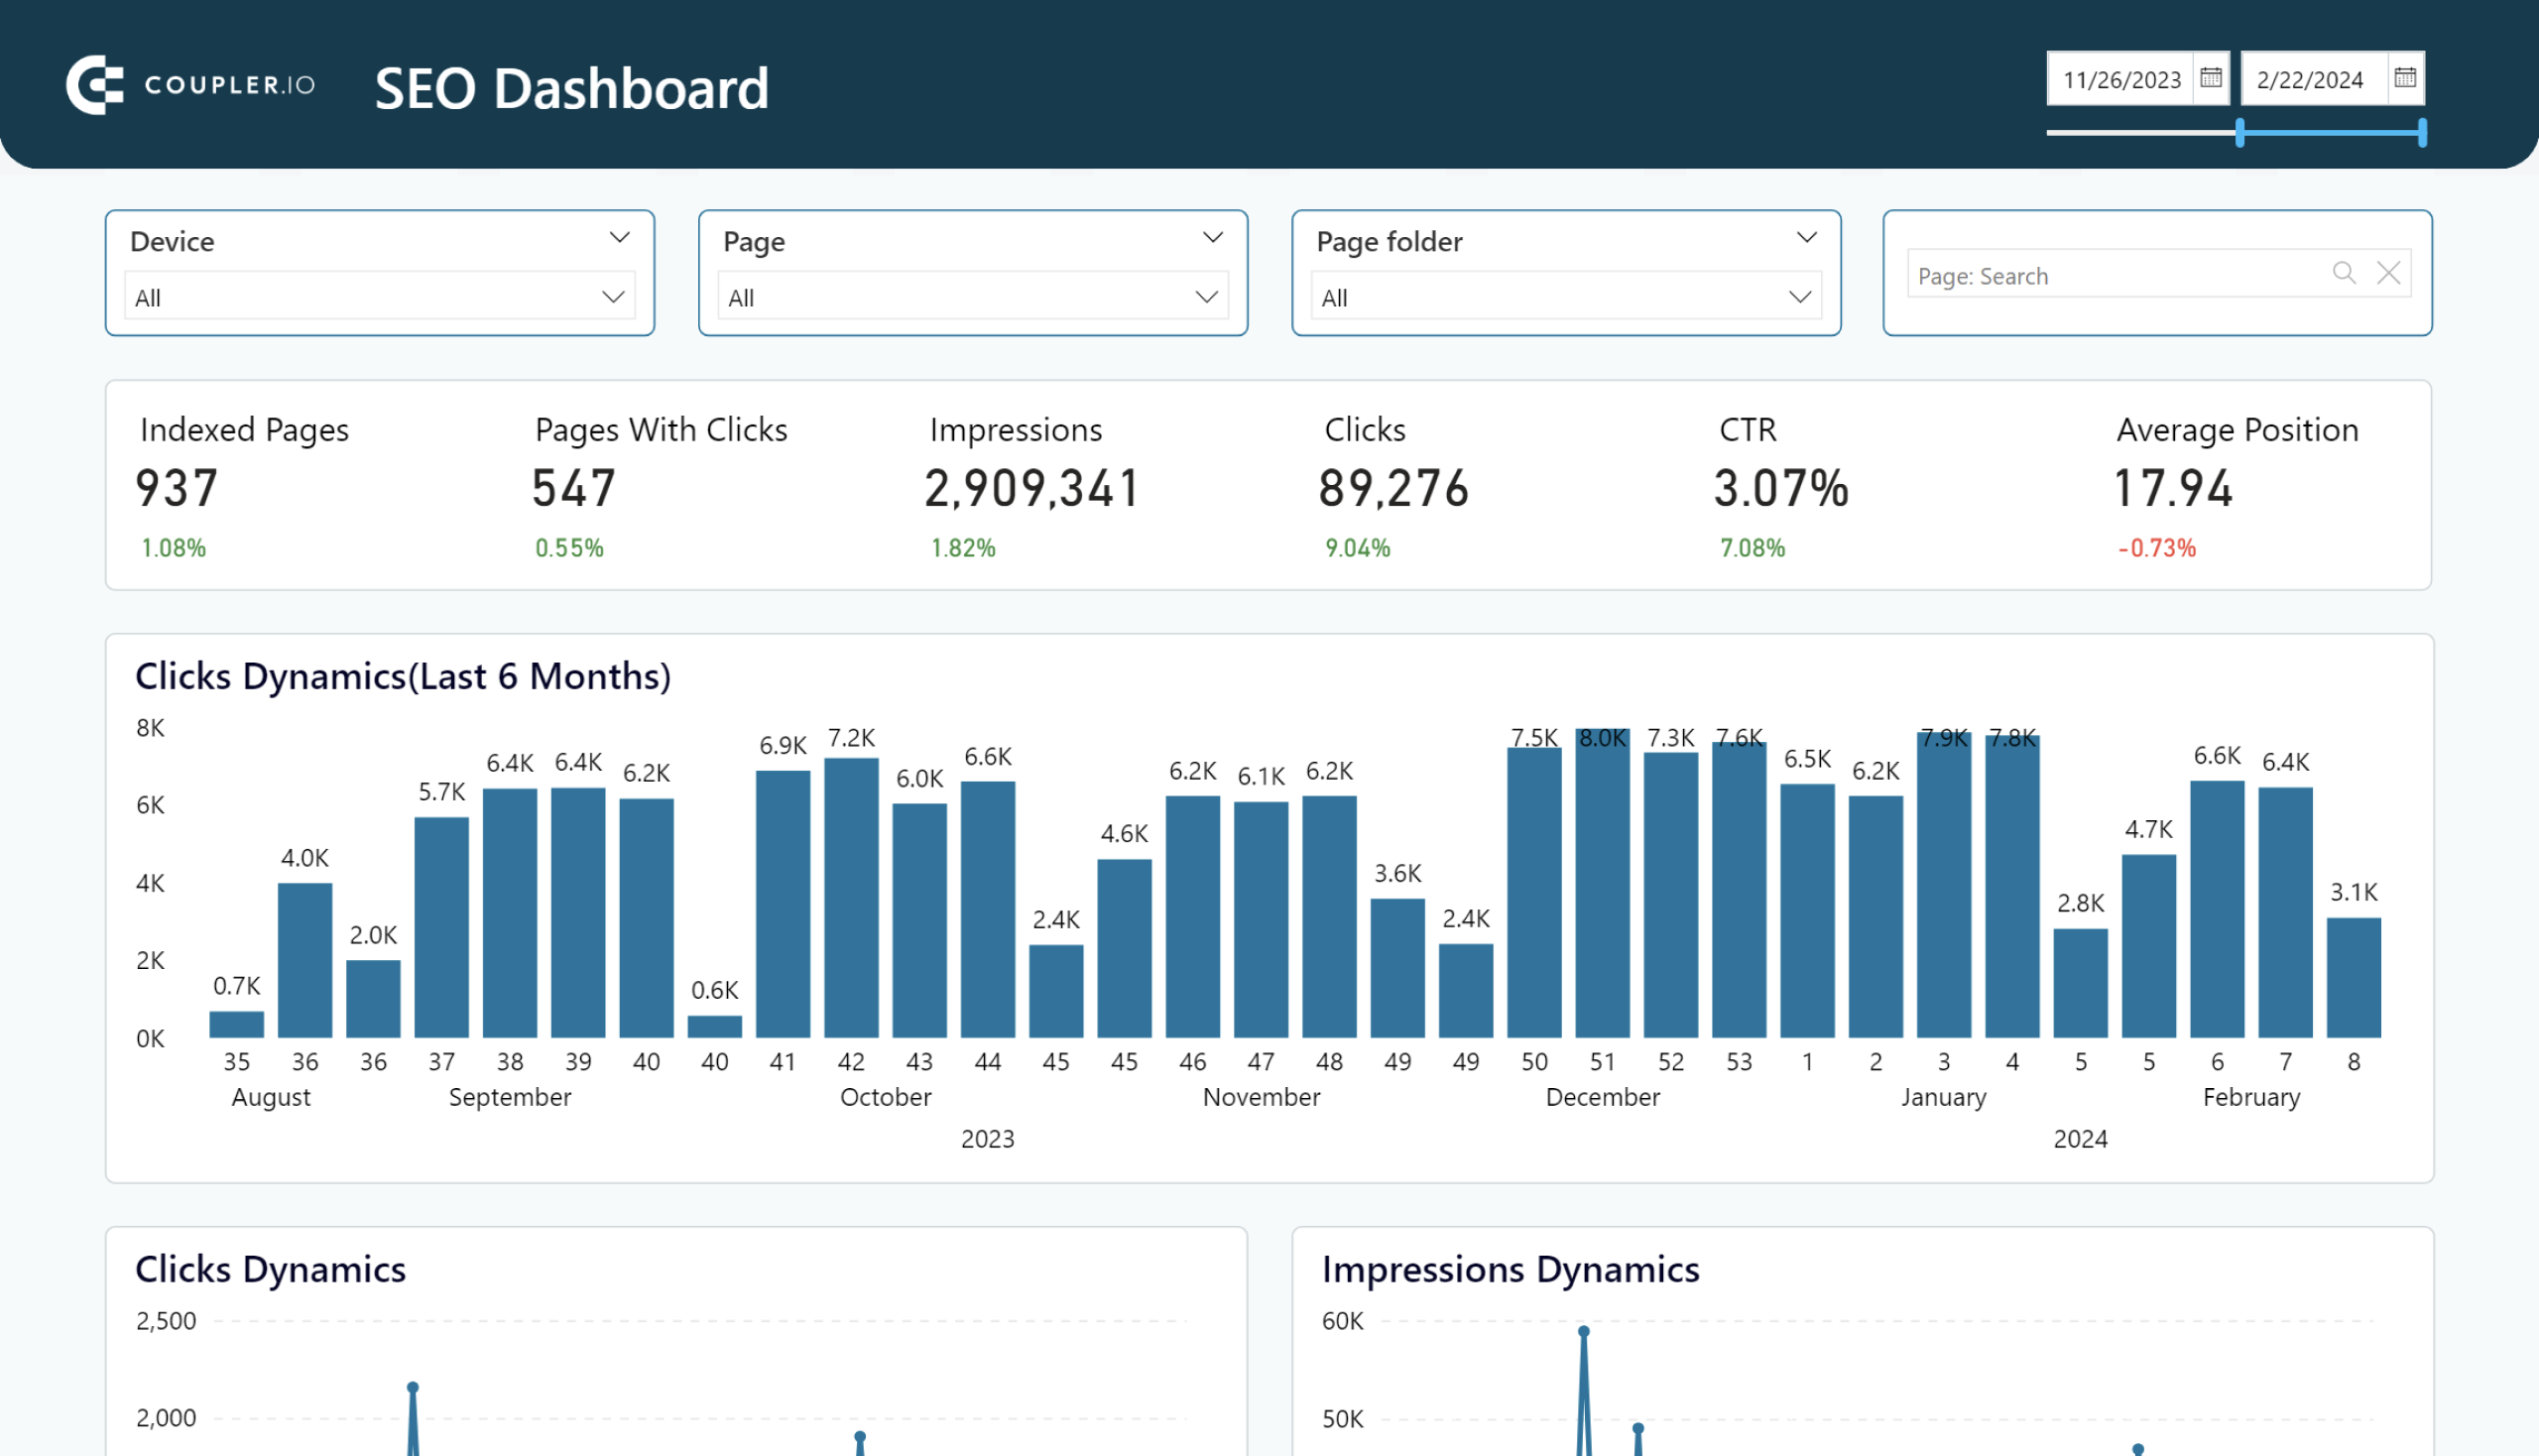
SEO dashboard for Google Search Console in Looker Studio
Optimize SEO with Looker Studio’s dashboard for Google Search Console. Track page rankings, CTRs, and organic traffic efficiently.

SEO dashboard for Google Search Console in Power BI
Get insights into your page’s SEO performance with our Power BI dashboard template integrated with Google Search Console.

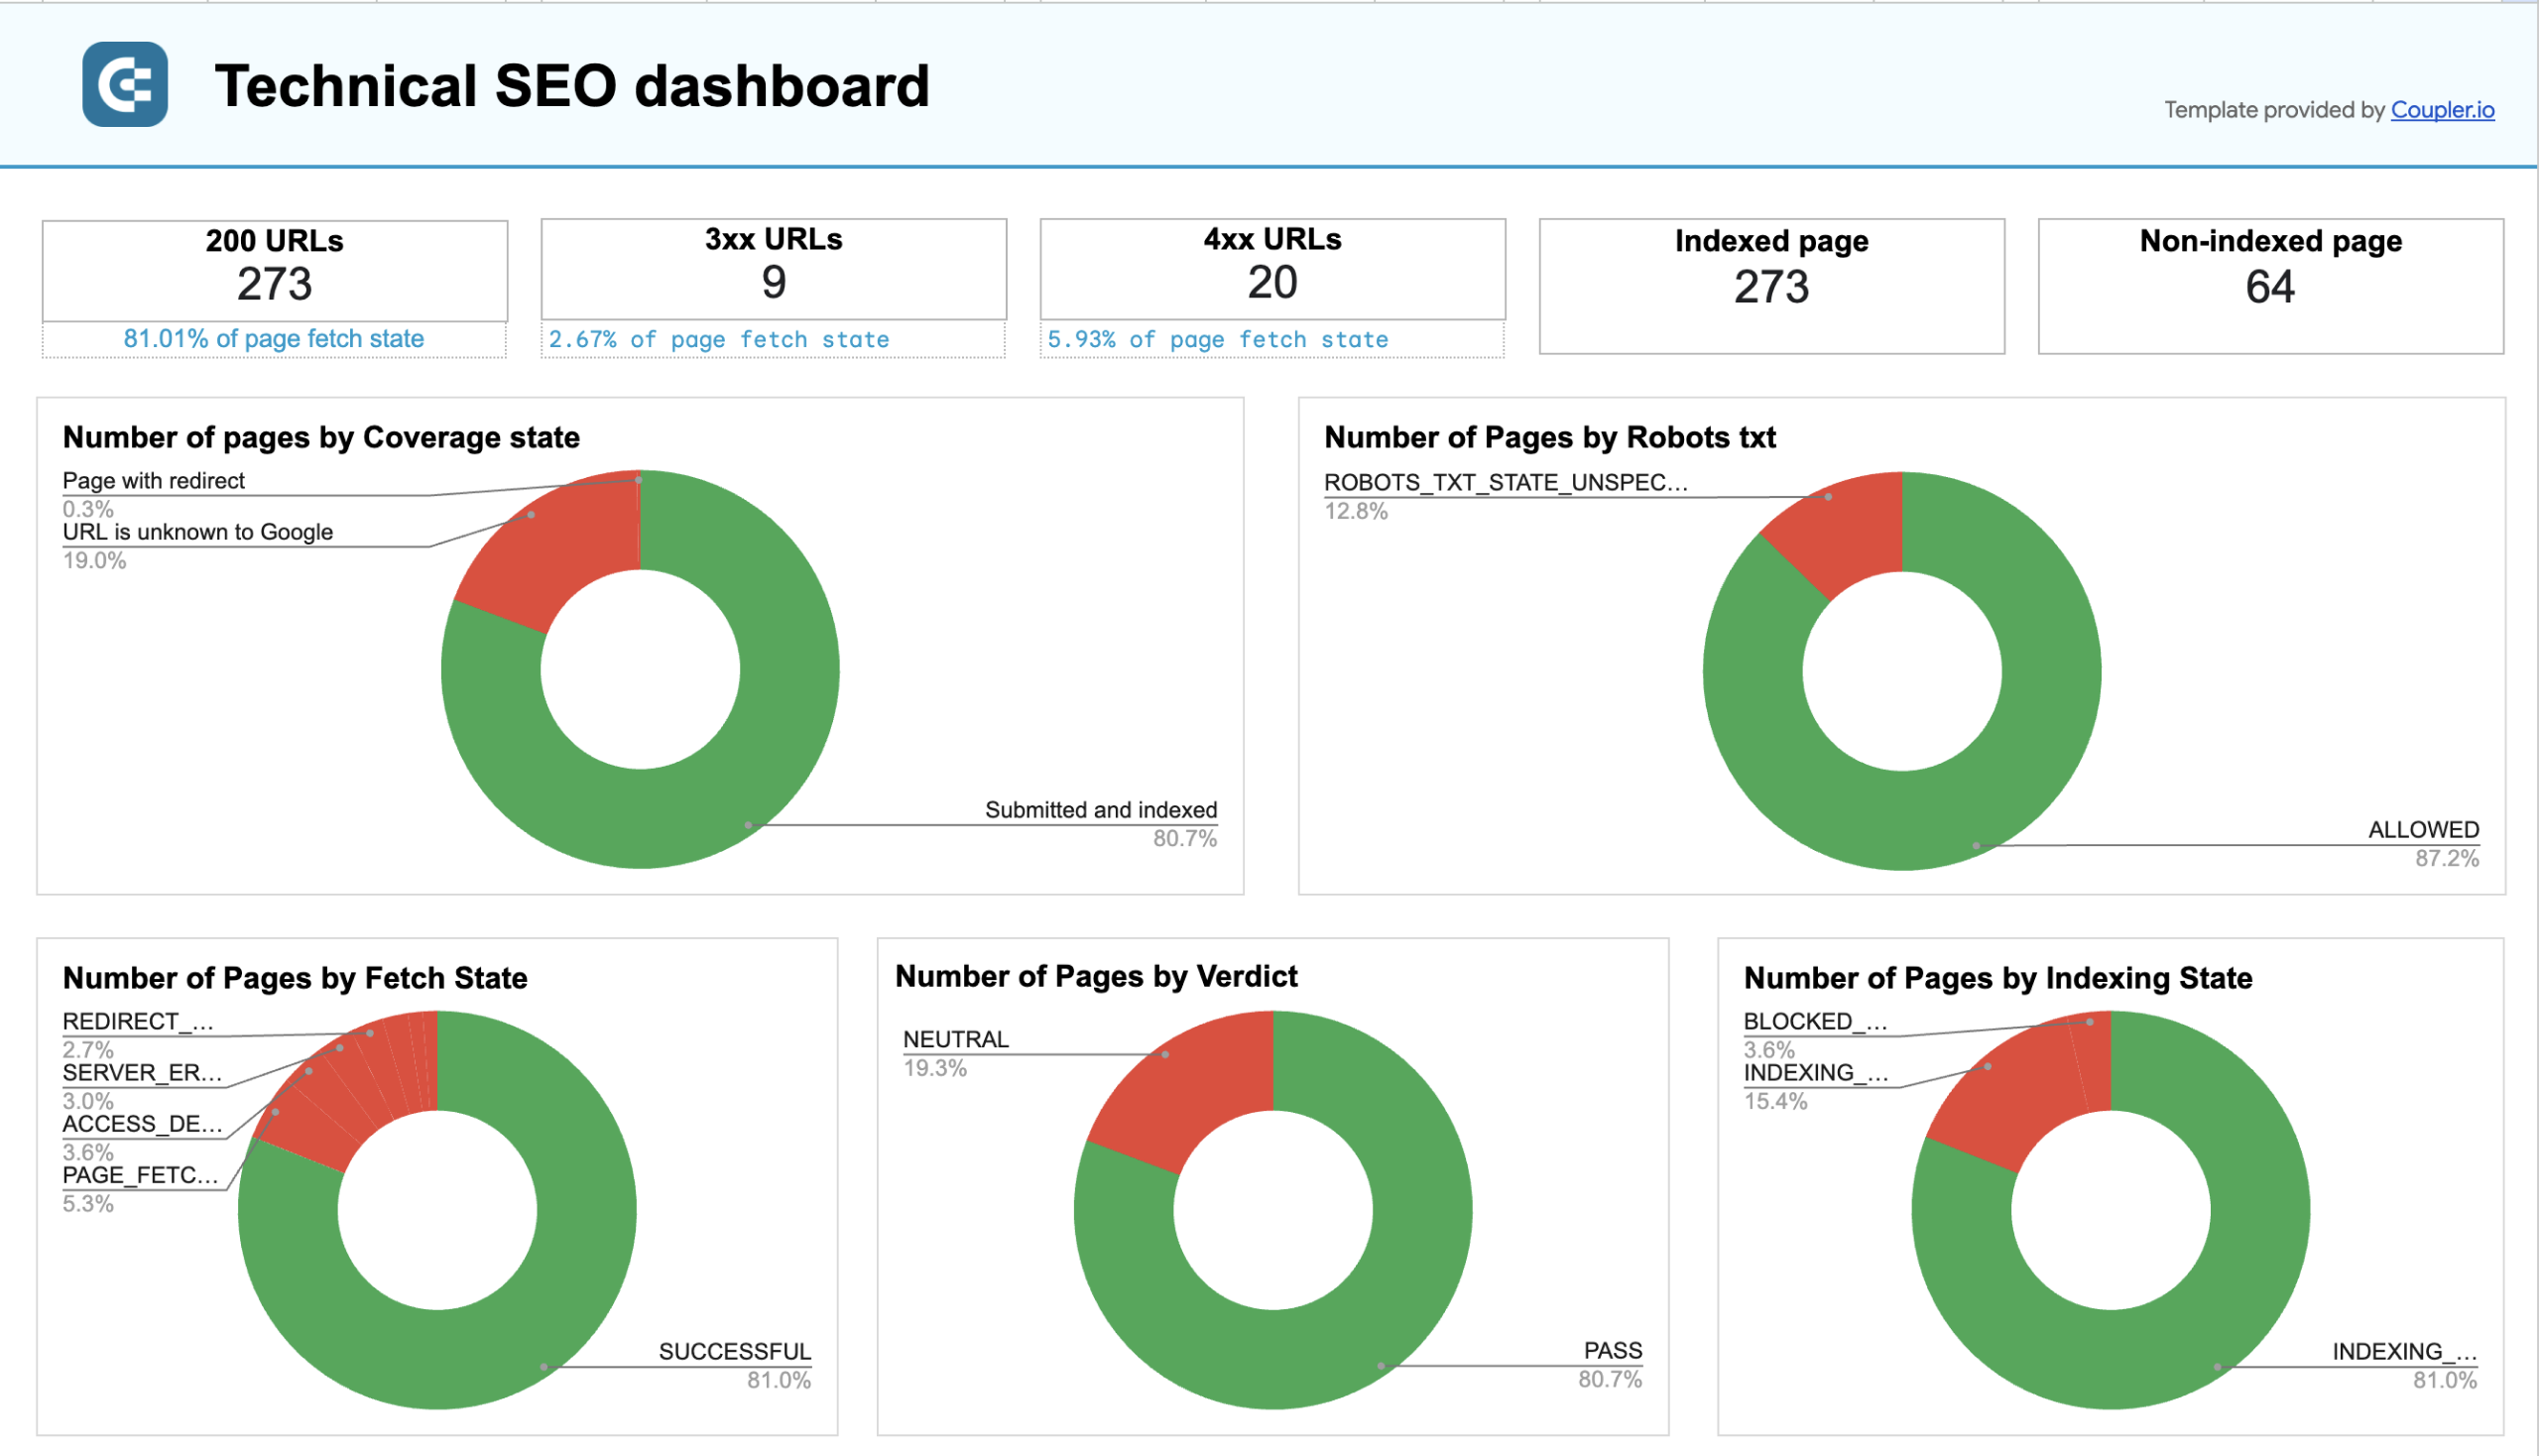
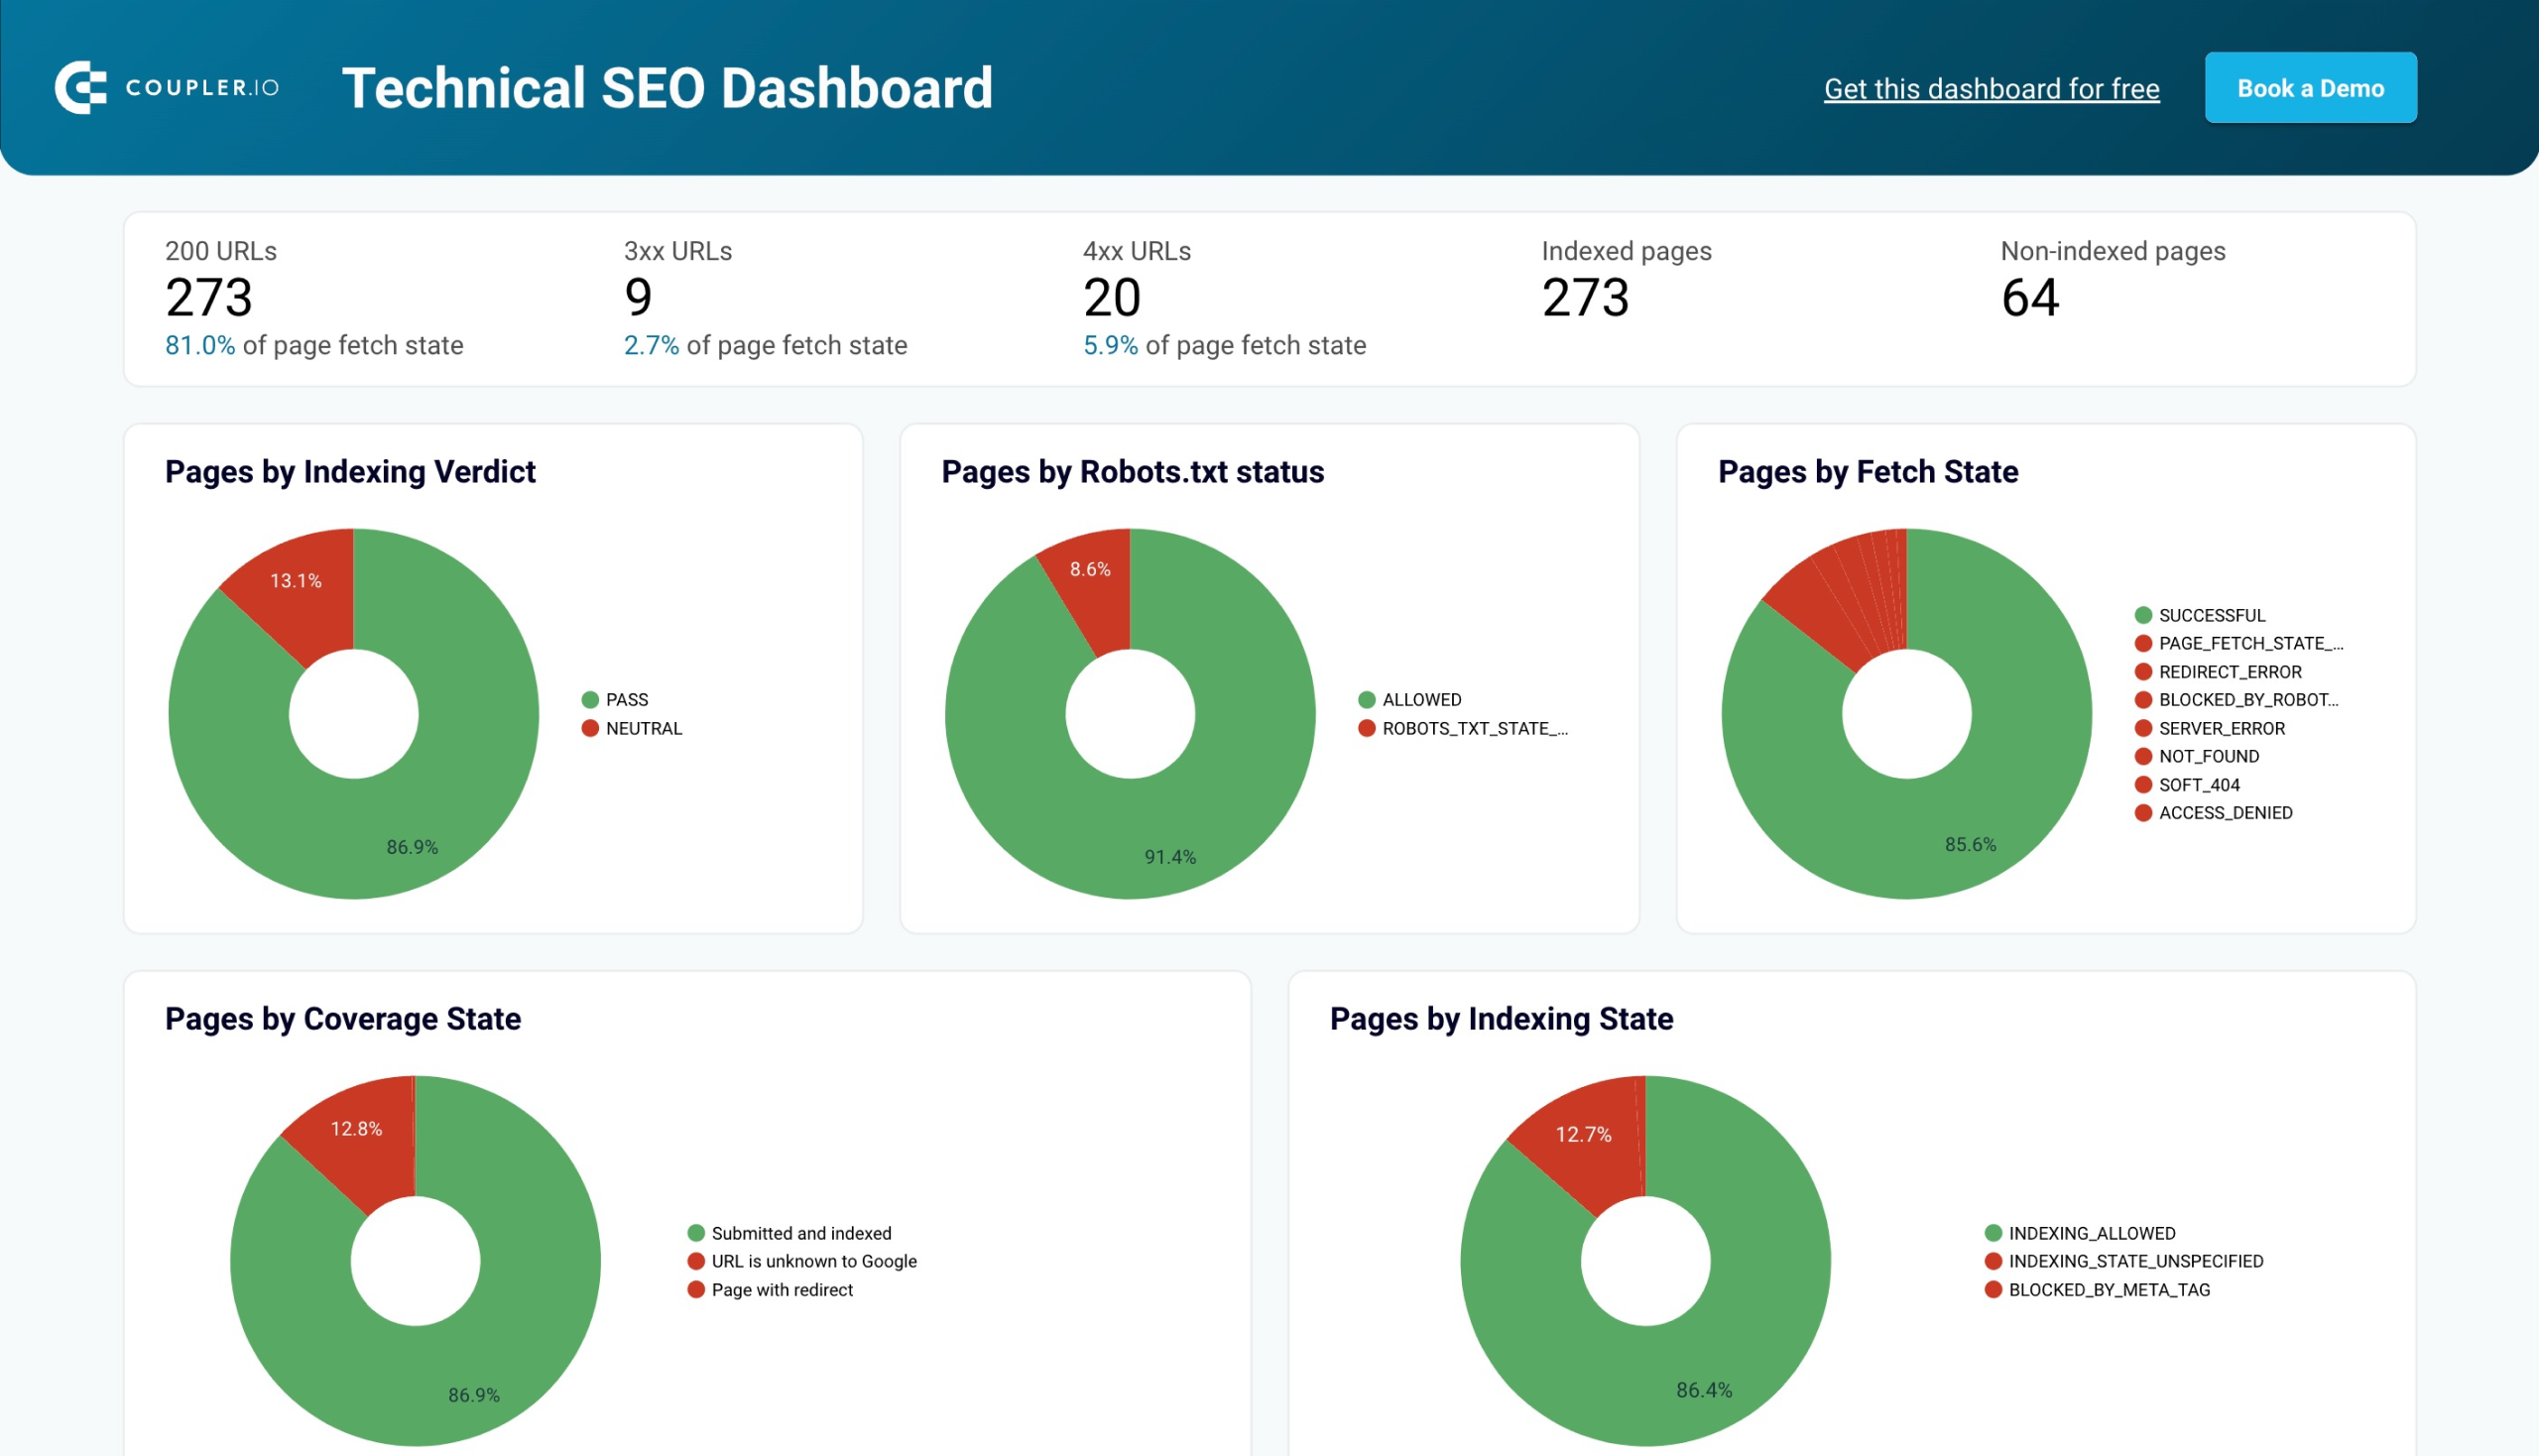
Technical SEO dashboard
This dashboard helps you track the technical side of your website’s SEO. It uses data from Google Search Console to show metrics like crawl stats, indexing, and page errors. Everything is laid out clearly, so you can spot issues quickly.
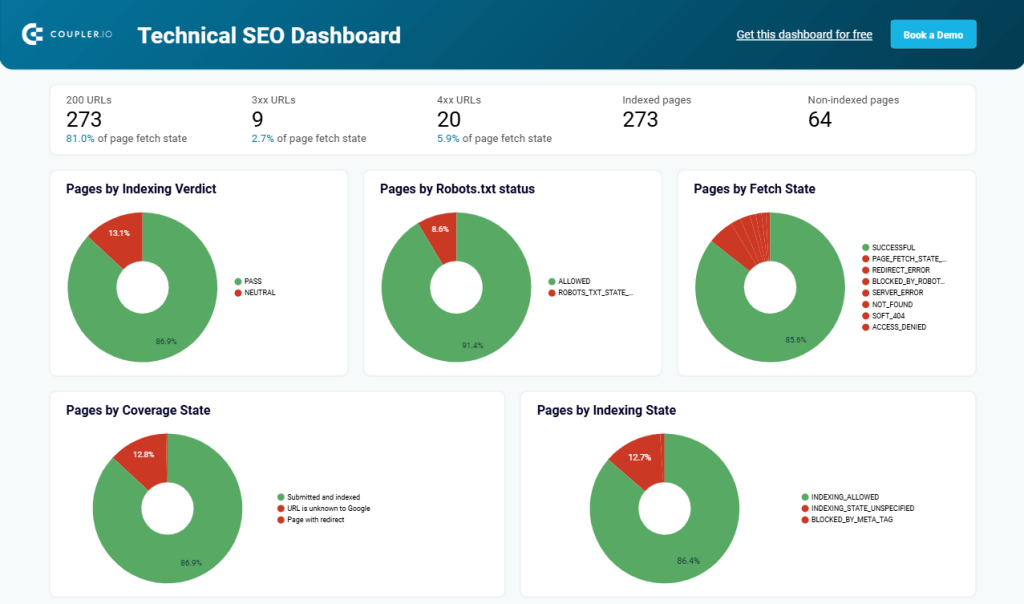
With the technical SEO dashboard, you can easily spot and resolve problems like pages blocked by meta tags or crawling errors that hinder search engines from accessing important content. It also provides insights into page fetch states and indexing coverage, allowing you to effectively address any gaps in your site’s visibility.
The technical SEO dashboard template is available in Google Sheets and Looker Studio.
Technical SEO dashboard
Technical SEO dashboard in Google Sheets
Get a useful spreadsheet dashboard that shows the technical SEO health of your website including indexing, canonicalization, and more.

Technical SEO dashboard in Looker Studio
Track the technical SEO health of your website to make sure it operates efficiently for Google to find, crawl, and index your website pages.
Top search query performance dashboard
The top search query performance dashboard provides a structured approach to analyzing how users discover your site through search. Unlike Google Search Console’s UI, which only allows filtering queries for one page at a time, this dashboard removes that limitation, giving you a complete view of all queries across all pages in one place.
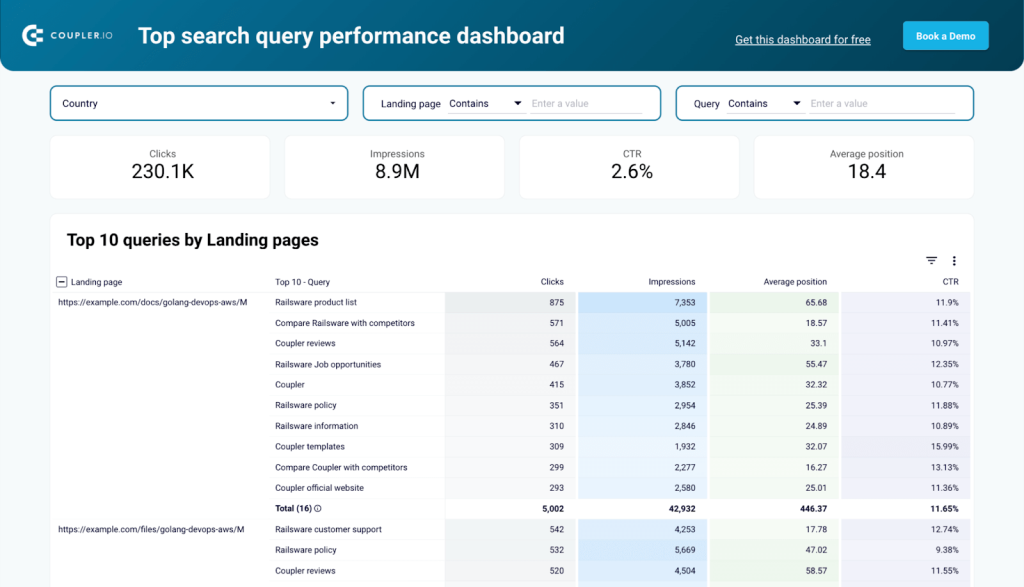
With this dashboard, you can identify whether your pages are attracting the right search intent. It also helps detect keyword cannibalization, where multiple pages compete for the same search queries, allowing you to refine content strategy and avoid self-competition. Filtering by country to assess international performance is also very easy, allowing you to optimize content for specific regions.
The top search query performance dashboard is available exclusively in Looker Studio. Once it’s connected, Coupler.io automates the syncing process, saving you time and ensuring you always have access to fresh insights.
Explore our selection of the best Looker Studio SEO report templates.
Landing page performance dashboard
This dashboard combines data from Google Search Console and Google Analytics 4. It reveals insights like top landing pages by clicks and key events. You can also identify which pages bring in the most purchases.
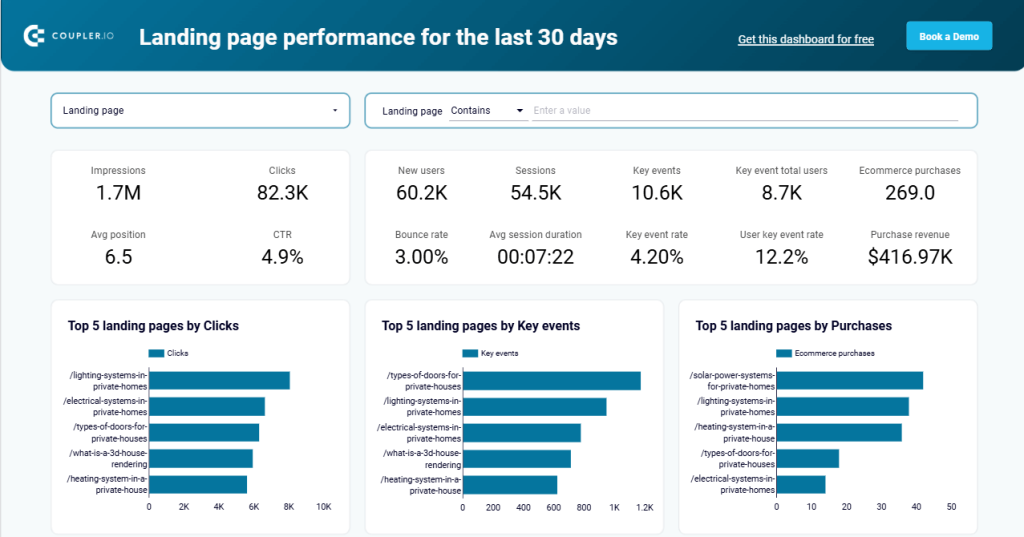
With this template, you can spot which pages drive the most traffic and conversions. Use it to optimize underperforming pages and boost your sales. For example, if a landing page gets a lot of clicks but few purchases, you can tweak the design or improve the call-to-action. The template is available in Google Sheets and Looker Studio.
Brand awareness dashboard
This template in Power BI combines data from Google Search Console, Google Ads, Facebook Ads, and Microsoft Ads. It visualizes how your advertising campaigns correlate with branded searches in Google to optimize your brand awareness.
Key metrics like ad impressions, clicks, spend, branded impressions, and branded clicks are all in one place. You can even track how the numbers change over time for each ad platform.
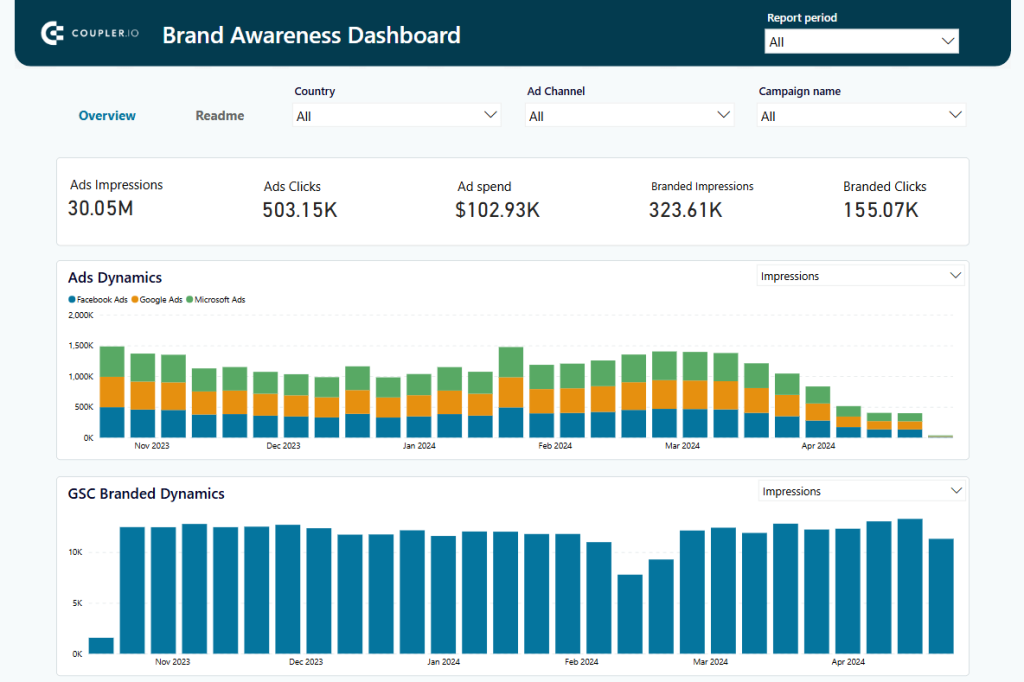
Use this dashboard to optimize your ad spend by focusing on campaigns that drive branded searches. For example, if one platform shows high branded impressions but low clicks, you can tweak the content or targeting. If your branded clicks increase over time, you’ll know your efforts are working.
Take advantage of the Google Search Console API for your SEO reporting
The Google Search Console API allows you to create fully customized integrations for your SEO reporting. You can pull data, analyze it, and build dashboards tailored to your exact needs. But let’s be honest—custom integrations take time, coding skills, and a lot of trial and error.
That’s where Coupler.io comes in. This tool allows you to easily connect Google Search Console data to your favorite reporting tools in just minutes. No coding is required. Even better, Coupler.io offers ready-to-use templates that make it simple to create SEO dashboards in BI tools like Looker Studio and Power BI.
Why spend hours coding when you can have a dashboard pulling real-time data right away? These templates not only save you time but help you focus on improving your SEO strategy, not building reports from scratch.
Automate SEO reporting with Coupler.io
Get started for free


