Google Search Console offers a quick way to get SEO insights. But what if you want to analyze the data further? Or want to build shareable custom reports? You can connect Google Search Console to Looker Studio to build custom reports using rich visualizations. This way, marketers and webmasters extend the SEO reporting and collaboration capabilities within the team. Let’s learn how you can do this without any hassle. Moreover, you’ll find a few free ready-to-use SEO dashboard templates for analyzing Google Search Console data.
Methods to connect Google Search Console to Looker Studio
Google Looker Studio has a native connector to get Search Console data. But that’s not the only way out there.
You can leverage Coupler.io to get more control over the integration. It is a reporting automation platform that offers some advanced features like data transformation to level up your reporting. Coupler.io also takes the pain out of manual report creation – you can use free dashboard templates to derive insights from your data quickly.
Another way to get data from Google Search Console to Looker Studio is through a manual data import. But that’s time and resource-consuming.
Connect Google Search Console to Looker Studio using Coupler.io
To get started, click Proceed in the form below where we’ve preselected Google Search Console as the source and Looker Studio as the destination.
You’ll be offered to create a Coupler.io account for free. After that, configure the importer settings as instructed below.
Step 1. Extract Data
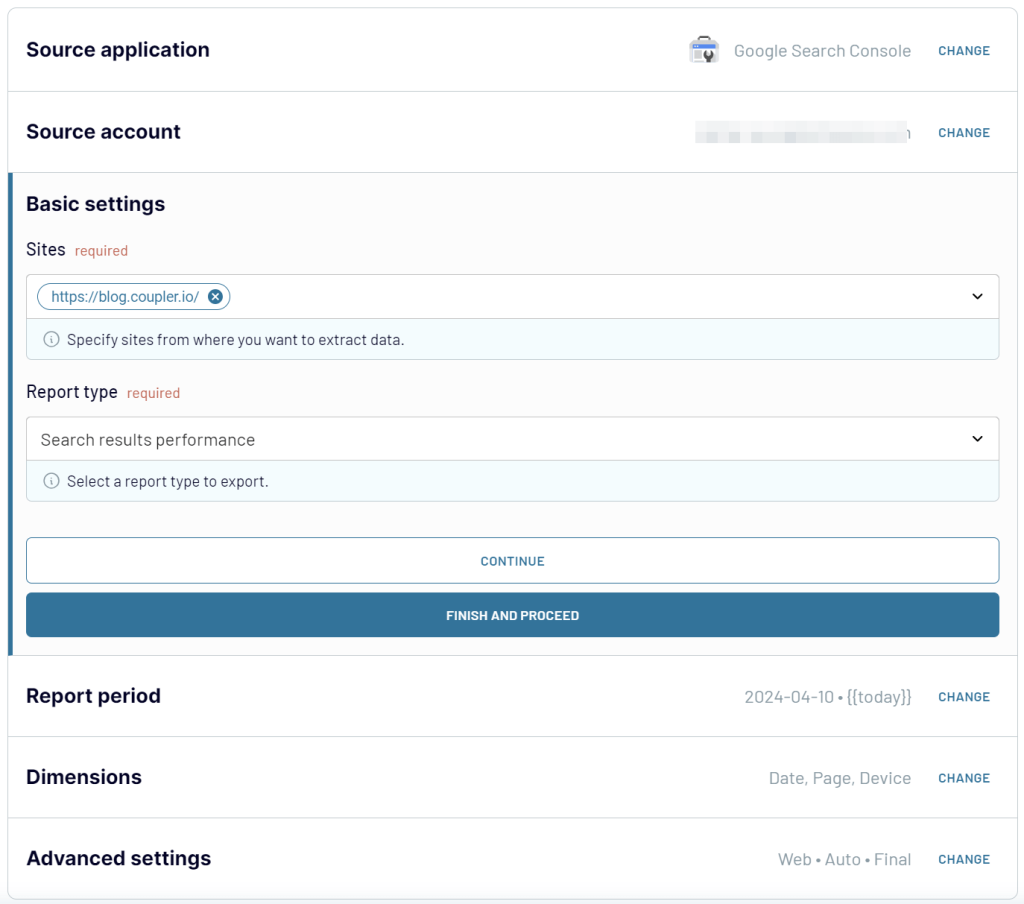
- Connect your Google Search Console account. Then select the site (property) you want to pull data from and the report type.
- Set the date range for the report period. You can use macros here like {{6monthsago}}, {{today}}, etc. Learn more here.
Optionally, you can also select the dimensions to import and configure advanced settings like search type, data aggregation type, and data state.
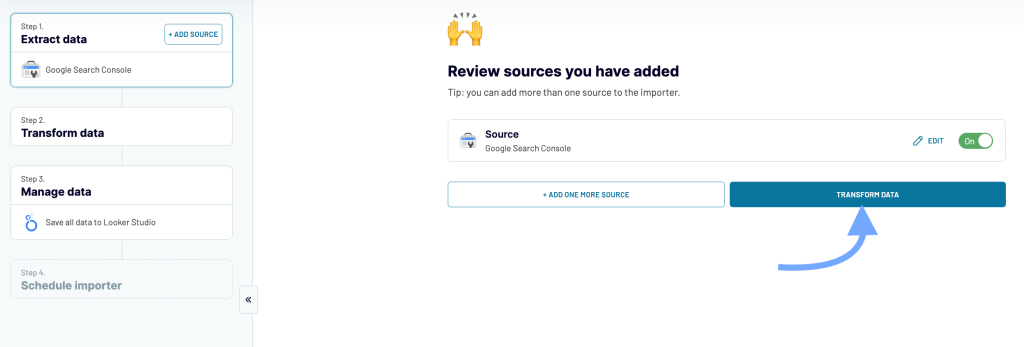
Now, a list of added data sources to the importer will appear. (Here, you can also add more data sources.)
Click the Transform data button to proceed with the next step.
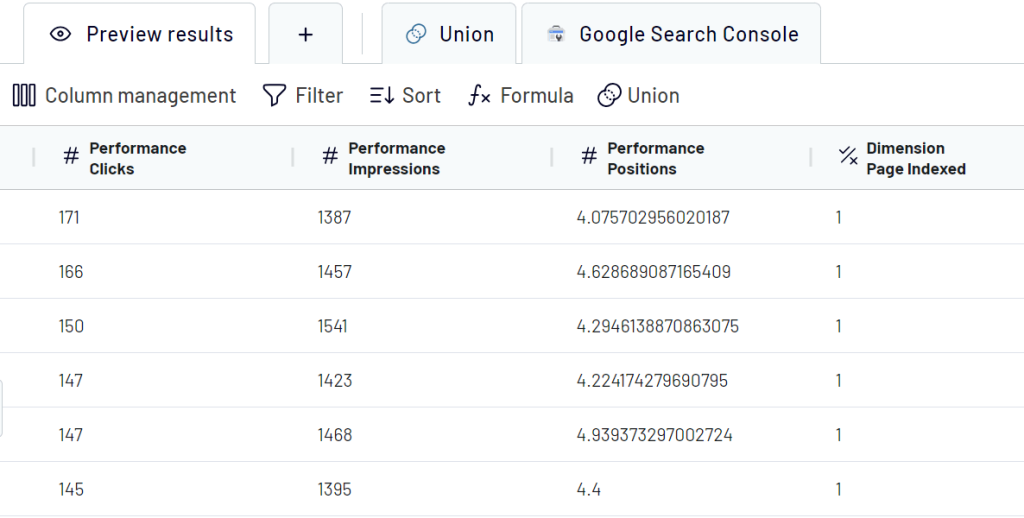
Step 2. Transform Data
Coupler.io will load and preview a few rows. Here, you can perform transformations on the data:
- Add new fields
- Filter or sort columns
- Hide unwanted columns from the data
- Blend data from multiple data sources
Step 3. Load data to Looker Studio and schedule refresh
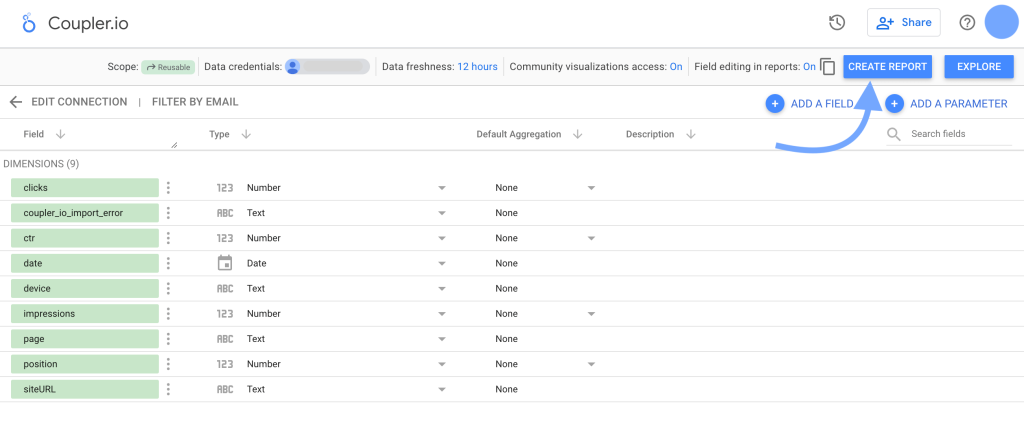
It’s time to transfer the data from the importer to Looker Studio and create a report. Follow the instructions shown on the screen to do that. You’ll need to click the Looker Studio button as shown below and authorize permissions to the Coupler.io connector.
Once you’re authorized, click Connect – this will create a data source in Looker Studio with your Google Search Console data. Click Create report to start using it right away.
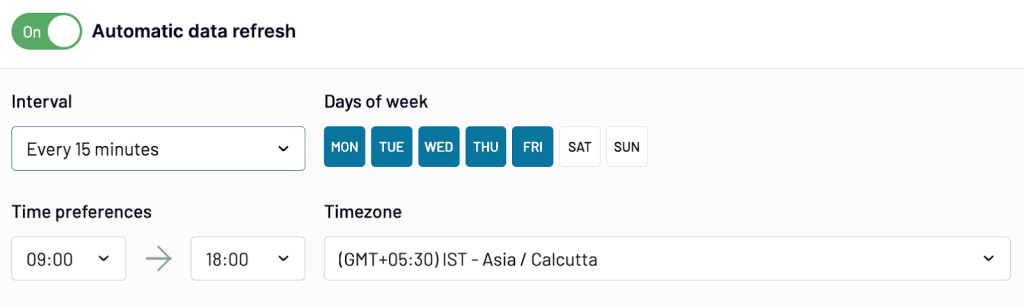
Come back to Coupler.io and toggle the Automatic data refresh option, configure the schedule, and run the importer.
That’s it! You can use this data to create visual reports from your Google Search Console data in Looker Studio. And Coupler.io will keep updating the data regularly to offer you fresh insights.
The platform can help you quickly get your Search Console data into Looker Studio. It also offers data automation features that update the data automatically at regular intervals so that you don’t have to do it manually. On top of that, it can be a good choice if you want to work on data before importing it into Looker Studio. You can use its data transformation feature to add, remove, sort, or filter columns.
Make your SEO data-driven with custom dashboard templates
Coupler.io has a lot to offer to marketers. You can start populating the blank report with custom visuals as your report needs. Or you can use our templates for SEO analytics to track your site’s data.
SEO dashboard template
The SEO dashboard provides different insights into your organic performance, like click dynamics, best and worst-performing URLs, the number of indexed pages, etc.
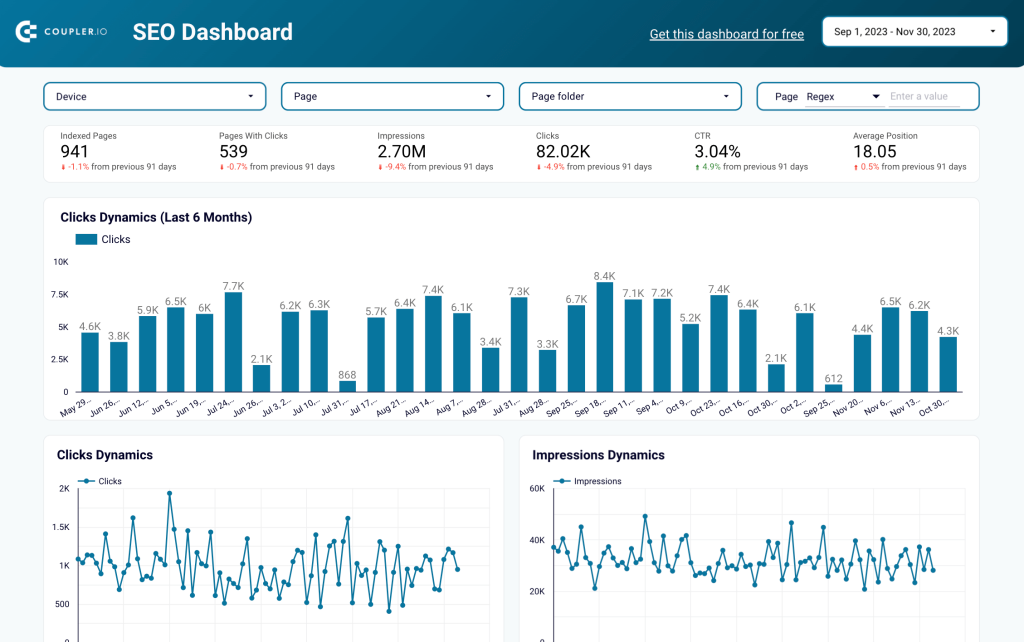
The Google Search Console dashboard is available as a template. It comes with an in-built connector that takes care of the integration with Google Search Console. To start using the dashboard, you only need to complete a few simple steps described on the Readme page. It will take up to 2 minutes to connect to your Google Search Console account and populate data from it to the dashboard.
Technical SEO dashboard
The technical SEO dashboard is designed to provide you with a clear picture of your website’s technical health.
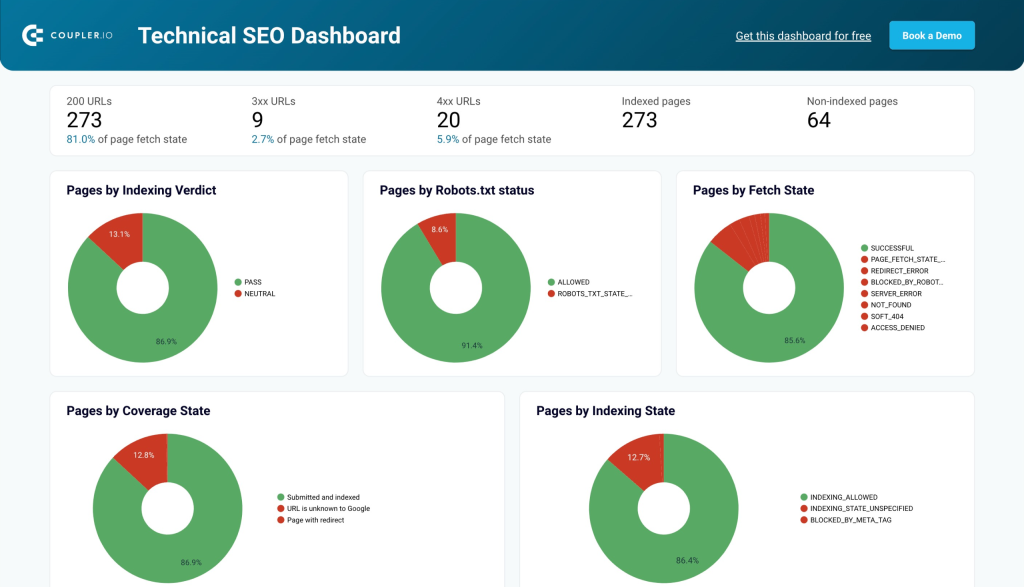
The SEO dashboard template pulls data directly from Google Search Console to display the state of your web pages by indexing, coverage, and so on. This allows you to identify areas for improvement and prioritize technical SEO tasks that directly impact search engine rankings and user experience.
Top search query performance dashboard
This dashboard for Google Search Console gives a structured view of search queries (keywords) driving traffic to your website. It organizes pages by clicks and displays up to 10 queries per page, providing deeper insights than Google Search Console’s default reports.
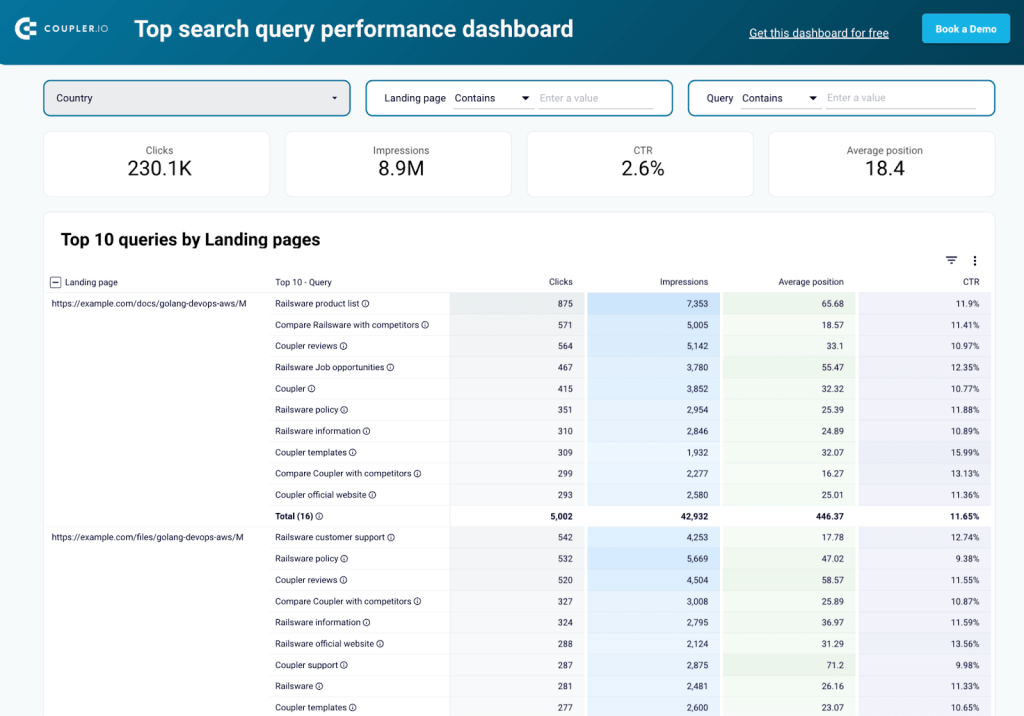
This dashboard helps you monitor search performance by tracking clicks, impressions, CTR, and ranking positions. It checks if queries align with page intent, spots keyword cannibalization, and allows filtering by country, landing page, or search query. It also highlights high-impression queries with low CTR, so that you can adjust meta titles and descriptions to increase clicks.
The template is built in Looker Studio. Simply connect your Google Search Console data using the instructions in the Readme tab and start analyzing search query trends easily.
Bonus content: What analytics tasks can you do connecting Google Search Console to Looker Studio?
You learned how to connect Google Search Console to Looker Studio. And now it’s time to get some insights from your data. (Of course, you won’t settle for the blank report.)
Here are some helpful ways to analyze Google Search Console data in Looker Studio:
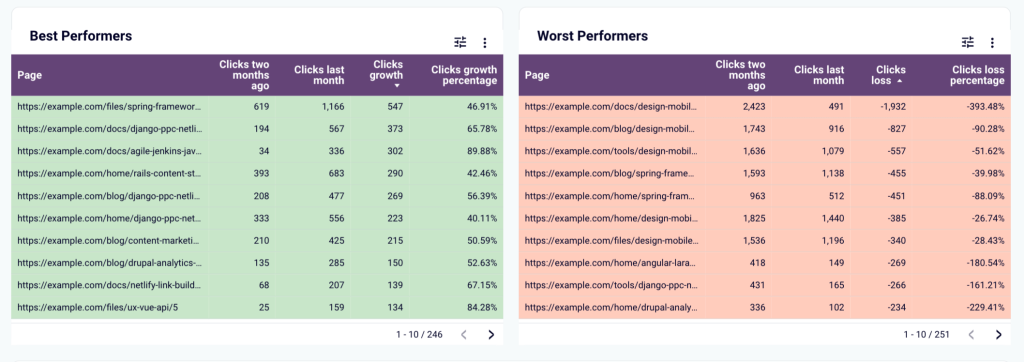
1. Find the best & worst-performing pages
Extracting information about the top and worst-performing pages in Google Search Console can be time-consuming.
But our free SEO dashboard template offers such insights straight into the Looker Studio report. You can use it to quickly get the top and worst-performing pages on your website.
Here’s what it looks like:
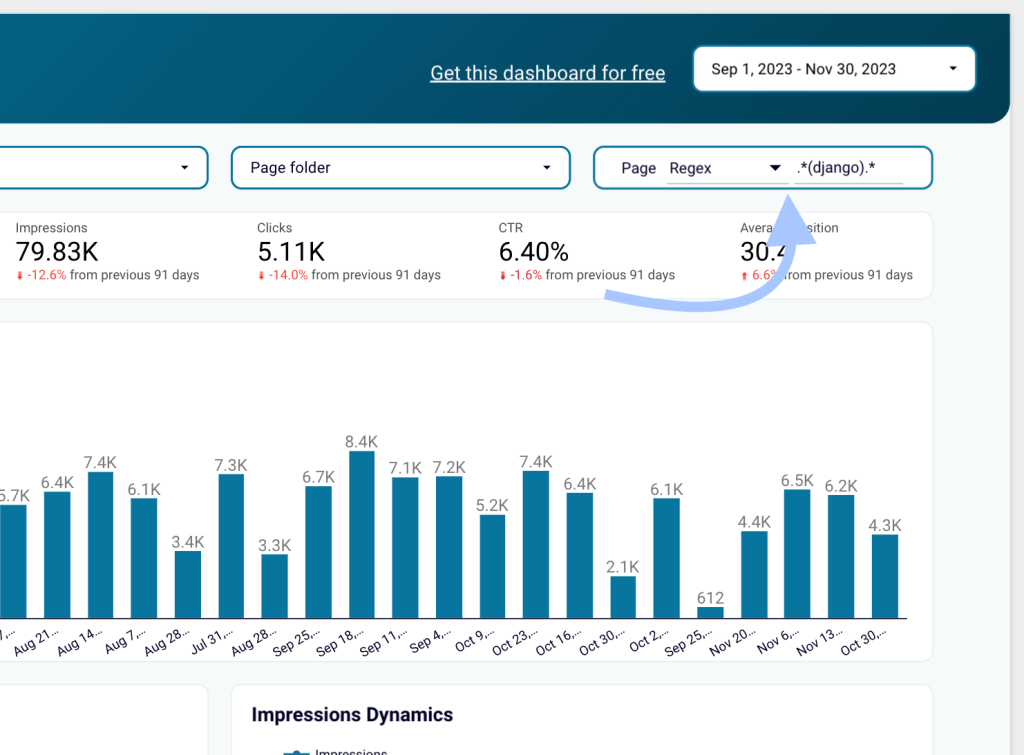
2. Filter branded traffic
Tracking branded traffic is an excellent way to measure your branding efforts. However, you may want to exclude the branded traffic while analyzing SEO reports. You can use custom regex in the SEO analytics dashboard in Looker Studio to do that.
For example, entering *.(brand term).* in the page regex filters the entire report to show data for branded pages. Similarly, you can try other regular expressions to get deeper insights.
3. Build a unified marketing dashboard
In addition to Search Console, you can connect other apps and services in your marketing suite to Looker Studio and bring all data together. You can build a unified dashboard that tracks all the KPIs related to your business. You can also create a similar dashboard connecting Google Search Console to Power BI.
Coupler.io allows you to bring all your marketing data together into Looker Studio and build a dashboard that updates in real time.
Connect Google Search Console to Looker Studio using the native connector
Google Looker Studio offers a native connector that you can use to get access and create reports from your Google Search Console data.
However, it’s not suitable for seamless integration. Why? Because you’ll need to rely on Looker Studio for any data transformation needs, which can negatively impact the reporting performance.
Further, the native connector caps the data refresh interval to 12 hours. This means the Looker Studio report will update data only twice a day.
On balance, Coupler.io allows you to refresh the data as rapidly as every 15 minutes. It also allows you to perform transformations in the data before loading it into Looker Studio without compromising the performance.
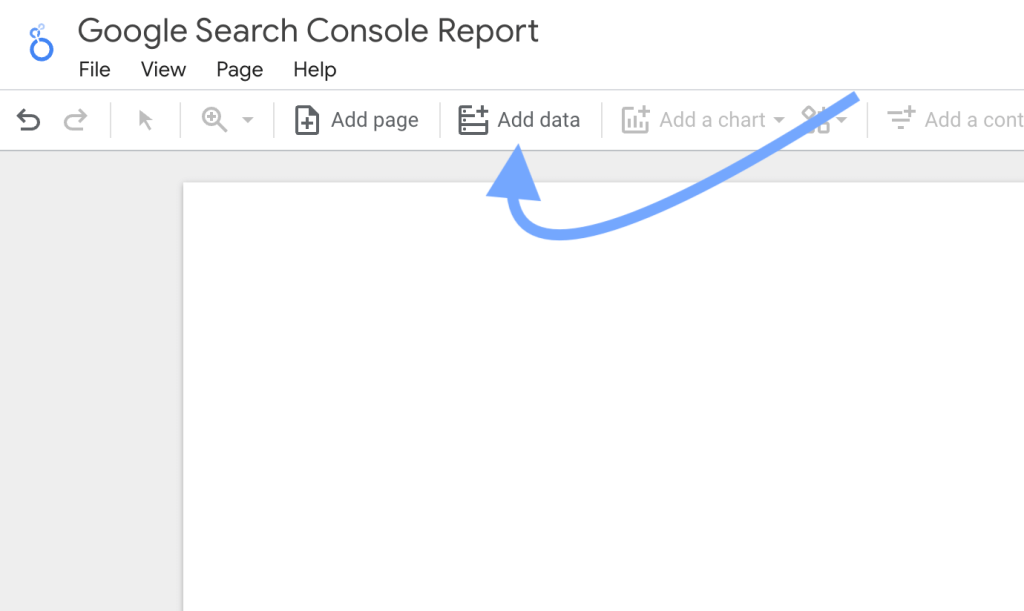
However, to give you a basic idea of how the Google Search Console to Looker Studio connection works using the native connector, here are the steps:
In a Google Looker Studio report, click Add data in the top menu bar.
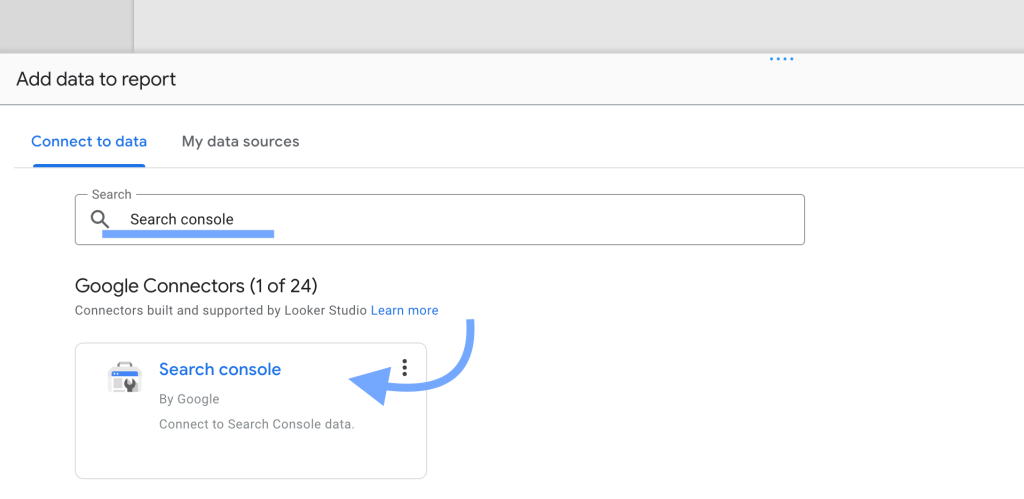
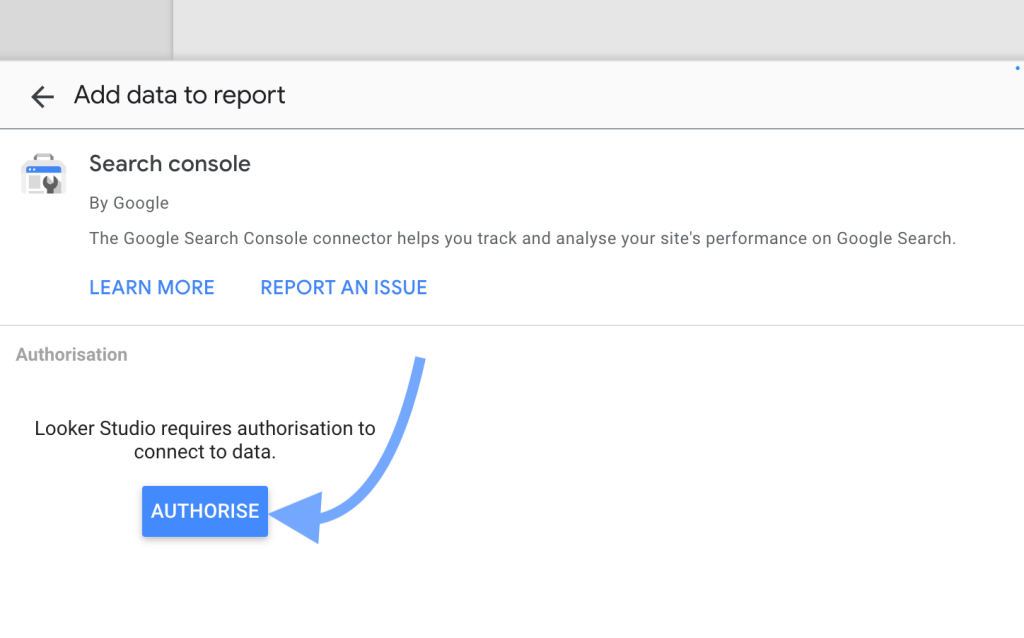
In the connectors section, search and open the Search Console connector.
Next, click Authorize and allow the required access.
Once authorized, the list of Search Console properties in your account will be displayed. Select the appropriate property, its table and search type to add to the report.
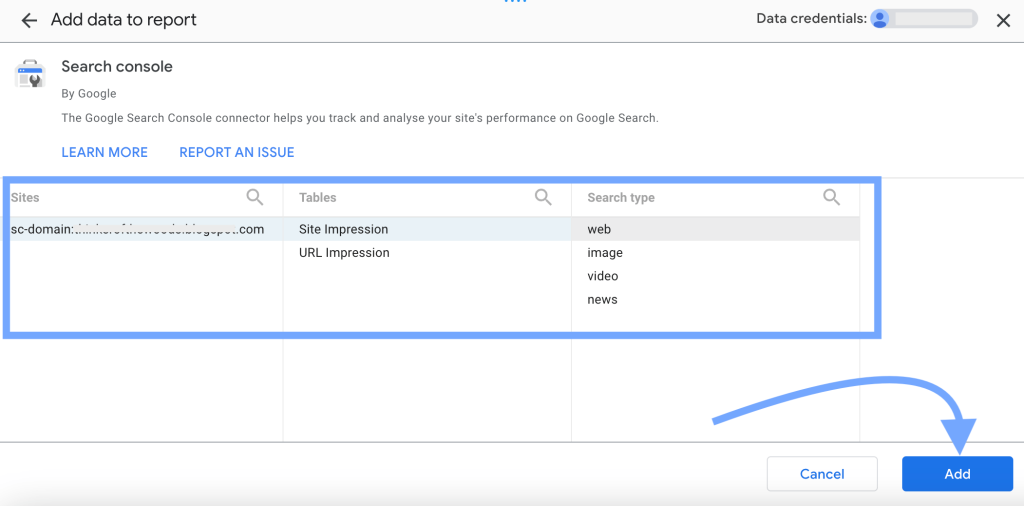
Finally, confirm adding the data to the report by clicking the “Add to report” button in the popup.
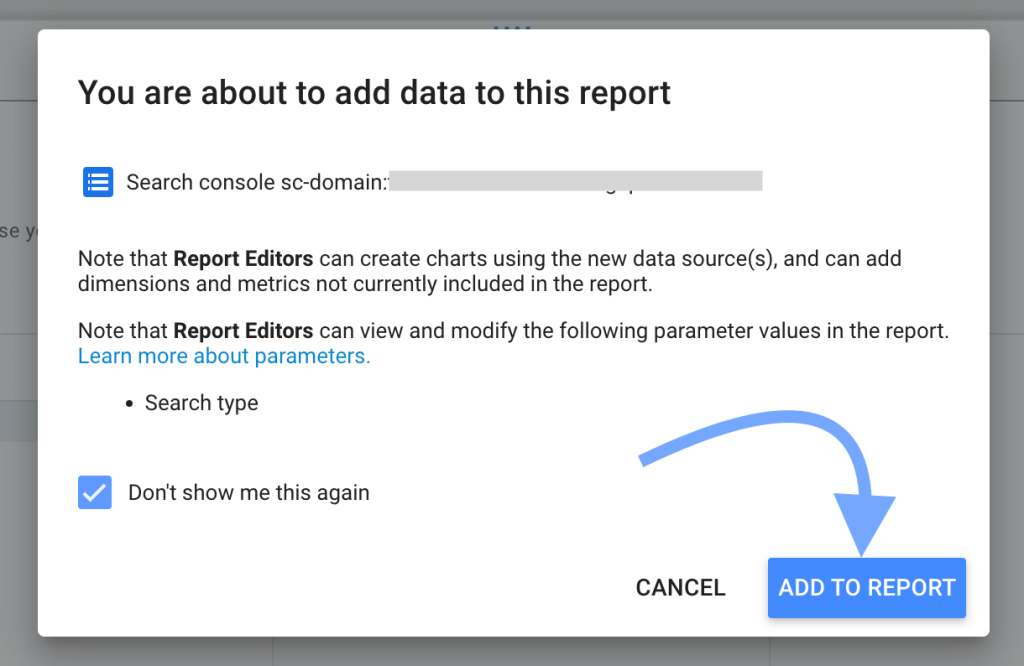
And that’s it! The Google Search Console data will appear in one of the data sources in Looker Studio.
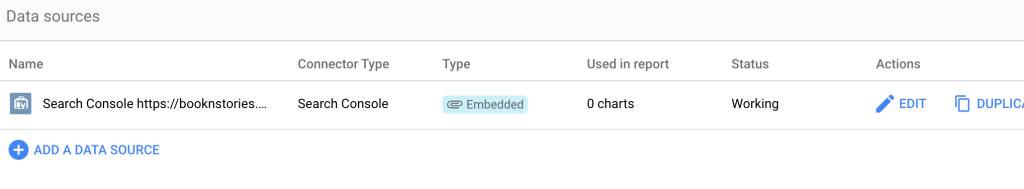
You can use it to create rich reports using different visualizations.
This was pretty straightforward. But the flaw is – this method does not allow you to transform or automate data. And you’ll need to deal with the raw data from Google Search Console.
Which method for loading data from Google Search Console to Looker Studio is for you?
The native Looker Studio connector to GSC works well. However, you’ll have to spend a lot of time making raw data from Google Search Console analysis ready. With the Coupler.io connector, the data is already prepared for analytics.
Another benefit of using the partner Google Search Console connector by Coupler.io is that it supports over 50 other sources. You will need some of them for closed-loop analytics, for example, GA4, Google Ads, Facebook Ads, LinkedIn Ads, etc.
So, if you have plenty of time to only work with raw GSC data, the native connector is your choice. However, if you’re an experienced SEO expert or marketer, it’s worth giving a try to Coupler.io since it will save you hours of work.