Time matters. And tracking it well? That can change everything.
Harvest, which is used by over 73,000 businesses, excels in managing hours, budgets, and invoices. However, raw data alone does not provide the insights needed to optimize performance. By using Microsoft Power BI, you can transform this data into actionable dashboards. This enables businesses to highlight patterns and trends, identify what’s working, and address inefficiencies.
This guide presents various methods to connect Harvest to Power BI, helping you select the most effective option for your needs.
Comparing ways to load data from Harvest to Power BI
Microsoft Power BI doesn’t support Harvest as a native data source. So, here’s a side-by-side comparison of the best methods to get your Harvest data into Power BI:
| Method | Description | Ease of Use | Automation | Customization |
|---|---|---|---|---|
| Coupler.io | A reporting automation and analytics platform to turn data into insightful reports. It automates data transfer to Power BI on a set schedule. | Very Easy | Scheduled refresh | High: – Data transformation – Data aggregation – Support for 60+ app sources and 10+ destinations – Pre-built dashboard templates |
| Manual CSV Export & Power BI Import | Export data from Harvest manually as a CSV file and then import it into Power BI. | Easy | None (manual updates required) | Moderate: – Allows custom data selection during export but requires manual data pipeline management and organization in Power BI. |
| Custom API Integration | Use Harvest’s API to build a custom connection for directly importing data into Power BI. | Complex | Triggered or scheduled | High: -Fully customizable to business needs |
Connect Harvest to Power BI using Coupler.io
If you’re a business looking to automate the process of integrating Harvest data into Power BI, Coupler.io offers the easiest solution. It lets you connect the apps in three simple steps:
Step 1: Collect data
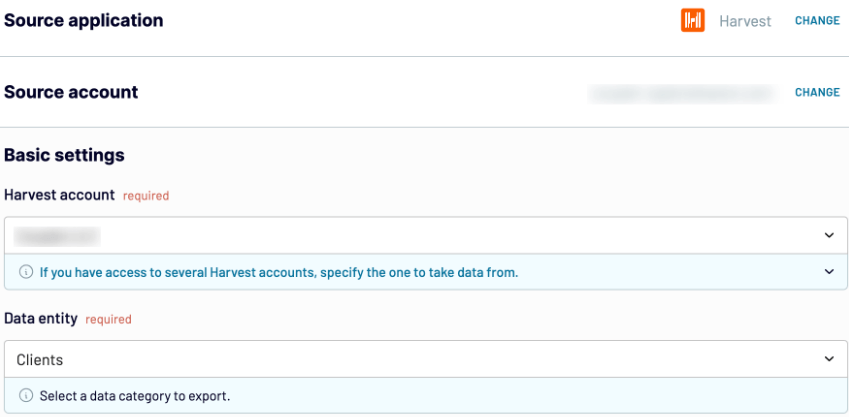
Click Proceed in the form below with preselected apps: Harvest as a source and Microsoft Power BI as a destination. You’ll be offered to get started for free with no credit card required.

Start by logging into Coupler.io and authorizing your Harvest account. Choose the Harvest account you want to pull data from and select the type of data entity you need, such as time entries, invoices, or projects. With over 20 options available, you can pick what’s most relevant for your analysis. Once you’ve made your selections, move to the next step.

Step 2: Organize and transform data
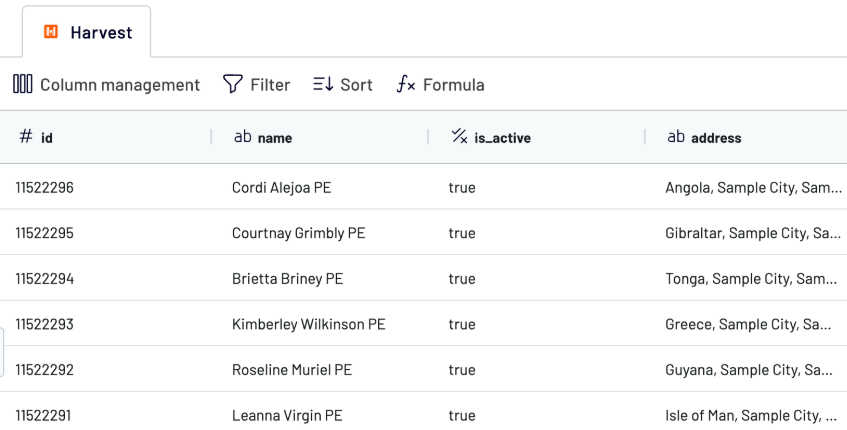
Before loading your data from Harvest to Power BI, you can preview it and make any adjustments needed for analysis. Use Coupler.io’s transformation options to filter or sort your data, rearrange columns, or even create new ones with custom formulas. If you’re working with multiple accounts or apps, you can also merge data into a single cohesive dataset. Once your data is clean and ready, you’re all set to load it into Power BI.

Step 3: Load data and schedule refresh
Generate a connection URL in Coupler.io under the destination settings.

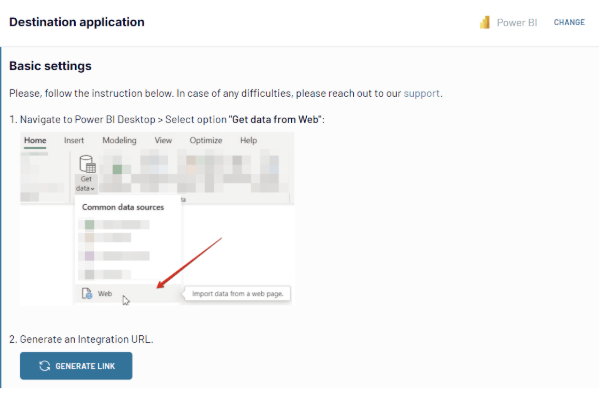
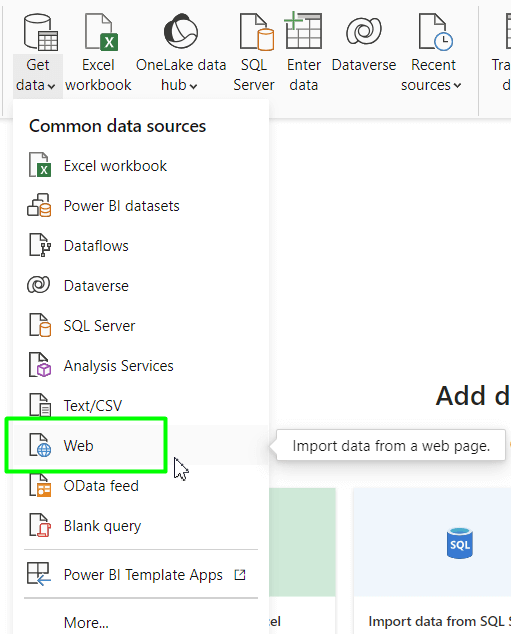
Open Power BI and go to Get Data > Web.

Then insert the copied integration URL in the respective window:

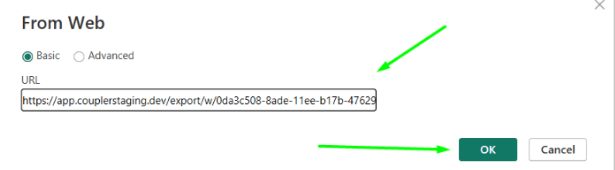
Your data will be loaded to Power Query where you can make additional transformations. After that, load it to Power BI to create reports or dashboards.
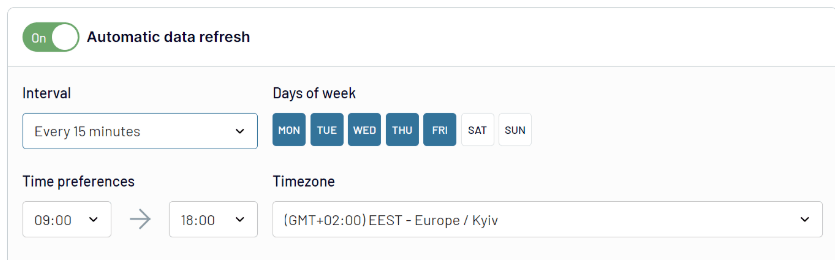
To ensure your reports are always up-to-date, set up Coupler.io’s Power BI connector to refresh your data at your preferred intervals—daily, weekly, or even every 15 minutes. This automation ensures that your Power BI dashboards always display the latest Harvest data without requiring any manual effort.

Export data from Harvest to Power BI manually
If you prefer not to use third-party tools, you can manually export Harvest data and load it into Power BI.
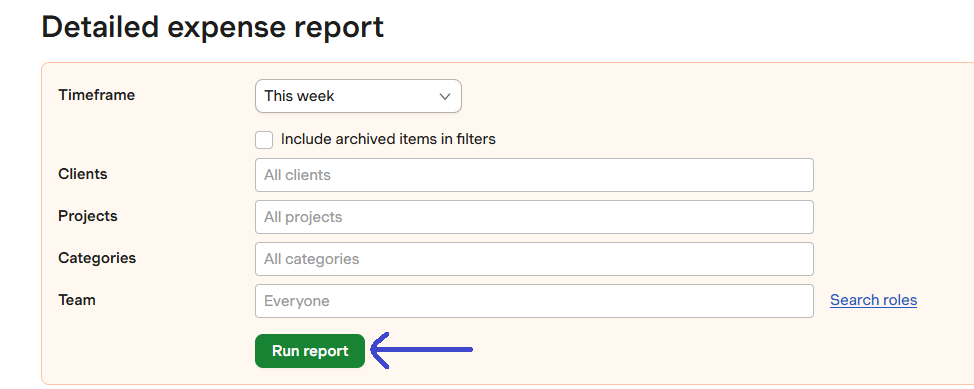
Log in to your Harvest account and go to the Reports section. Here you can check out the time that has been logged, and run Detailed time and Detailed expense reports by selecting the relevant timeframe, clients, projects, categories, and team or role.

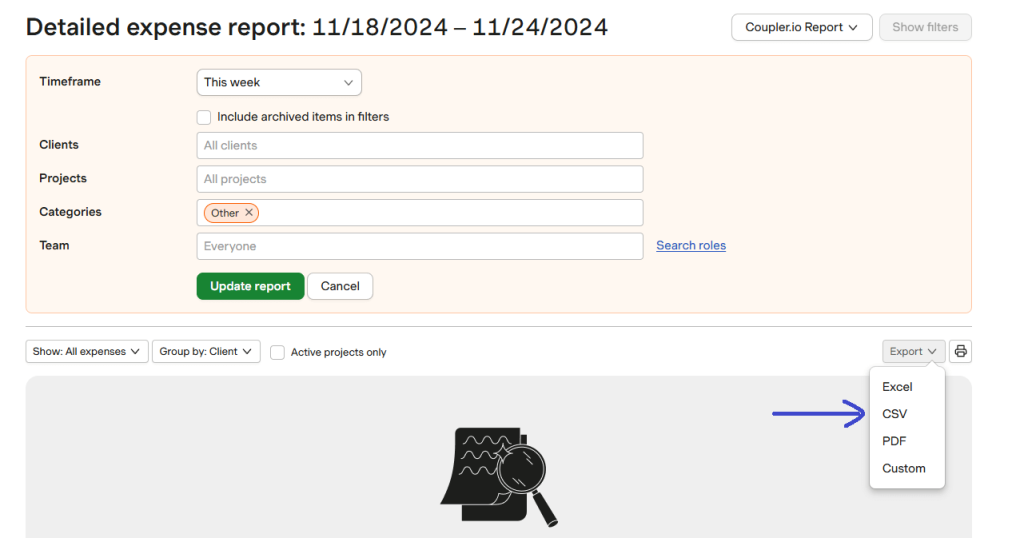
Once you run the report, it will move to the Saved reports section. Now, you can update this report or export it in CSV format.

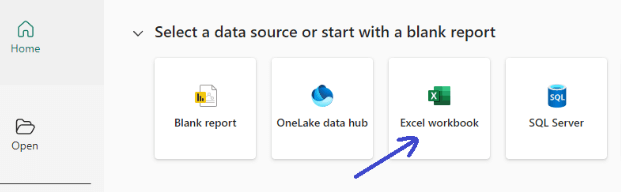
Open Power BI desktop, and select Excel workbook to import your CSV file.

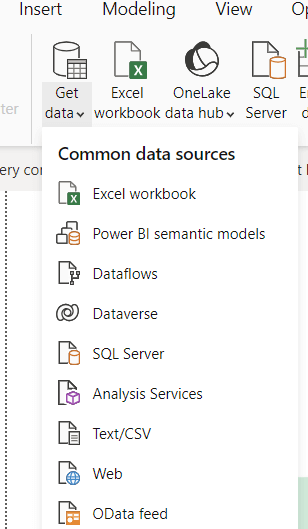
Or go to Get data => Text/CSV.

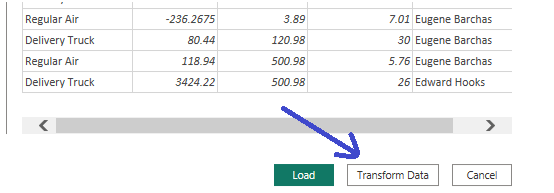
Click Transform Data after selecting the relevant data sheets.

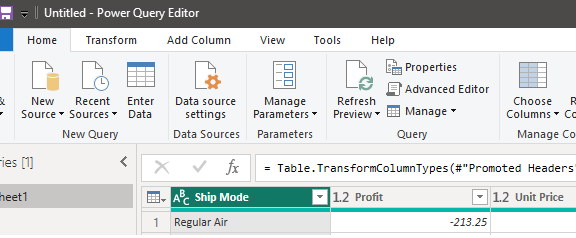
Use Power BI’s Query Editor to clean, sort, or further customize the data as needed.

Now that the data has been imported and cleaned, you can begin building data visualizations in Power BI. Create charts, graphs, or dashboards to track key metrics like billable hours, expenses, or team performance.
This manual approach gives you complete control over your data but requires regular updates if you need ongoing reporting. It’s a simple, hands-on method for businesses that don’t need automation.
API integration for connecting Harvest to Power BI
For businesses requiring complete control and advanced customization, using Harvest’s API to integrate with Power BI is the ideal solution. This method allows you to extract tailored datasets, automate workflows, and keep your reports updated on a schedule. While it requires some coding expertise, the flexibility it offers makes it worth the effort.
Step 1: Generate API access credentials
Start by creating a developer account on Harvest. Once logged in, navigate to the API settings to generate personal access tokens. These tokens act as secure keys to access your data. Harvest provides a REST API with various endpoints, such as time entries, invoices, and projects, which you’ll use to extract data. Take note of the relevant endpoint URLs for your integration.
Step 2: Write the code to extract data
Using a programming language like Python, you can write a script to retrieve data from Harvest and save it in a usable format. Below is an example of fetching time entries:
import requests
import json

# Define API credentials and endpoint
api_url = "https://api.harvestapp.com/v2/time_entries"
headers = {
    "Authorization": "Bearer YOUR_API_TOKEN",
    "User-Agent": "YOUR_APP_NAME"
}

# Make the API request
response = requests.get(api_url, headers=headers)

# Check if the request was successful
if response.status_code == 200:
    data = response.json()

    # Save the data as a JSON file
    with open("harvest_data.json", "w") as json_file:
        json.dump(data, json_file)
    print("Data saved successfully!")
else:
    print(f"Failed to retrieve data. Status code: {response.status_code}")
This script retrieves time entry data from Harvest’s API and saves it as a JSON file. You can adjust the endpoint and headers to extract other datasets like invoices or projects.
Step 3: Host the data for Power BI
The JSON file generated by your script must be hosted online for Power BI to access. Use a cloud service such as AWS S3, Google Cloud Storage, or Dropbox to upload the file. Ensure the file is publicly accessible and generate a URL. Power BI will use this link to retrieve the data.
Step 4: Connect JSON data to Power BI
Open Power BI and select Get Data > Web from the menu. Paste the URL of your hosted JSON file to import the data into Power Query Editor. Use the editor to clean, filter, and structure the dataset as needed. Once satisfied, click Close & Apply to load the data from Harvest to Power BI for visualization.
Step 5: Automate updates for real-time insights
Keep your reports current by automating the process of extracting and hosting data. Adjust your Python script to overwrite the JSON file with the latest data during each run. Schedule the script using tools like CRON jobs or Windows Task Scheduler to ensure Power BI pulls updated data at regular intervals. Automation eliminates manual tasks and ensures your Power BI reports always reflect real-time insights.
Ready-to-use dashboard template for Harvest
Power BI and Looker Studio are excellent tools for converting Harvest data into actionable insights. However, building reports from scratch is time-consuming. Thankfully, Coupler.io provides pre-built dashboards that simplify the process. These templates connect Harvest to Power BI and Looker Studio, delivering all key insights with minimal effort.
This time tracking dashboard for Harvest in Power BI offers a complete overview of your team’s time and billing performance. It tracks key metrics like billable hours, project statuses, and financial summaries in one interactive display.

The dashboard is easy to set up and provides clear, actionable insights. It is ideal for streamlining workflows and optimizing productivity.
No manual spreadsheets or complex setups. Everything is centralized to support faster, data-driven decisions.
While this guide focuses on Power BI, some businesses may prefer a web-based alternative like Google’s Looker Studio. If you’re already using Google’s ecosystem or prefer a simpler, browser-based solution, you can get your Harvest data visualized in the same dashboard template but for Looker Studio.
Is Power BI the right tool for your Harvest reports?
Power BI creates powerful visualizations but requires effort to keep updated with real-time Harvest data. Manual imports are inefficient and prone to delays.
Coupler.io solves this problem and automates the entire process. Your Harvest data stays current without any extra effort on your part. You save time, avoid errors, and focus on real analysis. Stop juggling spreadsheets and let Coupler.io handle the heavy lifting. Spend your time making smarter decisions, not managing data.
Book a demo today and discover how Coupler.io can help you automate your business.
Automate your business reporting with Coupler.io
Book a demo