As a marketing manager, I run advertising campaigns on different platforms: Google, Facebook, LinkedIn, and even TikTok. You can imagine how challenging it is to track all the KPIs across multiple channels and not get mixed up in the process. But I don’t, because the information about cost per click, click-through rate, conversions, and other metrics is kept in an all-in-one solution – a PPC dashboard.
You can build one as well if you want to keep your PPC reporting in order. You can also check out this PPC dashboard video guide made by our YouTube creators.
What is a PPC dashboard?
Is it a bird? Is it a plane? No, it’s a PPC dashboard!
We define a PPC dashboard as a report that allows you to track the PPC performance metrics of your advertising campaigns. The digital advertising model historically was called pay-per-click, so the reporting dashboards for advertising are also called PPC dashboards.
The value of any PPC report is to provide insights into the performance of PPC campaigns or even the digital marketing strategy. Under the hood of a proper PPC dashboard, there is data flow automation. This is usually implemented via a connector that takes raw data from one or multiple ad platforms, transfers and turns it into metrics on the PPC dashboard.
What is a PPC multichannel campaign dashboard?
A PPC multichannel dashboard is a PPC report that is connected to more than one advertising platform. This way you can monitor the performance of campaigns across different advertising tools.
So, a regular PPC dashboard provides insights into the performance of a single ad source, for example, Facebook Ads.
A multi-channel PPC dashboard provides insights into several ad sources in one place. As a rule, you can filter the report by channel and get the proper information on the dashboard.
Can you create a PPC analytics dashboard yourself from scratch? Yes, but this would require specific technical expertise. You not only need to add charts and graphs in a BI tool but you also need to connect the report to your data source.
The better option, which is quite popular among experienced marketers, is to build a PPC dashboard from a template. It’s a ready-to-use solution that allows you to get a solid PPC report connected to your data source with just a few clicks. Interested? Let’s check out how you can have this done.
How to create a custom dashboard PPC with our free template
PPC multichannel dashboard template
This is a ready-to-use solution that allows you to get a solid PPC report connected to your ad analytics sources with just a few clicks.
It has built-in integrations driven by Coupler.io with all common ad platforms including Google Ads, Facebook Ads, LinkedIn Ads, TikTok Ads, and so on.
It’s not necessary to use all of these built-in connections – if you want to use the report for only Google Ads, Facebook Ads, and LinkedIn Ads, feel free to do this.
The setup itself is quite straightforward and takes not more than 5 minutes. After that, you can use your brand-new PPC analytics report to monitor the performance of your ad campaigns in one place.
By the way, although this PPC report is called multi-channel, you can actually use it for a single channel. At the same time, Coupler.io designed this template for different destinations including Google Sheets, Looker Studio (former Google Data Studio), Power BI, and Tableau.

PPC multichannel dashboard in Google Sheets
Use a PPC dashboard designed for Google Sheets to track the performance of your campaigns across multiple advertising platforms.


PPC multichannel dashboard in Looker Studio
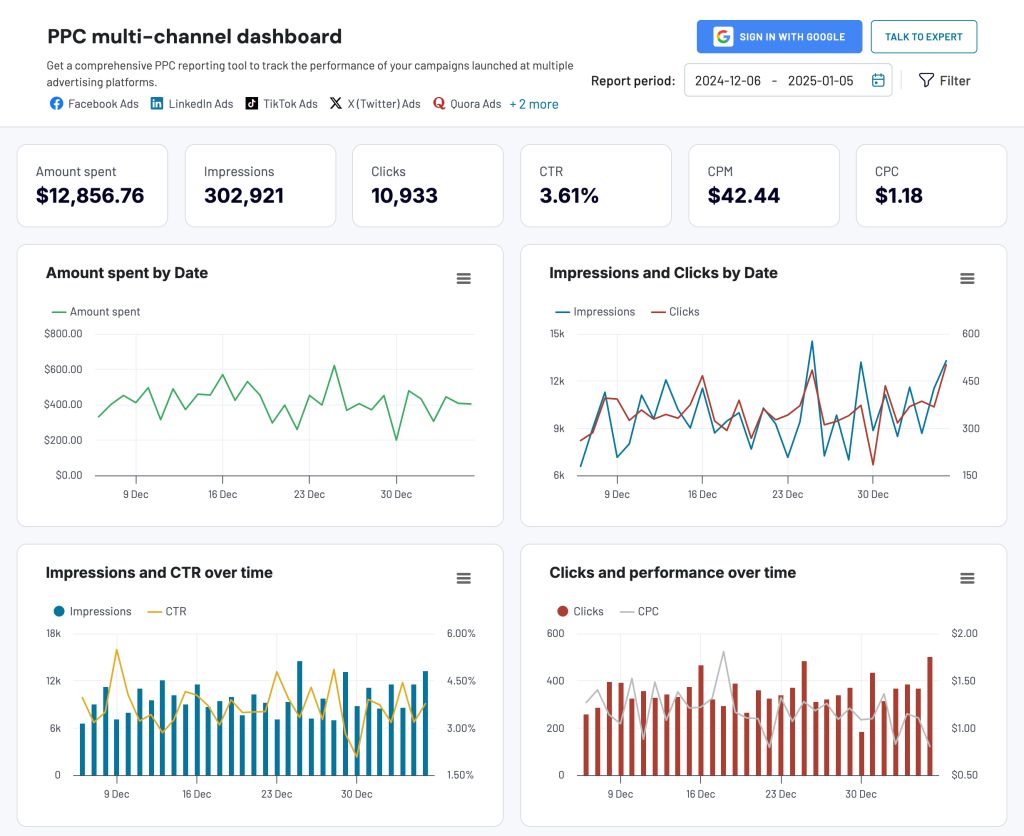
Get a comprehensive PPC reporting tool to track the performance of your campaigns launched at multiple advertising platforms.

PPC multichannel dashboard in Power BI
Use a Power BI PPC dashboard for tracking and analyzing your advertising campaigns across multiple platforms.


PPC multichannel dashboard in Tableau
Track and analyze the performance of your advertising campaigns across various platforms using a one-stop PPC dashboard in Tableau

PPC monthly budget dashboard template in Google Sheets
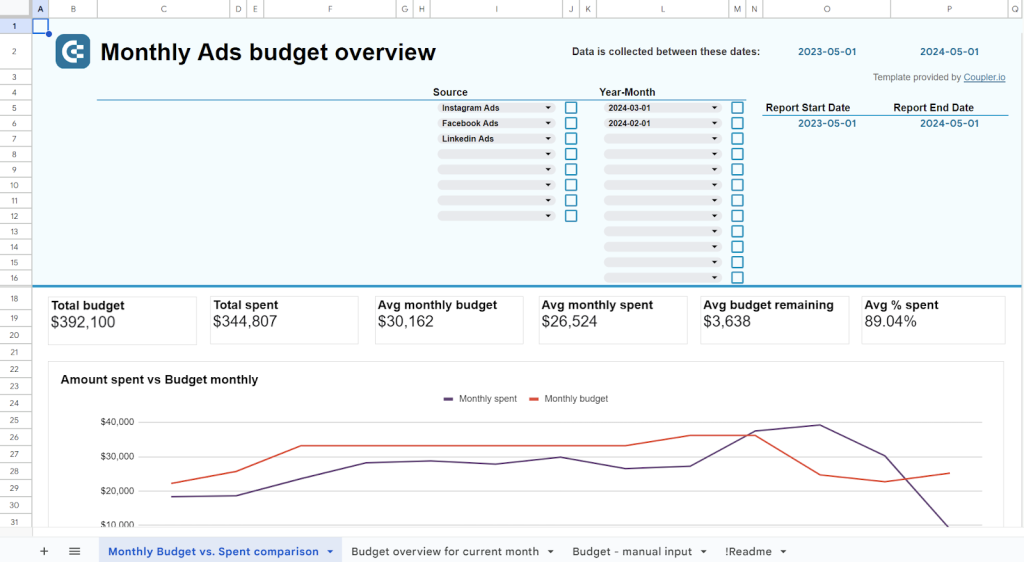
Meet another multichannel PPC dashboard but with a focus on financial reporting. This analytics solution provides a budget overview with spending predictions and alerts to avoid budget overspending.
With this PPC dashboard, you can track the dynamics of spending on advertising, understand your over/under budget during the year, monitor the average daily costs, and more.
Multi-channel creatives dashboard template
With Coupler.io’s multi-channel creatives dashboard, you get a pre-designed, ready-to-use solution to track and analyze your ad creatives’ performance across platforms like Google Ads, Facebook Ads, LinkedIn Ads, TikTok Ads, and more.
The dashboard allows you to evaluate how effective your creatives are through key performance metrics. These include impressions, clicks, CTR, CPC, amount spent, and others. You can compare creative performance across platforms, identify failed cases, and optimize campaigns—all without the hassle of building a dashboard from scratch.
With different charts for the major metrics, it is easy to find patterns in engagement, clicks, and costs. The dashboard also has filters that let you monitor creative performance in detail, from source to ad name. You can analyze performance across multiple channels or narrow your focus to a single platform.
The template is available for use both in Google Sheets and Looker Studio. With just a few clicks, you can populate this dashboard with your ad analytics data. Follow the instructions in the Readme tab and start using the multi-channel creatives dashboard today.
Single-channel PPC dashboard examples you can consider
Coupler.io offers white-label dashboard template examples for different types of processes and activities. Since we’re talking about the PPC dashboard here, you can check out three more PPC report templates in Looker Studio for Google Ads, Facebook Ads, and LinkedIn Ads.
Google Ads dashboard
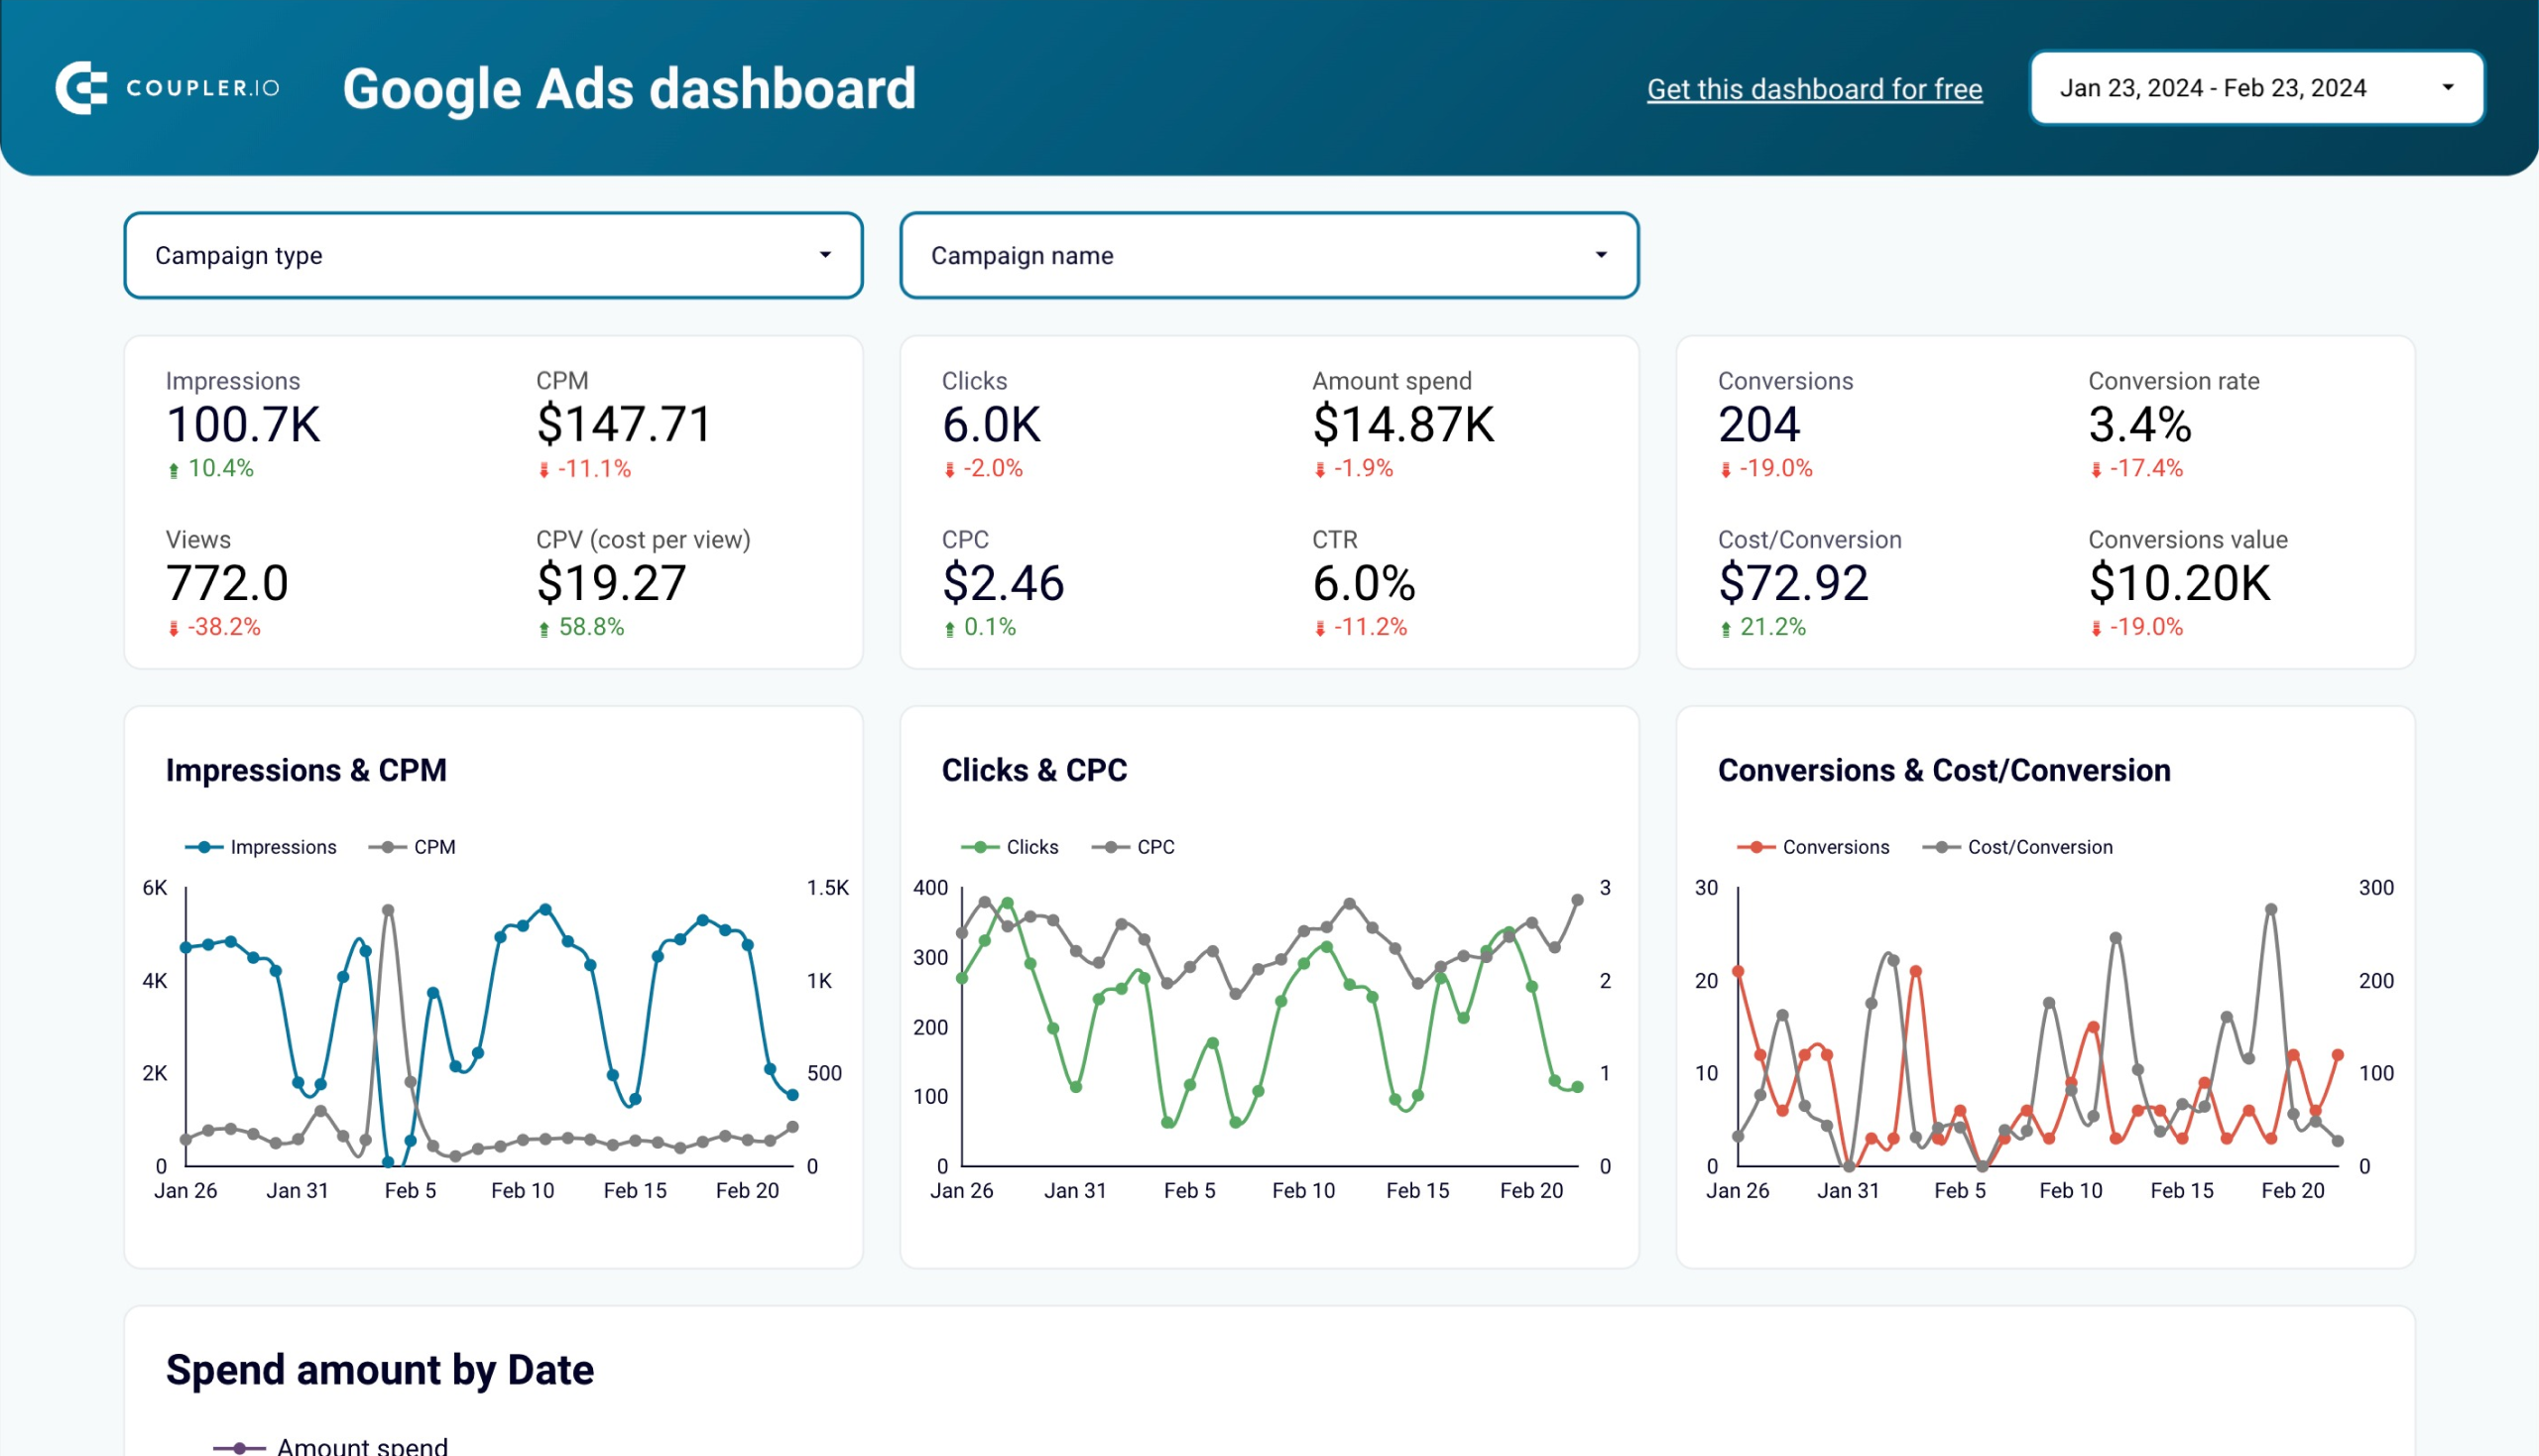
This PPC dashboard for Google Ads provides a comprehensive overview of key ad metrics to make informed decisions. You can identify successful strategies or bottlenecks, uncover areas for improvement, and optimize your ad campaigns.
This dashboard enables you to measure the effectiveness of your Google Ads campaigns to make effective data-driven decisions. Thanks to the built-in Coupler.io connector, you can load your data easily. Preview and try it with your Google Ads account connected for free!
The dashboard is also available as a template in Google Sheets, Looker Studio, and Power BI. Pick the version that meets your reporting needs and try it out.
Google Ads dashboard in Google Sheets
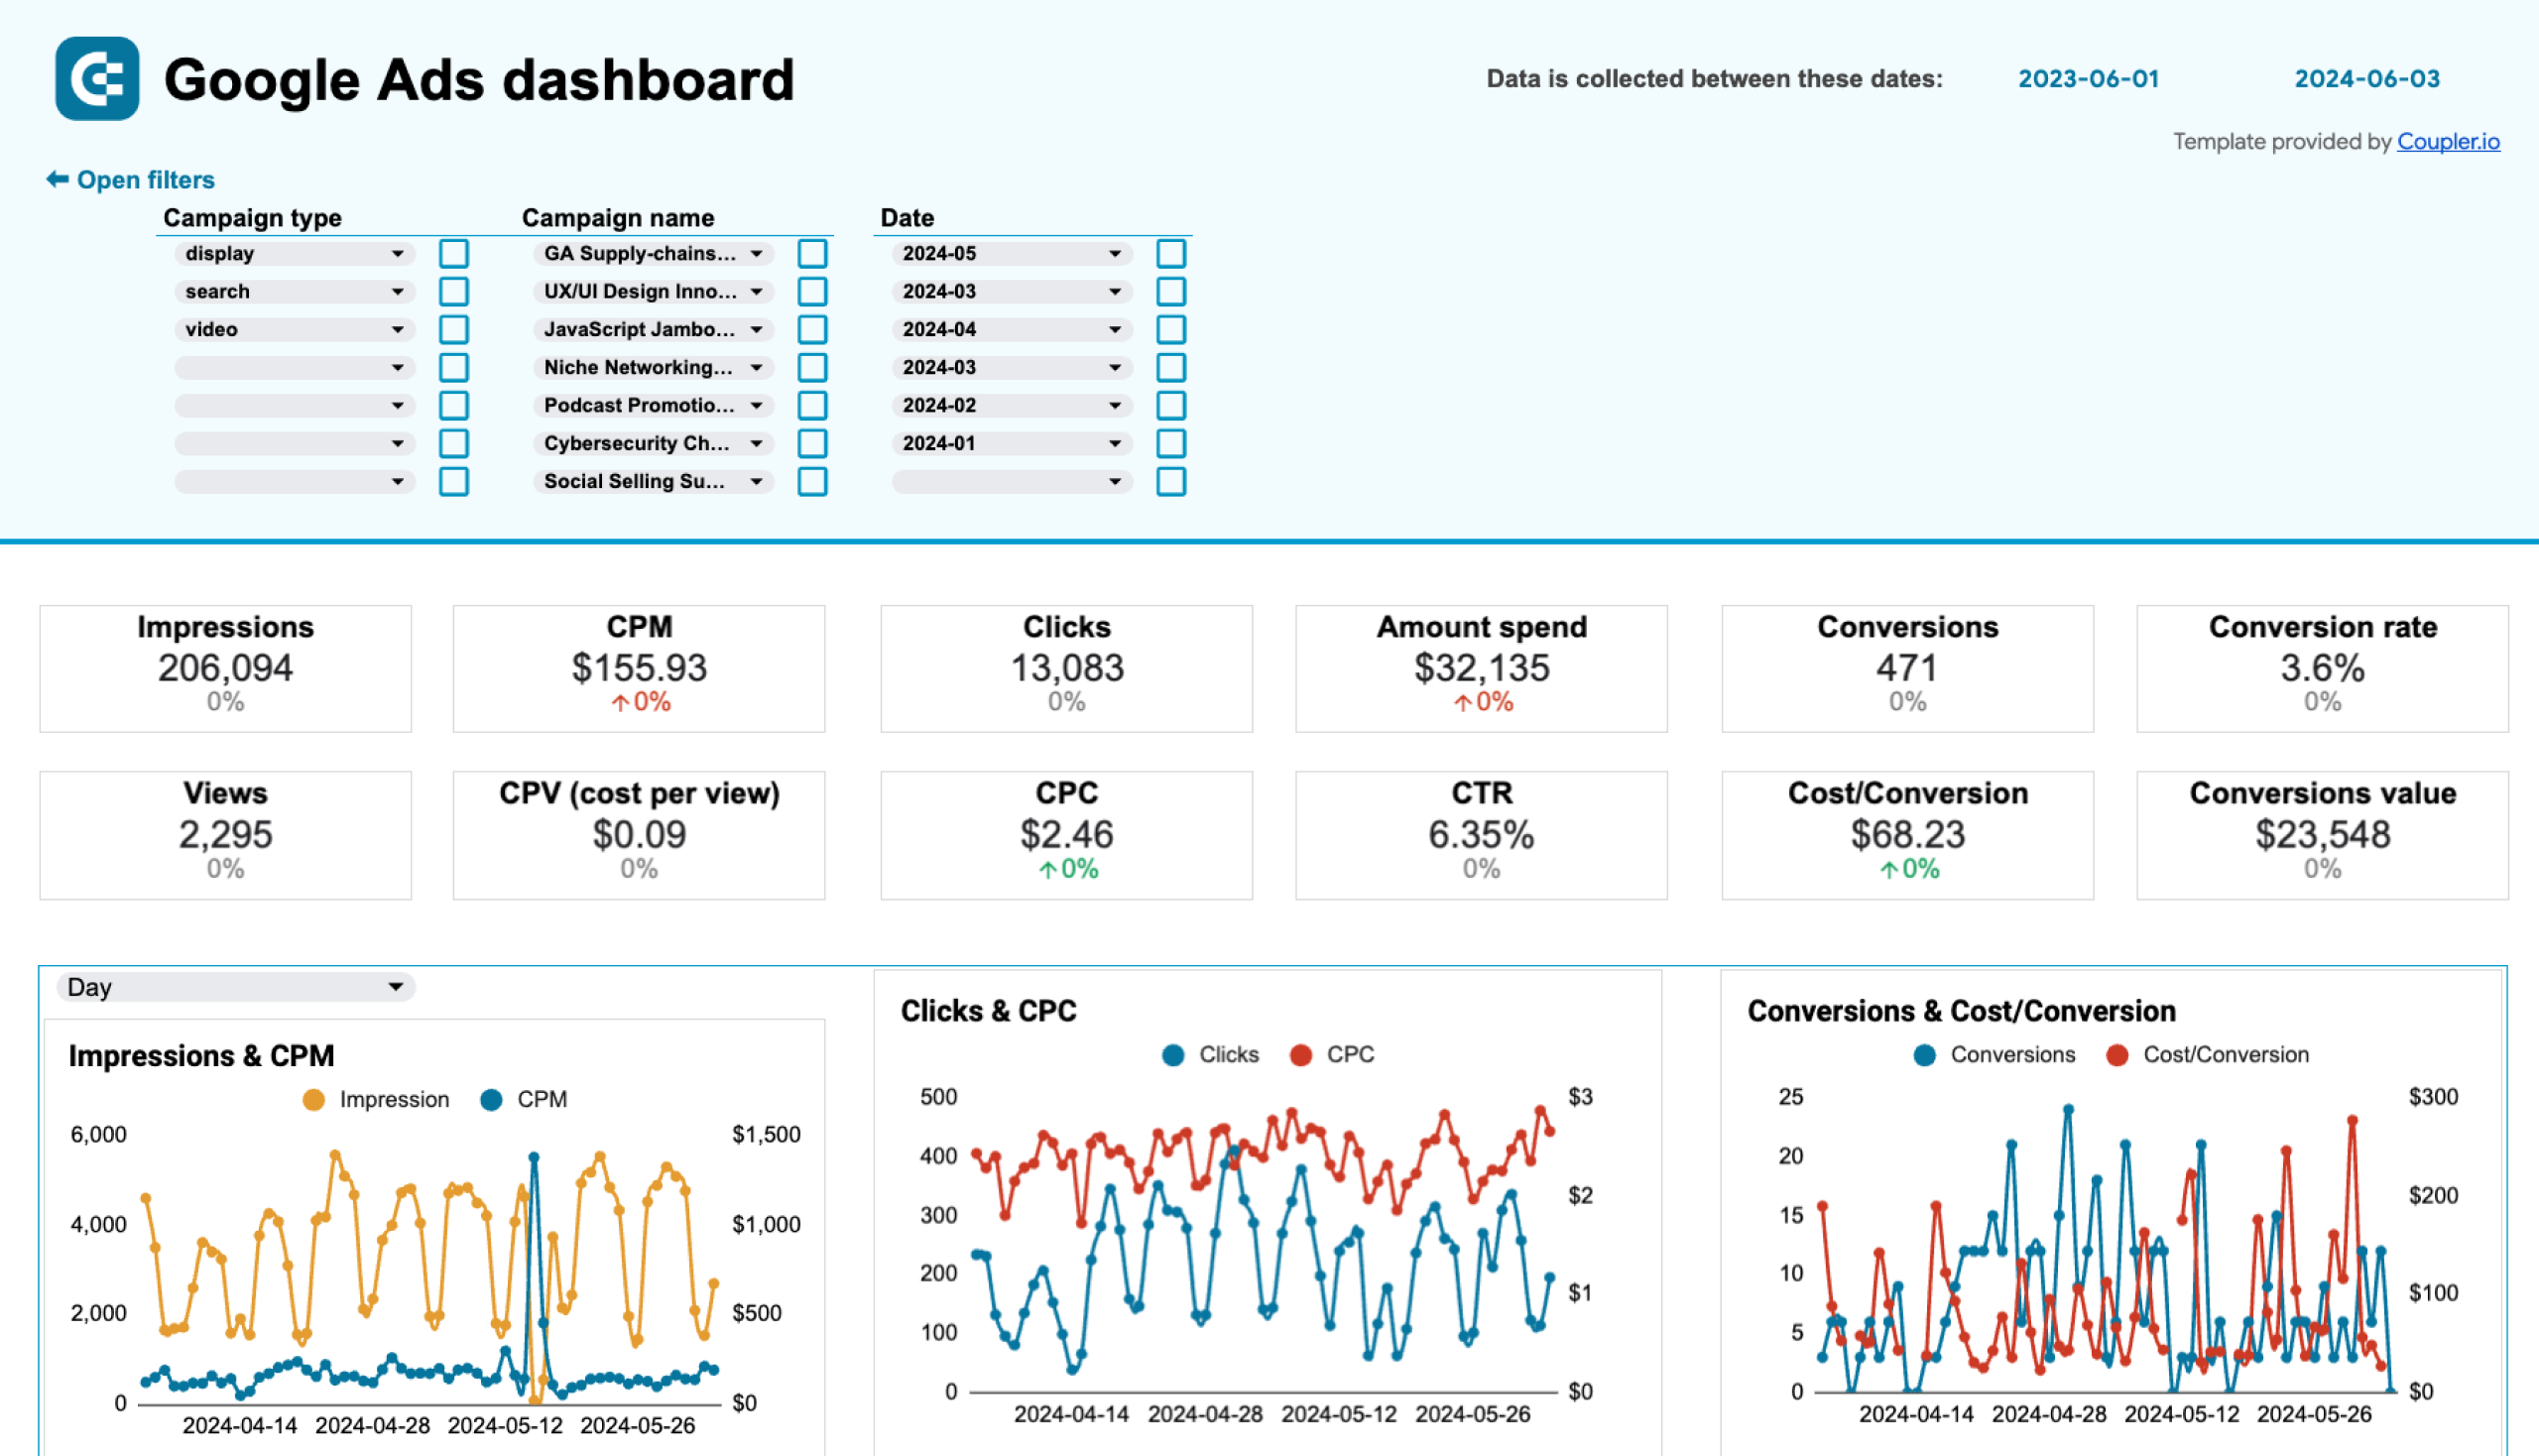
Evaluate the performance of your PPC campaigns launched on Google and use these insights to optimize budgeting and conversion.
Google Ads dashboard in Looker Studio
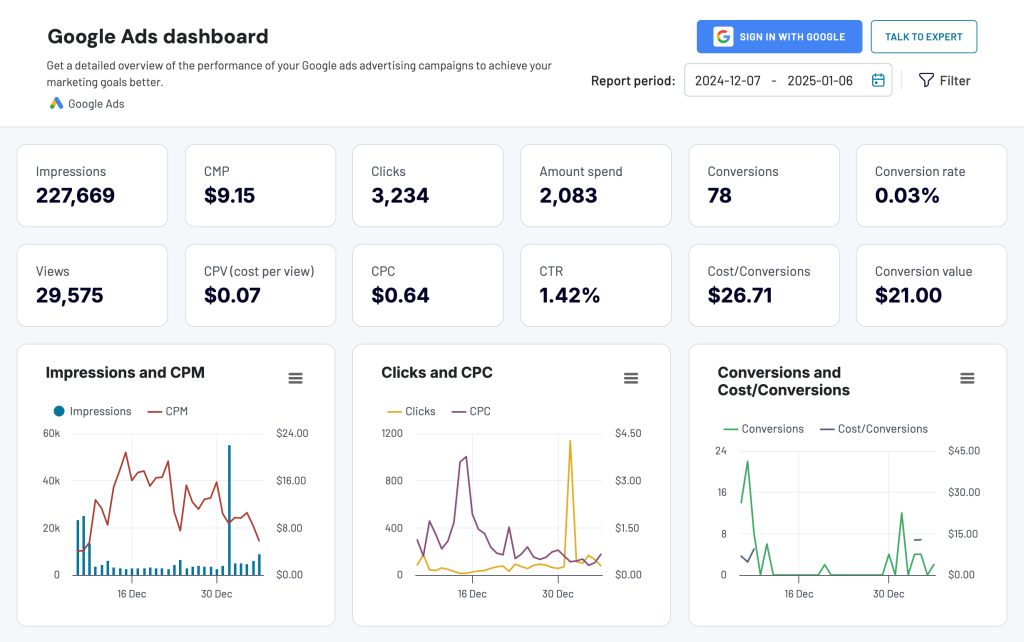
Get a detailed overview of the performance of your Google ads advertising campaigns to achieve your marketing goals better.
Google Ads dashboard in Power BI
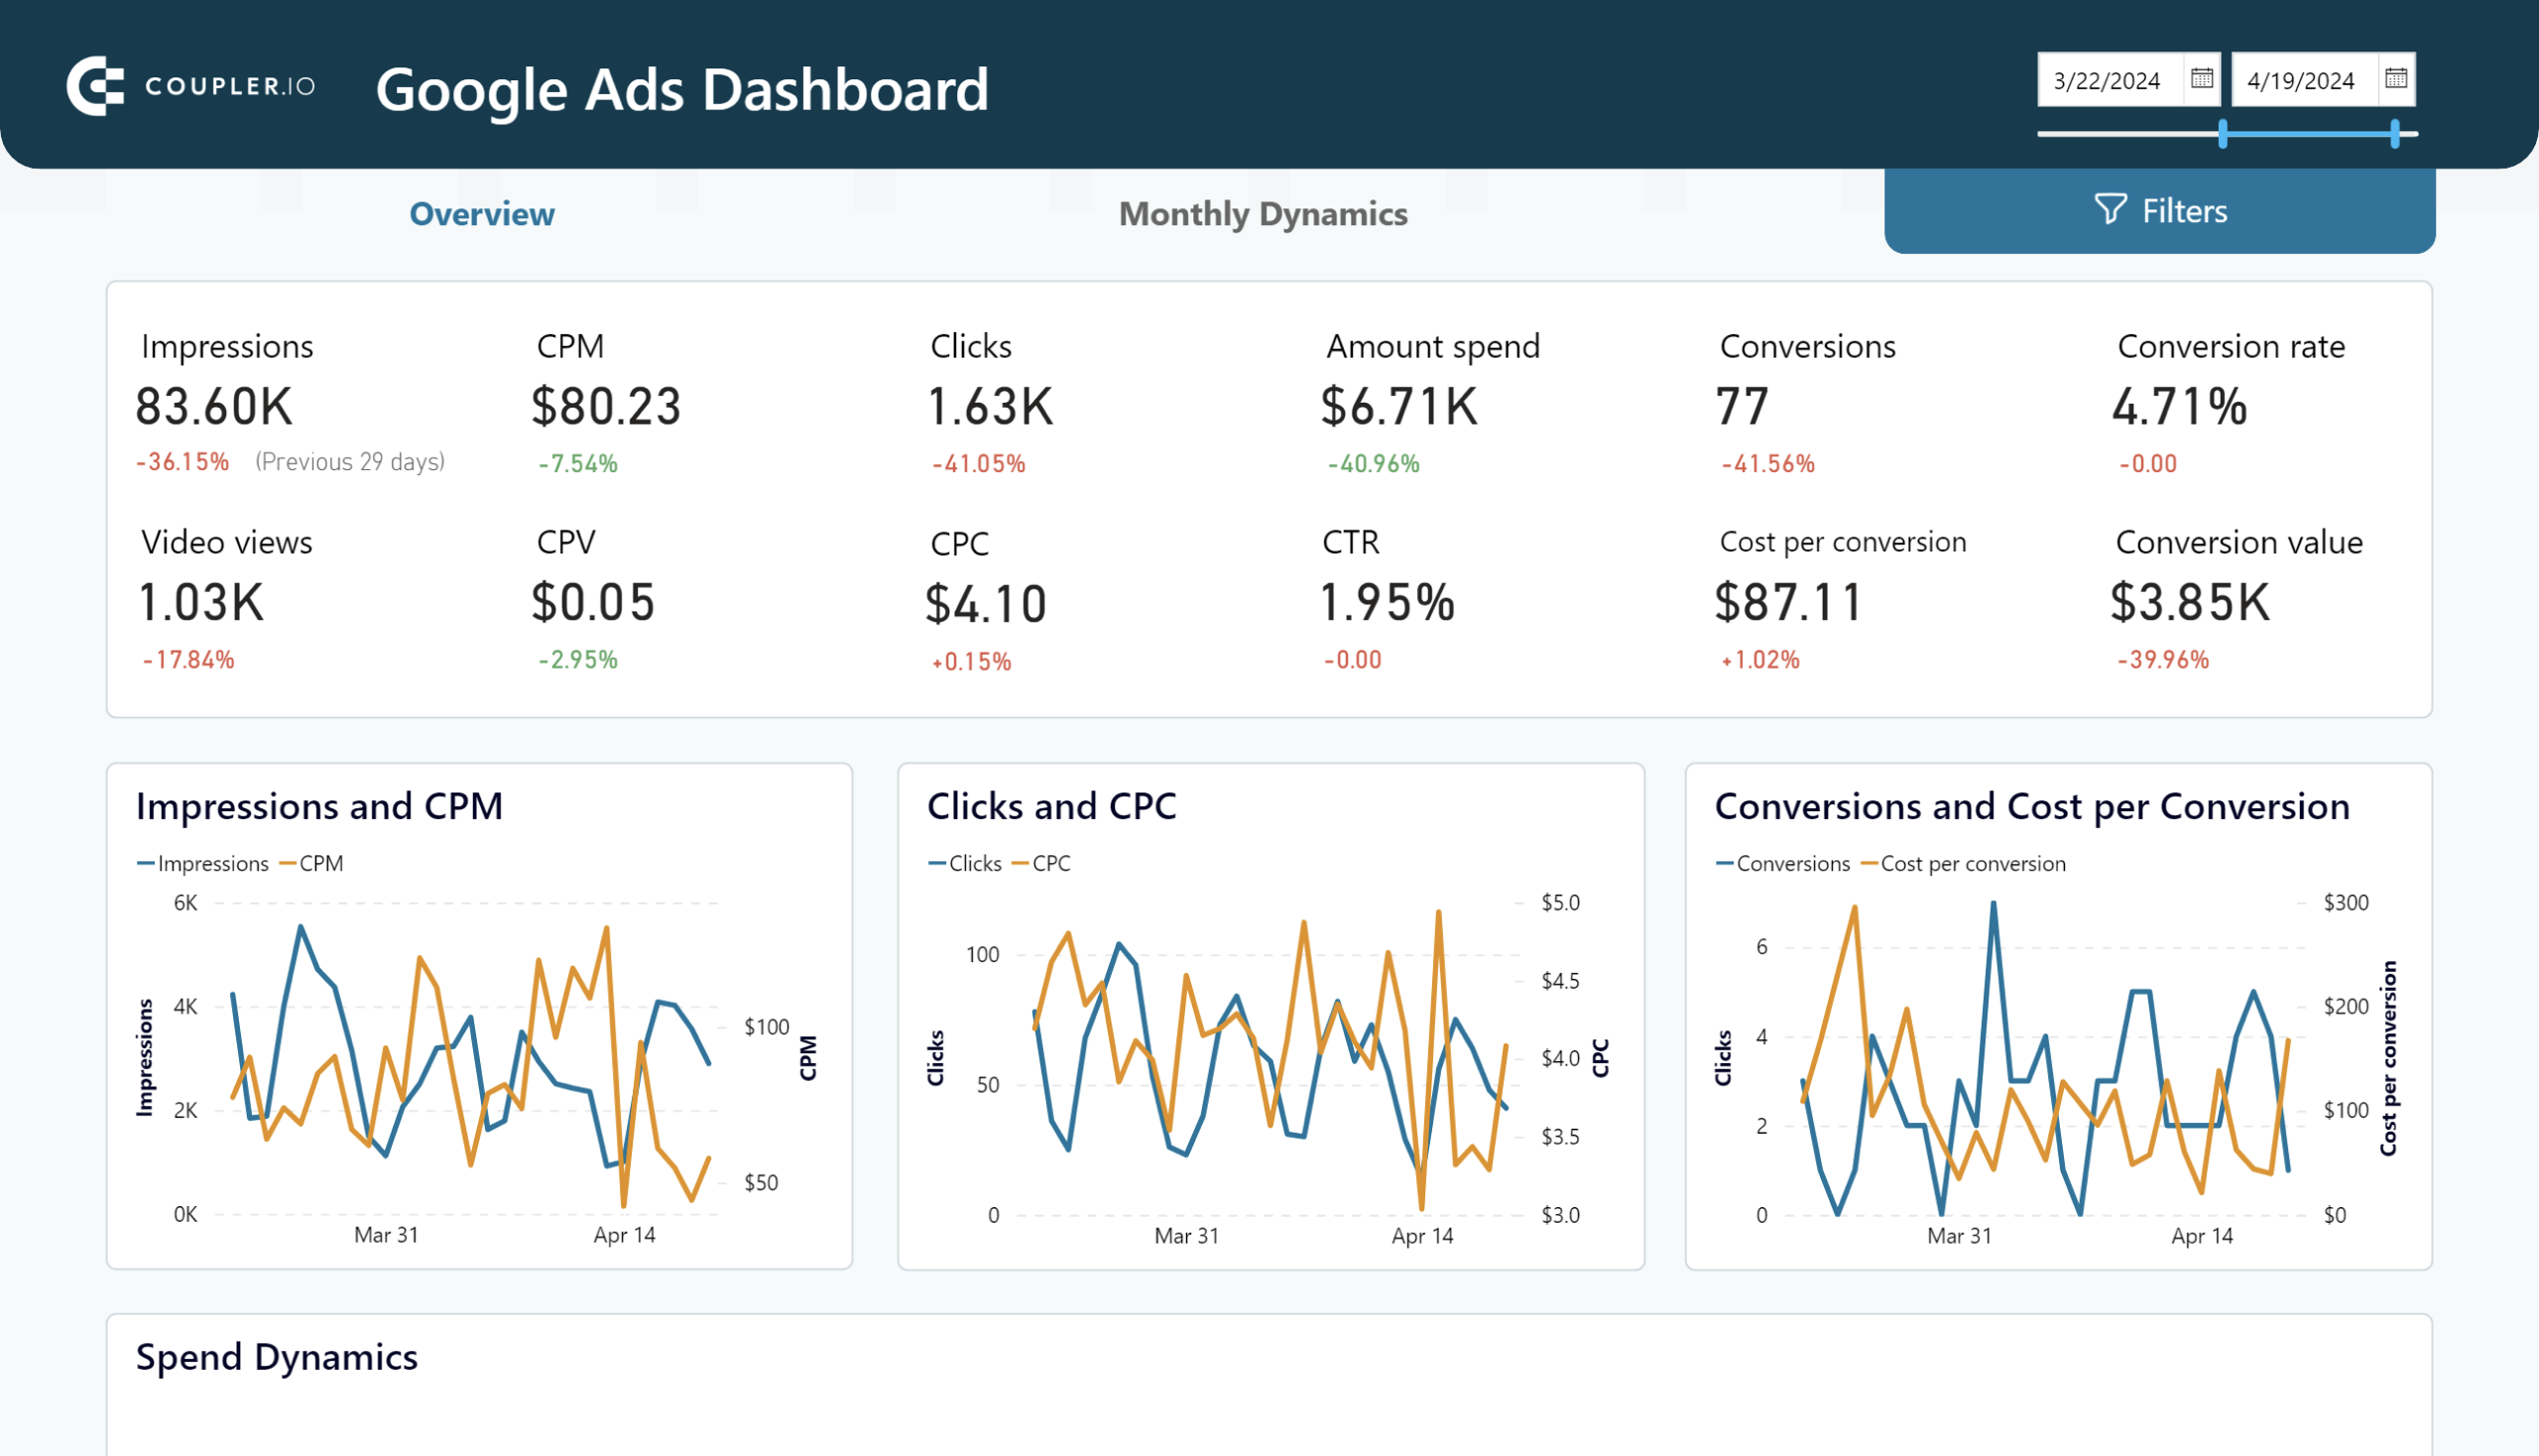
Overview the performance of your advertising campaigns in Google Ads and track monthly dynamics of key metrics.
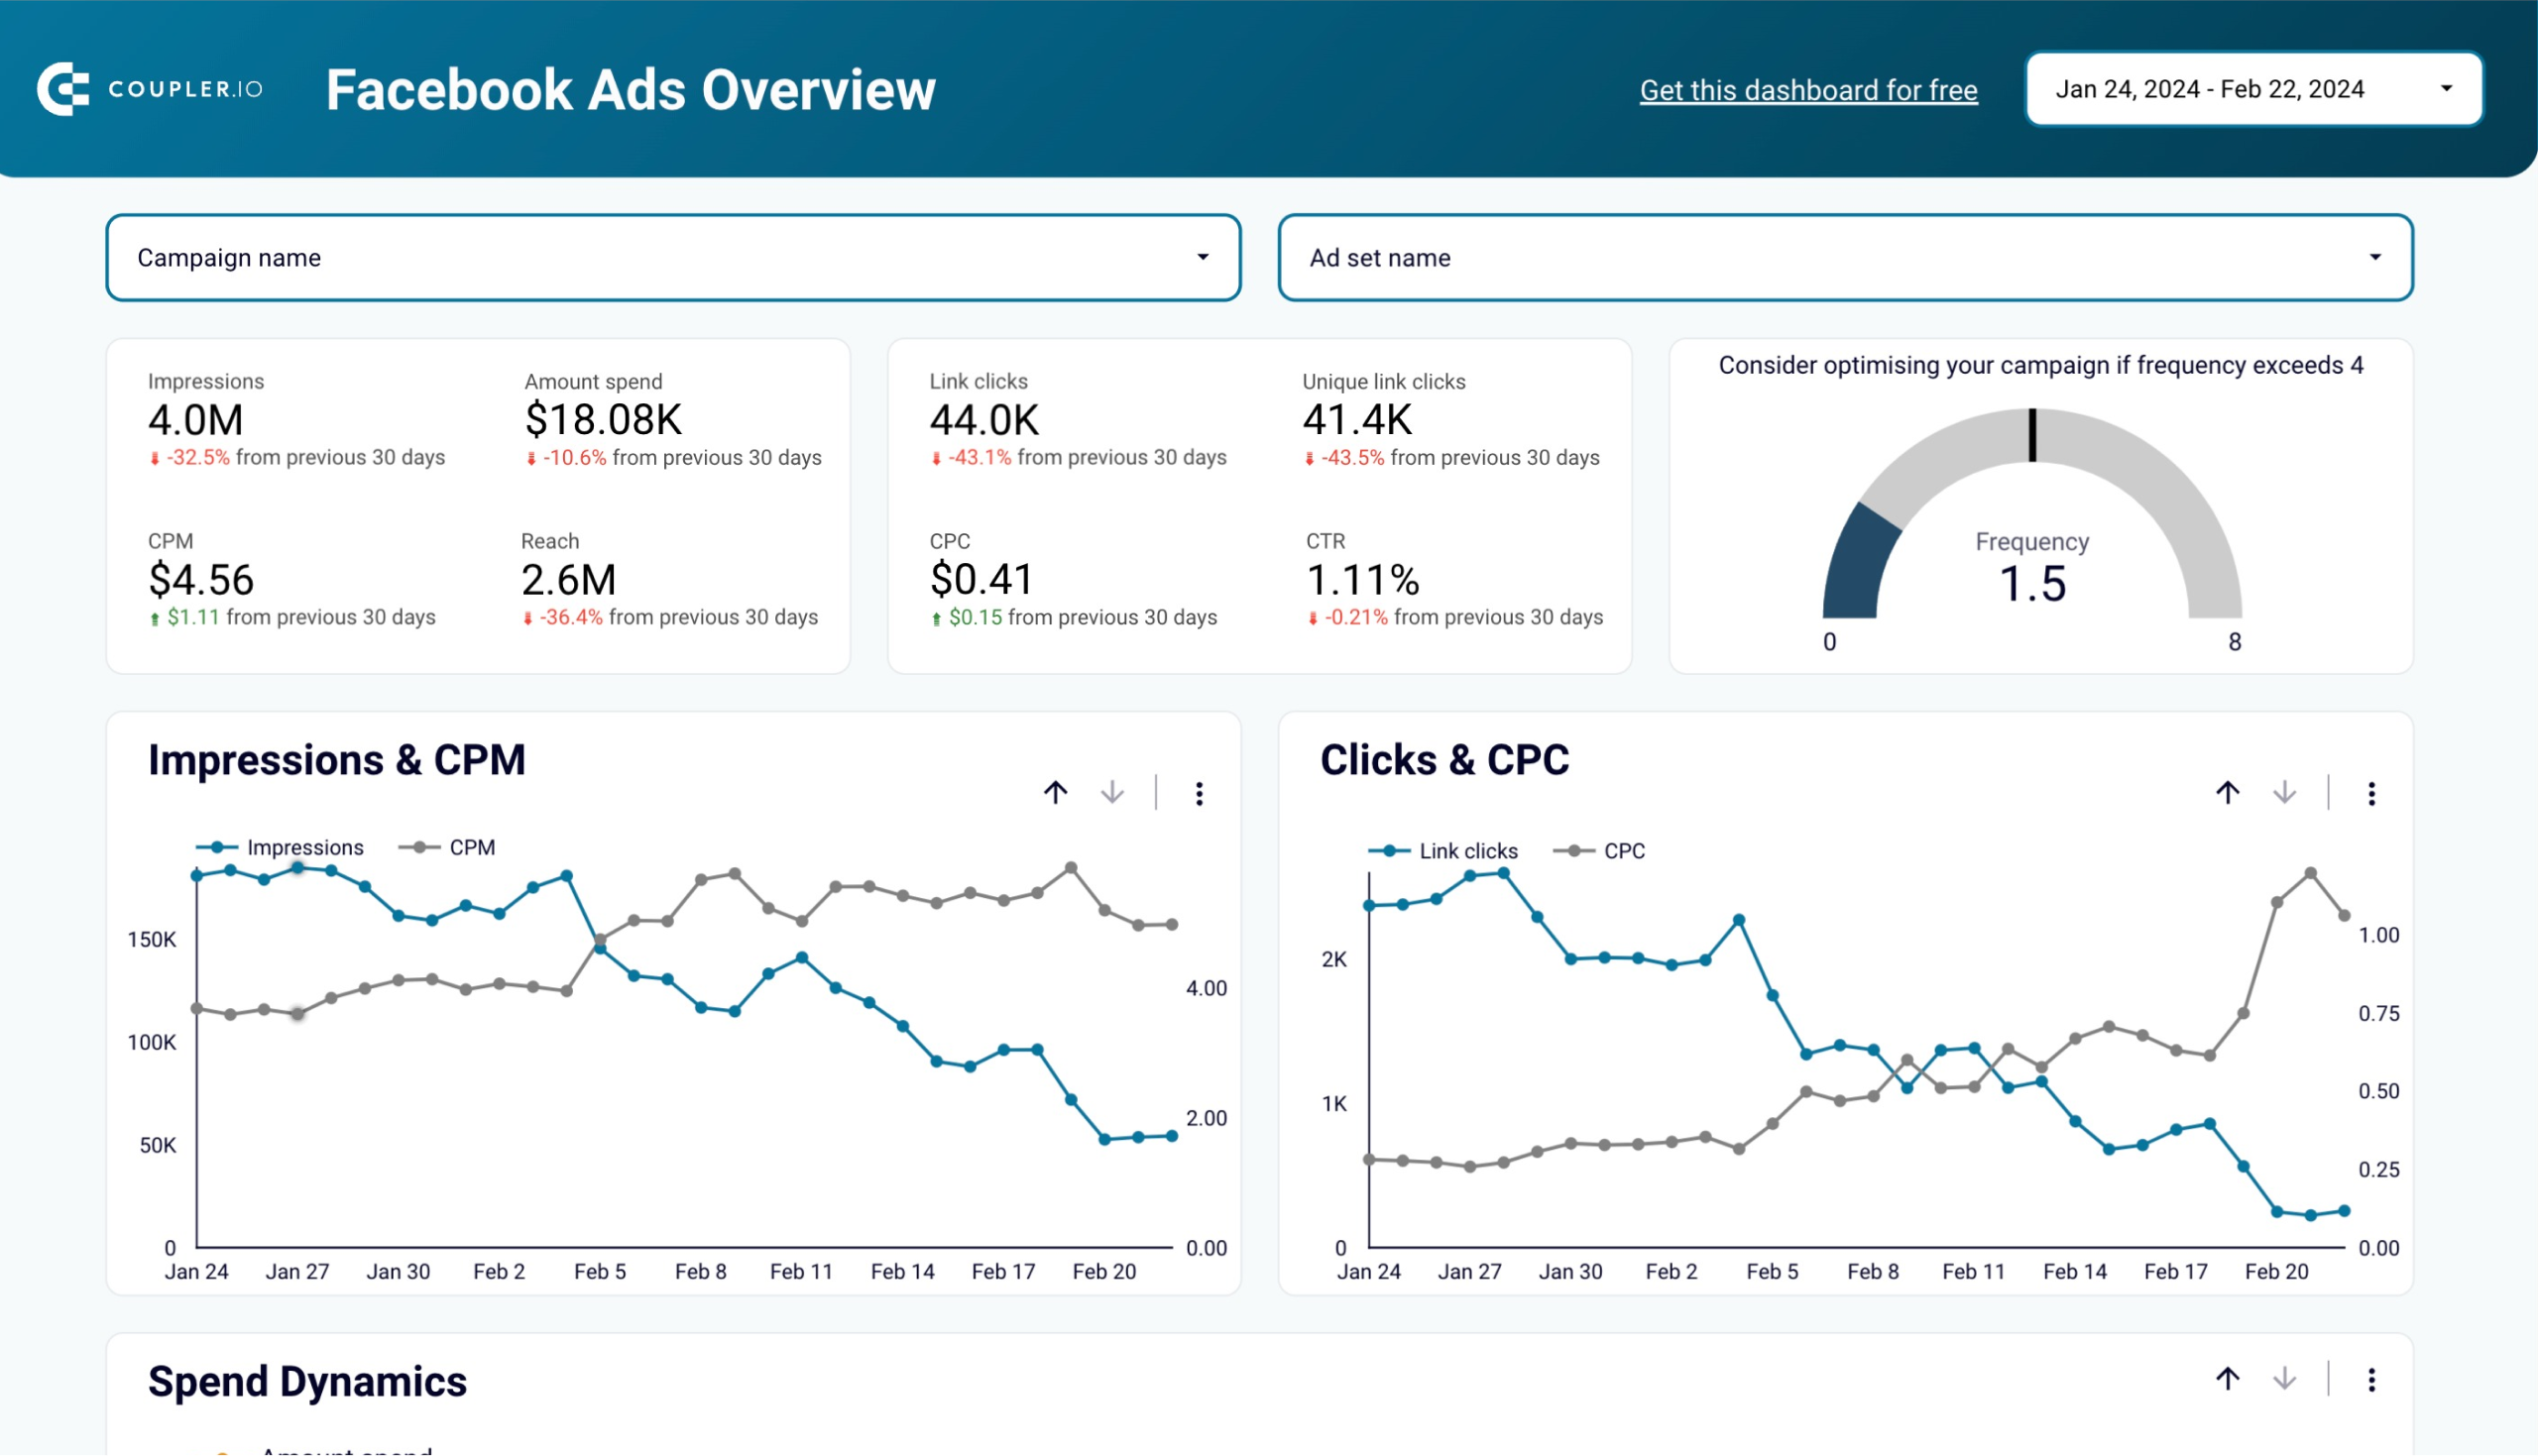
Facebook Ads dashboard
With the Facebook Ads PPC dashboard by Coupler.io, you can derive valuable insights into the performance of your advertising campaigns.
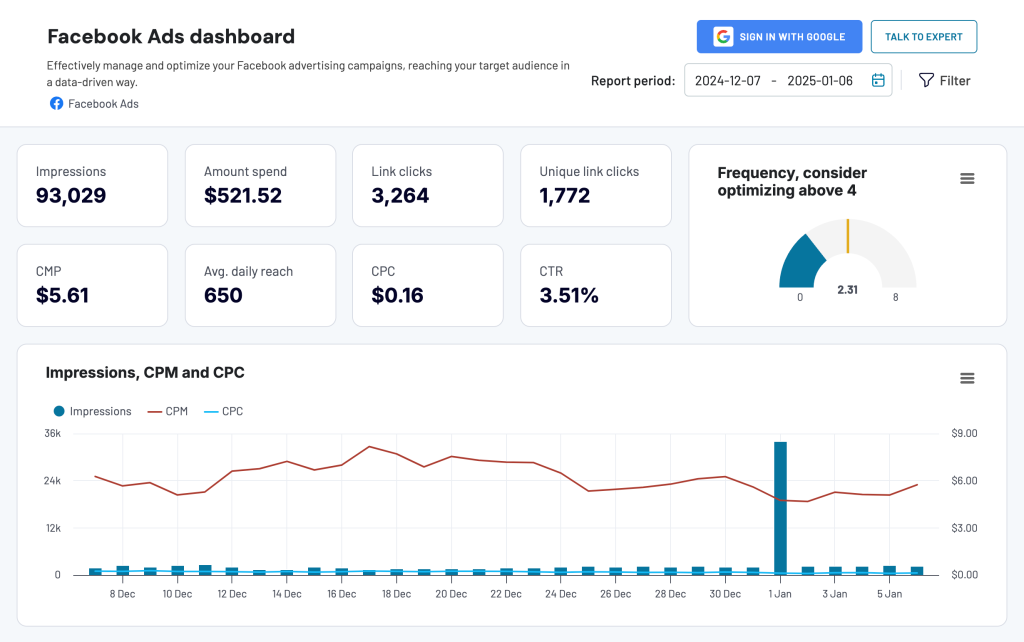
You can monitor and understand key metrics, measure campaign effectiveness, and do for Facebook Ads optimization with no additional effort.
Coupler.io lets you easily connect your Facebook Ads account and instantly populate the dashboard with your data. And you can do this absolutely for free.
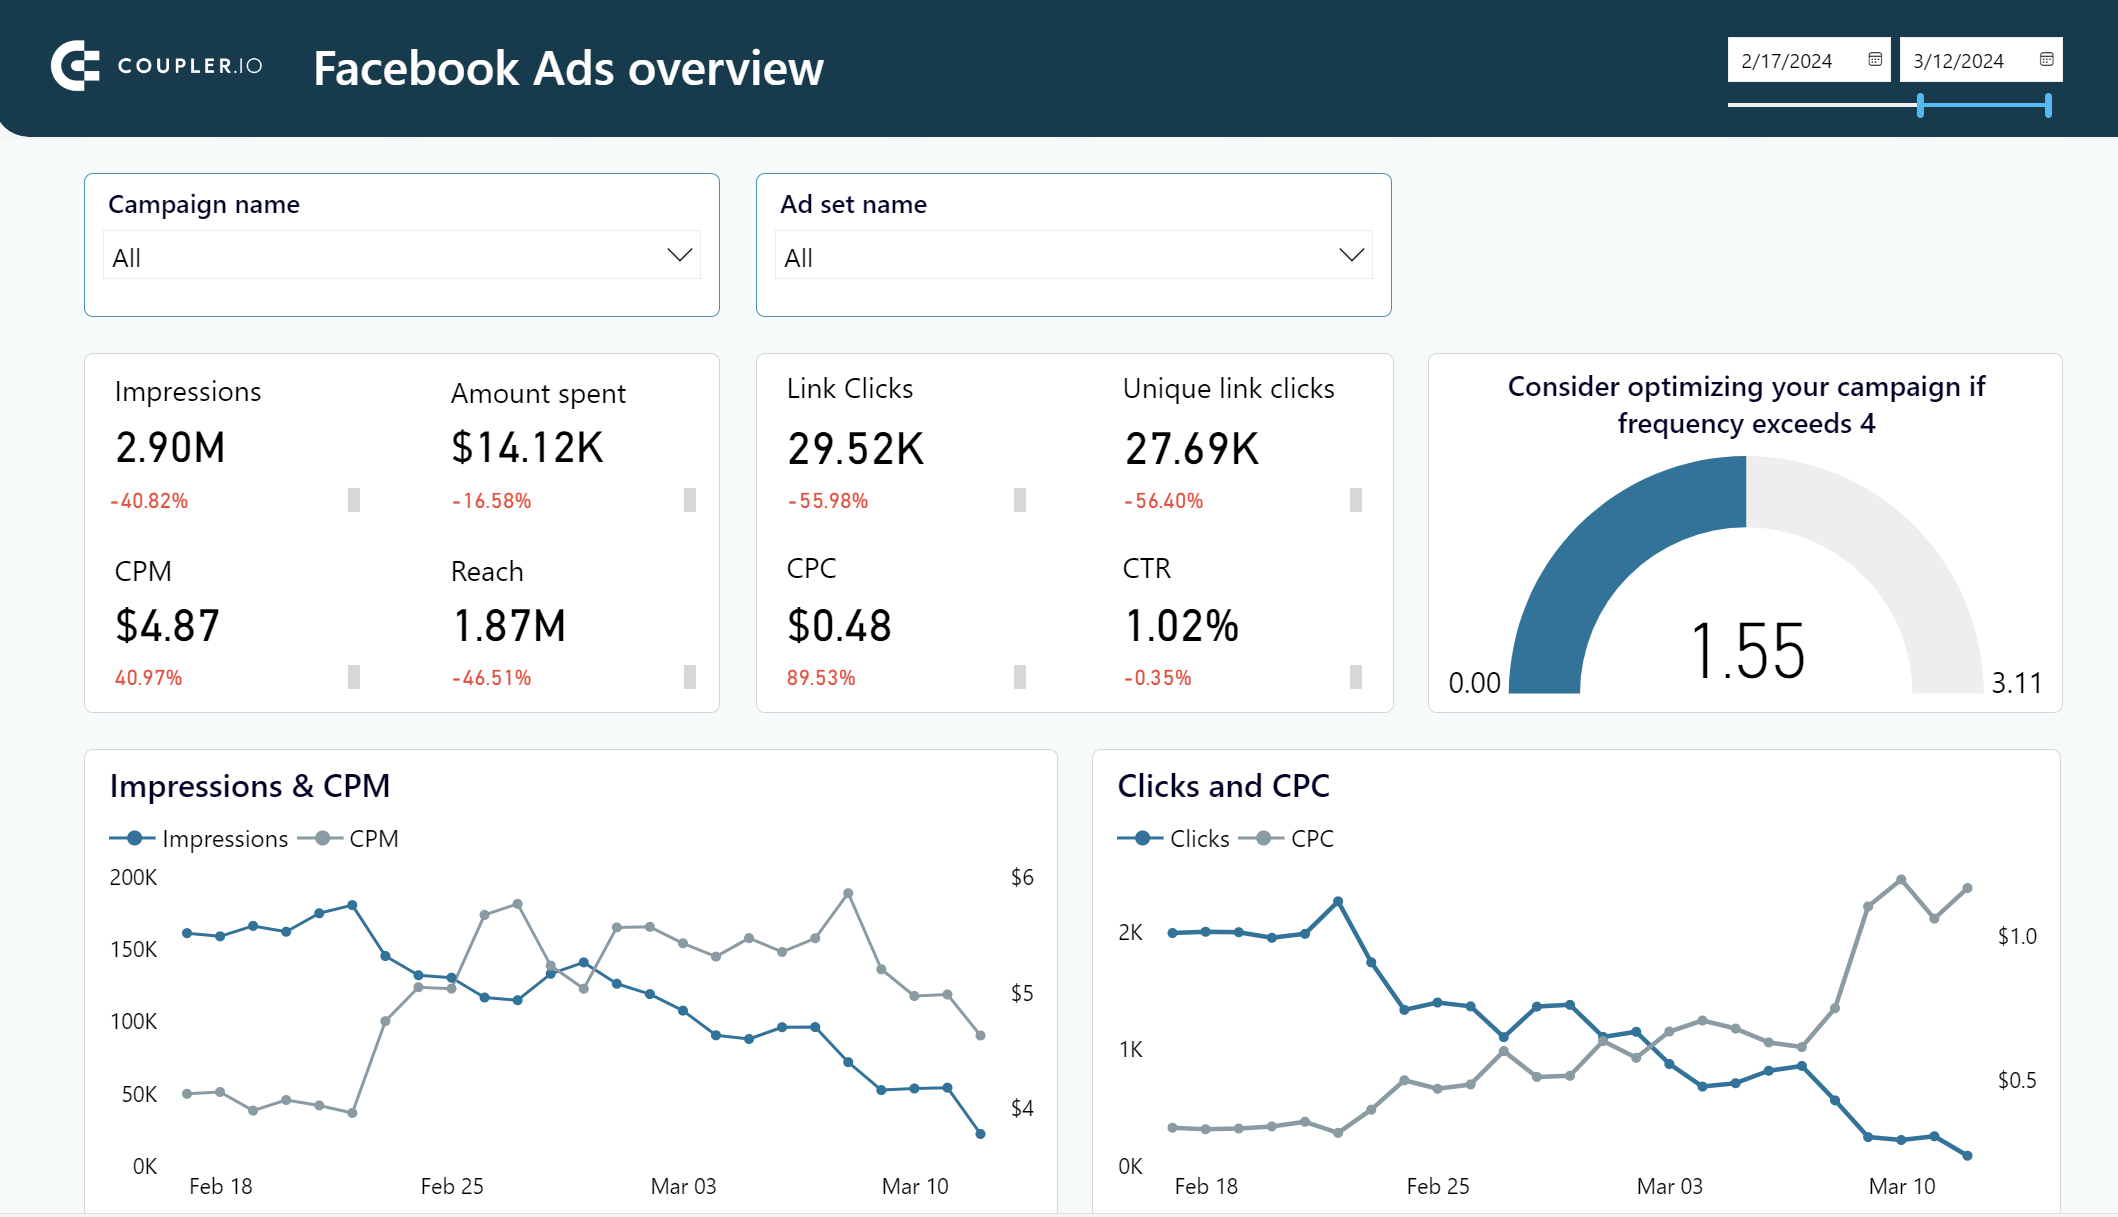
If you prefer managing your reporting in external BI tools, use the Facebook Ads dashboard as a template for Looker Studio, Power BI, and Google Sheets. Pick the version that meets your reporting needs and try it out.
Facebook Ads dashboard template in Looker Studio
Effectively manage and optimize your Facebook advertising campaigns, reaching your target audience in a data-driven way.
Facebook Ads dashboard template in Power BI
Get a detailed overview of your advertising campaigns’ performance using a dynamic Power BI dashboard template equipped with a no-code Facebook Ads connector
Facebook Ads dashboard template in Google Sheets
Monitor the performance of your advertising campaigns in Facebook and identify top assets to spend your budget wisely.
LinkedIn Ads dashboard
The third star in the constellation of Coupler.io PPC dashboard templates is – the LinkedIn Ads dashboard. This analytics solution allows you to get an overview of key metrics such as impressions, clicks, amount spend, etc.
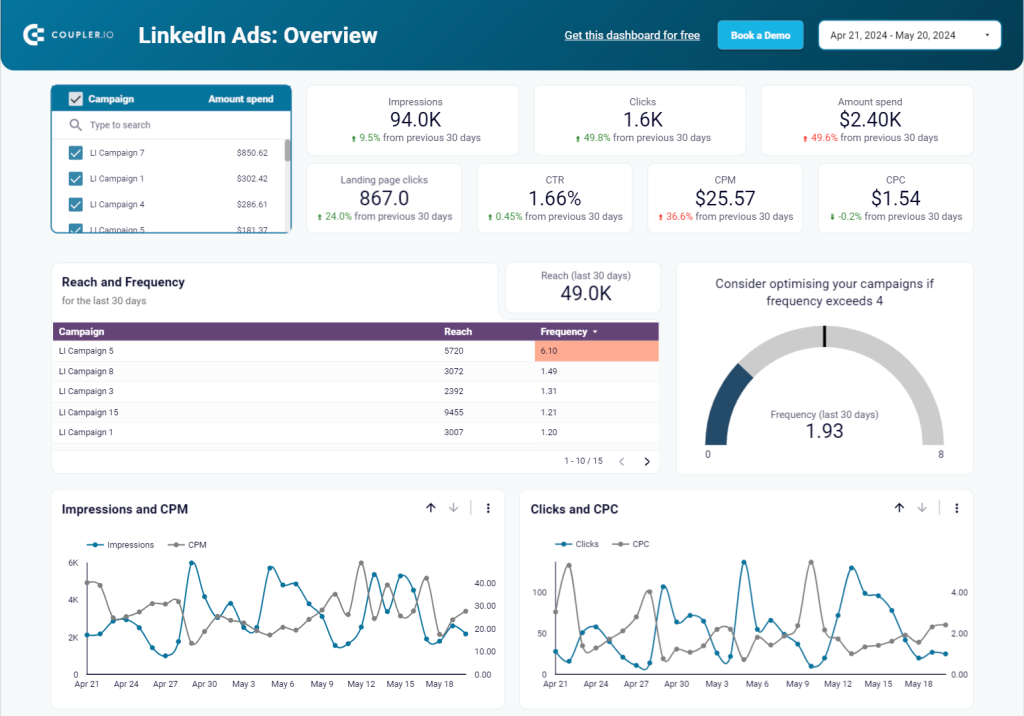
It also offers a separate page with insights into leads and conversions. This dashboard template lets you make intelligent business decisions and drive success.
What value can a PPC dashboard provide for your business?
In most cases, a well-tailored dashboard will save you time. This, in turn, leads to a chain reaction resulting in better resource distribution, improved productivity, and, of course, increased revenue.
For example, with proper automations and reports setup, ClaritySeed achieved the following results:
- Freed 40+ hours monthly
- Reduced report delivery time by 5 hours
- Improved campaign optimization speed
These results became real when ClaritySeed automated daily client reporting. How? They created data flows from Google Analytics, Facebook Ads, and Google Ads to easily track the performance of marketing campaigns and fully automate daily reporting.
Their PPC reports were built in Google Sheets and auto-populated daily. As a result, ClaritySeed saved over 10 invaluable hours weekly that were previously consumed by manual data transfers.
Unfortunately, I can’t share their PPC reports in spreadsheets but I can share what a good PPC report dashboard looks like.
What should you include in a PPC reporting dashboard?
Let’s take a look at the key components of a PPC reporting dashboard that will help you better understand the performance of your marketing campaigns.
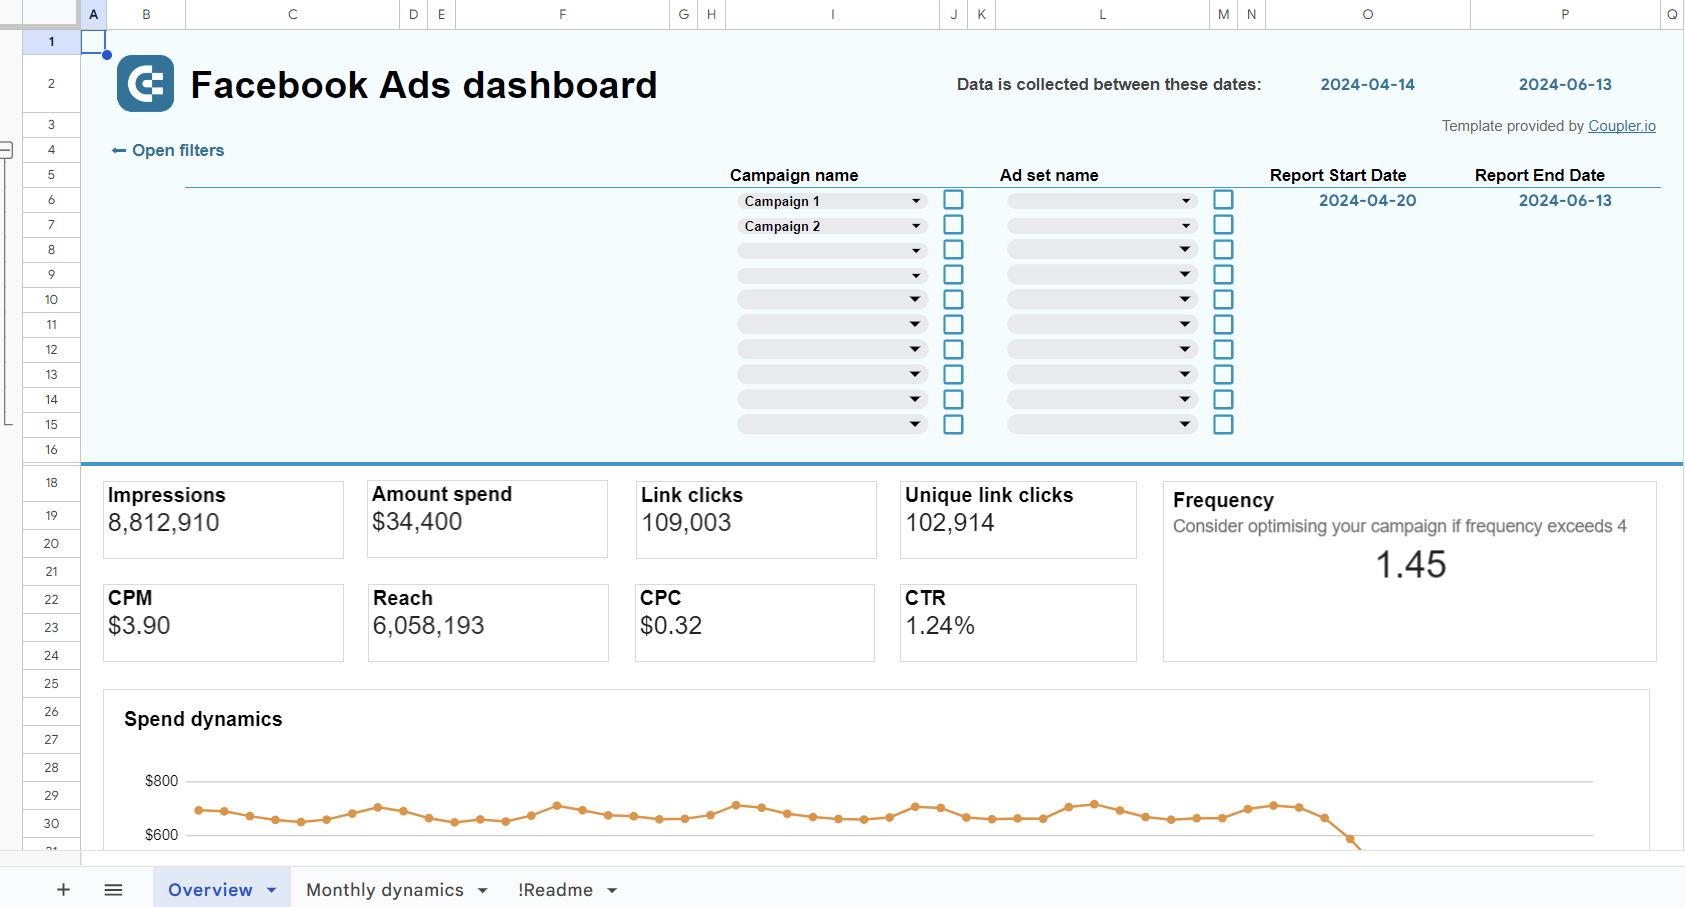
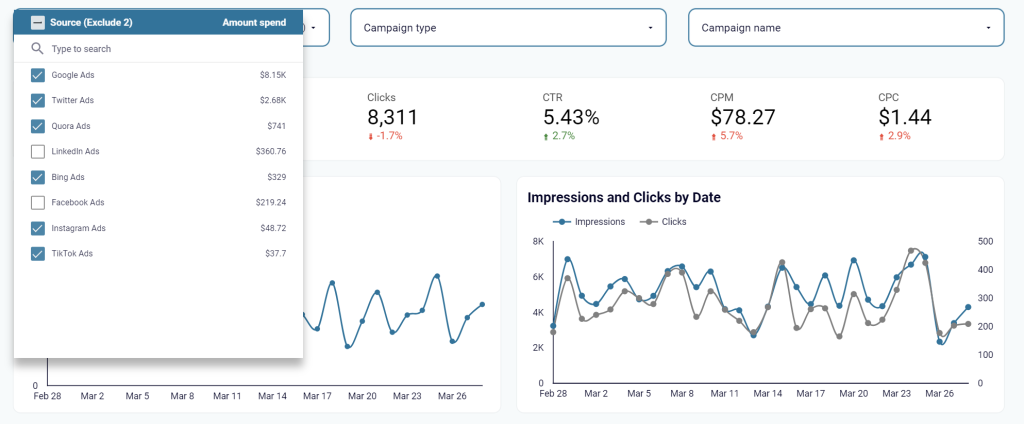
Performance absolute metrics
The range of metrics on your PPC analytics dashboard can be different but it’s important to display the major ones using scorecards like this.
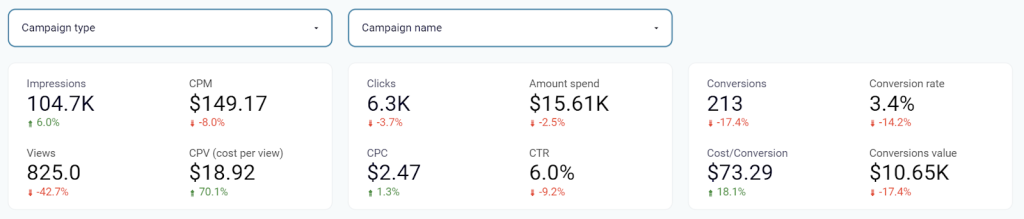
This way, you have a performance overview at your fingertips and see the overall picture of how things are going with ad spend, conversion rate, and other KPIs.
Metric trends over time
You may know the total number of conversions, but it’s also important to know the dynamics of this and other PPC metrics over time. Tracking the progress of the number of clicks, CPC, and other PPC data allows you to analyze your activity and detect patterns to reuse or avoid in the future.
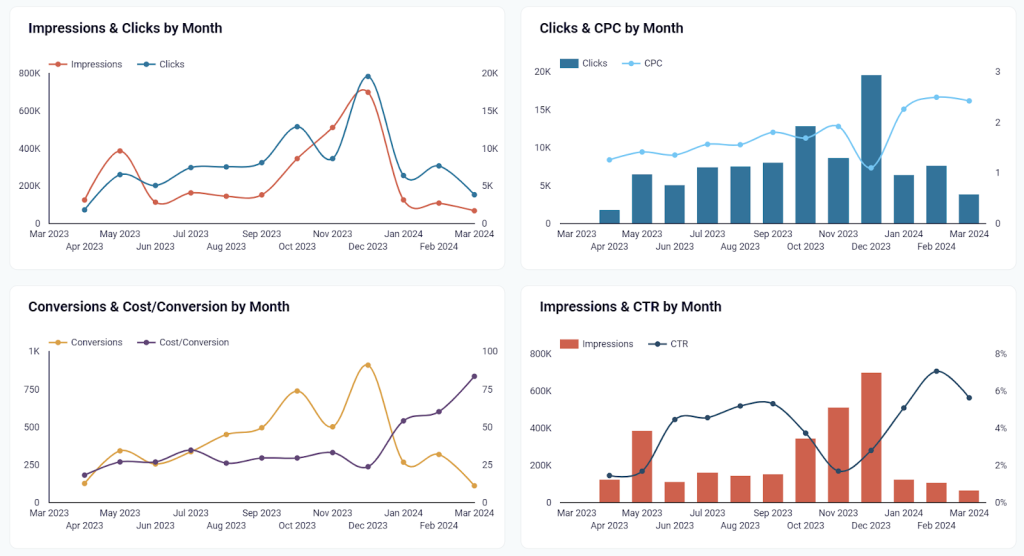
Data visualization of trends can be done with the help of line or bar charts.
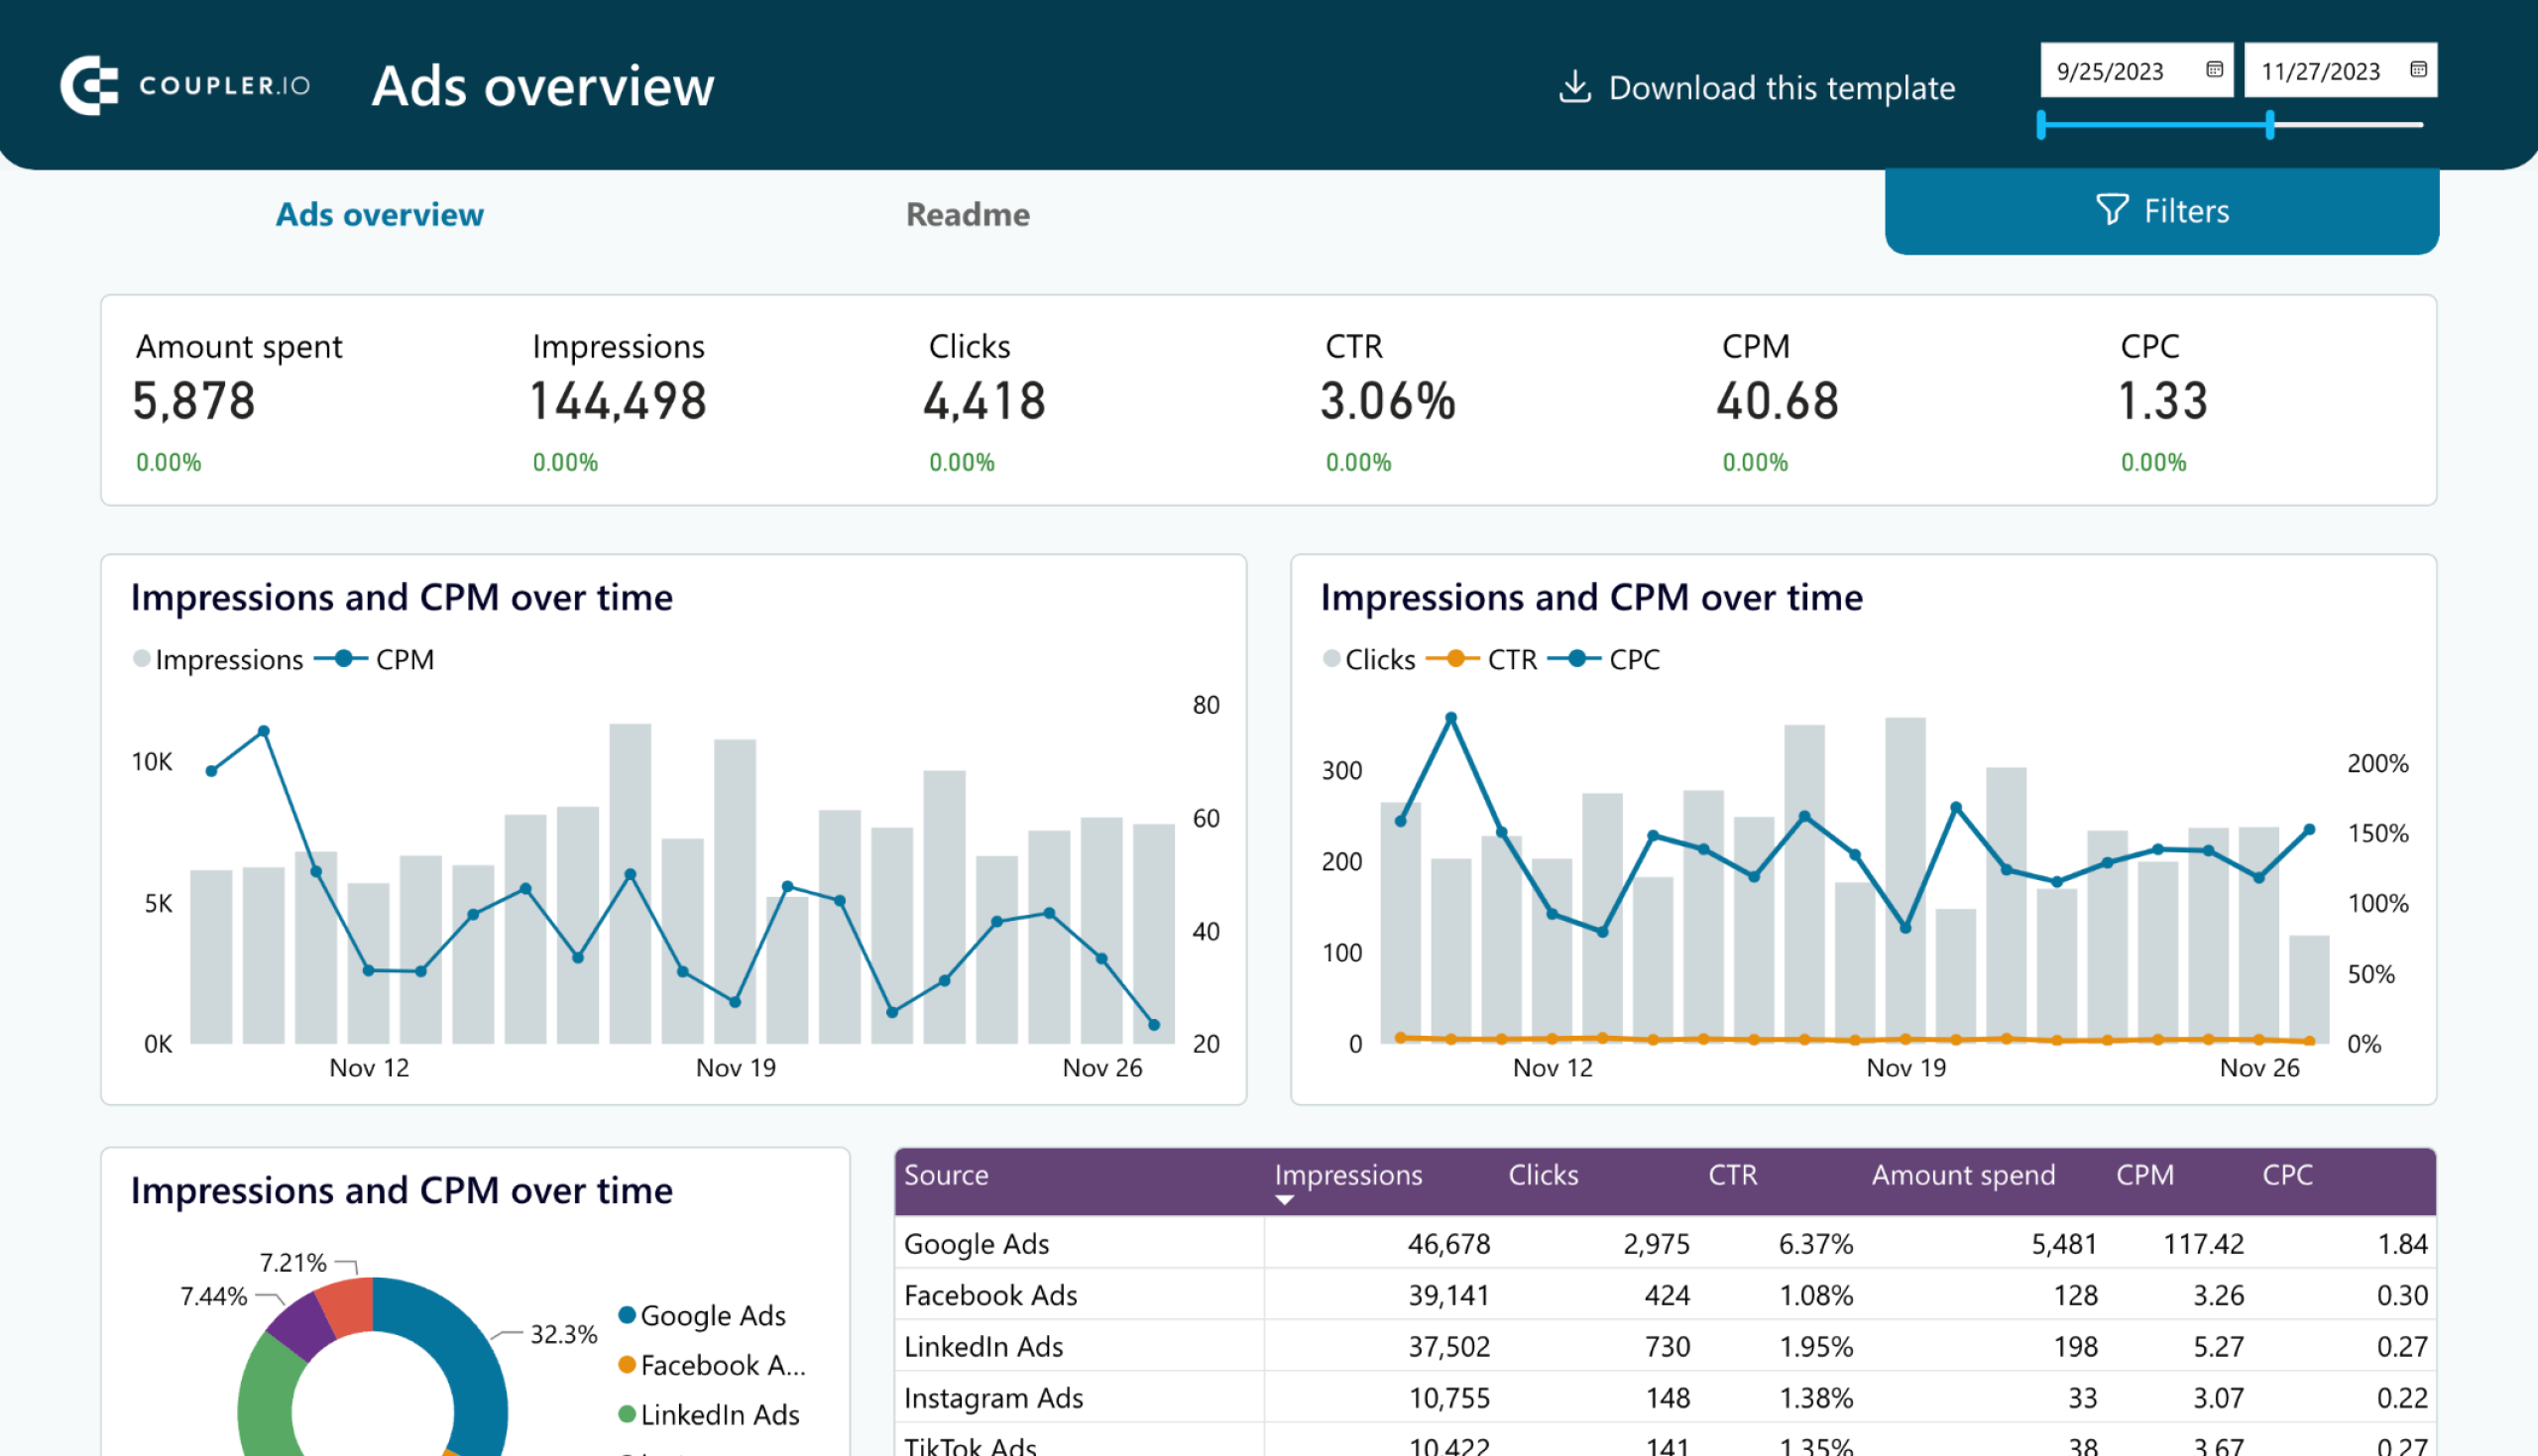
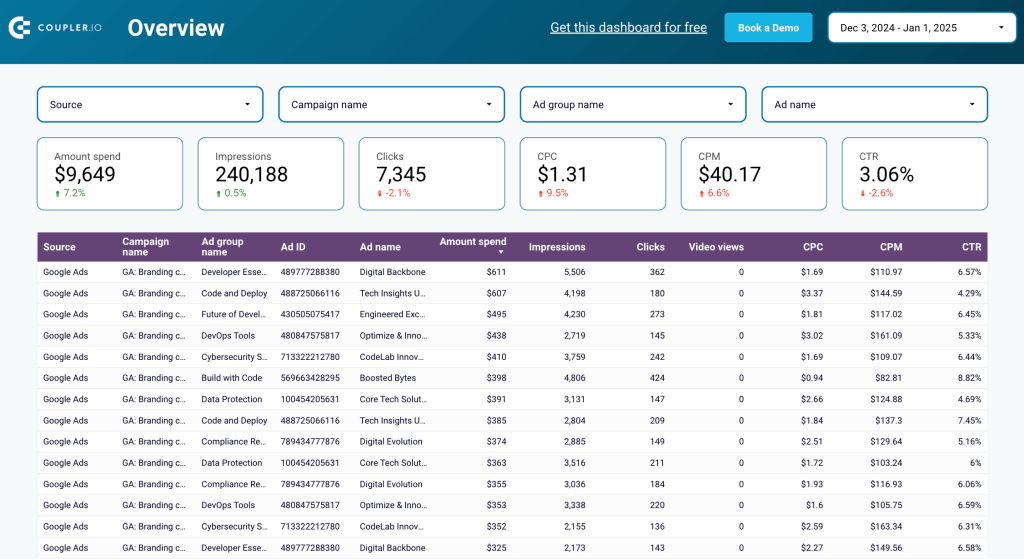
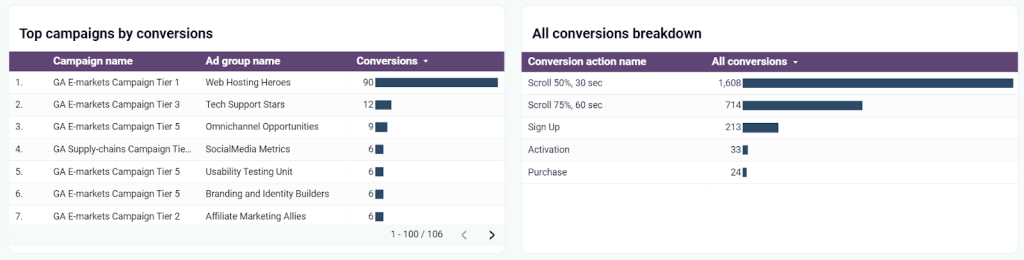
Campaign performance drill-down
Drill-down tables allow you to zoom in on the overall performance of all marketing campaigns. On a table like this, you can see a breakdown of advertising campaigns and their results. This helps you easily detect the most and least well performers to optimize your marketing effort.
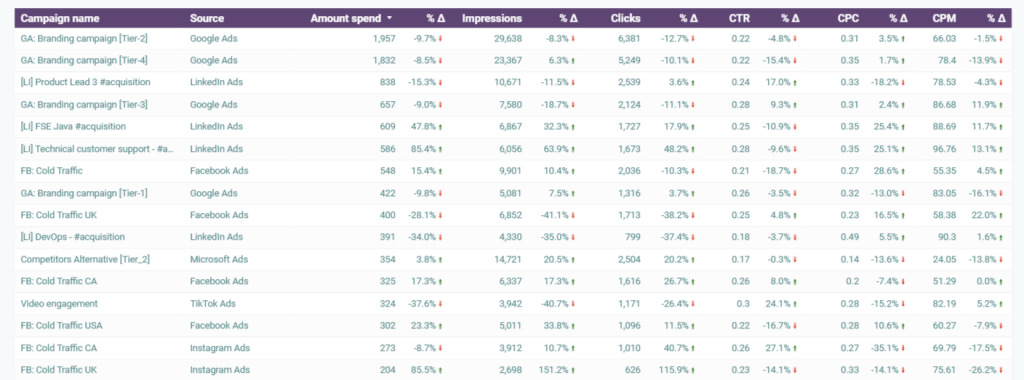
Top selections or comparisons
On a drill-down table, you can filter top campaigns by the required metrics. But it’s more convenient to have a top selection or comparison in a separate chart or graph like this.
Filters
Speaking of filters. A good PPC dashboard should have them so you can easily navigate the insights provided by the report. For a multichannel PPC dashboard, a filter is a must-have feature since you’ll need the capability to filter out data by advertising channels.
Who should use PPC dashboards?
Marketers are the most obvious beneficiaries of PPC dashboards and insights that they can provide. This could be PPC experts, marketing and content managers, and even marketing agencies. The latter can even use PPC dashboards to present results to their clients.
In addition to marketers, product managers and business analysts will also benefit from what a PPC dashboard can offer.
When you need a PPC dashboard
The simple answer is that it’s good to have a PPC marketing dashboard when you start launching your pay-per-click campaigns. In this case, you have a tool to track their performance and can keep your finger on the pulse. If anything goes wrong, you’ll be able to spot this without any delays.
However, many marketers recall this analytics and reporting tool when their campaigns are already in progress. And it’s not bad since their advertising channels already have historical data to load to your PPC dashboard for analysis.
The importance of a PPC dashboard for your marketing reporting
The chances are you’ve already made up your mind about having a PPC dashboard for your project now. However, if you’re still hesitating, then ask yourself the following questions:
- Do you want to increase the conversions of your ad campaigns?
- Do you want to spend your advertising budget wisely and efficiently?
- Do you want to spend time on other things rather than building reports?
If the answer to all of these questions is YES, then a PPC dashboard is a must-have tool for you. The only challenge left is to choose the best one.
Try our multichannel PPC dashboard right away
Try for free


