If you’re looking to create an MRR dashboard, then you already have some customers. Congratulations on that achievement! Now, let’s discover how to make sense of those revenue numbers.

What is an MRR dashboard?
An MRR dashboard displays recurring revenue for subscription-based products measured on a monthly basis. It represents steady, predictable income that can be expected regularly.
MRR is a fundamental metric for SaaS businesses, offering a clear view of future revenue potential. So, visualizing it as a CEO dashboard might be a forward-looking practice for your organization. You can use it to identify areas for improvement and make informed strategic decisions to ensure sustained revenue growth.
How do you calculate MRR?
To get an accurate picture of monthly recurring revenue, you should look beyond immediate cash flow. One method is to multiply the number of monthly subscribers by the average revenue per user (ARPU):
ARPU = Total revenue / Number of actual users in that duration
Let’s say you offer two subscription plans: personal for $100 and business for $400 per month. If you have 10 personal and 5 business users, you’ll get the following:
ARPU = (100*10+400*5)/15=200
We’ll calculate monthly recurring revenue using the formula:MRR = Number of subscribers under a monthly plan * ARPU
So if you have 100 subscribers with an ARPU of $200, MRR will be:
100 * 200 = 20 000
The calculation takes another form regarding quarterly, annual, or two-year subscriptions. For example, in the case of yearly plans, it looks like this:
MRR = (Annual subscription price / 12) * Number of customers subscribed to the annual plan
Let’s illustrate: if 20 customers opt for your product at $2280/year, you calculate MRR as follows:
(2280 / 12) * 20 = 3800
Additionally, you can evaluate monthly recurring revenue growth. It depends on different MRR types:
- New MRR: Revenue from new customers joining your service.
- Upgrade MRR: Revenue from existing customers upgrading.
- Reactivation MRR: Revenue from returning customers.
- Churn MRR: Loss from customers canceling their subscriptions.
- Downgrade MRR: Loss from customers switching to lower-priced plans.
Here’s a corresponding formula:
MRR growth = New MRR + Upgrade MRR + Reactivation MRR ? Churn MRR ? Downgrade MRR
For instance, with a new MRR at $1000, upgrade MRR at $200, reactivation MRR at $50, churn MRR at $500, and downgrade MRR at $50, the calculation would be:
1000 + 200 + 50 ? 500 ? 50 = 700
Now, let’s overview the sources of data you need to calculate MRR.
Where can you get data for MRR calculation?
Depending on the business type, you can calculate monthly recurring revenue based on data from the following sources:
- Billing systems: Stripe, Chargebee, Braintree, and other billing systems are widely used to collect data associated with MRR. They provide detailed records of invoices and subscriptions you can leverage to monitor your monthly revenue streams.
- Accounting systems: This option is more prevalent among B2B companies that rely on cold outreach and deal with big clients. Accounting systems such as QuickBooks and Xero commonly handle large invoices and extended billing cycles typical of business-to-business transactions.
Both billing and accounting systems process data on sales, which might be easily confused with MRR. Let’s outline the difference between them next.
What is the difference between sales and MRR?
Sales refers to the total revenue a business collects within a month. For example, if you sell an annual subscription for $120, your monthly sales figure is $120.
MRR, on the other hand, is the predictable recurring revenue a business expects every month. In the case of that $120 yearly subscription, your monthly recurring revenue would be $10.
This calculation smooths out revenue recognition and accounts for subscription terms, potential churn, and delayed payments. It also adapts to models where revenue might vary, like pay-as-you-go or volume-based services.
What is the relationship between active subscribers and MRR?
Active subscribers reflect the total number of users with paid subscriptions at the end of each interval, such as a month. This metric lets you evaluate efforts to reduce churn and attract new customers. The calculation of active subscribers includes any active or past-due subscription with at least one paid invoice. Subscriptions in trial or unpaid states don’t count.
Let’s consider a practical example of how active subscribers impact MRR. Suppose your company offers a monthly subscription plan at $50 per month, and you have 100 active subscribers. This means your monthly recurring revenue is:
100 * ARPU of $50 = $5000
Now, let’s say you decide to raise prices by 10%. After that, the monthly plan costs $55. At the same time, you may experience a higher churn rate. For instance, 5 subscribers might cancel their subscription due to the price hike. This leaves you with 95 active subscribers. In this case, your MRR will be:
95 * ARPU of $55 = $5225
So, despite losing subscribers, monthly recurring revenue increased due to higher ARPU compensating for the loss. Nevertheless, if the churn rate continues to rise and surpasses the rate of new subscriber acquisition, it could lead to a decline in MRR over time. So, you should monitor both metrics closely to grow your revenue in the long-term perspective.
What else affects MRR?
Other factors that influence monthly recurring revenue include:
- Expansion: There’s a surge in MRR when existing subscriptions are switched to a higher-tier plan, quantities are increased, or discounts are reduced.
- Contractions: These occur when subscriptions are modified in a way that decreases revenue. Actions such as plan downgrades, quantity reductions, or discount increases can all shrink your MRR.
- Churn: This is the case when a customer cancels their subscription, downgrades it to a free one, or fails to pay on time.
- Subscriber growth: Monthly recurring revenue goes up when paid subscriptions outweigh the number of churned subscribers.
- Average revenue per user: An uptick in ARPU signifies healthy MRR growth. It indicates that subscribers are spending more on average.
- Lifetime value: Revenue trends are correlated with LTV, which is the overall value derived from customers over their entire relationship with the business.
Challenges with MRR calculation


You might face several challenges in calculating monthly recurring revenue:
Data integrity
You need accurate and consistent data to calculate your MRR ??correctly. However, manual data exports from billing or accounting systems followed by imports into data visualization tools introduce the risk of data mismatches.
Coupler.io can resolve this issue by automating data transfers from source to destination and scheduling self-updates. This reporting automation solution lets you have the most recent data available for visual analytics.
Diverse subscription terms
In addition to the monthly plan, you might offer quarterly, annual, or biennial subscriptions. Each term presents unique billing cycles, which require extra effort to calculate MRR across different intervals.
You can tackle this by building a dashboard that accommodates all the variations and gives a broad outlook on recurring revenue streams.
Discounts, price changes, and churn
You must also account for discounts, track changes in subscription pricing, and consider churn rates. These factors make a tangible difference in the representation of revenue trends and overall business performance.
What tools do you use to visualize MRR?
You can visualize MRR with a wide array of tools:
Built-in dashboards
There might be dashboards available in the billing or accounting system of your choice. While these tools give a quick glimpse into monthly recurring revenue, they often lack customization. So, if you are looking for tailored data analytics, this option may fall below your expectations.
Specialized revenue optimization platforms
Alternatively, platforms like Profitwell offer a greater number of dashboards and visualizations. Accordingly, they provide a deeper level of insight into MRR. However, similar to the tools mentioned above, their customization capabilities may not satisfy the unique needs of your organization.
Third-party connector + BI tools or spreadsheets
You can use an all-in-one connector to import data from billing or accounting systems into BI tools or spreadsheet apps for further dashboard creation. Coupler.io integrates with Looker Studio, Power BI, Tableau, and Qlik, as well as Google Sheets and Excel.
These applications enable you to create interactive dashboards according to your specific preferences.
Additionally, Coupler.io allows you to enrich your analytics with relevant data from other sources, such as Google Analytics 4, advertising platforms, and CRM software.
How to visualize MRR through a dashboard

To visualize MRR with the help of a dashboard, stick to the following practices:
Include data for different periods
To understand monthly recurring revenue, you must examine your metrics over different time spans. A good MRR dashboard should let you analyze data ranging from weekly to yearly or even biennial. This way, you can spot trends, detect anomalies, and explore a broader context of revenue performance.
Compare the current period with previous ones
You don’t track MRR just by considering current figures. It’s crucial to compare the ongoing period with previous ones to check revenue growth and the impact of your strategies. For example, you can contrast data from this month, quarter, or year with figures from previous respective periods.
Monitor dependency between active subscriptions and MRR
As mentioned earlier, monthly recurring revenue is a dynamic metric influenced by various factors, including the number of active subscriptions. Visualize your data in a way that allows you to monitor the interplay between active subscriptions and MRR. By doing so, you’ll be able to discover correlations and proactively adapt your strategies.
Public MRR dashboard


If you’re building in public and want to display your monthly recurring revenue, here’s what to do:
- Create a dashboard in Looker Studio using data imported with Coupler.io.
- Duplicate the file to share it publicly and remove unnecessary details.
- Click the Share button and set the link settings to Public.

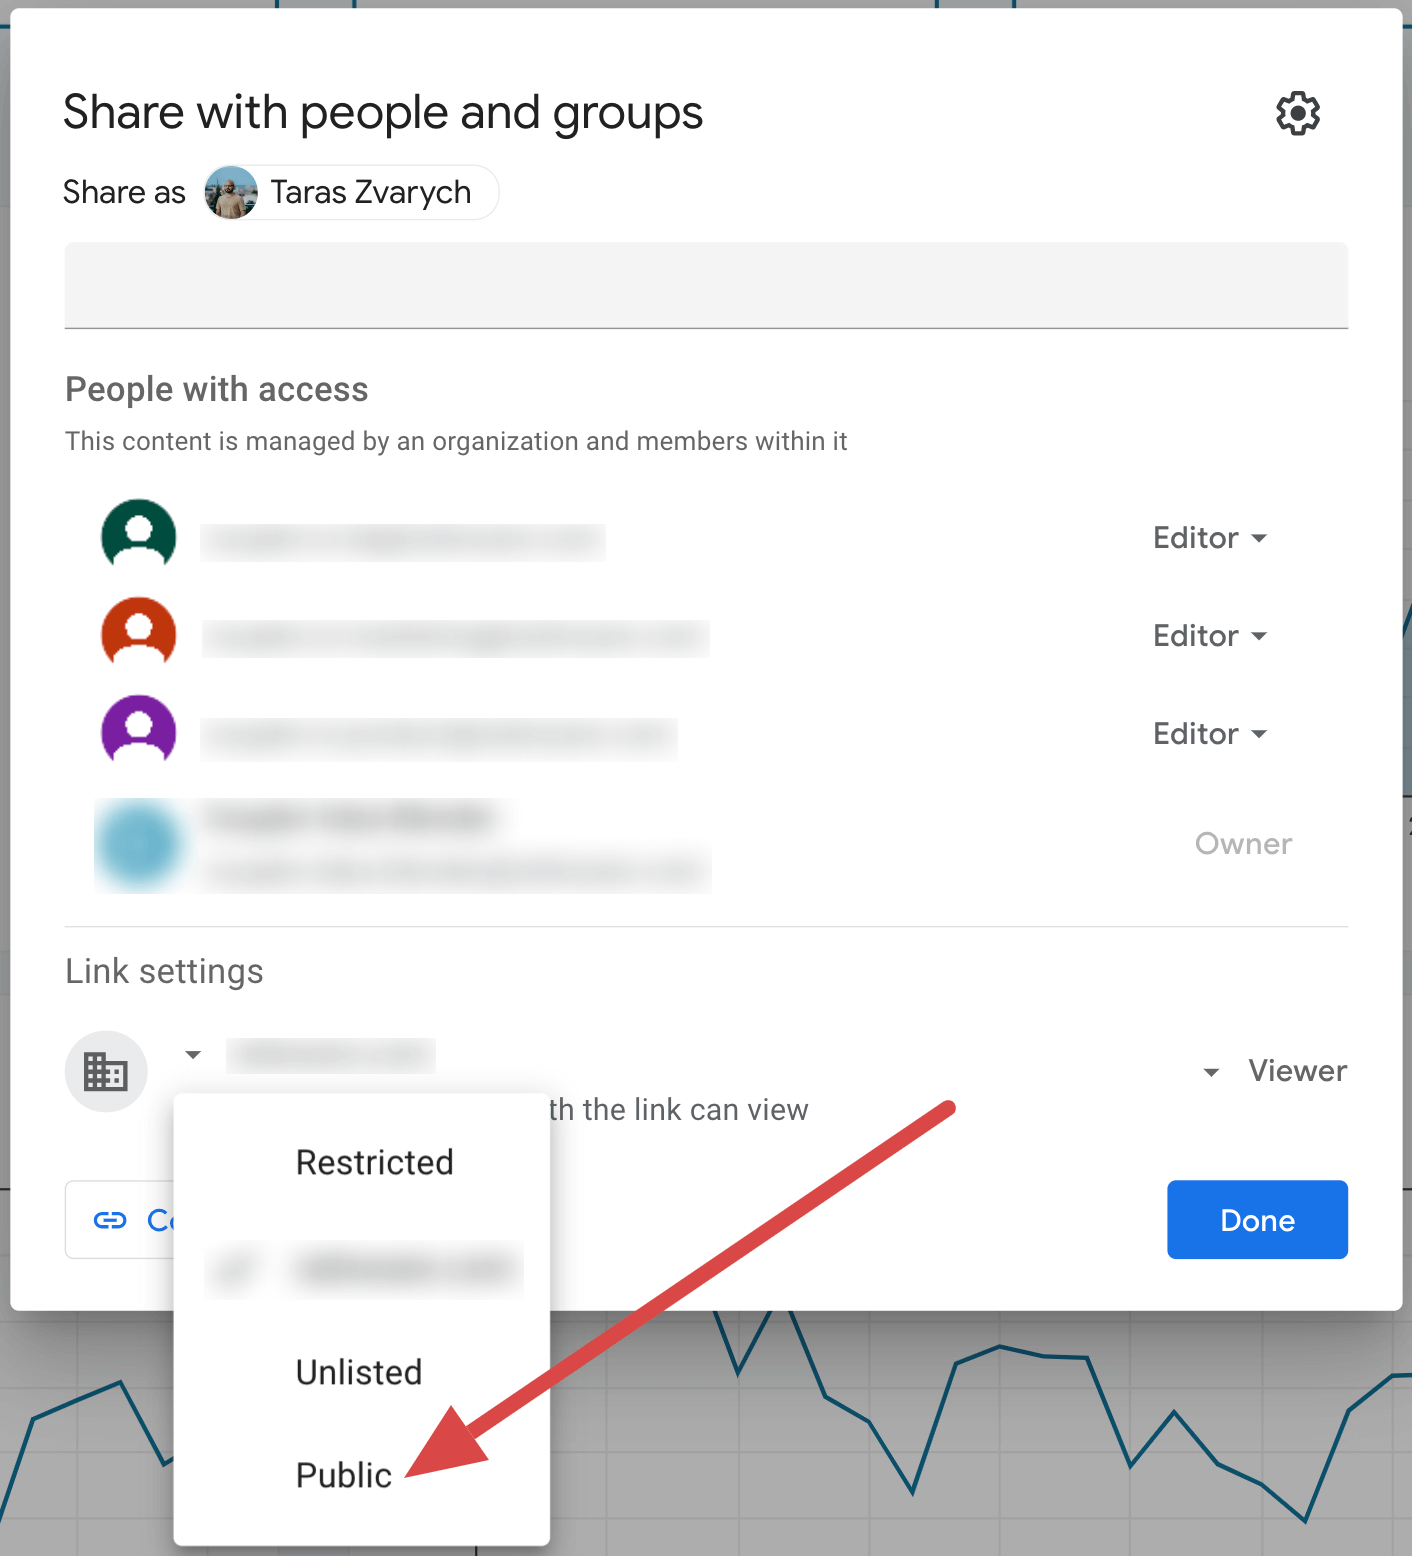
By following these steps, you’ll have an automatically updated dashboard that anyone can view.
Why do you need an MRR dashboard?


To wrap up, let’s go over the benefits you get from MRR dashboard creation:
- Have projections at your fingertips: Thanks to visual analytics, you can make accurate forecasts about revenue and plan strategically for the future.
- Empower teams with clear goals: MRR dashboards make it easier to track progress towards targets. It can motivate your teams to perform at their best and achieve tangible results.
- Understand marketing teams’ impact: With a clear idea of how marketing campaigns drive revenue growth, you can optimize your marketing strategies and allocate resources effectively.
- Evaluate the outcome of product changes: Using a dynamic dashboard lets you monitor the effects of product updates on monthly recurring revenue.
As you track MRR using a dashboard, soaring charts will lift your spirits, while flat ones can provoke concern. Yet, keep in mind: it’s just a snapshot of your outcomes, which you can achieve through persistent effort only.