
Using a SaaS dashboard can be the key tool you need to display your desired metrics for your business. It helps you derive essential insights into your business operations and can drive your decision-making potential.
However, it is crucial to know how to construct the perfect SaaS dashboard, that is, one tailored to your unique objectives. In this article, we look at how you can start building one to best represent your data journey.
What is a SaaS dashboard?
So, first things first, what is a SaaS dashboard?
A SaaS dashboard is a management tool typically used by companies to conceptualize data and provide the insights necessary to make important decisions that can keep your business afloat in its competitive market. It gives you an overview of what is happening so you can understand why and what you should do.
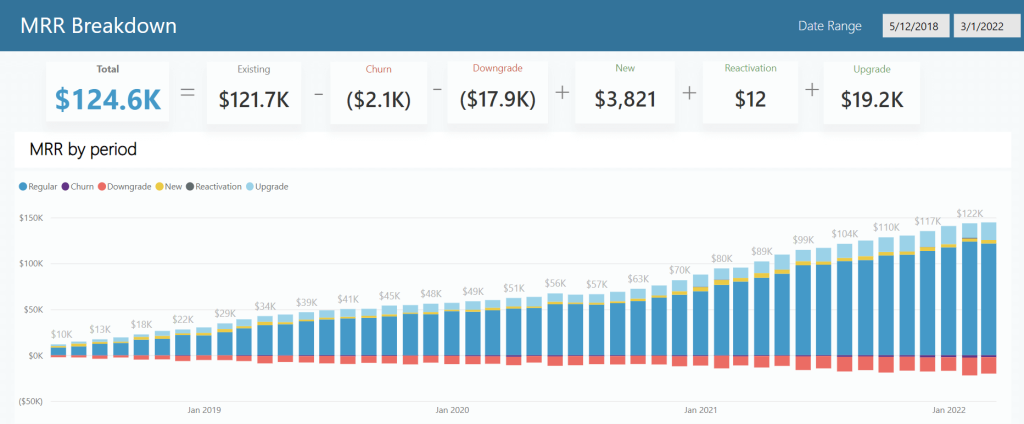
A SaaS dashboard collects relevant business metrics, such as churn, customer retention, awareness, monthly recurring revenue, etc., allowing you to visualize data and monitor the overall progress of your KPIs. Here is an example of a dashboard displaying the process of monthly recurring revenue over time.

Why do you need a SaaS dashboard?
A SaaS dashboard does a great job of visualizing your metrics, but how do you know if these boards are right for you? Let’s have a look at the advantages they can provide:
- Give you a clear picture of where your business is going. You can discover if your business is heading in the right direction, failing, or how satisfied your customers are simply by looking at concise visual diagrams.
- Gather all your most valuable insights in one place, so that decision-making is supported by transparency.
- Quickly discover problems or errors in understanding customer behavior.
- Track the results of the changes implemented in UX or marketing to see their effect on customer conversion rates.
- Capture data and represent it in a visually appealing manner so that data is easier to read and understand.
- Help you make key business decisions because of the insights you gain powered by your data.
What should be on a SaaS dashboard?
When deciding what an ideal SaaS dashboard looks like, consider the metrics you should be monitoring. Since there are many SaaS metrics in general, putting all of them on a single dashboard would be inefficient. Therefore, it makes sense to group metrics per each specific area of your activities and hence build separate analytics dashboards. Here are the two groups of metrics that you can consider:
- SaaS product analytics metrics include monthly or annual recurring revenue (MRR or ARR), customer lifetime value (CLTV), churn and retention rate, etc.
- SaaS marketing analytics metrics that show the performance of each marketing channel.
Of course, you can categorize the metrics in a custom way depending on your SaaS product specifics and requirements. Anyway, the efficiency and relevance of any SaaS dashboard rest on the data (metrics) displayed on it. What you choose to focus on in this final view is up to you. However, this information should be clear and informative.
How to build a dashboard for SaaS
Developing a SaaS dashboard can be a long and complicated process. Let’s consider the steps that you should take to build a board that truly benefits your business:
- Define the metrics that you would like to monitor on your dashboard. They can range from revenue, recurring expenses, customer satisfaction, and so on. However, because of the large volume of data that your business handles, it can be daunting to filter this information correctly.
You will also need to consider the audience for these metrics: who will be using the data, how much information should be accessible, and so on.
- Select a data visualization tool for your dashboard. Your choice should rest on different requirements from your budget to the availability of some specific functionalities. The top three data visualization tools are Google Looker Studio (former Data Studio), Microsoft Power BI, and Tableau. But you can also opt for their younger competitors like Klipfolio, Domo, Zoho Analytics, and others.
Some of the tools provide ready-to-use templates or dashboards that you can easily customize for your needs. This can also be an option for your SaaS analytics.
- Define the sources of the data you want to display or use for metrics calculations. This step also includes finding a way to connect sources to the chosen data visualization tool for real-time or scheduled data refresh. Automation of the data flow for your dashboard will let you keep the data up-to-date. Without automation, you leave room for errors, inconsistencies, and confusion that will be detrimental to your decision-making process.
It’s also likely that you will need to pull data from a variety of applications, so pay attention to your data integrations and the value they provide. The best practice here is to avoid collecting redundant, useless data.
- Figure out who is going to be involved in the SaaS dashboard creation process. If you are a Jack of all trades in your SaaS startup, then you will probably be the only one here. In bigger projects, however, several people take part in this process. For example, a marketing expert can define the metrics to display; a designer can share suggestions on the visual side of the dashboard; a data analyst is the one who actually builds the dashboard considering the inputs from other experts.
During this step, you’ll have to answer many questions, such as:
- How would you like your dashboard to look?
- How interactive will it be?
- What kind of charts, graphs, and other visual elements will come into play?
- What kind of calculations and formulas will you use to generate your insights?
- And so on.
The process of building a SaaS dashboard is complicated and, hence, requires plenty of resources employed. In many cases, it’s even more efficient to hire an expert who will manage the creation of a dashboard, from defining metrics to helping you extract valuable insights from the data.
When you should hire an expert to build a dashboard for SaaS
If you do not have enough expertise or resources (for example, a data analyst in your team) to complete all the above-mentioned steps, then you should use a third-party expert service to build a dashboard for SaaS. This is the most efficient option since you will get an actionable ready-to-use analytical solution in a relatively short time.
Coupler.io, a data analytics and automation platform, provides data analytics services to cope with different data management tasks, including building interactive SaaS dashboards. The expert service is represented by a squad of experienced data analysts who can integrate your raw data and visualize it on an advanced analytical board designed according to your requirements.
They will integrate your raw data and visualize it on an advanced analytical dashboard. You will also get assistance at each step of the dashboard creation process, from defining metrics to tweaking the designing of your final data visualization.
You can also get comprehensive guidance on how to make the right decisions based on your data.
What benefits you get with a third-party data analytics service
Coupler.io data analytics and consultancy service can help you achieve several added benefits:
- A single source of truth. Your data is integrated into one repository, allowing you to make better data-driven decisions for business scalability.
- The ability to gauge the real impact of your KPIs.
- Total data transparency.
- A holistic overview of your data story.
- The ability to build an interactive and actionable dashboard for SaaS.
- The insight necessary to analyze your current metrics and effectively plan your data-led expansion.
- The guidelines you need to act on your current business metrics and stimulate growth.
When you should build a SaaS dashboard yourself
Mature SaaS businesses usually have one or a few data analysts on the board, so they do not have this dilemma in mind. They build dashboards and perform other analytics tasks in-house.
Smaller companies and even startups cannot afford this type of expert in their teams. So, they mostly try to do things on their own or hire data experts.
If you are confident in your expertise, you can always try your hand at constructing your own dashboard. We even provided a few guides for building a dashboard using different tools:
- How to build a dashboard in Airtable
- How to build a dashboard in Data Studio
- How to build a dashboard in Tableau
However, you should understand the complexity of the process and effort it takes to do this on your own.
How long does it take to develop a dashboard?
If you assign this task to third-party experts, the overall process of its creation can take a couple of weeks depending on the complexity of the expected SaaS dashboard.
Building a dashboard in-house can take a couple of months if no data analytics expert is involved. Why so long? The actual building of a dashboard won’t be lingering itself. However, there is a high chance that you’ll need to tune the dashboard’s punch items on the go during a long time span. These punch items may include missing metrics, improper visualizations chosen, calculation errors, design loose ends, etc. Of course, eventually, you can get the perfect analytics dashboard that you intend to build. However, the resources spent on wrapping it up with your own hands can be unviable.
How much a dashboard costs
Each particular SaaS dashboard is a custom project that has its requirements and specifications. There is no fixed price for a marketing or sales SaaS dashboard that you can rely on. In most cases, the following parameters affect the price of your SaaS dashboard:
- Number of metrics
- Number of data sources
- BI tool
- Dashboard design
- Interactive features used
- Custom fields
- Prediction model implemented
An SaaS dashboard in Google Sheets built only atop of data pulled from Google Analytics will cost less than a powerful interactive dashboard integrated with multiple sources and visualized in Power BI.
SaaS dashboard examples
What can your perfect dashboard look like? It can be a spreadsheet with some formulas and conditional formatting to highlight target metrics. Or it can be a set of fancy data visualizations that can help you easily track any changes. Let’s take a look at different forms and types of SaaS dashboards that you can rely on.
SaaS marketing dashboard
A SaaS marketing dashboard gives you the insights you need into your marketing metrics. Such dashboards can show the marketing performance per channel or an overview of the marketing activities in your SaaS product. For this example, we chose the SaaS marketing dashboard designed in Google Looker Studio – the PPC multi-channel report.

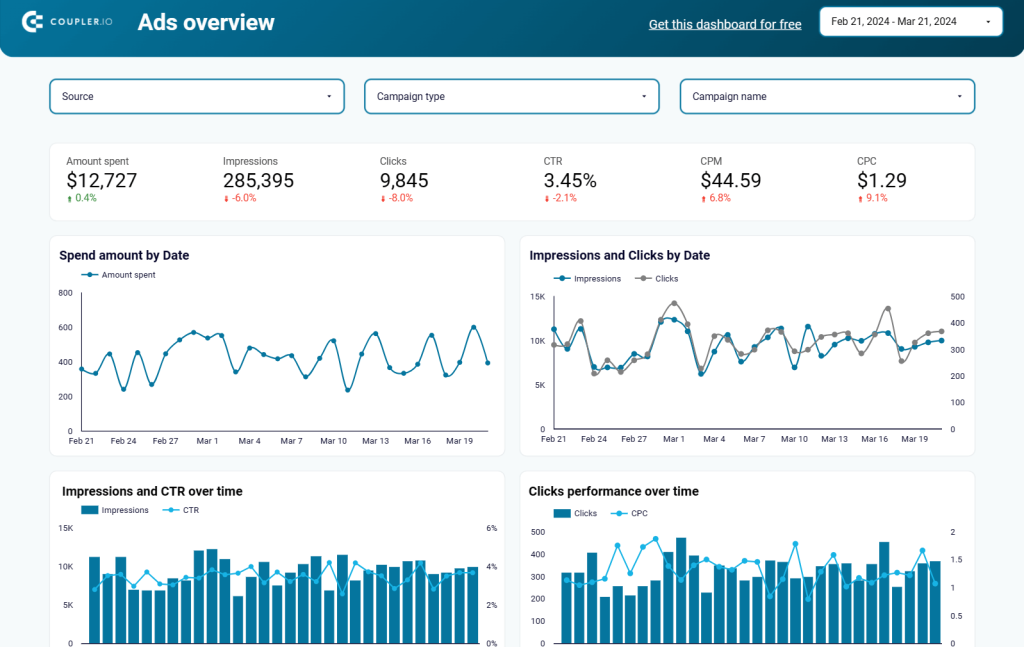
This marketing dashboard is meant to optimize your PPC strategy by analyzing your campaign performance on specific channels such as Google Ads, Facebook Ads, TikTok Ads, and others.
Key metrics for a SaaS marketing dashboard
- Amount spent – how much you spent in total for running advertising campaigns. It’s crucial to track the amount spent so as not to overbudget your marketing effort.
- Total impressions – how many times your advertisement was shown to users. This metric helps you determine the efficiency of your budget and the exact ad placements where your target audience is coming from.
- Total clicks – how many times users clicked on your advertisement. This value lets you understand whether the ad is engaging enough to induce users to make a click or not.
- CTR (clickthrough rate) – the ratio of clicks to impressions. Clickthrough rate shows how well your ads perform to compel the audience to click. Low CTR means that you need to change your ad creatives, CTA, or targeting.
- CPM – how much every thousand impressions cost. You need to track the cost of showing your ads to users. Low CPM indicates that you spent less to reach a thousand impressions. It also makes sense to compare this metric among your advertisements.
- CPC – how much every click costs. This metric helps you optimize your bid strategy and plan your advertising budget. Low CPC indicates that each click costs less which increases the cost-efficiency of your ads.
SaaS analytics dashboard
SaaS analytics dashboard is a general notion since each SaaS dashboard is meant for analytics. However, you can have an analytical overview of your SaaS business implemented on the dashboard. In this case, you will have all your crucial metrics, such as MRR, LTV, CAC, and others, in one place.
For example, here is what a SaaS analytics dashboard built in Tableau by Vizalytix looks like:

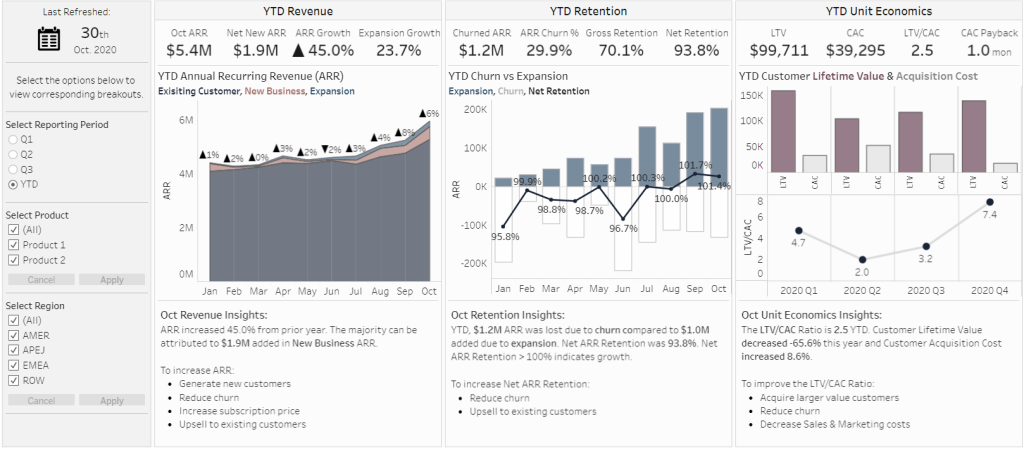
This dashboard looks at your high-level KPIs and strategic bits of data. It allows end-users to get into their real data details, by facilitating deep core investigation. In this way, business analysts can evaluate and compare metrics against your company’s historical journey.
Key metrics for a SaaS analytics dashboard
- Churn rate – the percentage of customers who stop using your SaaS product compared to the acquired customers during a specific period. Your goal is to decrease churn as much as possible since high churn rates indicate customer dissatisfaction with your product.
- Monthly recurring revenue (MRR) – the estimated revenue generated from subscriptions per month. For example, if you have 50 customers paying $50 per month, your MRR is $2,500. This metric allows you to track the financial growth of your SaaS product.
- Customer acquisition cost (CAC) – how much it costs to acquire a new customer. CAC covers marketing, sales, and other expenses that you make to acquire a customer. Your goal is to keep CAC lower than the revenue your customer brings.
- Customer lifetime value (CLTV or LTV) – the estimated total revenue a customer is expected to bring for using your product. The metric allows you to assess the long-term value of your customers during the entire relationship with your SaaS.
- Conversion rate – the percentage of converted users to the total user. Converted users are those who took a desired action, such as sign-up, purchase, etc. For example, if of 500 website visitors 50 users signed up, your conversion rate is 10%.
- Average Revenue Per User (ARPU) – the average revenue generated per active user. It’s calculated by dividing the revenue by the number of users. This metric provides insights into how much value each customer brings.
SaaS sales dashboard
Your sales dashboard gives you insight into the revenue of your SaaS business. A well-implemented dashboard of this type can monitor and examine real-time values like sales by region, lead conversion rate, sales-to-date, and more — all critical to your operational success. Here is an example of a sales KPI dashboard for Pipedrive built by Coupler.io data experts.

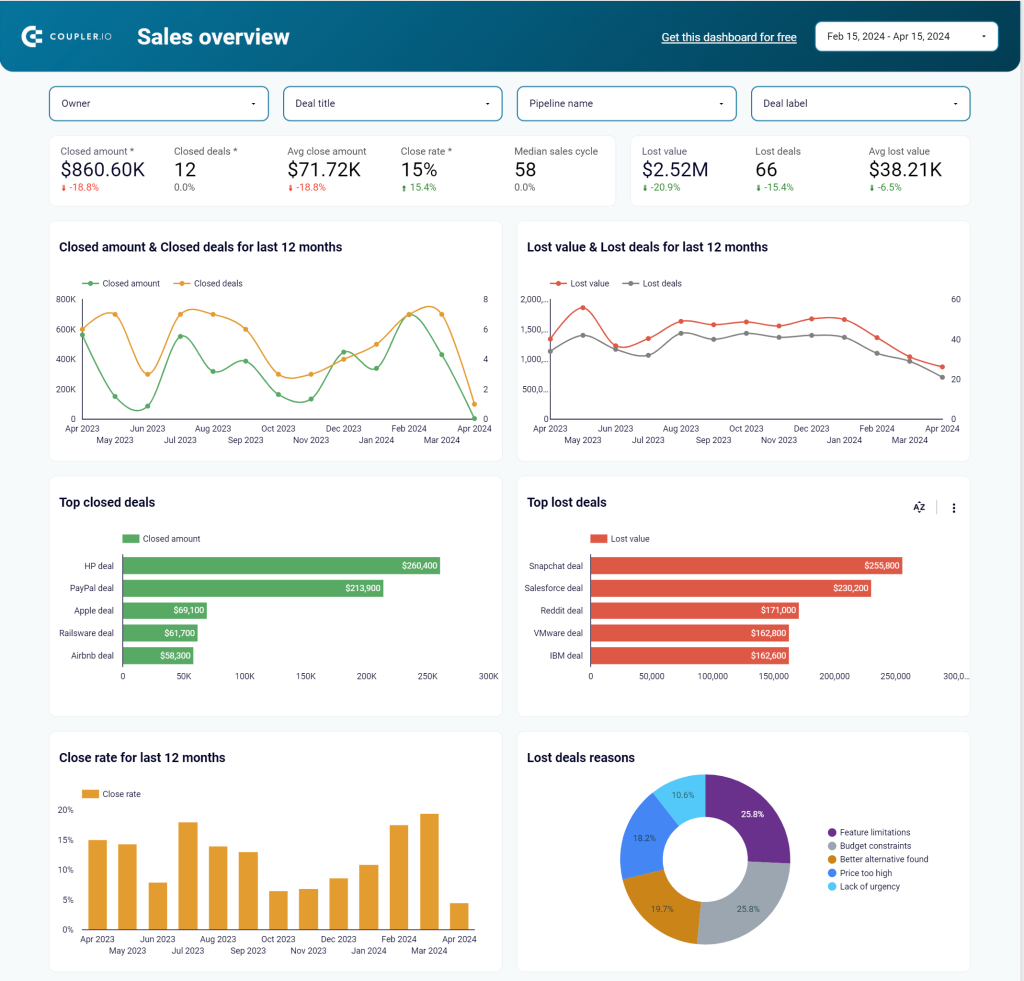
Key metrics for a SaaS sales dashboard
- Sales pipeline value – the total value of all deals currently in your sales pipeline. This metric is useful to understand the potential revenue that you can expect from pending deals.
- Sales win rate – the percentage of successfully closed deals. Sales win rate indicates the effectiveness of your sales team in converting leads into customers. The opposite metric is the lost rate which indicates the percentage of lost deals.
- Sales conversion rate – the percentage of leads that have been converted into paying customers. Your goal is to keep the sales conversion rate high which is an indicator of the effective sales process.
Finance SaaS dashboard
A finance SaaS dashboard is meant to display up-to-date information about finances, including total revenue, ROI, net income, taxes, and so on. Here is an example of a finance SaaS dashboard built by USEReady in Tableau.

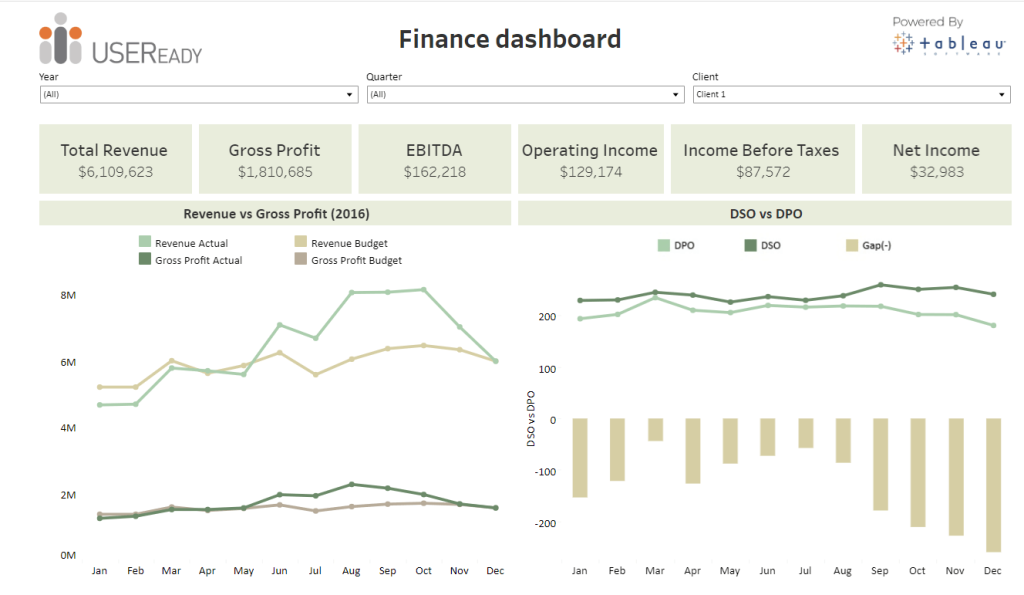
Key metrics for a finance SaaS dashboard
- Operating expenses (OpEx) – costs associated with running and maintaining your SaaS business. OpEx includes salaries, marketing expenses, software costs, and so on. The opposite metric is operating income.
- Cash flow – the net amount of cash coming in and out of your business over a specific period. Your business grows when cash flow is positive, so this metric is essential to track.
- Burn rate – the rate at which your company is spending its available cash. This metric allows you to understand how long your business can sustain its current operations before you run out of cash.
- Return on investment (ROI) – the ratio of how much income investment brings to the cost of investment. Basically, this metric shows the effectiveness of marketing campaigns, product development, and other efforts to increase revenue. The ROI formula is the following:
(Net gain from investments – cost of investments)/Cost of investments*100%
- Net income – how much money your SaaS business has after deducting all expenses. Net income represents the profitability of your business. The expenses that you need to deduct include operating expenses, taxes, and interest. Here is the net income formula:
Net Income = Total Revenue – Total Expenses
SaaS product dashboard
A SaaS product dashboard should give you insights into the product funnel from the first users who learned about your SaaS product to the ones who got back to it in some time. Here is an example of a SaaS product funnel dashboard built in Google Sheets by the Coupler.io analytics team.

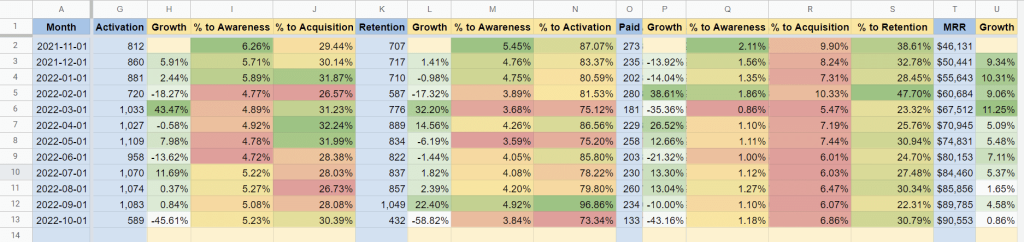
Key metrics for a SaaS product dashboard
- Daily or monthly active users (DAU/MAU) – the percentage of active users who interact with your SaaS product. Active users can be counted from a daily or monthly perspective. For example, if you have 10K registered users, and 6K of them are active (according to your activation criteria), your MAU is 60%.
- Net promoter score (NPS) – an indicator of customer satisfaction and loyalty. This metric is usually calculated by asking users how likely they are to recommend your SaaS product to others on the 0-10 scale.
- Feature adoption and usage – how frequently users interact with specific features or functionalities within your SaaS product. This metric helps you identify the most/least valuable features.
- Retention rate – the percentage of customers who continue to use your SaaS product over time. This metric indicates how well your product solves user’s problems and how effective your retention efforts are. The opposite metric is the churn rate.
- Conversion rate – the percentage of converted users to the total user. Converted users are those who completed a specific action within the product, such as activation of a certain feature, completion of the wizard, etc.
SaaS executive dashboard
Executives usually want to see high-level data that gives them a real insight into their company’s sales, expenses, and inventory. A CEO should be able to see a compelling visual report of their low, medium, and high-level key performance indicators with the aid of charts or graphs. So, what should a SaaS executive dashboard look like? Here is a plain example prepared by a Tableau Public user.

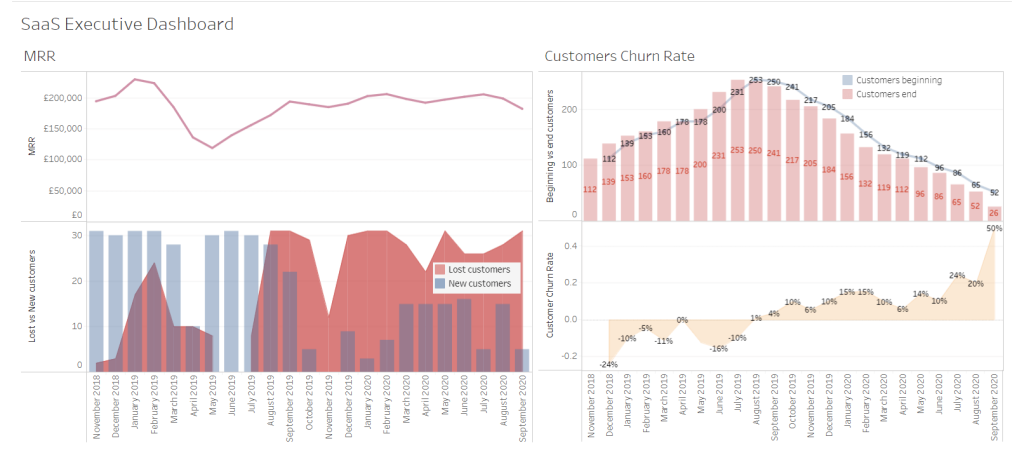
Key metrics for a SaaS executive dashboard
For an executive SaaS dashboard, the most important metrics have already been covered above, so we just repeat them here:
- Monthly recurring revenue (MRR) – the estimated revenue generated from subscriptions per month. For example, if you have 50 customers paying $50 per month, your MRR is $2,500. This metric allows you to track the financial growth of your SaaS product.
- Customer acquisition cost (CAC) – how much it costs to acquire a new customer. CAC covers marketing, sales, and other expenses that you make to acquire a customer. Your goal is to keep CAC lower than the revenue your customer brings.
- Customer lifetime value (CLTV or LTV) – the estimated total revenue a customer is expected to bring for using your product. The metric allows you to assess the long-term value of your customers during the entire relationship with your SaaS.
- Churn rate – the percentage of customers who stop using your SaaS product compared to the acquired customers during a specific period. Your goal is to decrease churn as much as possible since high churn rates indicate customer dissatisfaction with your product.
- Net promoter score (NPS) – an indicator of customer satisfaction and loyalty. This metric is usually calculated by asking users how likely they are to recommend your SaaS product to others on the 0-10 scale.
SaaS MRR dashboard
A SaaS MRR dashboard allows you to track and even predict your monthly recurring revenue. It gives you a granular view of what is happening across your business in regard to wins or losses, predicting the total revenue generated over a monthly period. We’ve already introduced an example of the SaaS MRR dashboard at the beginning of this article, but it wouldn’t go amiss to do this one more time.
By the way, data experts at Coupler.io used Power BI to make MRR dashboard.
Key metrics for a SaaS MRR dashboard
- Total MRR – the sum of all monthly recurring revenue generated from your SaaS subscriptions. Total MRR provides an assessment of your revenue growth.
- New MRR – the revenue generated from new customers for a specific period, typically a month. So, basically, to calculate new MRR, you do not consider the users that have been subscribed before the chosen period. This way, you can compare MRR dynamics for each month.
- Expansion MRR – the additional revenue generated from existing customers. Expansion MRR can be caused by subscription plan upgrade, adding users (if this is on a paid basis), limit increase, purchase of additional features, etc.
- Contraction MRR – the decrease in revenue from existing customers. This metric is opposite to expansion MRR since users can downgrade their subscription plans or reduce usage.
- Churned MRR – the revenue lost as a result of customers canceling their subscriptions or no longer renewing. For example, if 10 users each paying $90 per month decided to cancel their subscription, your churned MRR would be -$900.
- Net MRR growth – the net change in your MRR after accounting for new, expansion, contraction, and churned MRR. This metric shows the overall growth of your recurring revenue.
SaaS customer dashboard
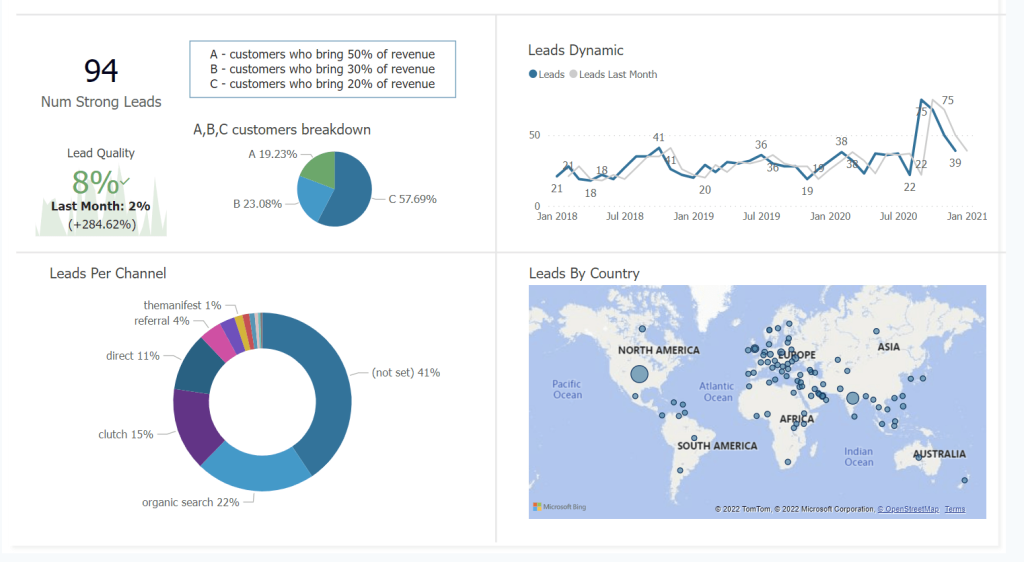
Customer dashboards allow you to look at the overall health of your customer base. With this in mind, a SaaS customer dashboard can display such metrics as the total number of leads, leads per channel, the progress of lead generation, etc. For example, check out the following SaaS customer dashboard prepared by data experts at Coupler.io. The data visualization tool used for it is Microsoft Power BI.

Key metrics for a SaaS customer dashboard
- Customer count – the number of active customers of your SaaS product. This metric simply provides a high-level view of your customer base.
- Customer acquisition rate – the rate at which you’re adding new customers to your SaaS product over a specific period. This metric is typically calculated on a monthly or quarterly basis.
- Customer churn rate – the percentage of customers who have stopped using your SaaS product. For example, if of 500 customers at the beginning of the month, 20 have canceled their subscriptions during this month, your churn rate is 4% (20/500 * 100).
- Customer lifetime value (CLTV or LTV) – the estimated total revenue a customer is expected to bring for using your product. The metric allows you to assess the long-term value of your customers during the entire relationship with your SaaS.
- Net promoter score (NPS) – an indicator of customer satisfaction and loyalty. This metric is usually calculated by asking users how likely they are to recommend your SaaS product to others on the 0-10 scale.
- Customer engagement – how actively customers are using and interacting with your SaaS product. This metric can include other metrics such as number of logins, feature usage, session duration, etc. You can specify your criteria to define the active usage of your product. For example, if 80% of your customers log in and use your product at least once a week, this can be a strong customer engagement.
Do you need a dashboard or not?
If you want to make decisions regarding your SaaS business based on data analysis rather than gut feeling, then you definitely need a SaaS dashboard. It may be difficult to construct the right dashboard for you and your team. However, building your SaaS dashboard and getting the data you need for business success has now become less of a challenge.
By implementing the data analytics and consultancy service from Coupler.io into your workflows, you gain the infrastructure to support your data and scale your business to new heights. You can build a SaaS board capable of elevating your decision-making potential by tapping into data you did not even know existed.
We can also help you manage your data and guide you along your data journey by using proven concepts, expertise, and analytical best practices to propel your business forward.
So, if you would also like to focus solely on your business objectives, then leave the data analytics bit up to us. Reach out, and together, we can start making a beautiful story from your data.