Different methods to export data from Clockify
- With a no-code tool for automated exports: With Coupler.io, you can schedule exports from Clockify to one of your preferred destinations, including spreadsheets, business intelligence (BI) tools, and data warehouses. It takes only a few minutes to automate data exports and you don’t need to have any tech skills. This way you can build live reports and self-updating dashboards without any hassle.
- Exports through the API for more customization: This is a good option for users who have a tech background and want to build a custom solution. With this method, you can integrate Clockify with other apps, export data automatically on a schedule, add tailored functionality, and so on. However, working with the Clockify API requires coding skills and is not suitable for business users.
- Manually from Clockify: Lastly, Clockify also allows manual exports. However, you can only export data in a CSV or Excel format. Also, since it is a manual export, you can’t schedule updates or automate this process. It is a good option for a one-time-only report. Depending on your subscription plan you can export more data or customizable reports.
As you can see, Coupler.io offers the simplest and most convenient way to export data from Clockify on a schedule. Let’s check out how it works and learn about the available destinations and the data types you can retrieve from Clockify.
How to set up an automated export of Clockify data on a schedule?
Step 1: Collect Clockify data
From the form below, select your preferred destination and click Proceed.

Connect to your Coupler.io account or create one for free.
Select the report type you want to export – Summary, Weekly, or Detailed.
Next, add your Clockify workspace ID and API key. If you don’t know where to copy them from, just expand the hints under the corresponding fields for the simple instructions.

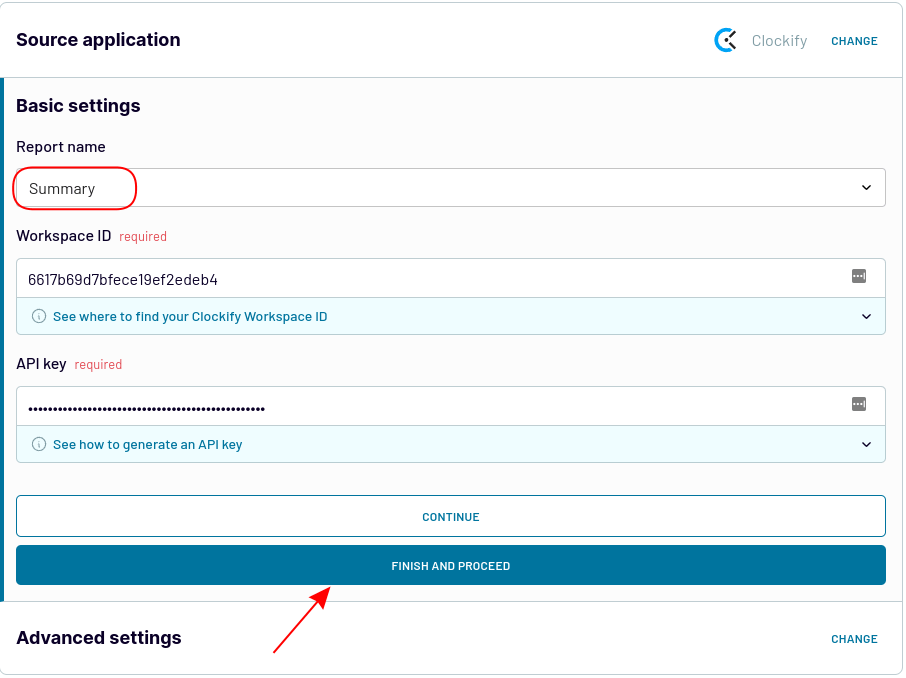
Once ready, click Finish and Proceed.
Step 2: Transform and organize data
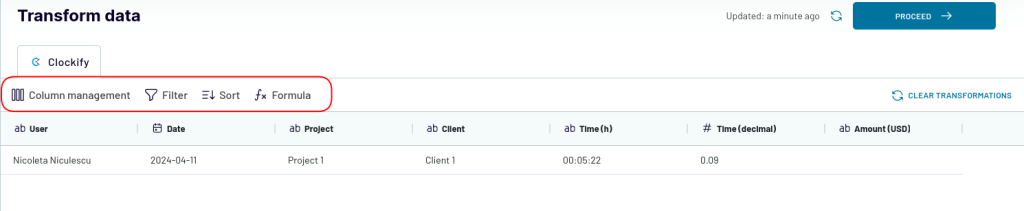
Now, you can see the data you are going to export. If needed, you can perform various transformations:
- Column management: You can hide unnecessary columns, as well as rename, merge, split, and rearrange columns.
- Sorting or filtering data: Apply advanced filters based on AND/OR criteria and perform sorting.
- Blending and joining data from various sources: Coupler.io allows you to merge data from several accounts or different apps in a single dataset.
- Using formulas: Add formula-based columns and perform calculations.

After you transform the data (optional), click on Proceed. Next, follow the on-screen instructions to connect your destination account.
Step 3: Schedule updates


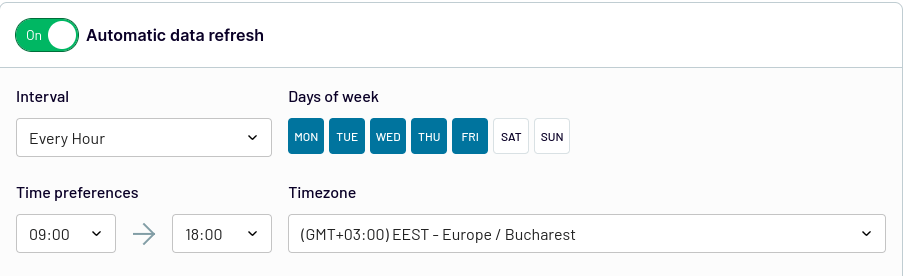
Last but definitely not least, you can schedule updates. Toggle on the Automatic data refresh option to set up a schedule for your Clockify exports. Coupler.io allows you to refresh your data as often as every 15 minutes.
Depending on your needs, select the Interval, days of the week, time preferences, and timezone, and then click on Run Importer to finalize your export.
In a few moments, your data will be exported to your preferred destination.
What data can be exported by Coupler.io from Clockify?
Coupler.io provides three report types for Clockify: Summary, Weekly, and Detailed. Let’s take a look at the data you can export for each report.
| Report type | Data exported | Use case |
| Summary | Amount (USD) Clients Dates Projects Time Users | This report offers a summarized overview of the tracked time across projects, clients, and tasks within a selected time frame. |
| Detailed | Billable Amount (USD) Billable Rate (USD) Clients Description Duration (decimal) Duration (h) End Date End Time Group Project Start Date Start Time Tags Task User | The detailed report provides a more comprehensive overview of the projects. It offers granular details that go beyond the aggregated data found in summary reports. |
| Weekly | Amount Client Project Total User Date | This type of report is designed to give a quick overview of where time was spent during a specific week, making it easy to monitor progress and manage workloads. |
What are the supported destinations to import Clockify data into?
| Category | Supported destinations | Use case |
| BI and data visualization | Power BI Looker Studio Tableau Qlik | These destinations provide advanced data analytics and visualization capabilities. You can create self-updating dashboards for time-tracking and project management. |
| Spreadsheets | Google Sheets Microsoft Excel | Easy to use and great for small datasets, spreadsheets can be used for performing calculations, custom reporting, and time-tracking. |
| Data warehouses | BigQuery PostgreSQL Redshift | These tools are a great solution for backing up your data as well as for performing advanced analysis. Choose one of these platforms for large datasets. |
| Others | JSONMonday.com | If you need to add Clockify data to a different destination, you can export it in a JSON format and import data into the tool of your choice. Transferring your data to Monday.com helps you manage your projects. |
Extra tip: How to visualize data from Clockify in 3 minutes
While it’s really easy to export data from Clockify on a schedule, it’s far more complicated and time-consuming to build a time-tracking dashboard from scratch. Fortunately, Coupler.io also provides a ready-made Clockify dashboard template for Looker Studio and Google Sheets.
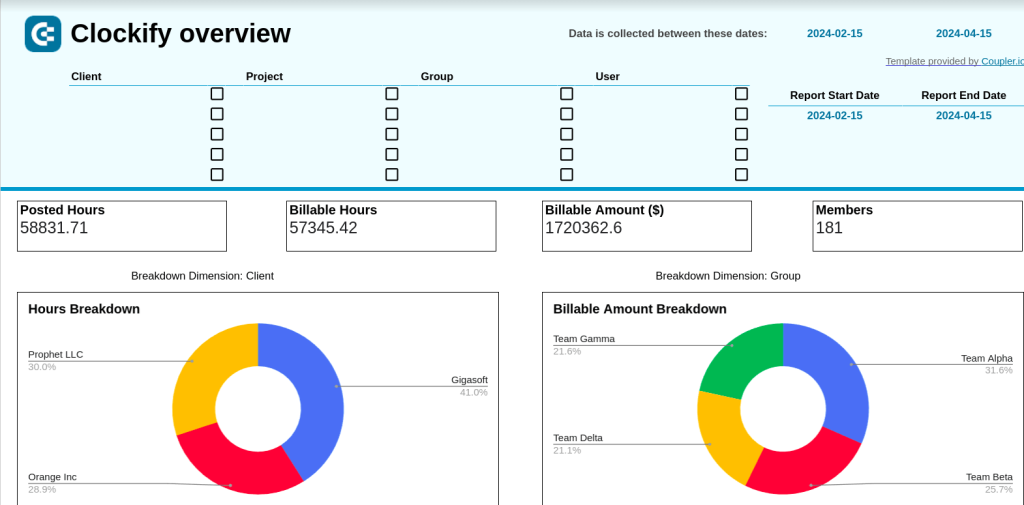
Clockify time-tracking dashboard for Looker Studio

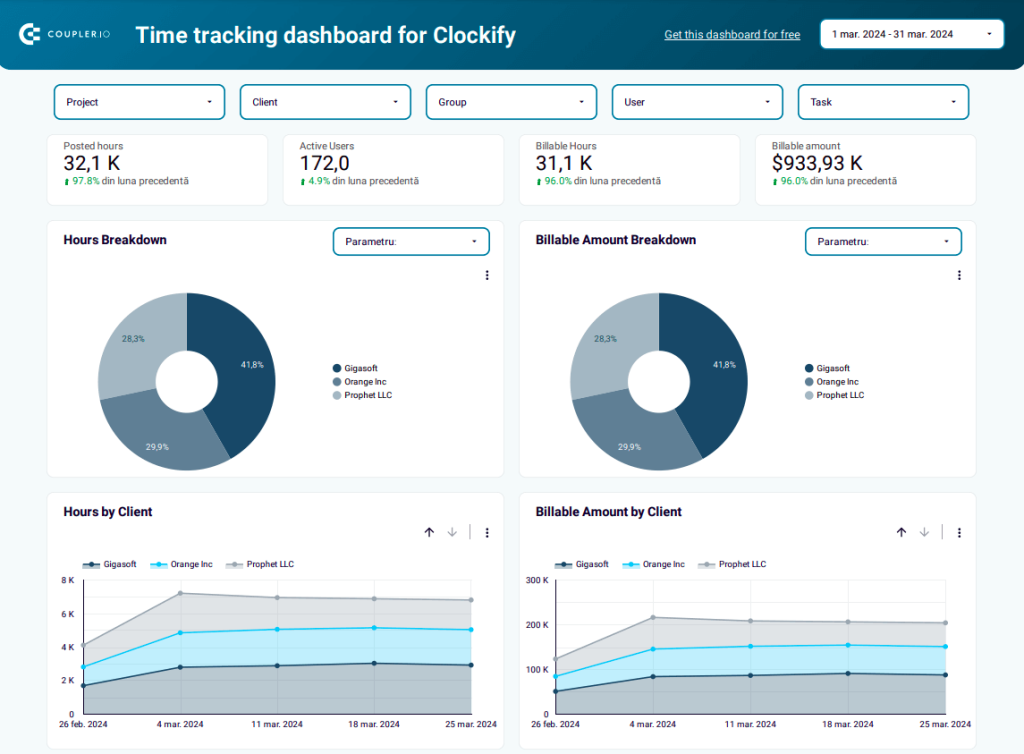
This dashboard provides a complete overview of the tracked time across projects, clients, and tasks. You can also monitor which of your teams logged in the most hours or which project brought in more revenue.
To start using this free Looker Studio dashboard, you need to follow a few easy steps:
- Click on this link to create a Coupler.io account and start setting up the automated data integration. If you are already a Coupler.io user, you’ll be directed right to the importer.
- Next, add your API key and Workspace ID to connect to Clockify. Click on Finish and proceed. Then, click on Transform data.
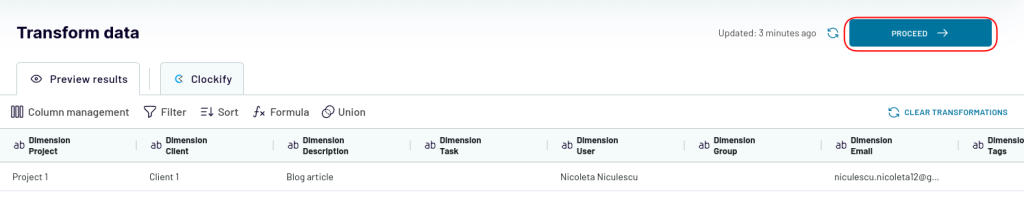
- In the data transformation module, don’t change anything. All the settings are already pre-selected to visualize your data correctly.

- Follow the in-app instructions to authorize the connector and create a data source in Looker Studio.

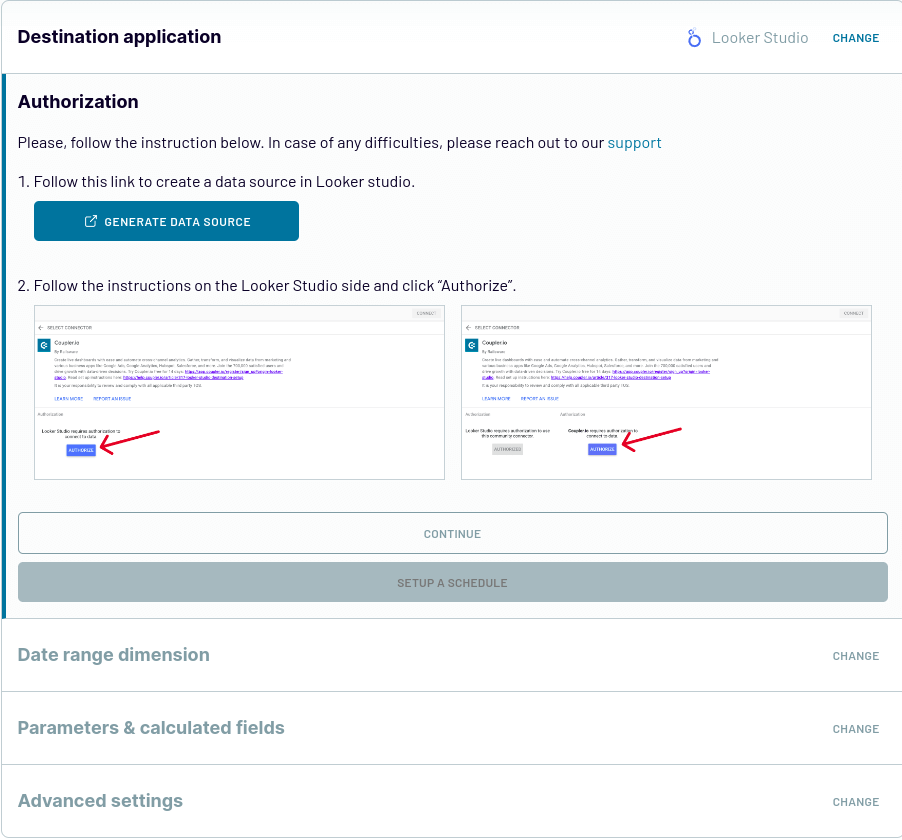
- Click Proceed and authorize the data source in Looker Studio. Then, click the Create Report button to get your Clockify data in the dashboard.
You’ll be redirected to the copy of the time-tracking dashboard showing your Clockify data. , By default, the importer will update the report with fresh data every 24 hours. You can make it update the data as often as every 15 minutes from Coupler.io integration.
Get the Clockify dashboard for Looker Studio
Clockify dashboard template for Google Sheets
If you are not familiar with Looker Studio, you can use this time-tracking dashboard in Google Sheets.
This template highlights the same data as the other one and it’s also easy to set up and automate.

Check the Readme tab of this template to learn how to use it. The next steps are similar to those described above for the previous template.
Get the Clockify dashboard for Google Sheets
How to export data from Clockify manually
As we’ve mentioned, you can also export data directly from Clockify. While it is fairly easy to do it, you can only export data as an Excel, PDF, or CSV file.
All you have to do to export all data is go to Detailed Report and choose the longest data range to export all time entries. If you want to select a date range longer than one year, you will have to upgrade to one of Clockify’s paid plans as they do not offer this option for the free plan.

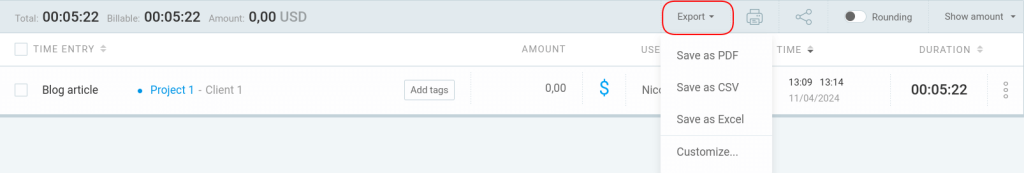
Once you selected the report you wanted, click on Export and, from the dropdown menu select the format of the file you want to get (Comma-separated value (CSV), PDF, or Excel). You can also choose to customize the report. However, this is another option unavailable for the free plan.
Depending on your needs, you can export a summary, weekly report, or detailed report from Clockify. However, you won’t be able to automate the export or schedule updates. You will have to perform this activity every time you want to create a report.
In this regard, it’s better to automate the process with Coupler.io. It allows you to load data to different destinations, combine information from multiple sources, and make your data analysis-ready, all within one interface.
Apart from scheduling updates, you can also use one of the free time-tracking reports to have a full overview of your projects and time spent on them.