Do you have to export accurate Redshift data regularly? If so, you’re in luck. There’s a way to minimize repetitive manual actions – by automating data exports on a schedule that suits your needs. This not only saves time but also ensures your report is always relevant. Best of all, you can benefit from this automation without technical expertise.
In this article, we’ll guide you through the steps to export data from Redshift automatically and enable self-updates.
?Methods to export data from Redshift
For a start, here’s a breakdown of all the methods to export Redshift data:
Automated data exports without coding
If coding is missing from your skill set, you can automate data exports automatically using an all-in-one connector like Coupler.io. This tool synchronizes Redshift to various destinations, such as spreadsheet apps, other data warehouses, or business intelligence (BI) tools.
You can collect, organize, and transform data before importing. This clears your schedule from tedious reporting tasks and reduces the risk of errors for better data accuracy.
Thanks to the Automatic data refresh feature, you don’t have to launch data imports manually each time. Just choose how often you’d like the report updated, select the corresponding interval, and that’s it – your data aligns with the latest changes in original records.
UNLOAD command
Another method to export data from Redshift is the UNLOAD command. You log into the Redshift console, go to the Query Editor, connect to your database, and start running SQL queries.
Through the UNLOAD command, you save your data to an S3 bucket, which will be located in the AWS Console. From there, you can download the .csv file directly to your device and import it into the chosen destination app.
While this process seems uncomplicated, it will take time if you extract your data often. This is primarily because of the numerous manual actions you need to execute each time.
AWS Command-Line Interface (CLI)
AWS Command-Line Interface offers one more approach to data export. First, you have to install it by following Amazon’s instructions for your specific operating system. Second, you build and run your SQL query to get the necessary data. Like the previous option, it won’t work for frequent reporting because of its manual nature.
SQL client
The alternative to the methods above is to load data through an SQL client, such as MySQL Workbench. The flow will differ slightly depending on the tool, but generally, you have to install it on your machine, connect to a database, query a table, and export the result as a .csv. As is typically expected with manual options, this one is more suitable for occasional data exports.
AWS SDK
You can also get Redshift data programmatically through AWS SDK. To begin with, you must choose an SDK for one of these programming languages: JavaScript, Python, Node.js, or Ruby. You use this SDK to connect to your Redshift cluster. Then, you run the SQL query to retrieve the data and then store it in a variable within your code. Finally, you’ll be able to save your data as a .csv file. This approach is a good choice only for users familiar with coding or those who have a developer to help them.
Having seen the bigger picture of data export methods, let’s focus on the most straightforward and time-efficient one – Coupler.io’s automation.
How do you set up an automated export of data from Redshift on a schedule?
For automated Redshift export, take the steps below:
Step 1: Collect Redshift data
Start from the following interactive form. Here, we’ve preselected Redshift as the data source. You have to choose the destination app from the dropdown list and click Proceed:
Sign up to Coupler.io for free (no credit card required). Next, authorize your Redshift account by pasting the Host, Port, Database, User, and Password in the respective fields. Then, adjust the source settings:
- Opt for the Report type, which is the specific kind of data you will export. Table or view is selected by default, but you also have Custom SQL as an option.
- Select the Schema and Table/view you’d like to extract (for Table or view report type) or type in the SQL query (for Custom SQL report type).
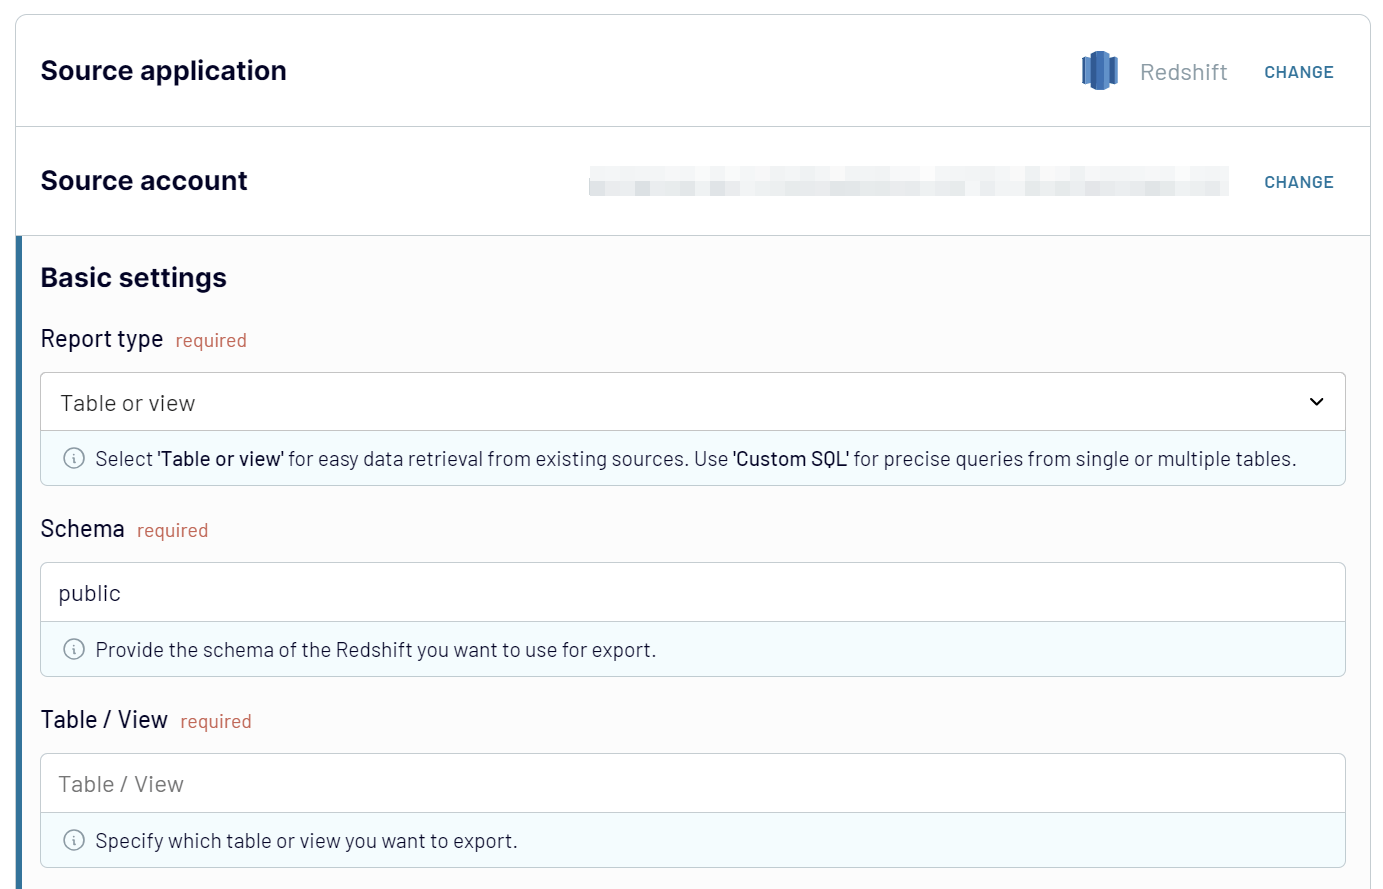
When you’re ready, proceed to the next step.
Step 2: Organize and transform data
Now, preview your data and transform it if you need to. You have the following transformations available:
- Edit, rearrange, hide, or add columns.
- Apply different filters and sort your data.
- Create columns with custom formulas.
- Merge data from multiple tables, databases, or apps.
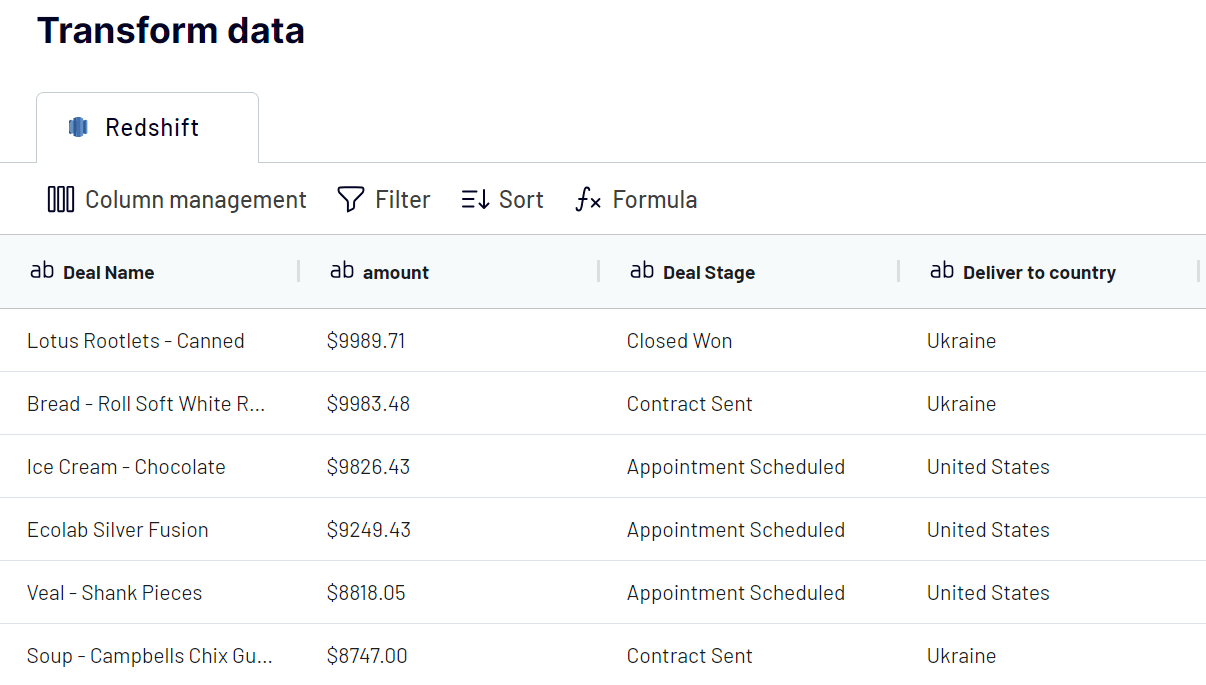
Once you’ve verified that the data is ready for import, follow the in-app instructions to connect to the destination. Then, move to setting up the schedule.
Step 3: Schedule your updates
Turn on the Automatic data refresh. After that, select the interval, days of the week, time slots, and time zone. By default, your imported data will be aligned with the original records every day. However, you’re free to choose another frequency: from monthly to hourly and every 30 or even 15 minutes, making your report nearly real-time.
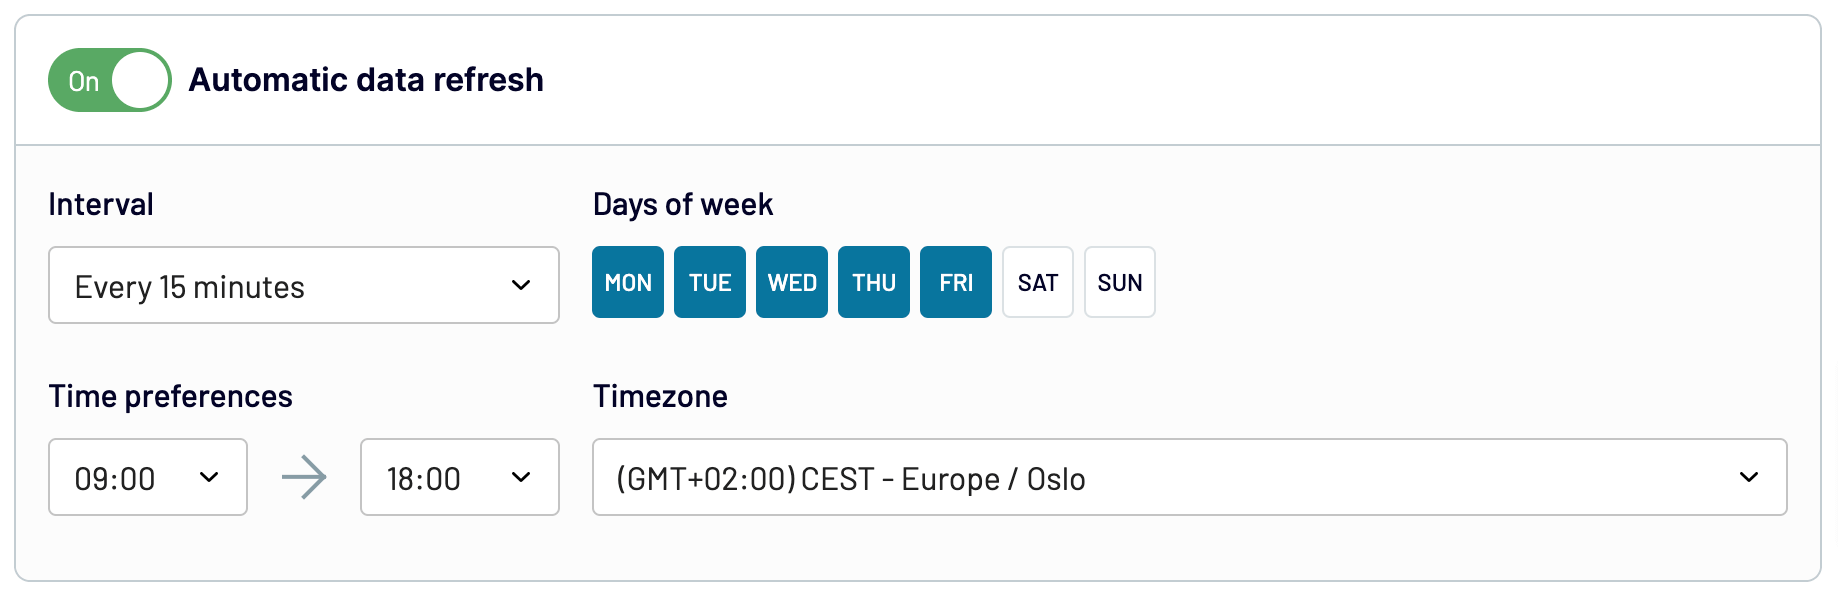
Run the importer to make data import happen.

Automate data export with Coupler.io
Get started for freeWhat data can be exported by Coupler.io from Redshift?
With Coupler.io, you can export any kind of data that has been stored, queried, and analyzed in Redshift. Here, we’ve provided some suggestions:
| Data type | Description |
| Marketing data | Delve into your marketing performance, including impressions, clicks, conversions, and engagement rates. Understand how effectively your marketing campaigns resonate with the target audience to improve strategies and boost ROI. |
| Advertising data | Analyze the effectiveness of your ad groups and individual ads to optimize targeting and bidding strategies. Check out which ads work best and which underperform to enhance your creatives for higher engagement and better campaign results. |
| Social media data | Explore demographic and geographic insights, such as age, gender, location, and more, for your social media campaigns. This will help you better appeal to specific demographics or regions for maximum impact and engagement. |
| E-commerce data | Evaluate the performance of your e-commerce activities: sales, revenue, customer acquisition costs, and product performance. Use this data to optimize product offerings, pricing strategies, and marketing campaigns to drive revenue growth. |
| SEO data | Monitor keyword performance and search term effectiveness to optimize SEO strategies and raise website visibility. Customize keyword targeting and content strategies to increase organic traffic and elevate search engine rankings. |
| Finance data | Access financial metrics like revenue, expenses, profit margins, and cash flow to track the financial health of your business. Identify trends and patterns to make informed financial decisions that will truly make a difference. |
| Accounting data | Export accounting data, which comprises transactions, invoices, expenses, and accounts receivable/payable. Take a deep dive into your financial performance, as well as ensure compliance with accounting standards and regulations. |
| Sales data | Track sales performance metrics: revenue, conversion rates, customer acquisition costs, and sales pipeline dynamics. Reach conclusions from this data to optimize sales strategies, spot growth opportunities, and make sales more effective. |
| CRM data | View customer interactions, preferences, and behaviors for better customer relationship management. Get a firm grasp of customer acquisition, retention, and satisfaction to channel your marketing and sales efforts into a more viable direction. |
| Project management data | Keep an eye on project progress, resource allocation, and task completion to ensure timely project delivery. Detect bottlenecks, optimize workflows, and distribute your resources reasonably to secure the desired project outcomes. |
Next, we’ll overview the applications where you can import these sorts of data.
What are the supported destinations to import Redshift data?
Coupler.io enables Redshift export into multiple destinations:
- Spreadsheet apps – Google Sheets and Microsoft Excel – to report on your data quickly and simply.
- Alternative data warehousing software – BigQuery and PostgreSQL – to store, query, and perform intricate analysis of data.
- BI tools – Looker Studio, Power BI, Tableau, and Qlik Sense – to visualize your Redshift data through dynamic interactive dashboards and make it more understandable.
- JSON – to save your data in .json file format and further load it into compatible applications.
- monday.com – to use your data for work management purposes.
How to visualize data from Redshift
Data visualization makes a meaningful contribution to your analytics. It provides alternative ways to present information and enrich the insights you get. To achieve this, consider using Coupler.io to connect Redshift with your data viz tool. Reminder: among the supported applications are Looker Studio, Power BI, Tableau, and Qlik Sense.
All you need to do to load data into these apps is complete the import process described earlier. Once the data has reached the destination, you can create reports or dashboards based on your needs. For more visualization options, browse through our dashboard templates in Looker Studio, Google Sheets, Power BI, and Tableau.
As already mentioned in this article, Coupler.io works with many other destinations besides visualization tools. You can easily import data into these apps and schedule auto-updates to keep your reports in sync with the source. Try Coupler.io for free to apply its features to your own data!
Automate data export with Coupler.io
Get started for free