In certain cases, you may need to do more with your data than just view it in Tableau. You may want to share it with others, build dashboards in another tool, create a backup copy, combine it with data from other sources, etc. This is where exporting comes in. In this article, we explore the different methods to export data from Tableau so you can choose the best option for your needs. Let’s dive in!
How to export data from Tableau – options available
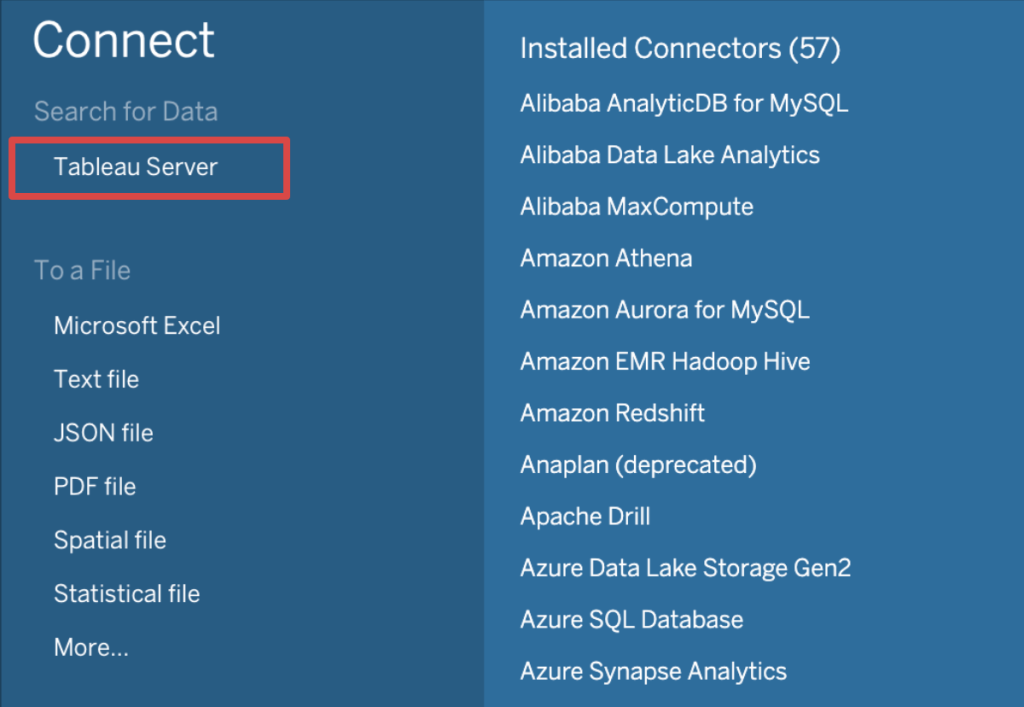
- Native method: Tableau provides an in-built process for exporting data. The flow may differ slightly depending on the Tableau product used. From your Tableau Desktop, you can:
- Export data in the data source.
- Export data used in ??? view.
- Export views to another application as a PDF, image file, PowerPoint, etc.
For your Tableau Cloud (Online) or Tableau Server, you can export your views as PDF, PowerPoint, images, crosstab, etc.
If you want to build a self-updating dashboard or report that requires frequent Tableau data exports, then this method is not recommended, as it will consume a lot of time and resources.
- Automated method: When manual data exporting doesn’t meet your needs, you should automate the process. With Coupler.io, a reporting automation platform, you can quickly export Tableau data to your destination on a preferred schedule. Very little on your part is required for this method, making it a top choice for convenience.
Your choice would most likely depend on what your needs are. While the manual method is effective, it actually adds more work to your plate and has certain limitations. As a result, the most time- and cost-effective solution is to rely on automated data export. Let’s delve further into these methods.
Automate Tableau export data on a schedule with Coupler.io
By using Coupler.io, you can create custom reports based on extracted Tableau data. If you have multiple Tableau dashboards for export, combine data from them into a single report. Then, load your report into Google Sheets or Excel, BI tools like Looker Studio and Power BI, connect Tableau to BigQuery or other databases, and more.
On top of that, your report will automatically update on a selected schedule – from monthly to every 15 minutes – to stay synced with the latest changes in the source data.
Now, we’ll show how this works in practice.
Export your dashboard from Tableau to your chosen destination
To illustrate how to use Coupler.io to export data from Tableau, let’s look at this use case. Suppose you have a dashboard and want to load its data from Tableau Cloud (Online) to Google Sheets or Excel to share it with stakeholders, colleagues, etc. One of the major requirements is for the report to always display up-to-date information.
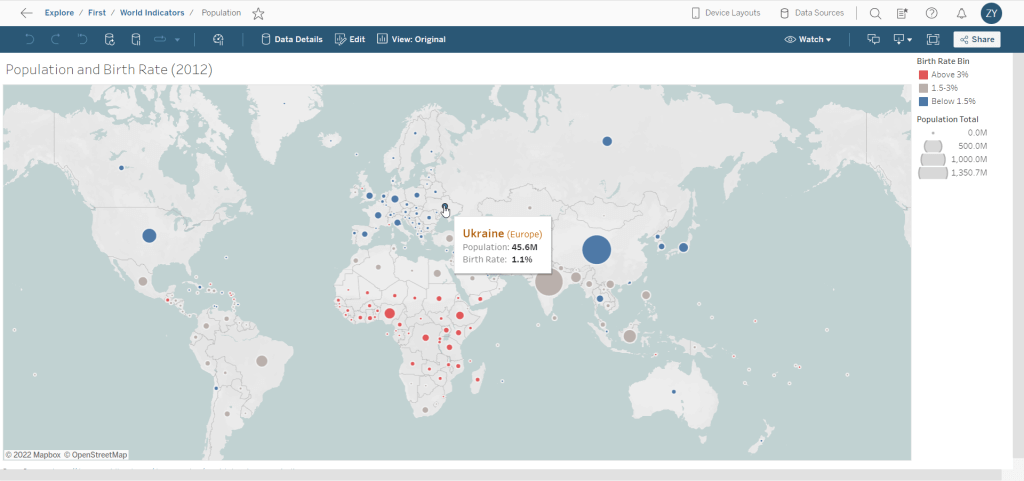
As an example, we will be looking at how to carry out a Tableau export of a dashboard that contains the population and birth rate.
With Coupler.io, data export from Tableau will only take three simple steps:
1. Connect your Tableau dashboard
To get started, select a preferred destination in the form below and click Proceed:
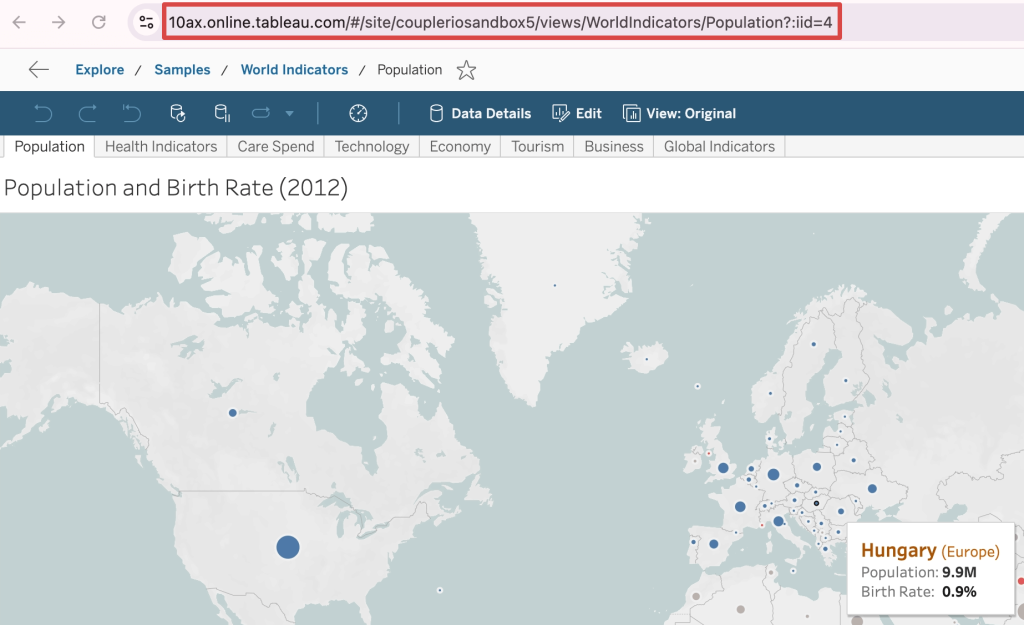
You’ll be asked to sign up for a free Coupler.io account. If you’re already a Coupler.io user, you’ll be taken straight to the data flow. Next, connect your Tableau account by entering your access token to sign in to Tableau Cloud. Then, go to Tableau to copy and paste the URL link of your dashboard, also known as Tableau view.
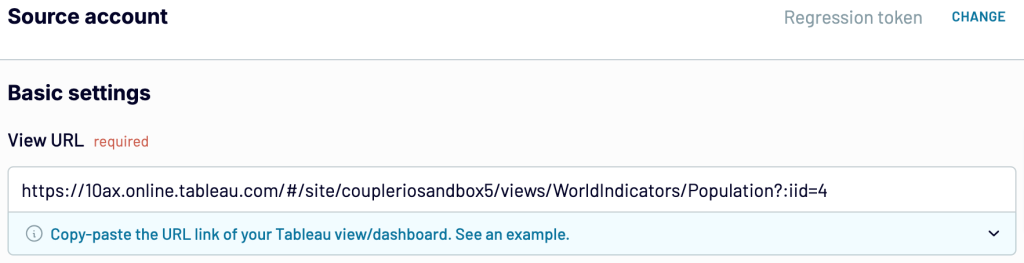
Here is what your source configuration in Coupler.io should look like:
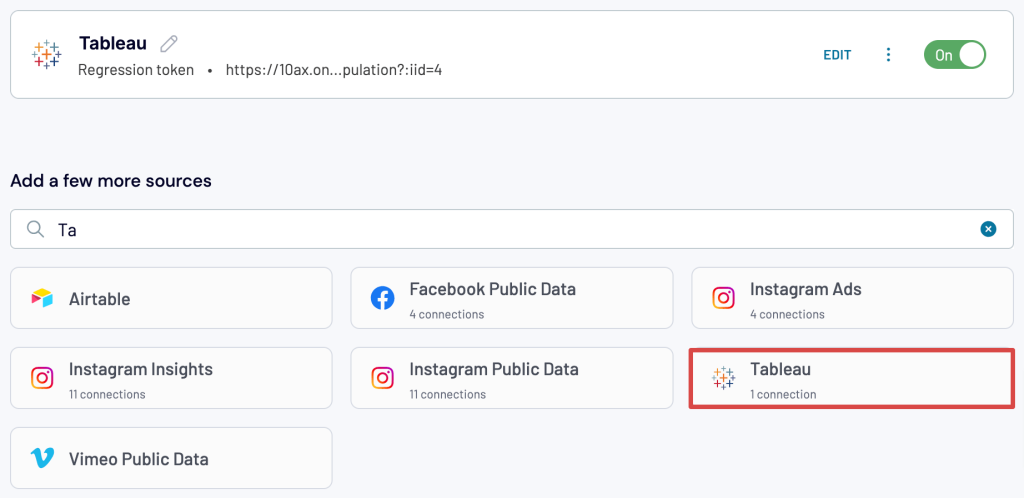
Move forward, and if you need to connect multiple Tableau dashboards, search for Tableau in the app gallery, add it as an extra source, and configure it as explained above.
Once you’re done with the source settings, proceed to the next step.
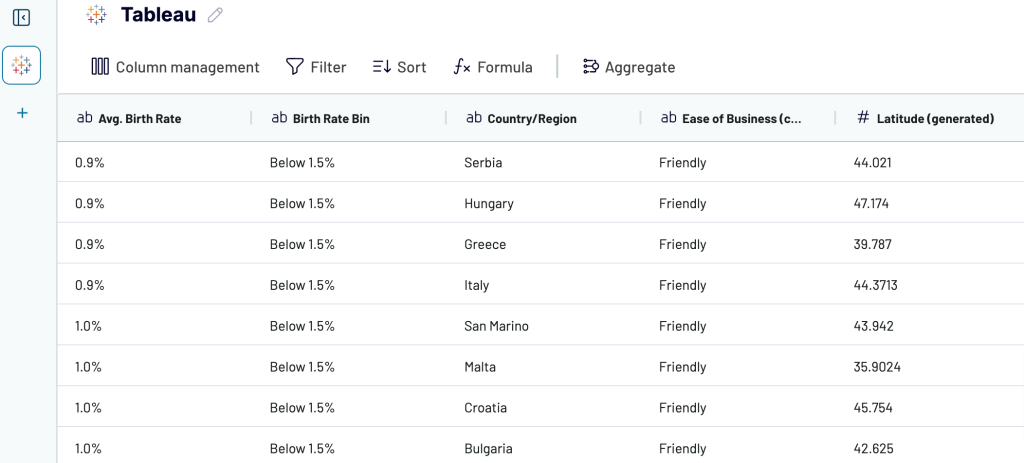
2. Preview and transform your data
Now, you can preview your data and make the following transformations:
- Rename, rearrange, hide, or add columns.
- Sort data in ascending or descending order.
- Filter data to extract it based on specific criteria.
- Create new columns with custom formulas.
- Aggregate data using operations like sum, avg., count, min., or max.
If you’ve previously connected several sources, blend data in the chosen manner:
- Append – merge datasets with similar structures and columns matched by name.
- Join – combine datasets with different structures and at least one matched column.
3. Load data and schedule updates
??Fetch your data into the destination following the in-app instructions. After that, toggle on automatic data refresh and schedule your data exports.
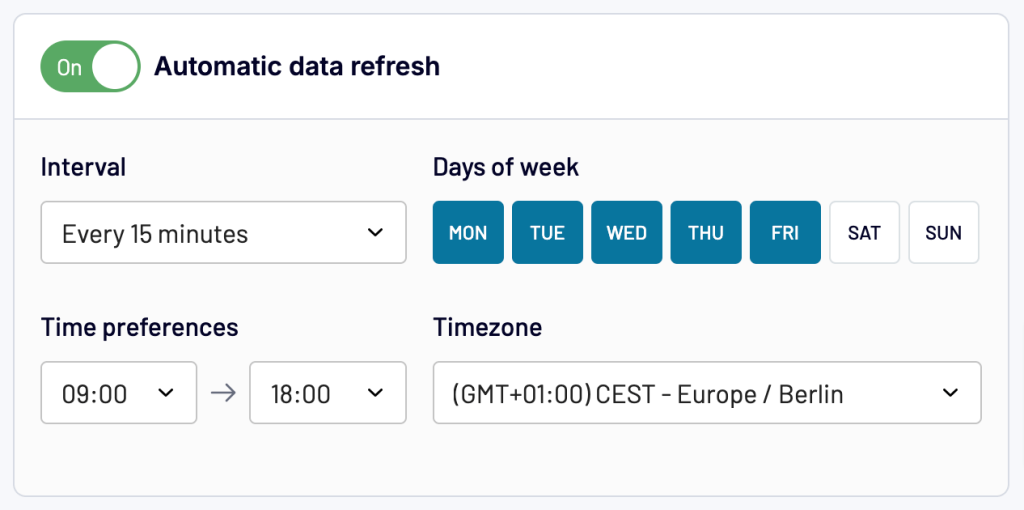
Finally, save and run the data export. And there you have it!
Where you can export your dashboard from Tableau
The key destinations for Tableau data include spreadsheet apps and BI tools, such as the following:
Spreadsheets (Google Sheets & Microsoft Excel)
You can export data from Tableau to Google Sheets for simple reporting and small-scale analysis. It allows you to add, edit, and format spreadsheet items, as well as apply formulas and functions. To make your reports easier to understand, consider using charts, graphs, or tables.
Alternatively, you can connect Tableau to Excel, which is also designed to organize data into spreadsheets and perform calculations using formulas and functions. Furthermore, it suggests charts used to summarize data, identify trends, and highlight patterns.
BI tools (Looker Studio & Power BI)
Google Looker Studio is a BI tool that is easier to use but less advanced than Tableau. It helps you create visualizations, including line, bar, pie, bubble charts, geo maps, area graphs, and pivot tables. To add interactivity to your dashboard, apply filters and date range controls.
Microsoft Power BI is well-suited for large and complex datasets. It will also work for beginners and non-data analysts as a more accessible alternative to Tableau. Available visualizations include bar, column, line, pie, and donut charts, as well as maps, tables, matrices, and cards.
Now that you know how to export your Tableau data automatically with Coupler.io let’s see how it can be done natively to see the difference.
Native options to export Tableau data
There are many methods for the native export of data from Tableau Desktop, Tableau Cloud, or Tableau Server. However, due to a lack of automation, they are too time-consuming and prone to human error. As a result, you will find them suitable only for occasional use rather than for frequent or large-scale data exports.
Additionally, static export formats involved, such as CSV, PDF, and images, lack interactivity, stripping away the dynamic features of Tableau dashboards.
In the following sections, we will cover how to manually pull data from Tableau.
Export data from Tableau Desktop
In the desktop version of Tableau, you can export from the data source, pull data from which views are generated, or save views in different file formats for loading into other applications.
Perform export from the Tableau data source
Export your data source: You can save and export your data source as a Tableau data source (.tds) file after establishing a connection. Here’s how to do this:
- At the Data pane, right-click the name of the data source and then select Add to Saved Data Sources.
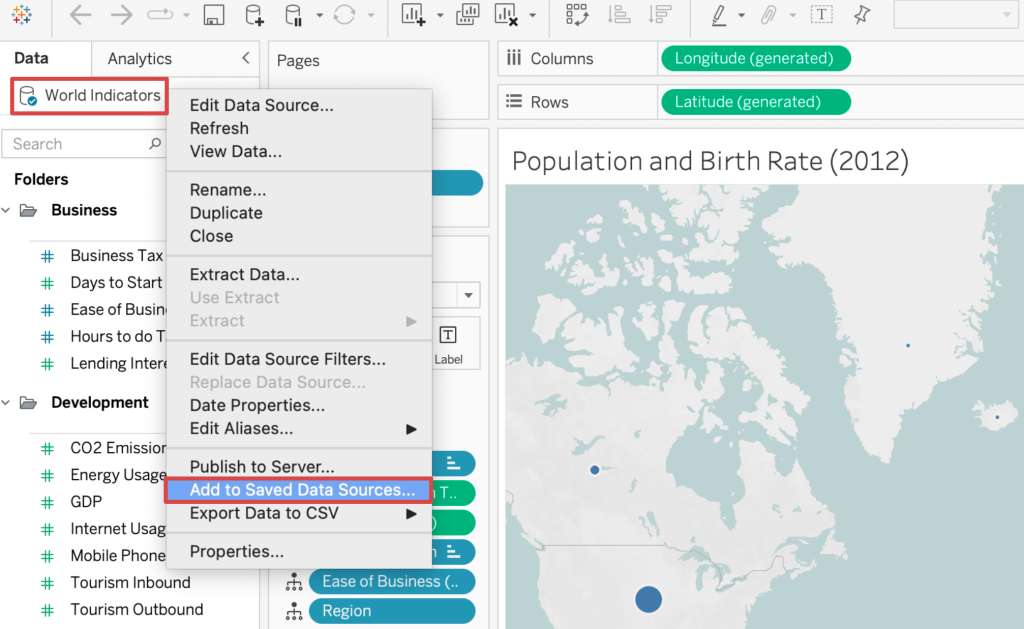
- Enter a filename, select the file type (.tds or .tdsx), and then click Save.
Extract your data source: You can create an extract (.hyper) file to migrate all or a subset of your data within the data source. This can be done using the Hyper API to create new extract files.
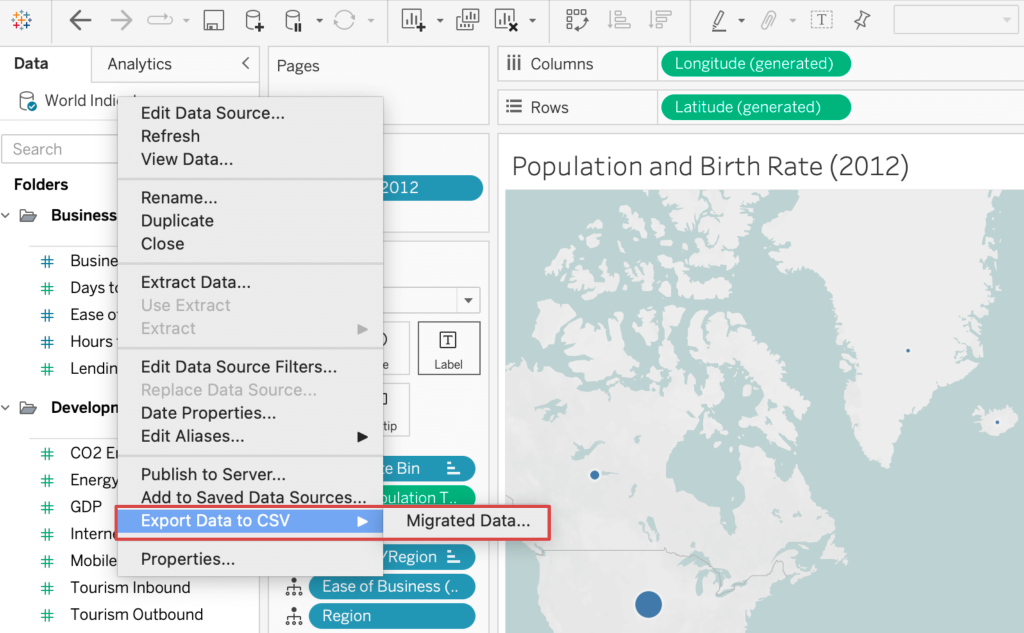
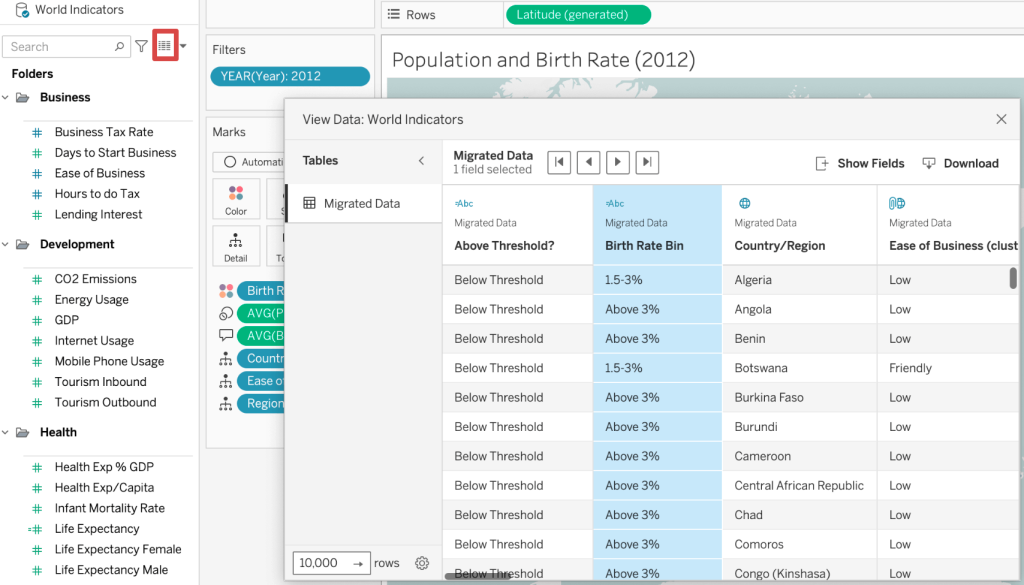
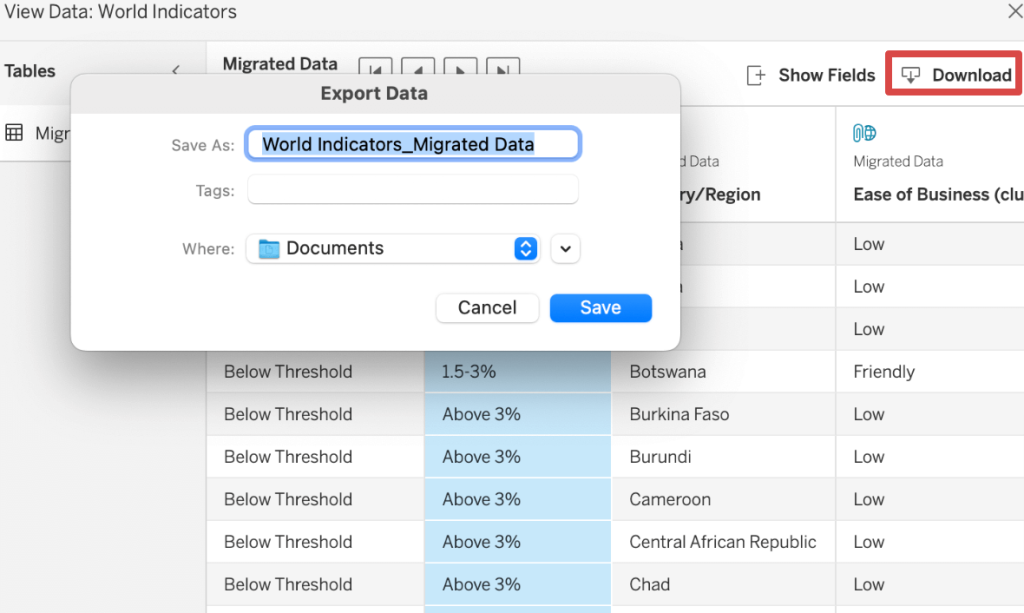
Export data as CSV files: You can export your data from the data source to a CSV file in two main ways: from the view or choosing from the data source options.
- From the view: To do this, click the View Data icon in the Data pane, and then click Download.
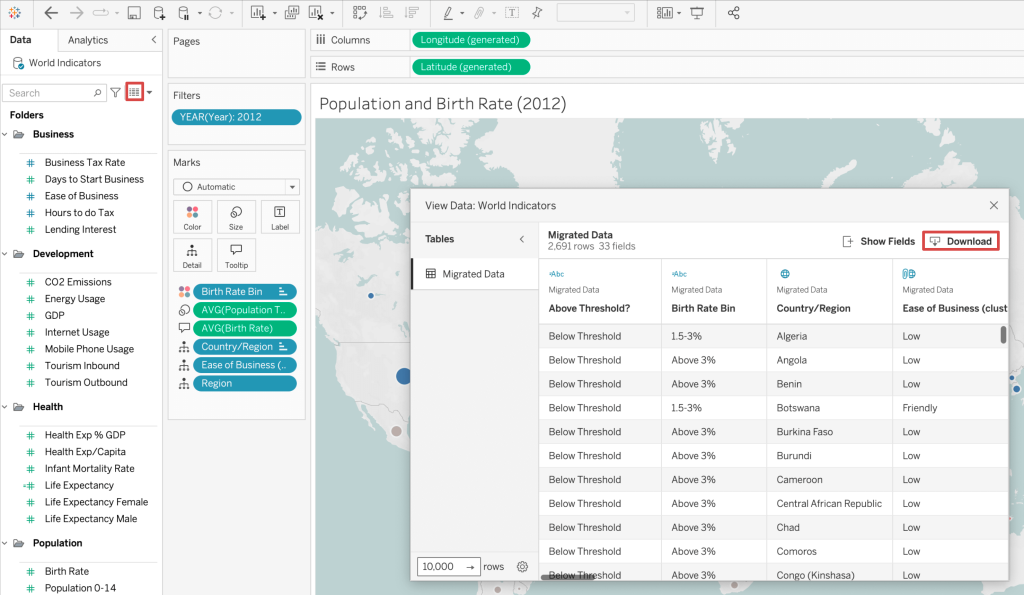
- From the data source options: Go to the Data pane, right-click the name of the data source, select Export Data to CSV > Migrated Data… and save the file on your device.
Export data used in view
In addition to creating a Tableau view, you can also easily export the specific data used to generate that view.
Export the view data to Microsoft Access: To export the data used to generate a Tableau view as a CSV file (macOS only) or an Access database (Windows only), you can do so by following a few simple steps.
- Go to the top navigation bar, then Worksheet > Export > Data. Choose a location and name for your file or database, and then save.
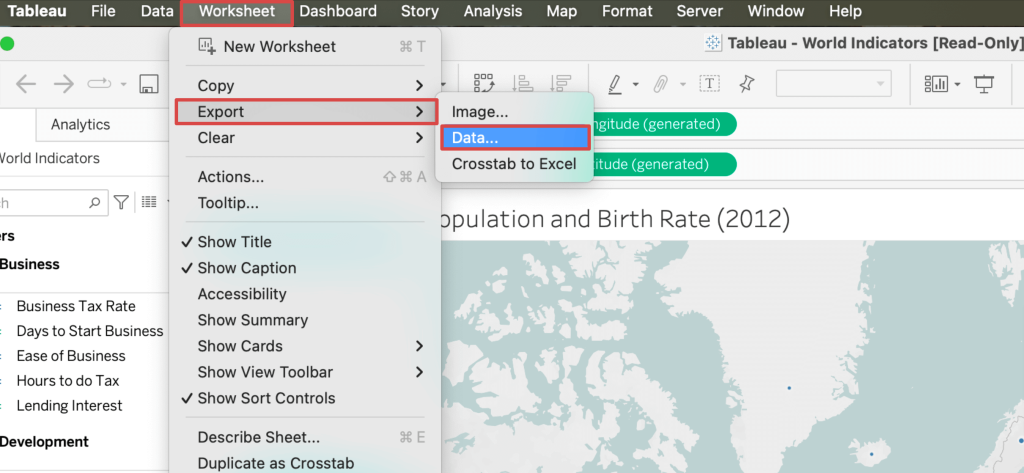
- On Windows, you’ll also have the option to immediately use the new Access database and continue working in Access without interrupting your workflow.
Export a crosstab of your View to Excel: To do this, choose Worksheet > Export > Crosstab to Excel. If you’re using a Mac, you’ll need to save the file and then open it in Excel manually. However, be aware that this method can impact performance if the view contains a lot of data. To enhance performance, you can choose to exclude formatting from the export.
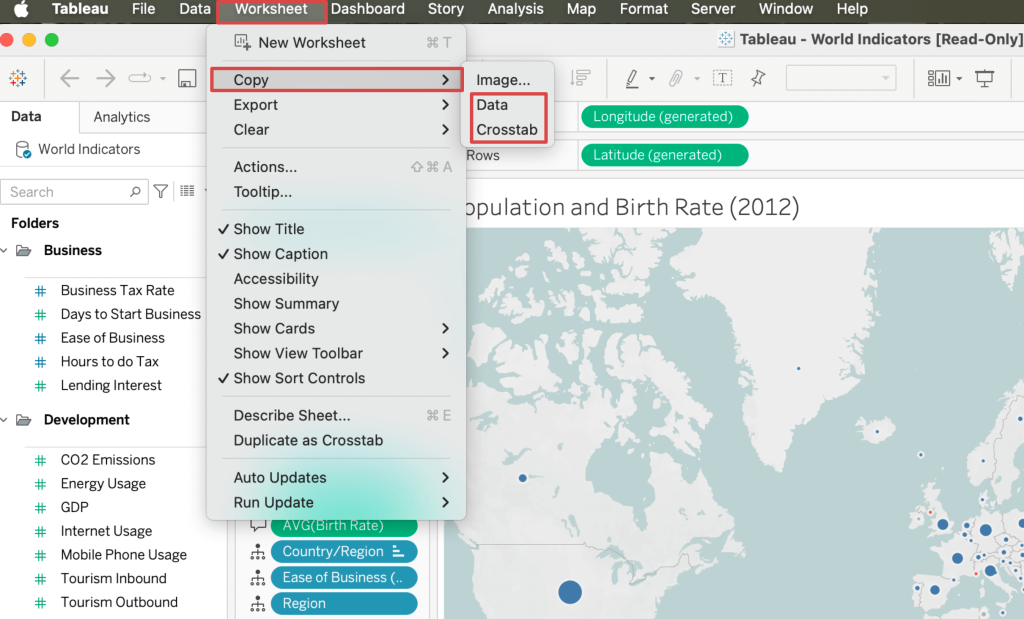
Copy data or crosstab in the view to the clipboard: To do this, create a view and select Worksheet > Copy > Data. To copy crosstab, select Worksheet > Copy > Crosstab. Then, open up your application, such as Word or Google Docs, and paste the data into the document.
Export views to another application
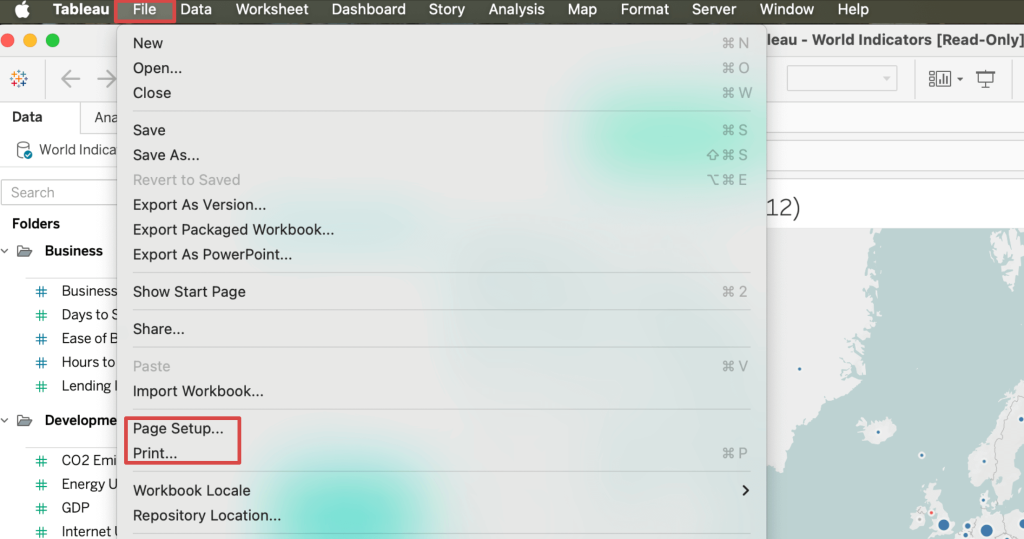
Export as a PDF file: Go to the top navigation bar, then File > Page Setup… to tailor the layout of page elements. Next, select File > Print… for exporting as PDF.
Export data as a PowerPoint presentation (PPT): To export a workbook in PowerPoint, choose File > Export as PowerPoint, then select the sheets you wish to include in the presentation.
Export data as images: To do this, select Worksheet > Export > Image, choose the elements to include in the image, and click Save. Specify the file name, location, and format, then save the image.
Export views in Tableau Cloud and Tableau Server
To export views from your Tableau Cloud or Tableau Server, click the download button:
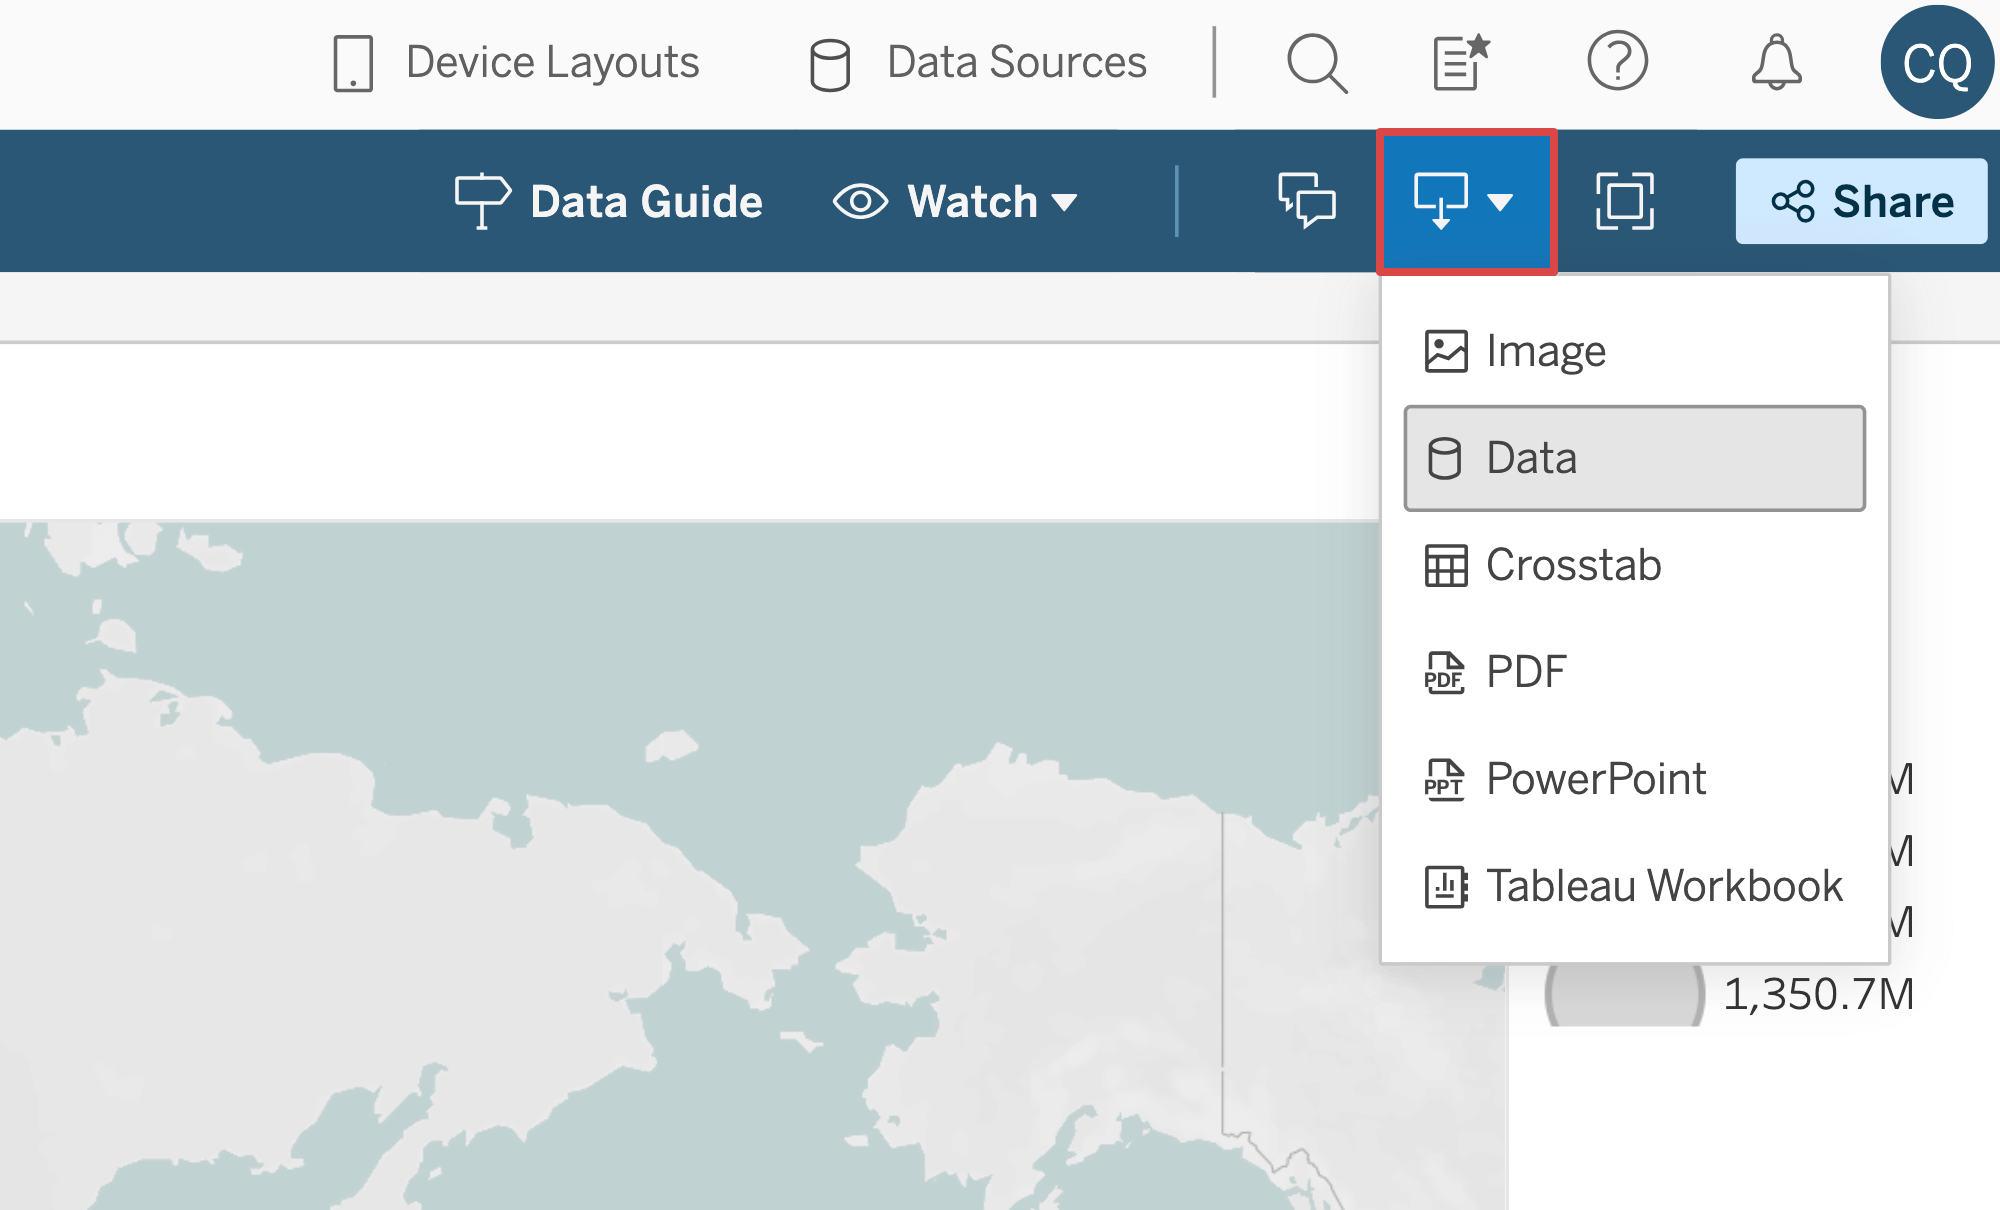
Select the format to download your views: PNG image, CSV, crosstab (CSV or Excel), PDF, PowerPoint, or Tableau workbook. Keep in mind that the formats available to you are based on the permissions granted by the Tableau content owners and site administrators.
How to export the interactive Tableau dashboard
We have seen that it is possible and very easy to export the data we have in Tableau to our spreadsheet apps or data warehouse. But what if you want to export your live dashboard to your blog or website to enable readers to interact with it and see real-time updates?
All that is needed for this to work is the embedded code from Tableau to add to your blog, website, or any other platform. This can be obtained from Tableau Cloud, Tableau Public, and Tableau Server. If your dashboard is on Tableau Desktop, you’ll need to publish it to the Tableau version product mentioned above.
To export your interactive dashboard:
- Go to your dashboard and click the share icon.
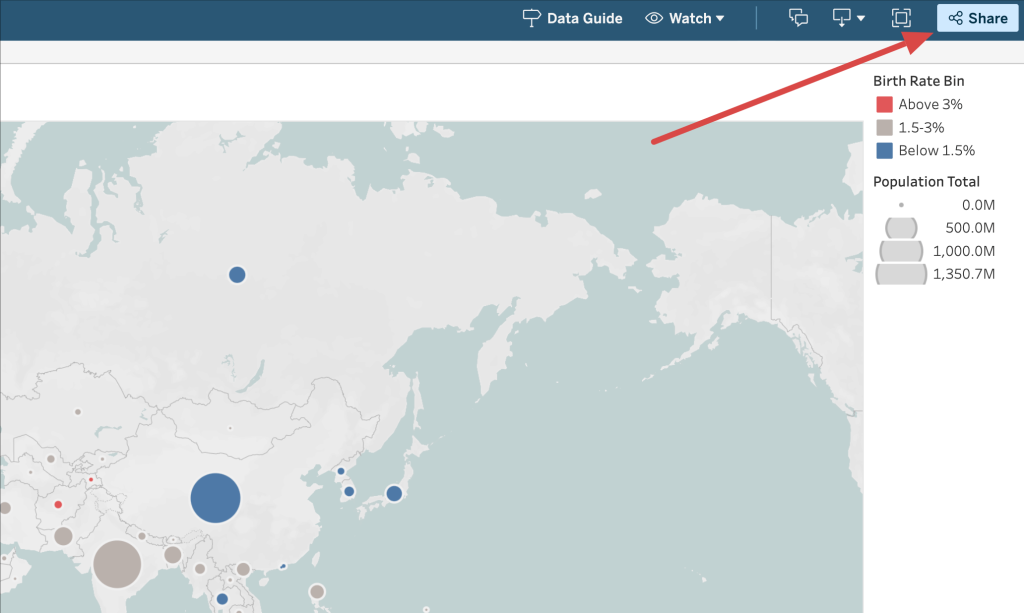
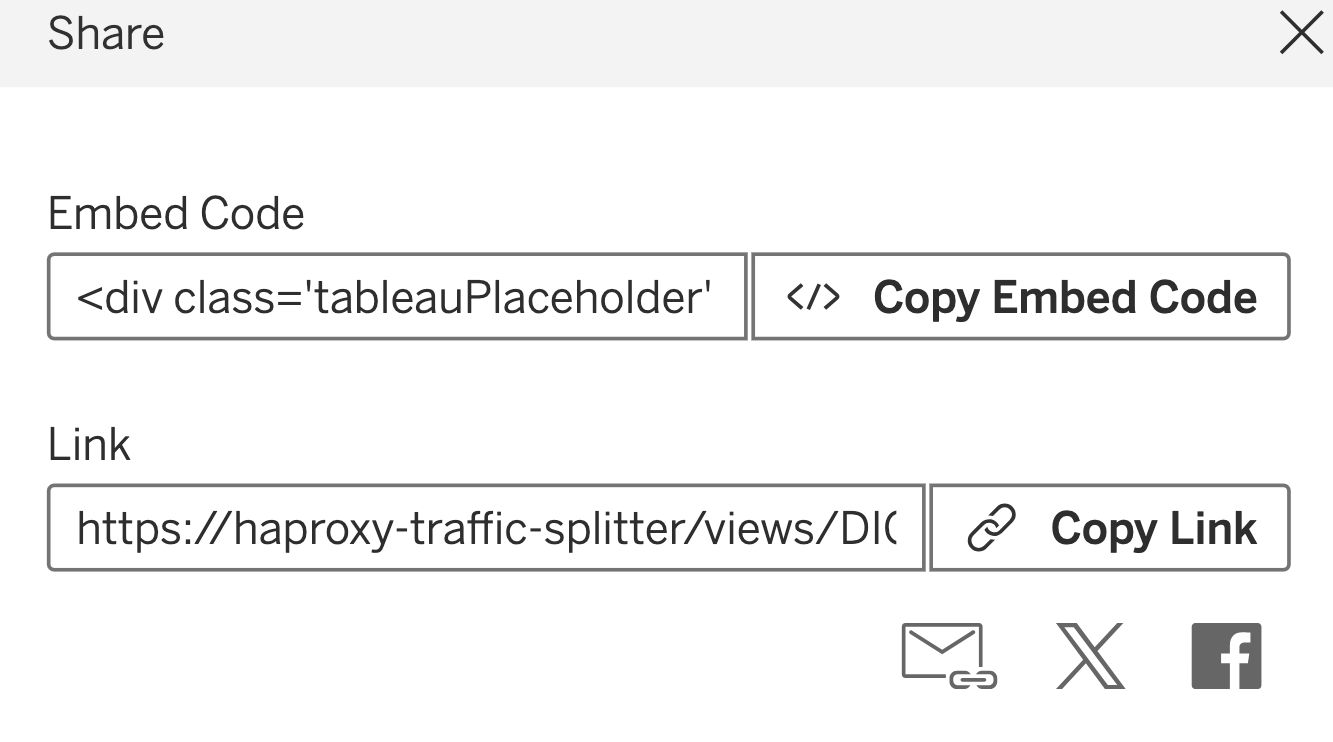
- Next, copy the embedded code. This is how it looks for Tableau Public.
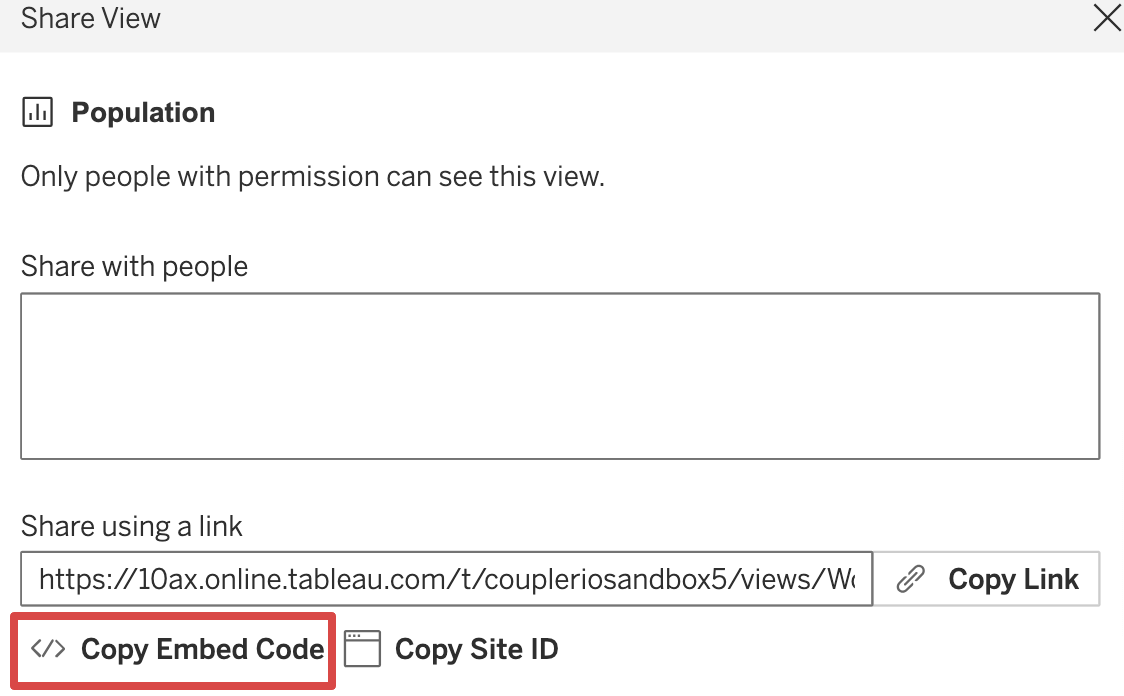
This is how it looks on Tableau Cloud:
This approach is good for making a simple dashboard that can be shown on a blog or website. However, if you require more advanced Tableau dashboard examples that can handle a variety of data and assist in decision-making, you will need to possess a certain level of data analytics skills.
What else you can export from Tableau
Tableau export calculated fields
With Tableau export of calculated fields, you can share your data and analysis with others in a way that they can easily understand and use, even if they don’t have Tableau. To export calculated fields in Tableau:
- Open your workbook in Tableau Desktop, go to the Data pane, and click the view data icon.
- Select the calculated fields you want to export and click Download.
- Choose a location to save the CSV file, and click Save.
You can also use the Tableau API to extract calculated fields programmatically. This can be useful if you want to extract calculated fields from multiple workbooks at once.
Tableau export users
The ability to export Tableau users depends on the Tableau product you’re using and your permissions. For example, in Tableau Cloud, user data export is possible, but for Tableau Server, you’ll need to enable access to Tableau Desktop and then follow these steps below:
- ?Open Tableau Desktop and connect to PostgreSQL.
- Verify that you have port 8060 running, then create a read-only username and password.
- Go to the user’s data you want to export and navigate to the worksheet.
- Drag the desired fields onto the worksheet.
- Select the Worksheet and then click Export.
To export users from Tableau Cloud, you’ll need to be the creator or have admin access. There are three ways to do this: From the Explore menu, Tableau Desktop, or Tableau Rest API. There are no significant differences between the three methods; you can make a choice based on what you feel like using.
The first approach – Explorer menu
- On the left pane, go to the Explore menu.
- Select a new workbook.
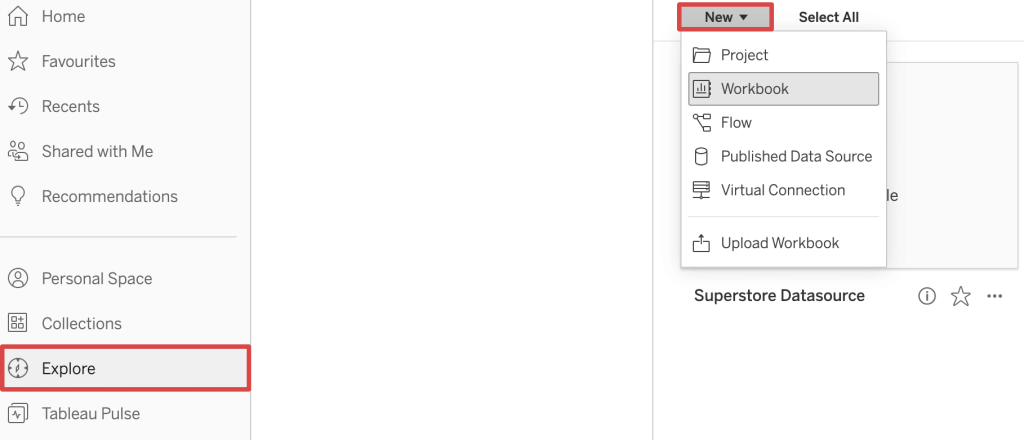
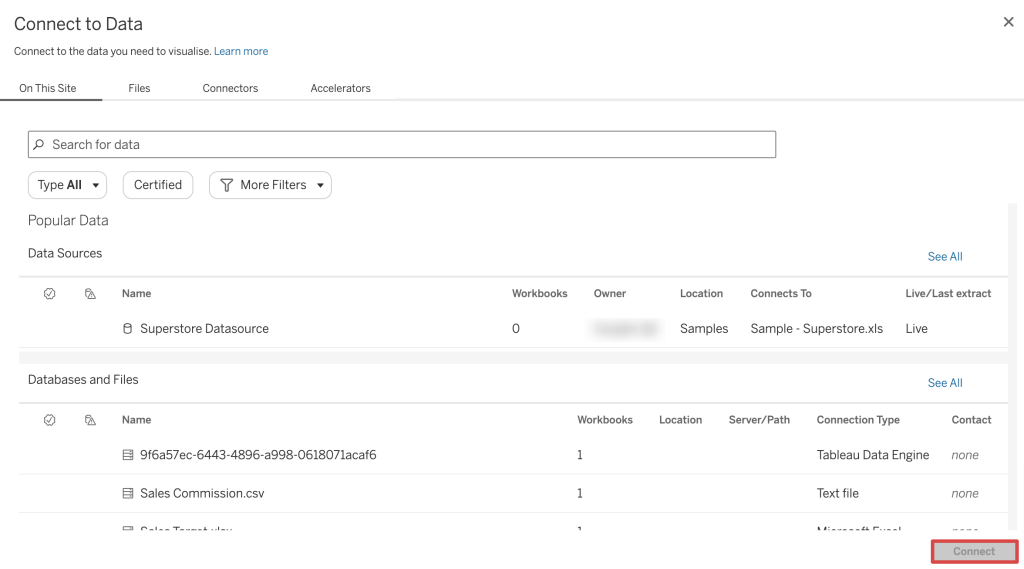
- This opens a data connectivity window. From that window, select the TS Users data source from the list and click on the connect button in the lower right. Alternatively, you can search for TS and choose the TS Users data source from the list.
- Drag the desired user fields you want to export (user email and site role) to rows.
- Click on the download icon and choose the format you want to export your data.
The second approach – Tableau Desktop
- From your Tableau Desktop, connect to the Tableau Server.
- Search for TS, and from the list, choose TS Users data source and connect.
- Drag the desired field (user email and site role) you want to export to the dashboard.
- Click the Worksheet and then select Export to export the user list.
The third approach – Rest API
You can decide to use the Tableau Rest API “Query user on site” to export your user list from Tableau Cloud.
Which option for Tableau export for your dashboard to choose
The choice of the best Tableau data export method should rest on your goal.
If you need to export your data from Tableau once a month or once a year, it probably does not make sense to automate it. However, if you need to export data often and don’t want to waste time, money, or resources on inaccurate data, then Coupler.io is a reliable tool for accomplishing this with minimal effort.
With just a few clicks and less time invested, you can rest assured you are working with the most up-to-date and accurate data.
Have fun with your data ?