Each ad you run on Facebook generates many insights. On a small scale, in a team of one ideally, these are fine to directly analyze on the platform. However, things get trickier when you actually need to report on the performance to your team or other stakeholders. In such situations, the ability to export Facebook Ads data comes in handy.
Facebook offers built-in exporting capability available for a few common formats. With little to no effort, you can also set up automatic data exports into the tool of your choice. Learn how to go about this in our useful guide.
How do you export Facebook Ads campaigns?
Exporting data from your campaigns is a very common use case. It gives you the list of all ongoing, scheduled, and finished campaigns, their budget, settings, or the set objectives.
To export campaigns automatically, select the destination for your Facebook Ads data in the form below and click Proceed. With Coupler.io, you can export Facebook Ads to spreadsheets (Google Sheets, Excel), data warehouses (BigQuery, Redshift), and BI tools (Looker Studio, Power BI, etc.).
Step 1. Extract data from Facebook Ads
- Connect your Facebook account, the one that has access to your Facebook Ads Manager. You’ll be taken to Facebook to sign in and authorize Coupler.io to export the data on your behalf.
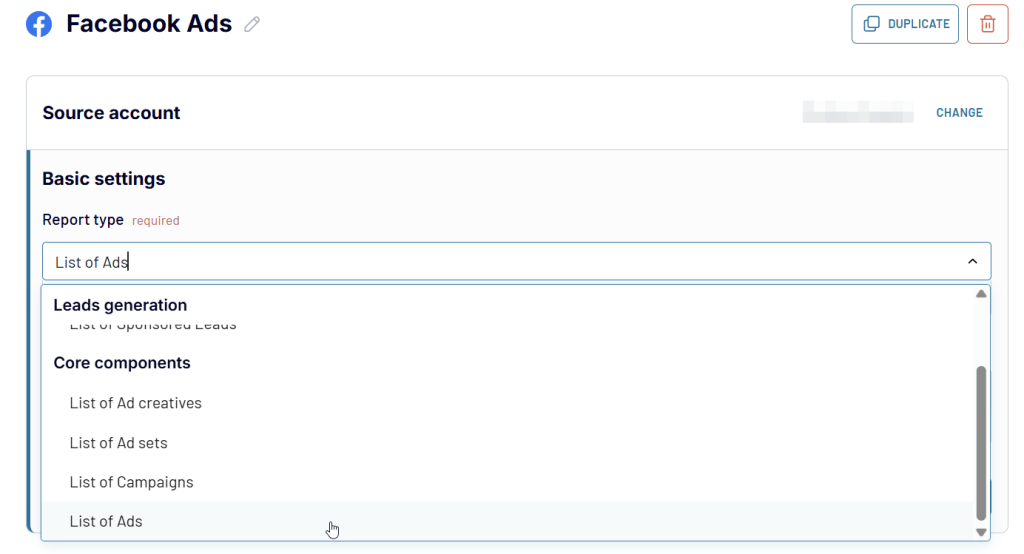
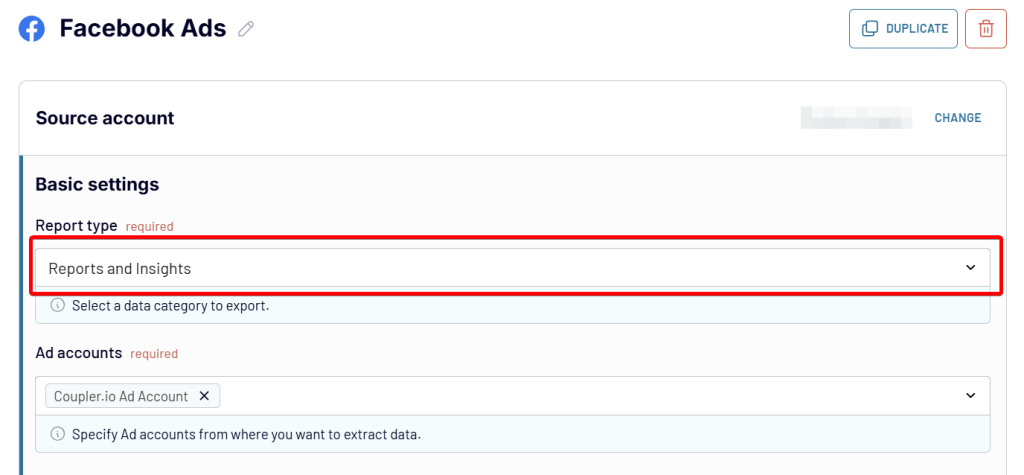
- Next, decide which Report type you want to export:
- Reports and insights
- List of sponsored leads
- List of Ad sets
- List of Campaigns
- List of Ads
- List of Ad accounts.
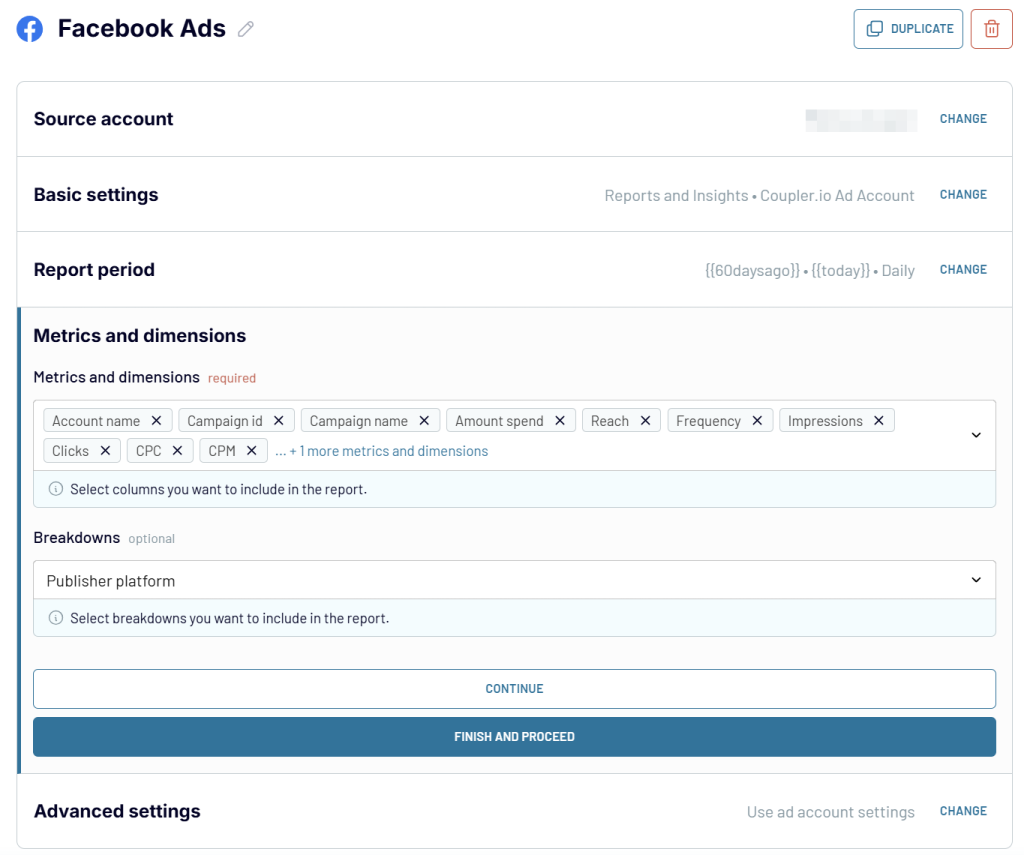
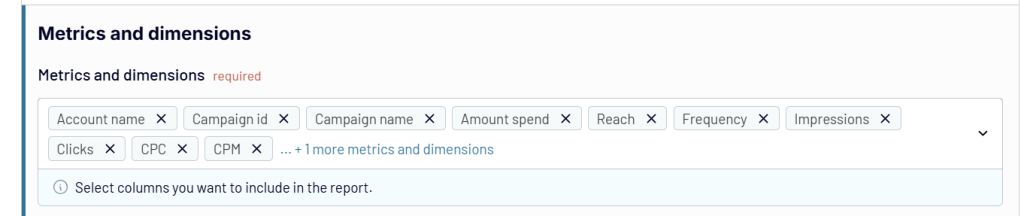
For each report type, you’ll also need to specify the required parameters. For example, if you choose Reports and insights, select ad accounts from where to extract data, as well as specify the report period (start and end dates) and metrics+dimensions.
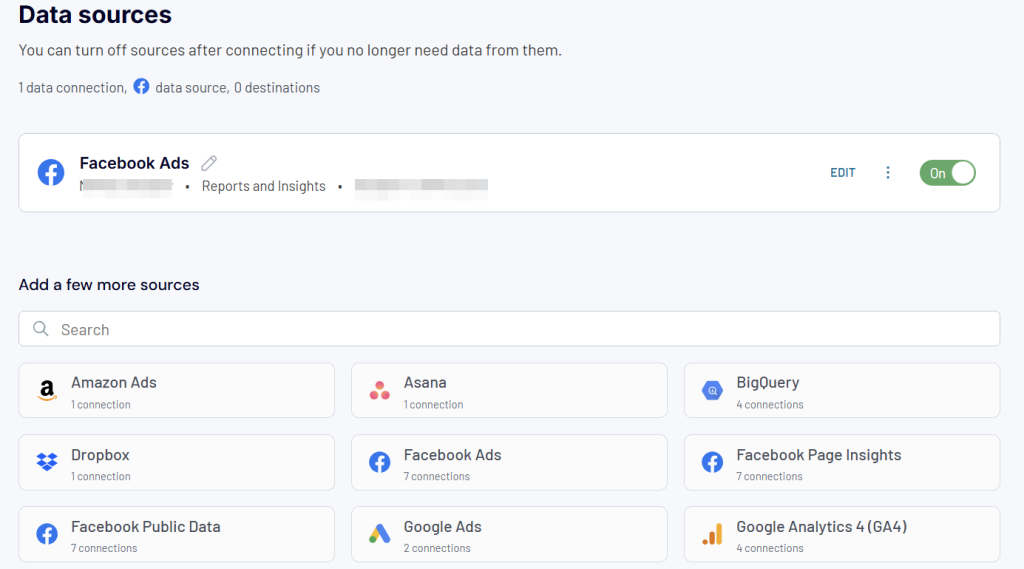
Before moving next, Coupler.io also allows you to connect more sources. This is useful for creating multi- or cross-channel PPC reports like Google Ads and Meta Ads campaign performance dashboard.
All you need to do is select the needed source and set up the connection.
Step 2. Transform data from Facebook Ads before loading it to the destination
At this step, Coupler.io enables you to turn your raw Facebook Ads data into a report. You can preview the dataset and apply some transformations:
- Sort and filter data based on the selected criteria and specified value.
- Manage columns (hide, rename, reorder, change data type).
- Add new columns using supported calculation formulas.
- Summarize data by performing operations like sum, average, count, min, or max on specific columns.
- Append or join data if you’ve connected multiple data sources.
Step 3. Load data and schedule data refresh
Now, onto the destination settings. Follow the in-app instructions to connect and load your Facebook Ads report to the chosen destination. For example, to export Facebook ads data to Google Sheets, you’ll need to connect your Google account, select the spreadsheet and sheet to import the data to. You can create a new sheet by typing a new sheet name.
You can also export Facebook Ads to Excel or Facebook Ads data to BigQuery if you’d like.
After that, toggle on the Automatic data refresh feature and decide on the schedule that will govern the data refresh. You can have your data updated as frequently as every 15 minutes.
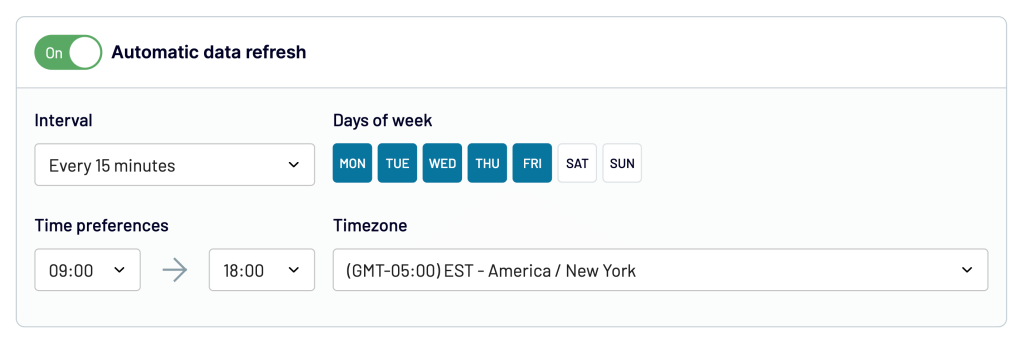
When you’re finished, press Save and run to launch the data flow from Facebook Ads to your destination.
Turn Facebook Ads data into insights with free dashboard templates
Coupler.io lets you connect Facebook Ads to BI tools such as Looker Studio, Power BI, Tableau, and Qlik. In this case, you’ll need to create your report or dashboards from scratch. However, there is a better option – use the free templates. Coupler.io offers a few templates designed to analyze Facebook Ads and other PPC platforms.
Facebook Ads dashboard template
The Facebook Ads dashboard provides a complete overview of your ad campaigns, from clicks to costs. It helps you better understand the efficiency of your PPC campaigns and track essential metrics.
Key insights:
- Frequency meter: Track how often users see your ads to optimize engagement and avoid overexposure.
- Clicks by demographics: Visualize which audience segments engage most with your ads using a bar chart.
- Monthly dynamics: View monthly trends for key metrics like impressions and clicks, simplifying long-term progress tracking.
- Country breakdown: Identify top traffic sources by country and adjust your targeting strategy accordingly.
You can easily connect the dashboard to your Facebook Ads account. With a few clicks, the latest information is loaded to the selected template version, and your dashboard is populated with records. No manual data refresh will be needed since Coupler.io automates the data flow on a schedule.
If you prefer managing your reporting in external BI tools, check out the Facebook Ads dashboard templates available for Looker Studio, Power BI, and Google Sheets. Pick the version that meets your reporting needs and try it out.
Facebook Ads dashboard template in Looker Studio
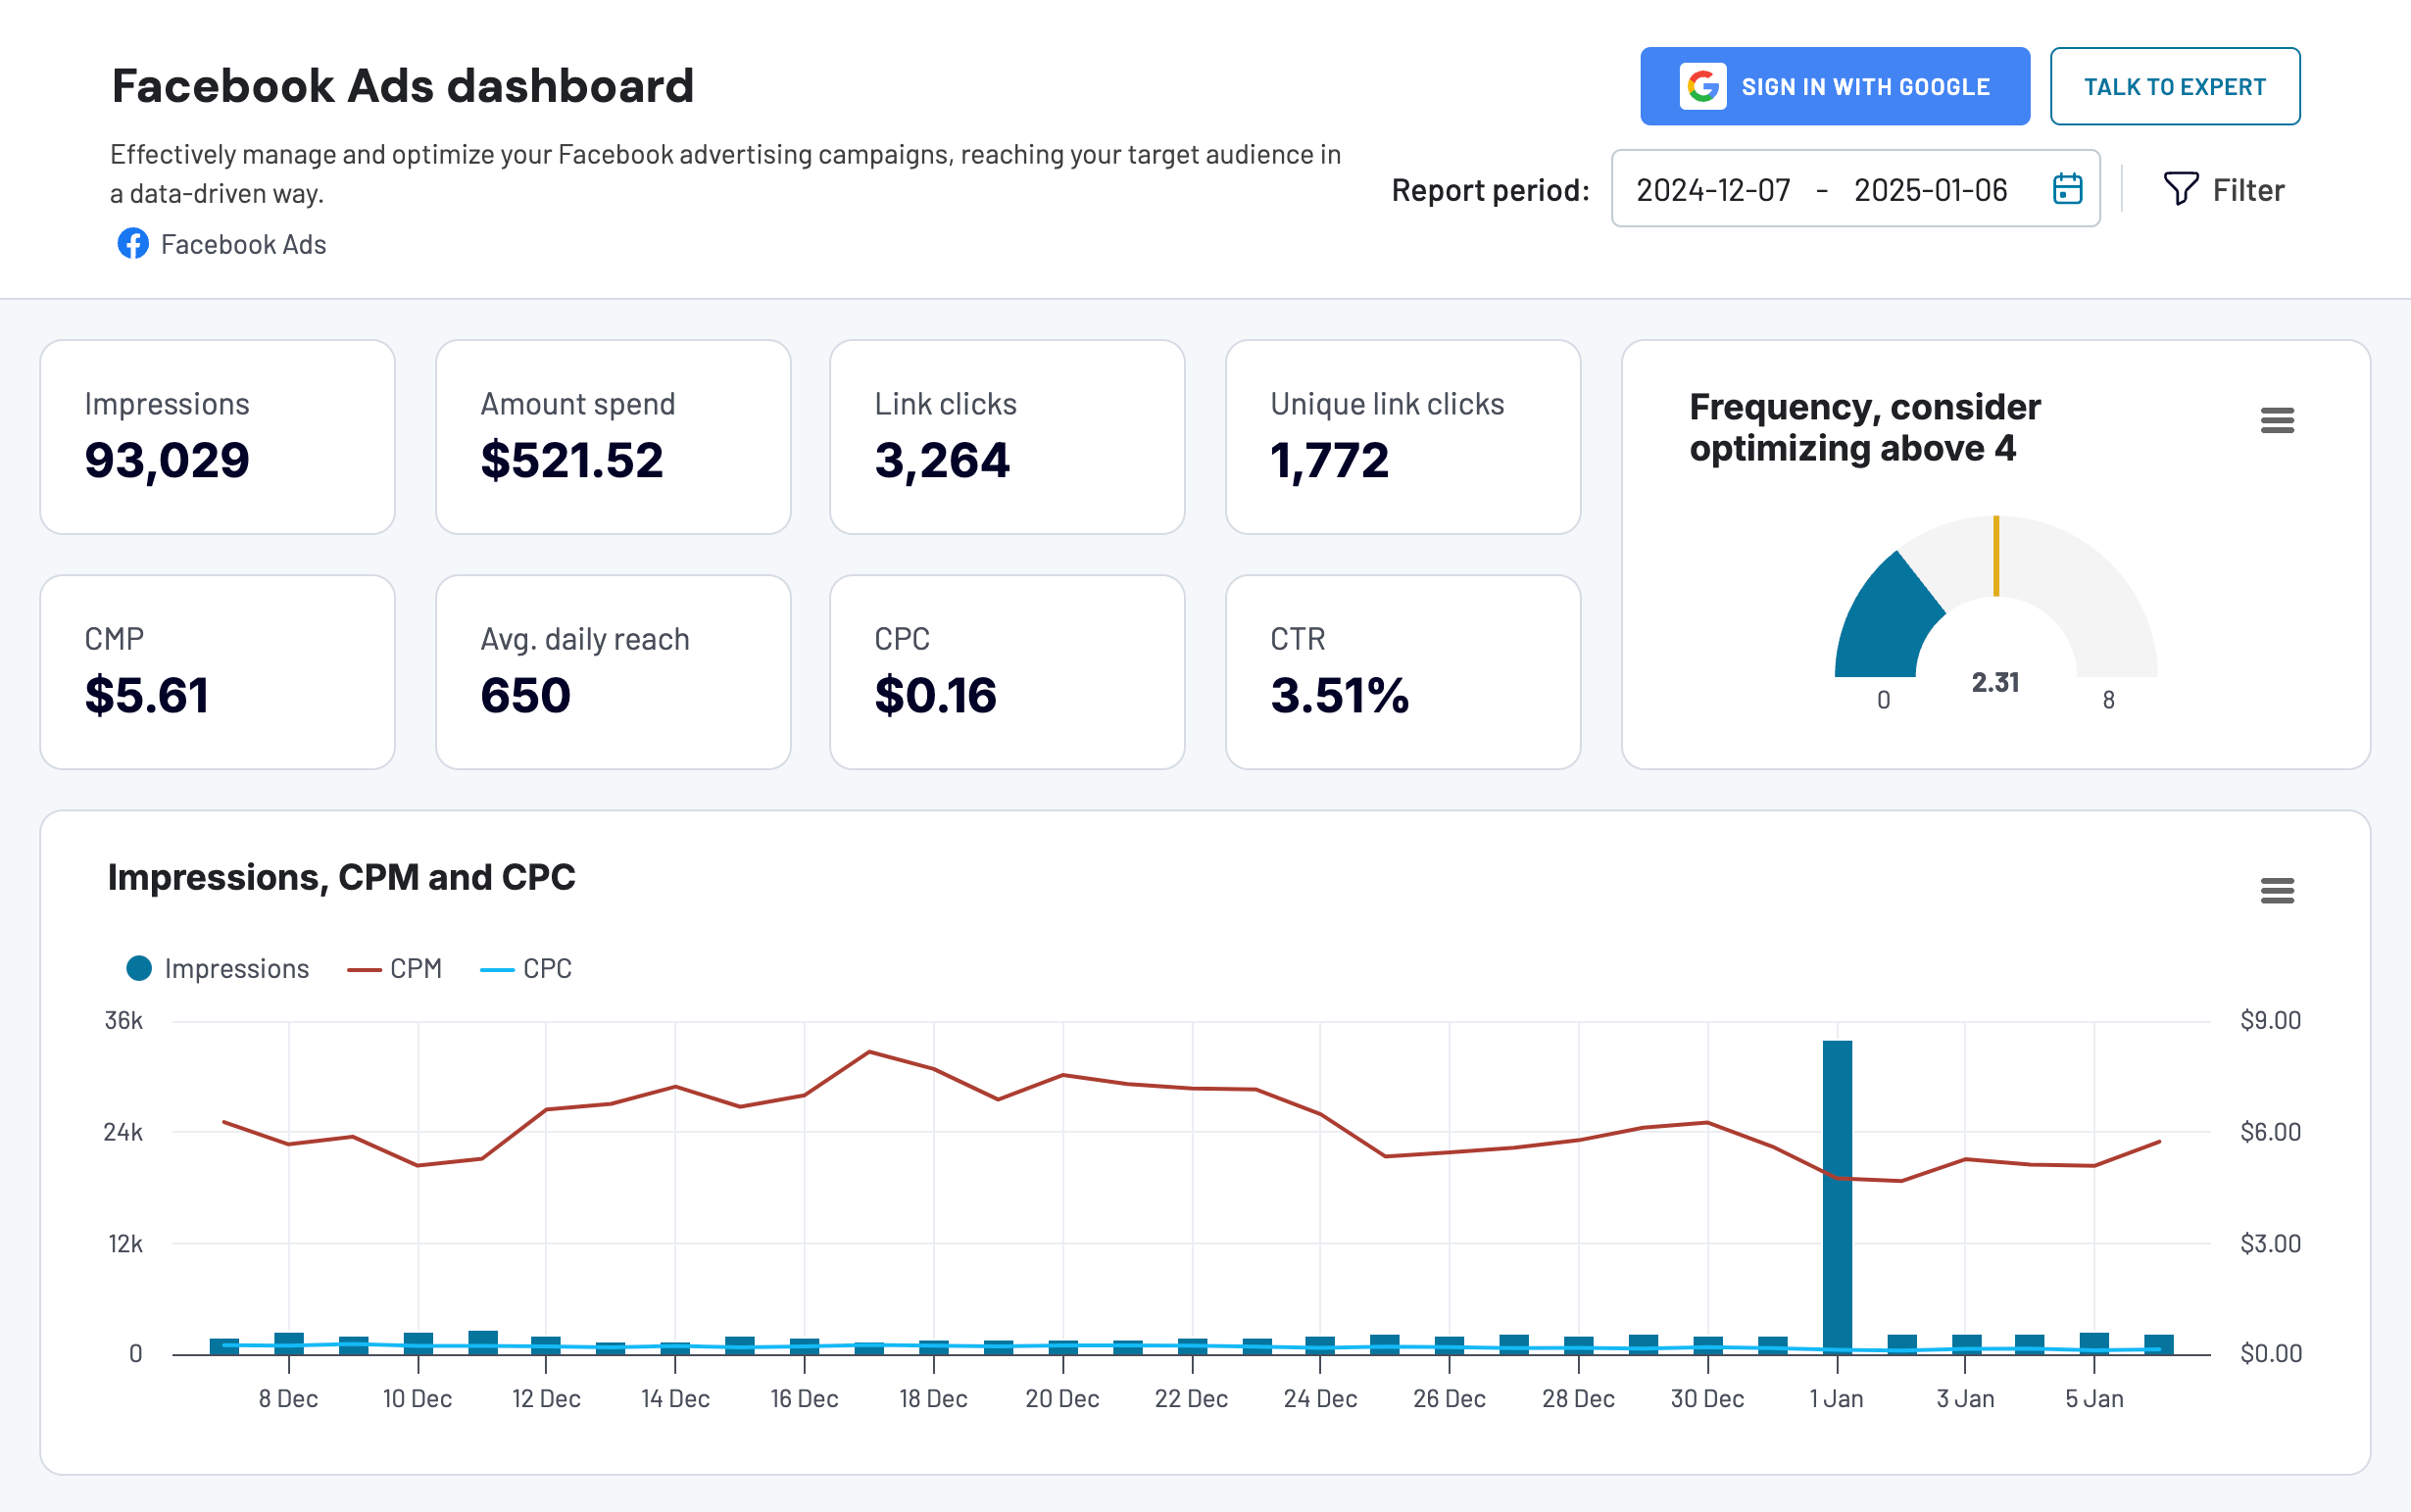
Effectively manage and optimize your Facebook advertising campaigns, reaching your target audience in a data-driven way.


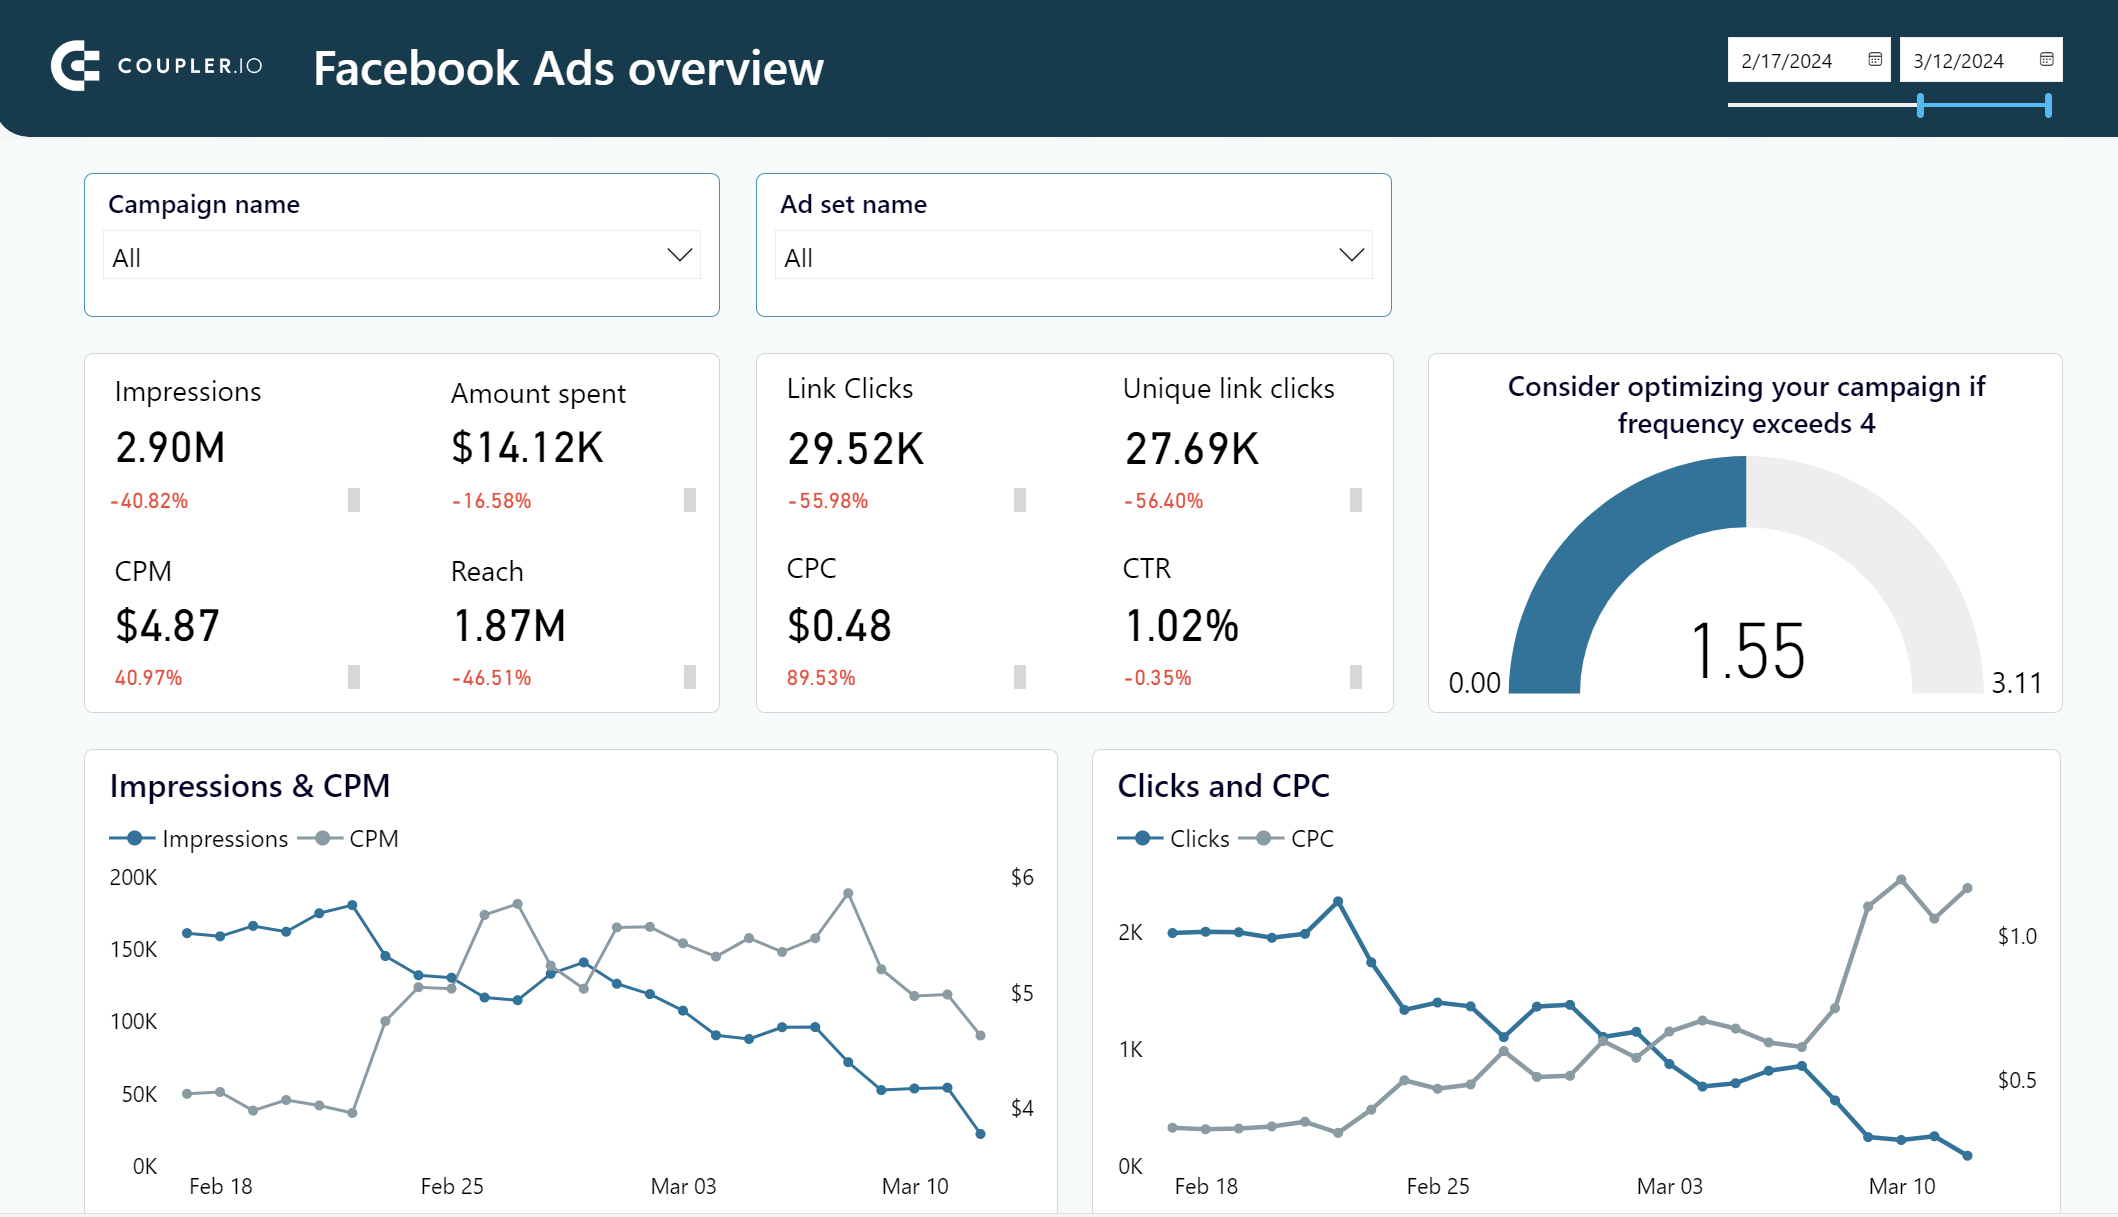
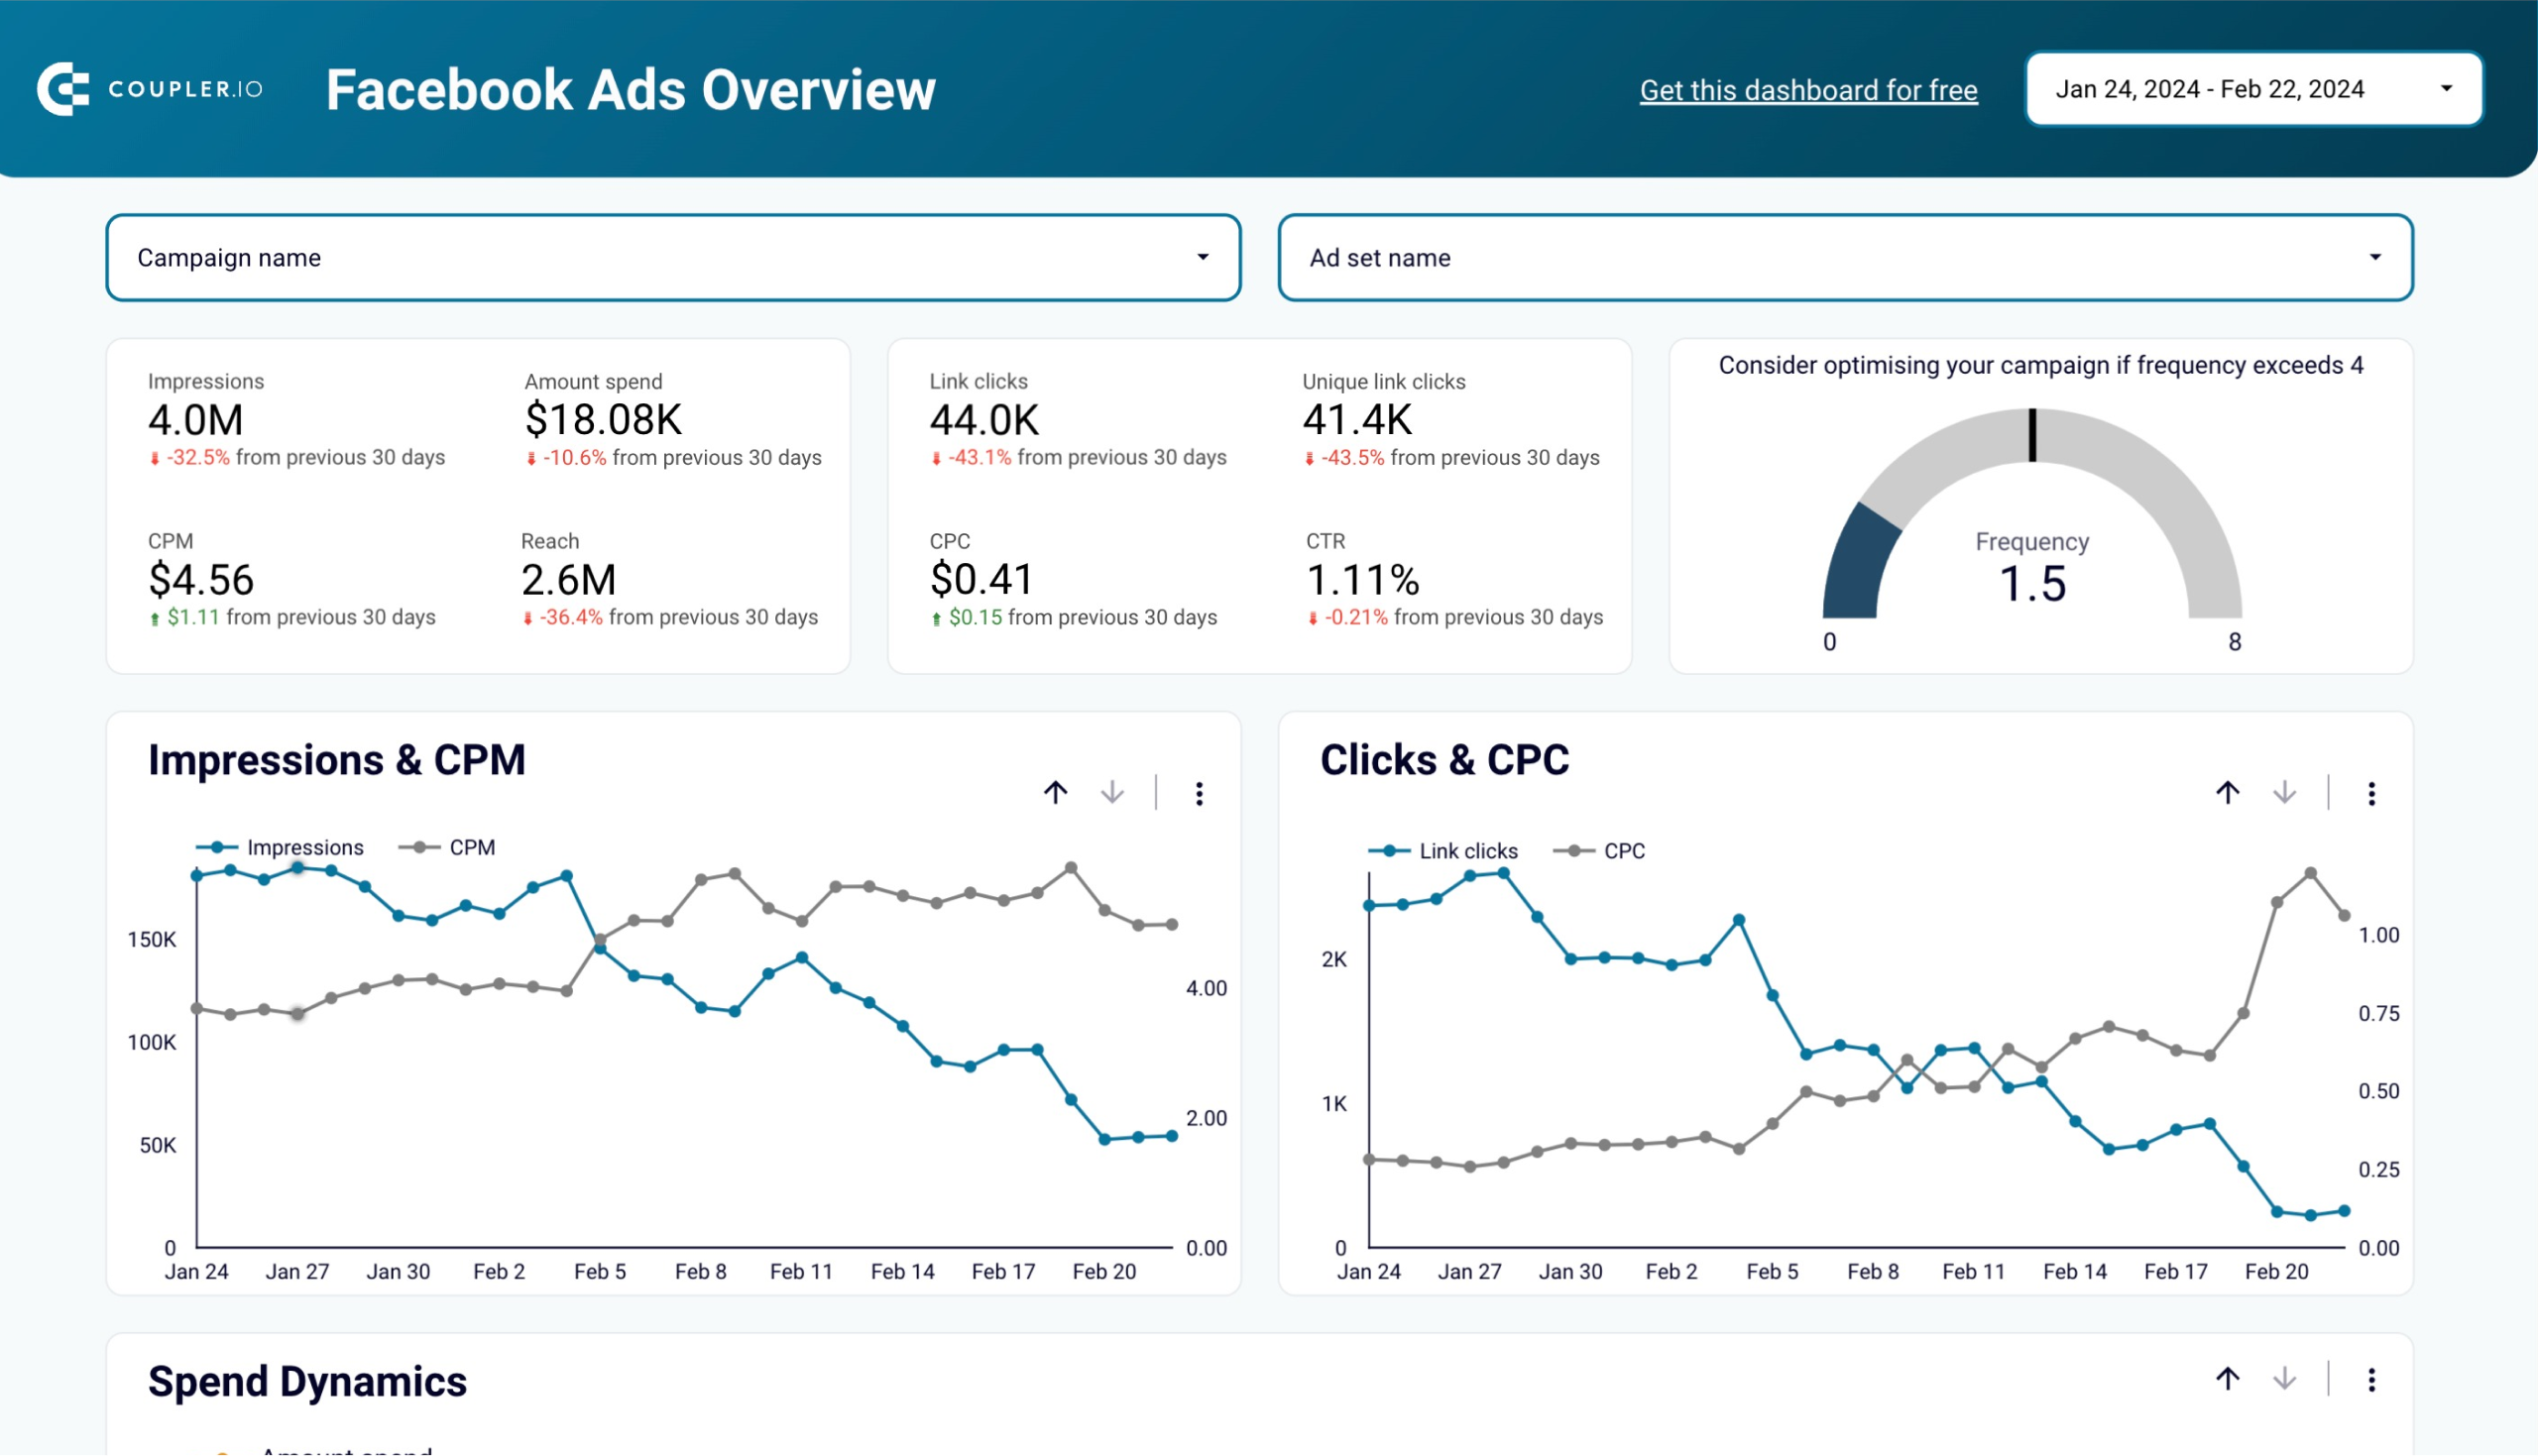
Facebook Ads dashboard template in Power BI
Get a detailed overview of your advertising campaigns’ performance using a dynamic Power BI dashboard template equipped with a no-code Facebook Ads connector

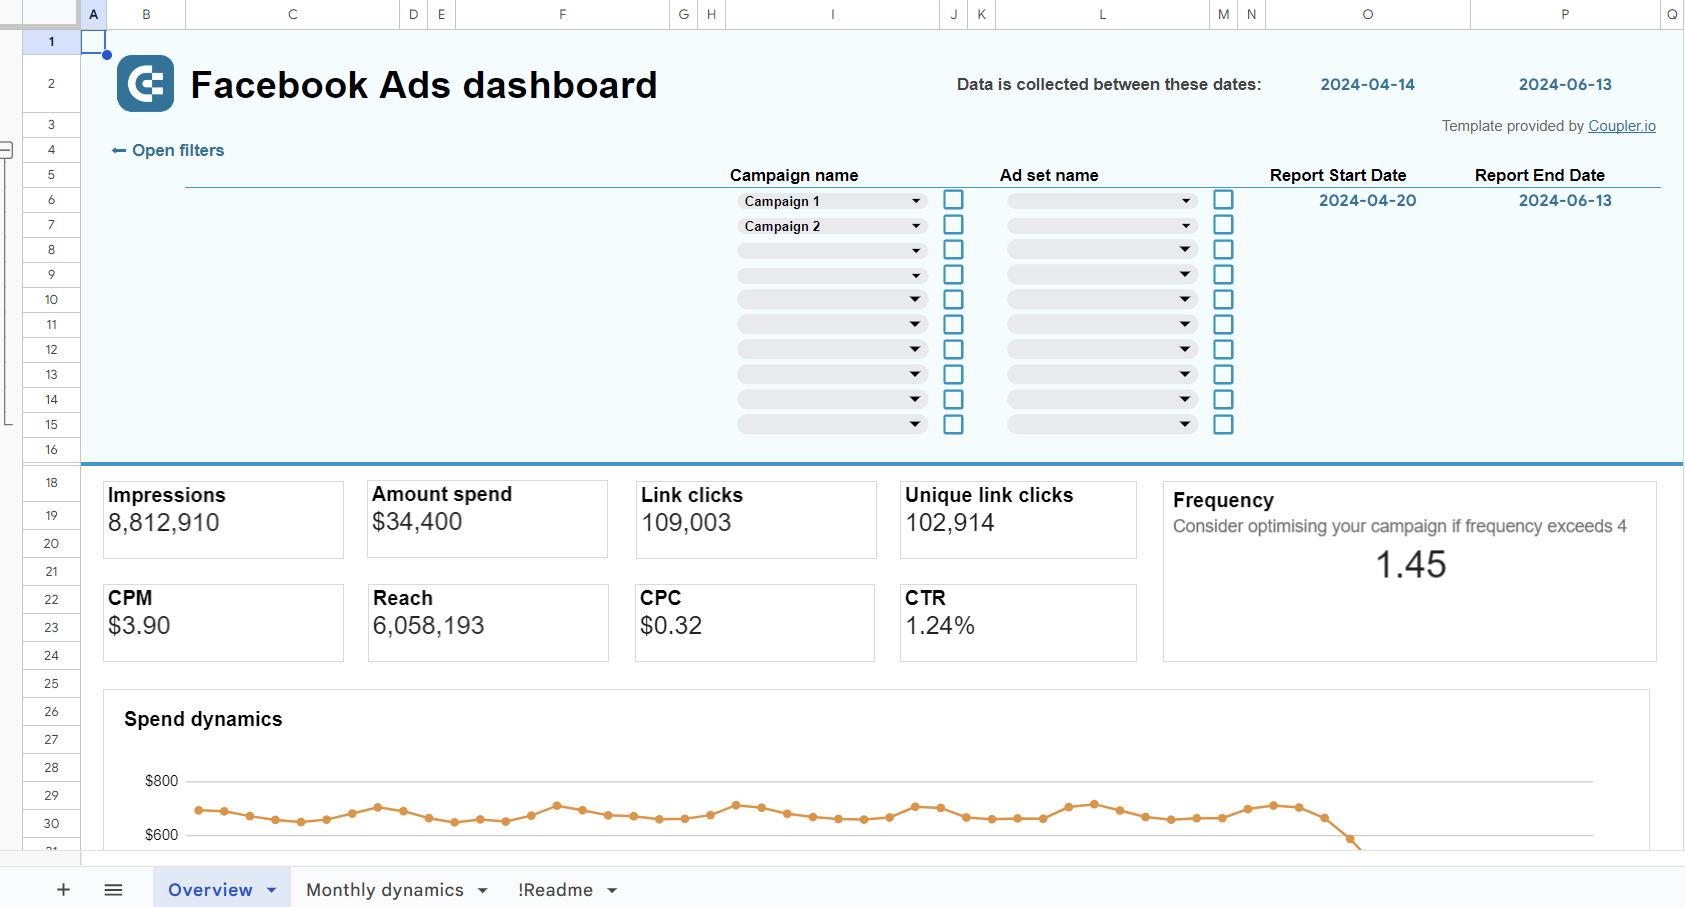
Facebook Ads dashboard template in Google Sheets
Monitor the performance of your advertising campaigns in Facebook and identify top assets to spend your budget wisely.

Facebook Ads leads breakdown dashboard template
The Facebook Ads leads breakdown dashboard helps you evaluate your ad campaigns’ lead generation performance. It’s designed in Looker Studio and equipped with the Coupler.io connector.
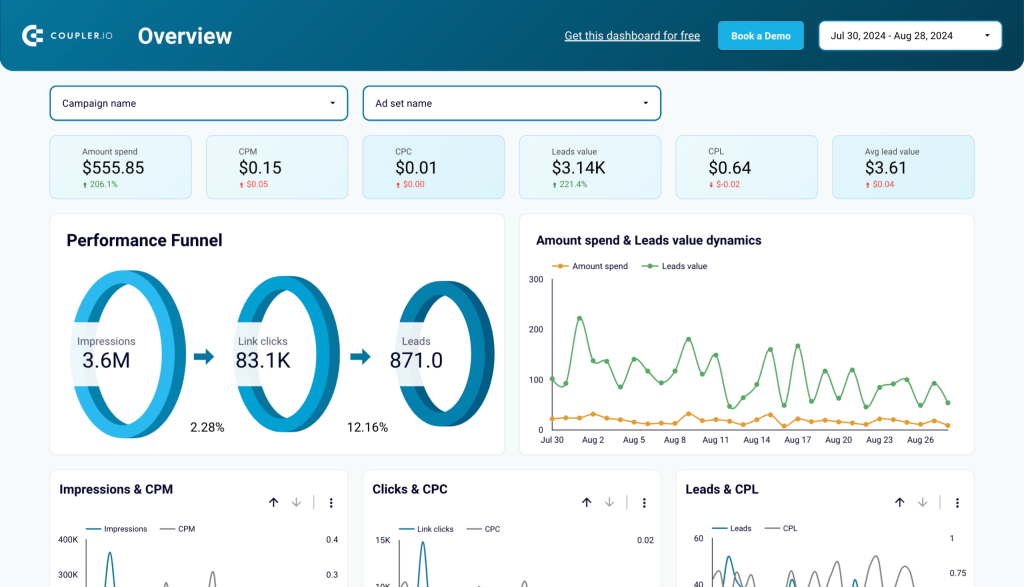
Key insights:
- Performance funnel + leads value dynamics: See how impressions convert to clicks and leads, and track lead value over time.
- Campaign performance breakdown: Compare the performance of individual campaigns, including leads and their value.
- Monthly dynamics: Track month-to-month changes in metrics like clicks, leads, and cost per lead.
- Leads by demographics: Analyze lead generation by age and gender for clearer audience targeting.
- Country breakdown: Identify top-performing countries for lead generation and adjust your strategy based on geographic insights.
Just connect your Facebook Ads account to a comprehensive report showing how your ads perform in terms of leads generation.
Facebook Ads purchases breakdown dashboard template
The Facebook Ads purchase dashboard helps you evaluate the effectiveness of your ad campaigns in driving purchases. It’s a Looker Studio template that you can easily connect to your FB Ads account using Coupler.io connector.
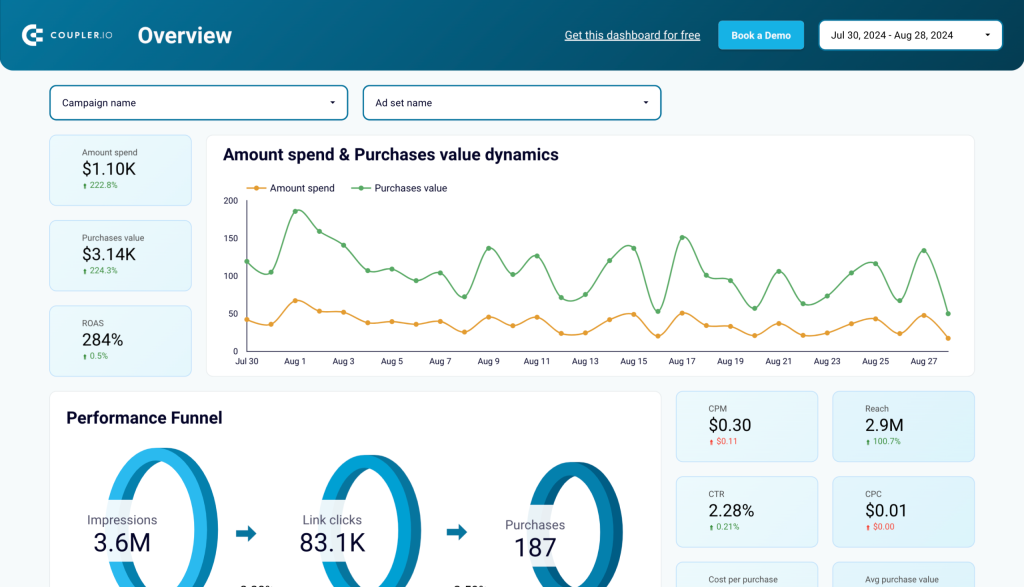
Key insights:
- Purchases value dynamics: Track purchase value over time and compare it with ad spend to gauge return on ad spend (ROAS).
- Performance funnel: Visualize how impressions lead to clicks and ultimately to purchases, revealing your conversion efficiency.
- Campaign performance breakdown: Compare purchase count and value across campaigns for deeper optimization.
- Monthly dynamics: Monitor key metrics like clicks and purchases over time to identify trends.
- Purchases by demographics: Analyze purchase volume and value by age and gender to optimize targeting.
- Country breakdown: Discover which regions drive the most purchases to refine your geographic strategy.
Load the data from your Facebook Ads account using the Coupler.io connector and get a ready-to-use dashboard to analyze purchases driven by your ad campaigns.
Facebook Ads performance for mobile apps dashboard template
To improve mobile app installs with Facebook Ads, you need to understand which ads actually convert. The Facebook Ads performance for mobile apps dashboard gives you real-time insights into ad performance, user acquisition, and return on ad spend (ROAS). It helps you optimize budgets, improve targeting, and drive more installs and purchases.
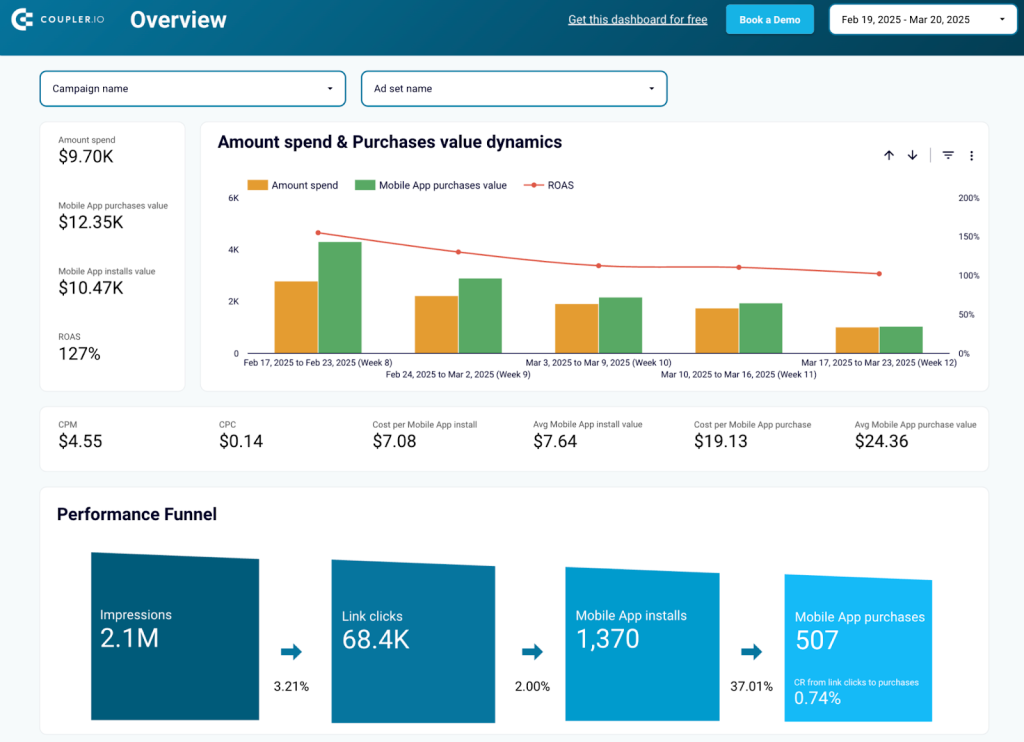
Key insights:
- Understand the customer journey: Analyze how users move from impressions to clicks, installs, and purchases to identify where drop-offs occur and improve conversion rates.
- Optimize ad spend and maximize ROAS: Track spend vs. revenue trends to adjust bidding strategies and allocate budget better.
- Improve engagement: Evaluate click-through rates (CTR) and cost per click (CPC) to refine ad creatives and audience targeting.
- Reduce acquisition costs: Monitor app installs and their cost per install to optimize ad placements and campaign settings.
- Boost purchase conversion rates: See how ad spend translates into purchases and adjust targeting strategies for high-value users.
- Refine geographic targeting: Identify top-performing countries or regions for installs and purchases so that you can adjust ad spend distribution.
- Leverage long-term trends: Review monthly performance trends to make data-driven budget decisions and improve campaign planning.
To get this dashboard with your data, sign up for a free Coupler.io account, connect your Facebook Ads account, and follow the instructions in the Readme tab.
Meta Ads creatives dashboard template
The Meta Ads creatives dashboard gives you a complete overview of your ad creatives’ performance on Facebook and Instagram. It helps you make data-driven decisions to improve engagement, optimize costs, and maximize your return on investment (ROI).
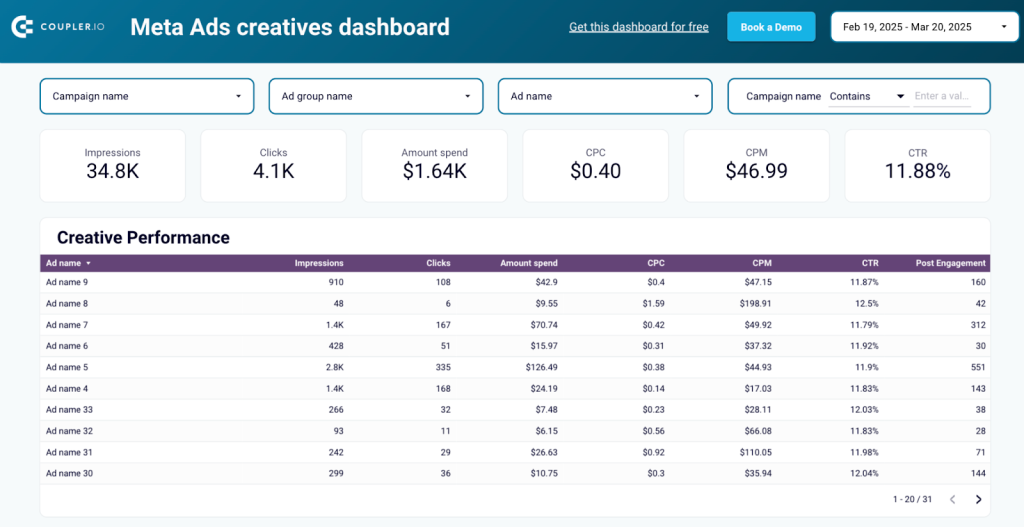
Key insights:
- Creative Performance: Get a detailed breakdown of each ad creative’s performance, including engagements, CTR, CPM, CPC, conversions, and total spend.
- Impressions & CPM: Track how many times your ads are seen and analyze cost efficiency with CPM trends over time.
- Clicks & CPC: Visualize click-through trends and cost per click (CPC) to monitor audience engagement and detect performance fluctuations.
- Spend Dynamics: Keep track of your ad spend over time to ensure your budget aligns with campaign goals.
To know how your creatives are performing, simply sign up for a free Coupler.io account, connect your Meta Ads account, and follow the instructions in the Readme tab of the template. The dashboard will auto-populate with your creatives’ data in minutes.
How do you export all Facebook ads?
It’s also very easy to export all ads from your ad accounts. Follow the steps above to set up a data flow in Coupler.io. When choosing a Report type, select List of Ads. It will fetch all the ads from the selected accounts.
Now, run the data flow and the data will be imported into the destination of your choice.
How to export all of your targeting parameters in Facebook Ads?
The targeting parameters are available with the export of ad sets. That’s another data entity you can fetch with Coupler.io by following the steps above.
When setting up, choose List of Ad sets as a Report type.
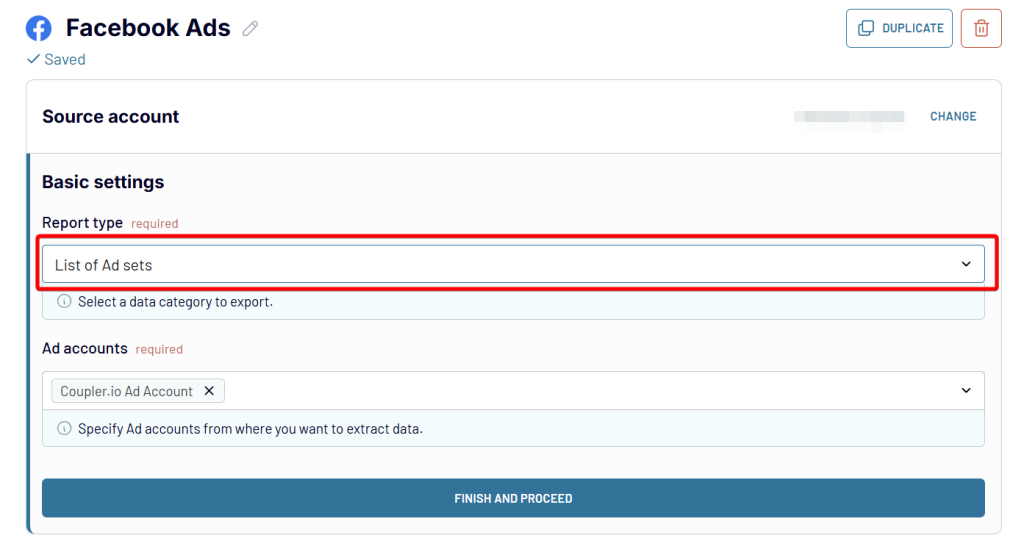
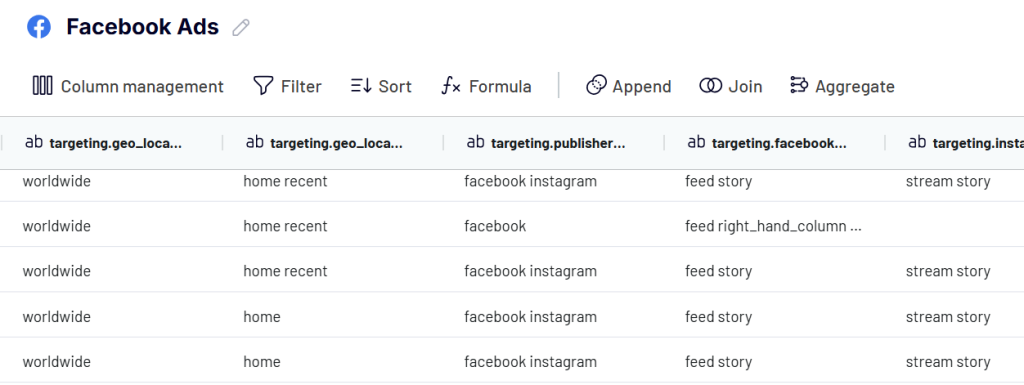
At the Transformation step, you’ll see various fields containing all the targeting parameters used with particular ad sets.
How do you export Facebook Ads spend per day?
This is also possible with Coupler.io. The information about daily spending on ads is available in the Reports and insights data entity. Before you proceed, you’ll need to specify several details.
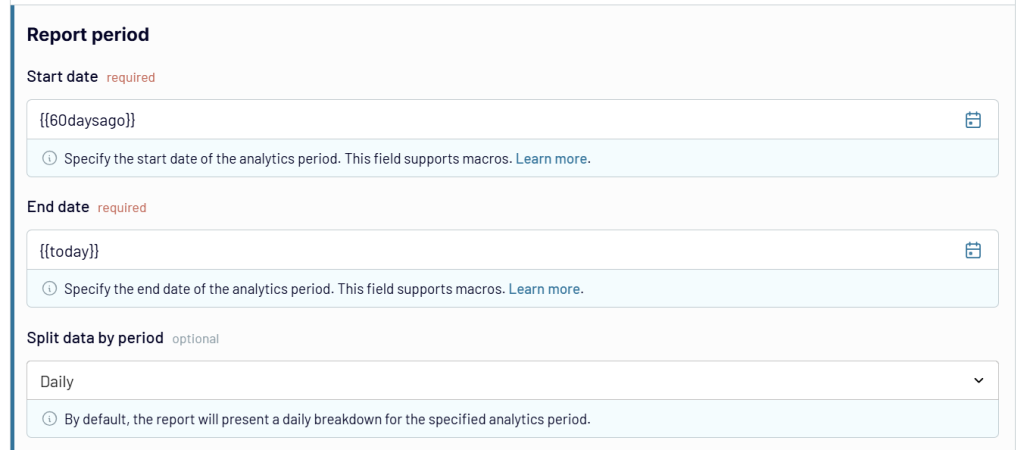
Select the period for your reports. If you wish to fetch historical data, just pick the desired dates.
For ongoing imports, it would make sense to use macros like {{yesterday}}, {{today}}, and so on. Each time, it would fetch the amount spent on ads during the specified period along with a number of other details, such as views, impressions, or conversions. There’s more information on using macros in our knowledge base.
Optionally, choose how you wish to split data by periods. Daily split is the default value for the entire reporting period.
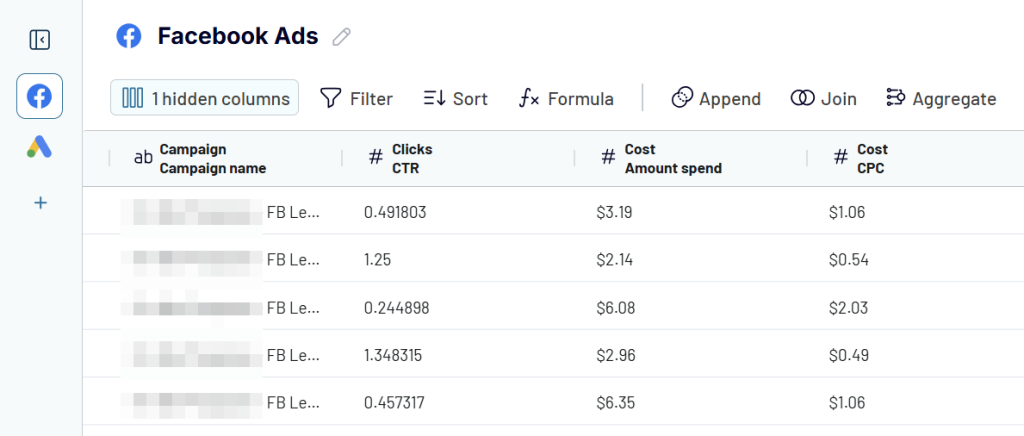
Finally, select the metrics to include in the report. You need the Amount spend column among the others.
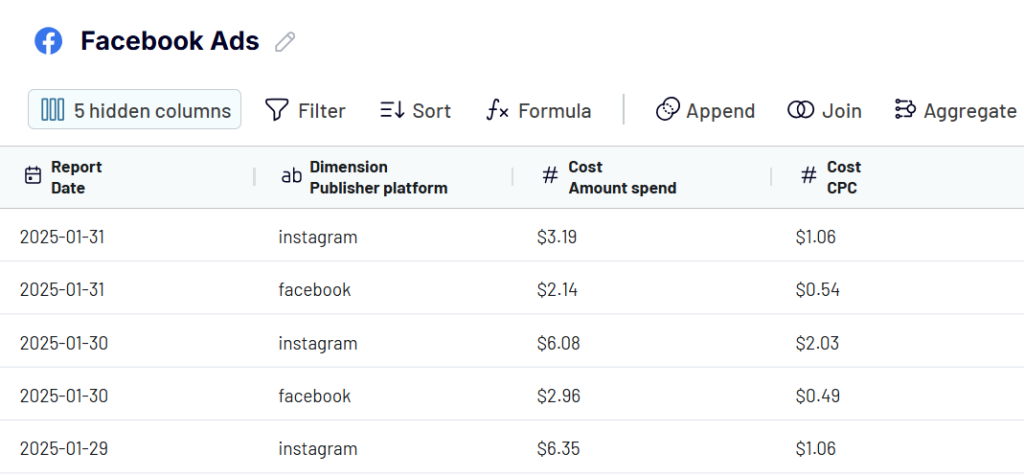
Here’s a piece of our sample export with the daily amount spend that you can preview right in the UI:
How do you export results data from Facebook Ads?
As was the case for daily spending, the other results of your ad campaigns are also available in the Reports and insights data entity. Select it when setting up your importer.
Select an Ad account for which you want to fetch the results. As was the case above, decide on the reporting period, how to split data, and the columns to include. The options are plentiful.
How do you export leads from Facebook Ads?
You can easily do this with Coupler.io. When creating a data importer with Facebook Ads as the source, select the report type as List of Sponsored Leads data entity, select your page, and the lead forms.
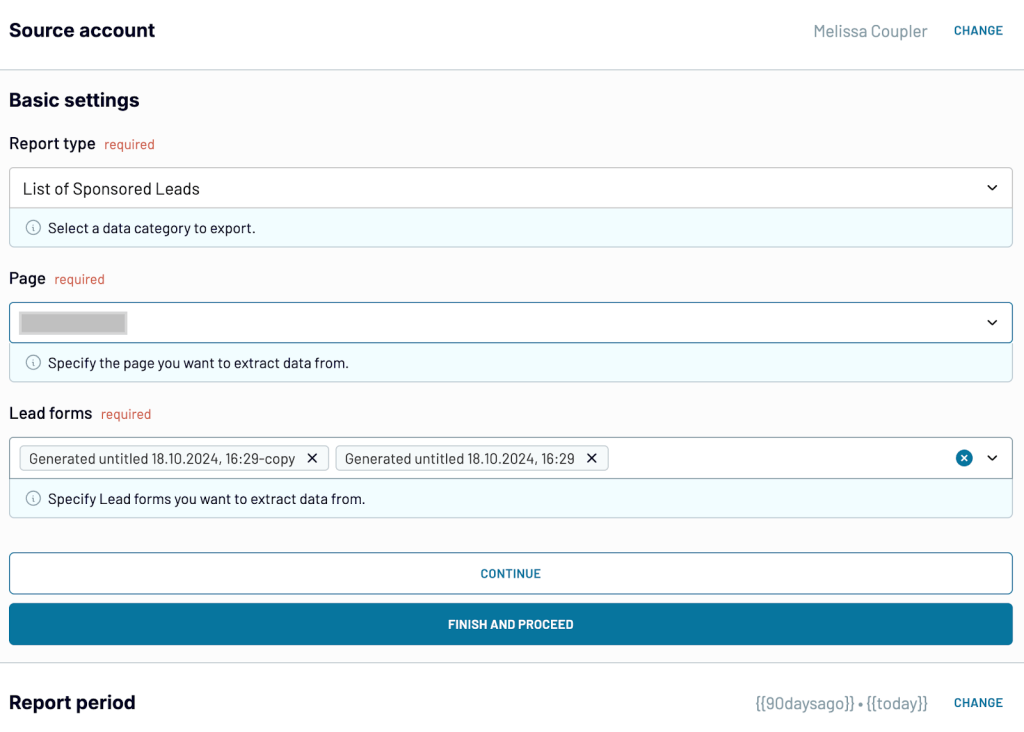
Select the report period using either actual dates or placeholders. If you’re using placeholders, ensure the duration does not exceed 90 days as leads will automatically disappear 90 days after they’re acquired.
To avoid losing this data, make sure to run this process regularly.
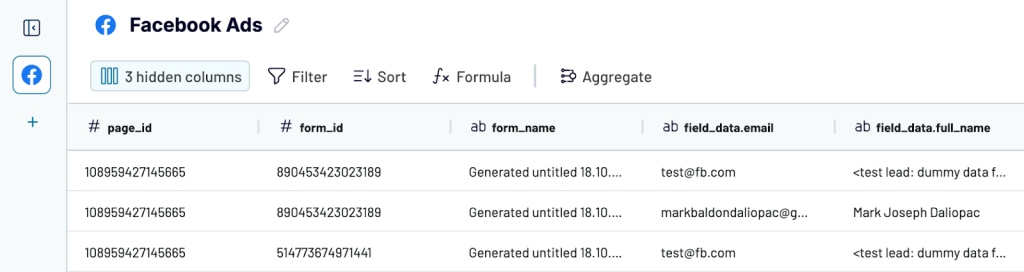
In the next step, you’ll see the list of leads collected in a table. You can organize this data by hiding unnecessary columns, sorting and filtering data, and more.
After this, configure the destination settings and set a data refresh schedule. Your leads data will now be automatically updated in the destination.
Alternatively, there are two more ways to fetch leads from Facebook Ads:
- Manually export leads into a .csv or .xlsx file.
- Use the leads_retrieval permission of Facebook’s Graph API to pull specific or all leads associated with your ads.
To fetch the leads manually:
- Jump to the Business Suite.
- Open the menu to the left, select All Tools and then find Instant Forms.
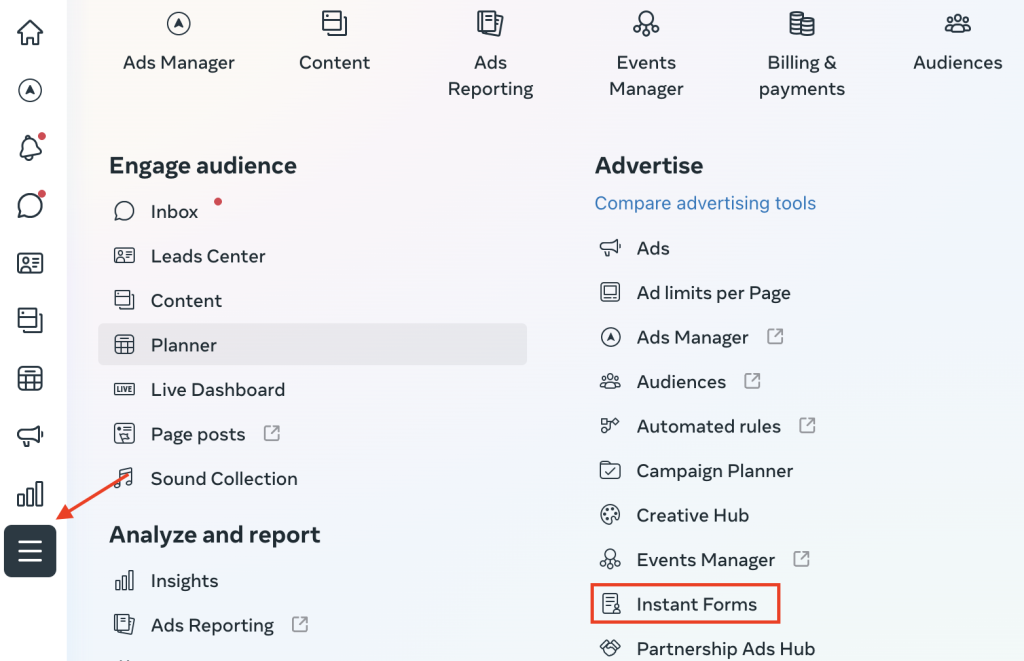
- Pick either of your forms and press Download next to it. You can either:
- Download New Leads – fetch only the leads acquired since the last download, or
- Download by Data Range – which will fetch all leads acquired in the selected range.
- Choose the desired format for export.
Note that leads will disappear 90 days after they’re acquired so it’s important to be running this process regularly.
What’s included in the user export data from Facebook Ads?
The standard export of leads contains:
- The ID of the lead.
- The ID & name of an ad, an ad set, and a campaign that led to capturing this lead.
- Form ID and name.
- Is_organic field that tells you whether a lead was obtained via organic measures.
- A platform that a lead used to leave their contacts
- Answers to any custom questions you added to the form.
Note that to see all this data, you need to meet two criteria:
- You need to be an admin of the respective Facebook page.
- You need to have the permissions sufficient to see all of the lead data in your ad account.
If you don’t fulfill either of these conditions, you may still be able to export the data but the export will be limited.
How to export data from Facebook Ads Manager?
Facebook Ads Manager is the center of reporting on ads. Here, you’ll see all campaigns, ad sets, and ads you’ve run and will be able to dig deeper into Facebook Ads management.
Before you export Facebook ads, first decide on precisely what you want to pull from Facebook. Select specific campaigns or opt to fetch all of them. Decide on one of the preset timeframes (e.g., “last 7 days”, “this month”, etc.) or pick a custom date. Finalize the details and then click on the Reports menu in the top-right corner of the page.
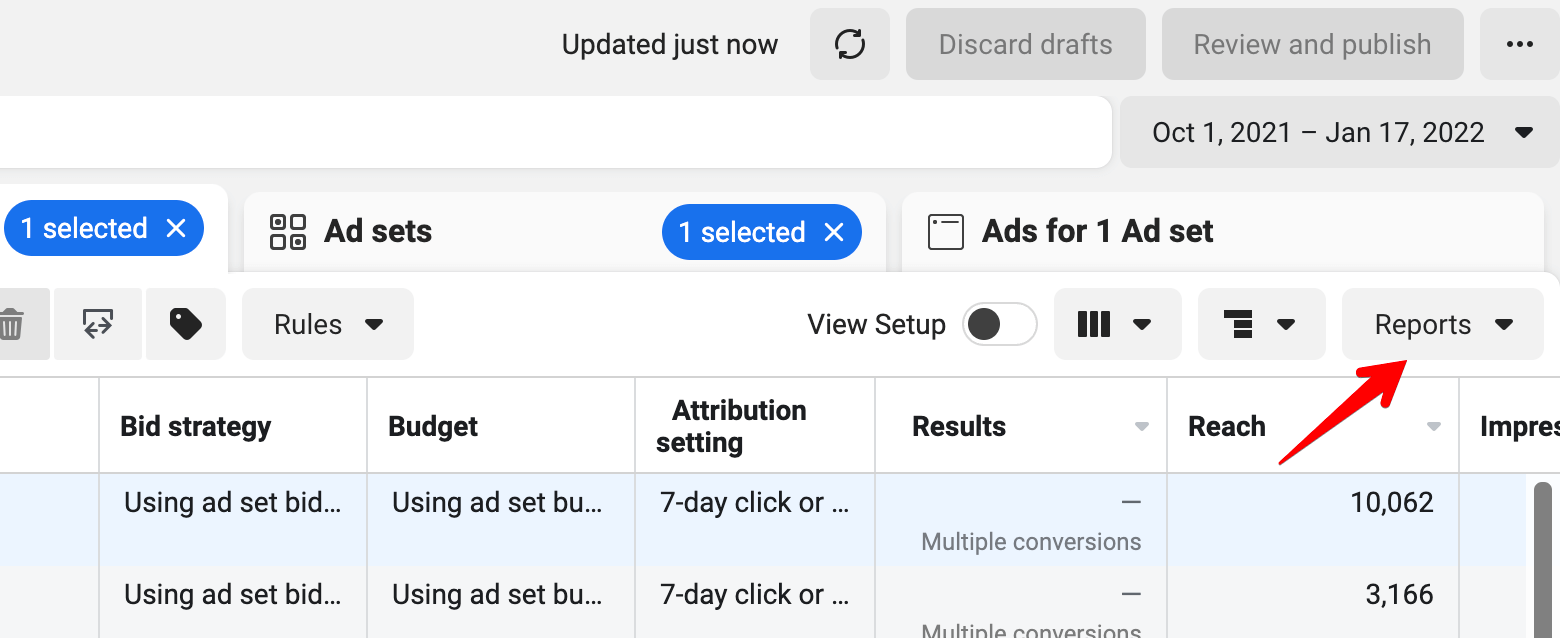
Then, select Export Table Data and pick the desired format. Among the available options are .csv and .xlsx. You can also get the data ready to be used with built-in Ads Reporting and Facebook Ads Manager for Excel.
If you picked .csv or .xlsx, you can now import it into the tool of your choice. .xlsx are mostly suitable for Excel, while .csv will work with virtually any tool willing to accept your data.
Export Facebook Ads Manager data to CSV every month
The method above requires you to manually export the report every time you need the fresh data. This won’t work for many. Luckily, there’s a way to automate the export of Facebook Ads data and have a report emailed to you at a chosen frequency.
Back on the Ads Manager homepage, click the Reports button once again. Choose to Create Custom Report.
Here, decide on the type of report (pivot table, trend, or bar chart). Add any fields you would like and decide on the timeframe. As it will be a recurring report, using one of the presets makes sense. For a monthly report, a “last month” preset seems to make the most sense.
When you’re ready, press the button to the right of the report name.
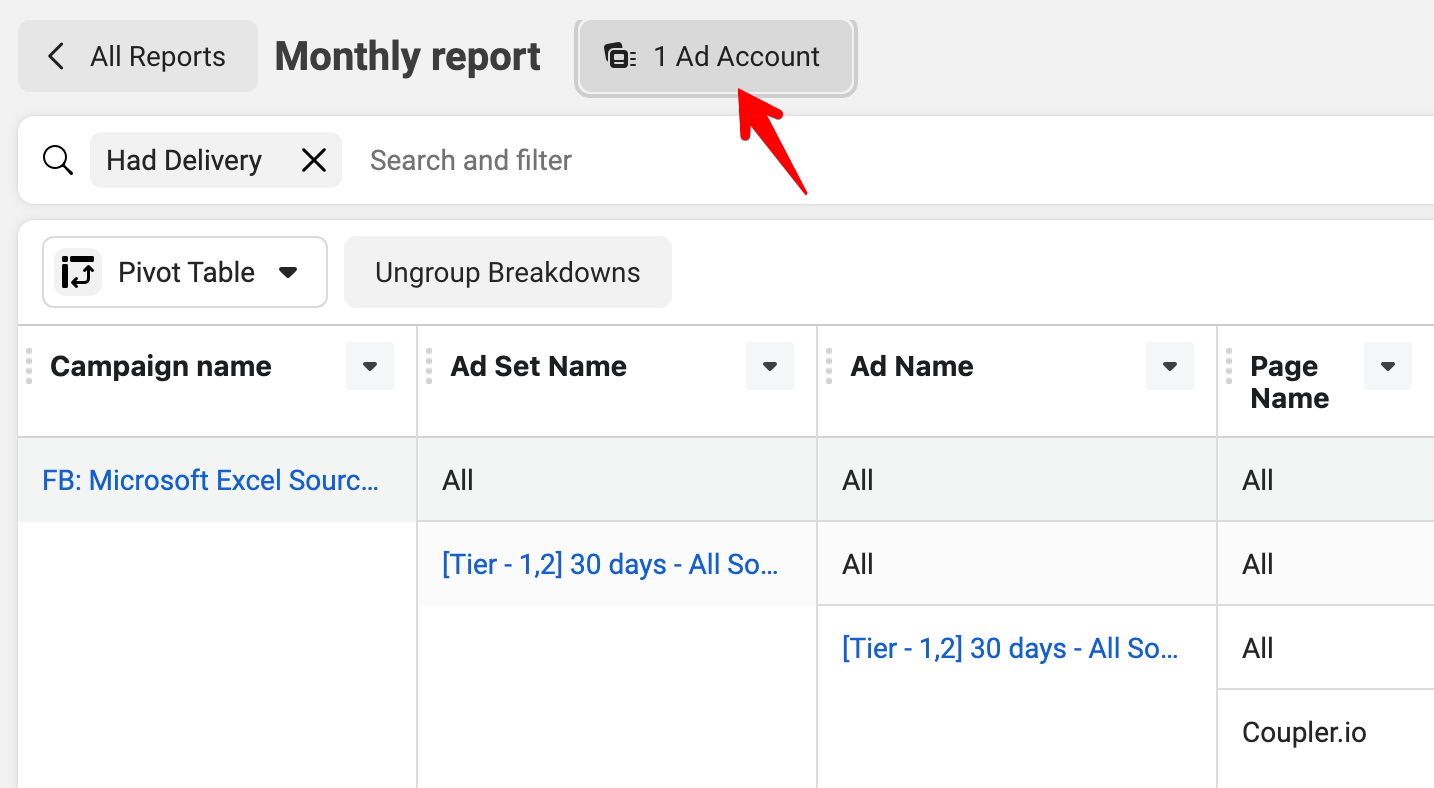
Decide on the Ad Account. Then, toggle on Schedule Email. Choose when the report should be delivered and select who should receive it. Then, press Apply.
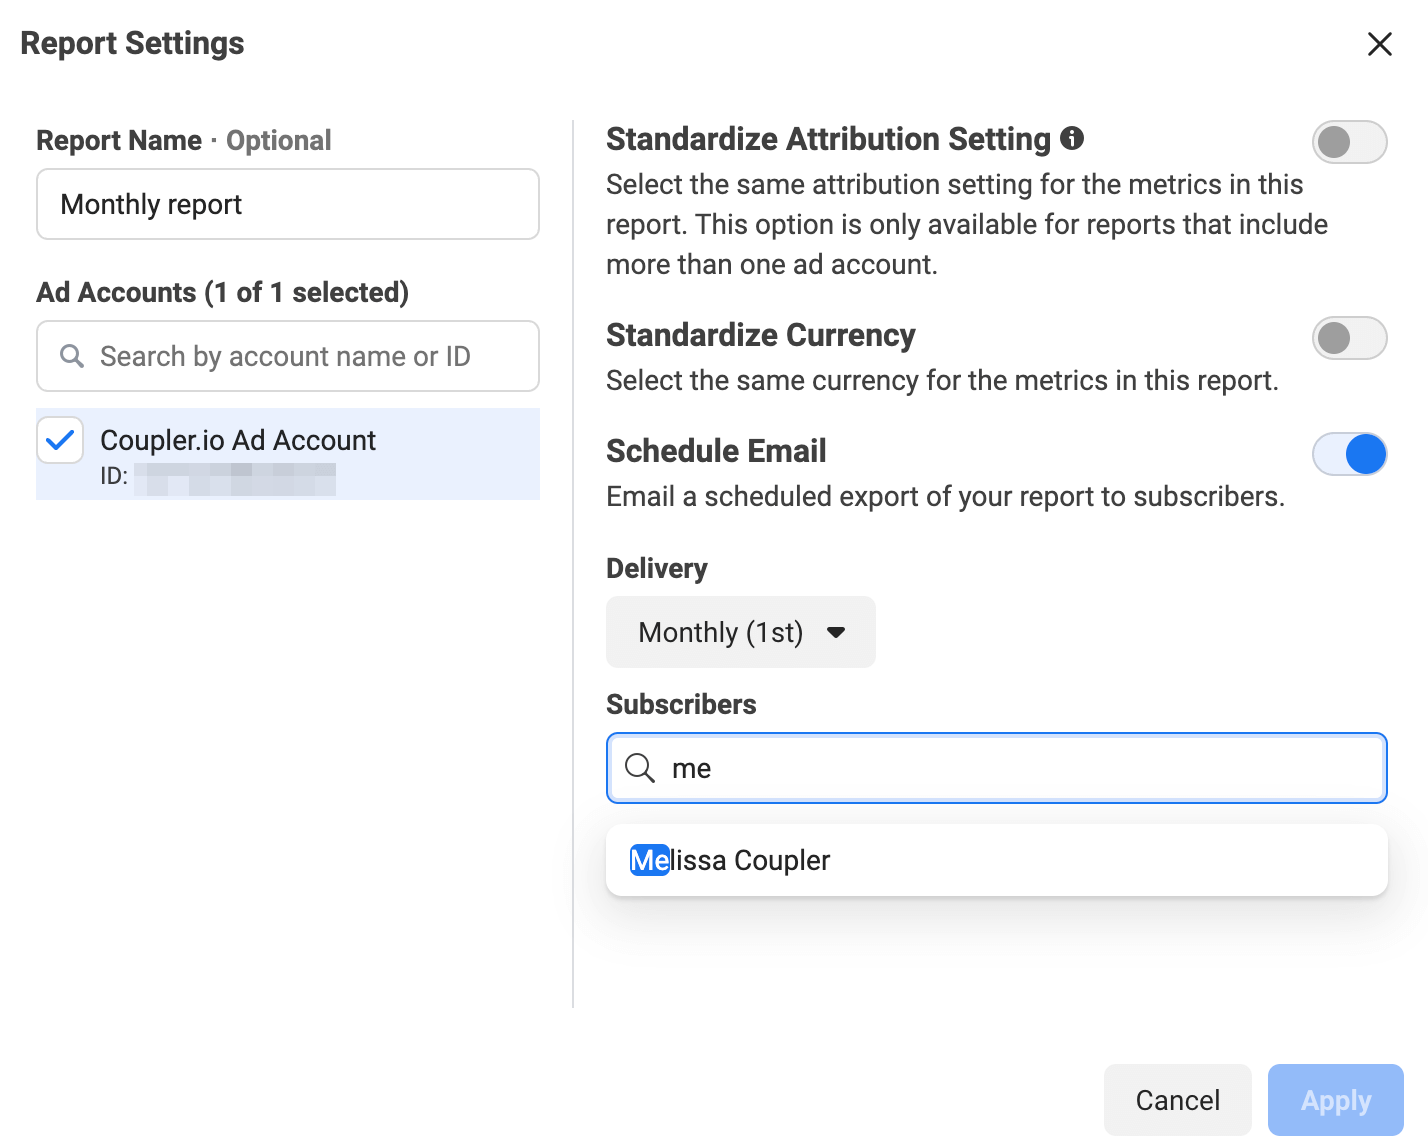
Note that you’ll only be able to add people with access to the Ads Manager as recipients. If you’d like to email an external stakeholder, you’ll need to download a report first and then send it to them manually.
Alternatively, you can automatically export a Facebook Ads report into a dashboard or a tool of your choice. That’s something we’re going to discuss next.
Why export Facebook Ads?
Exporting Facebook Ads data opens up opportunities for much deeper analysis. The most basic thing is to pull the data into your favorite spreadsheet tool, be it Excel, Google Sheets, or any other. With little effort, you’ll be able to see trends, evaluate the profitability of different approaches, and see what works best for your business. It can also give you ideas on how to optimize your Facebook Ads funnel.
Facebook ads data can easily be synced with Facebook Ads reporting tools, or you can connect Facebook Ads to Tableau and other data viz tools like Power BI or Looker Studio. With either of them, you can build beautiful, customizable dashboards, and share them with your teammates and stakeholders. Check out some of the best Looker Studio Facebook Ads templates that we collected for you.
Also, exporting data from Facebook makes sense for the sole purpose of combining it with other data at your disposal. It could be advertising data from other channels, website analytics, user data, or virtually anything else that will enhance your Facebook data.
Do I need to write a program to export Facebook Ads Manager data automatically?
Aside from this handy feature that emails you a report every now and then, Facebook doesn’t have automatic exporting capability. To schedule automatic data exports, you would normally need to delve into Facebook Ads API and write a script that would be querying specific endpoints at regular intervals.
However, you don’t need to do that as there are tools that can export Facebook Ads data for you. The Facebook Ads integration by Coupler.io is a popular choice among advertising specialists since it lets you pull the data into Google Sheets, Excel, BigQuery, Looker Studio, and Power BI on the chosen schedule. This approach doesn’t require any coding and is very quick to set up.
Automate Facebook Ads data export with Coupler.io
Get started for freeHow to optimize Facebook Ads export?
The key to exporting Facebook Ads is in automating the process.
Sure, you can export particular campaigns manually once they’ve run their course. You may also make it a habit to fetch a monthly report and present it to the team. All of these require planning and time that you could be spending elsewhere – for example, analyzing said data.
Don’t shy away from using data visualization tools for drawing charts, A/B testing, and monitoring the key metrics of your campaigns. It’s very easy to load the advertising data into such platforms and build dashboards that will quickly enhance your understanding of what’s happening inside your Ad Manager.
Thanks for reading!


