There’s plenty you can do with QuickBooks – it’s arguably easier to find things you can’t do with the Intuit tool. Each feature you use generates lots of data about your business. It’s accessible from within your dashboard but, for safety and easy access, it makes a lot of sense to export data from QuickBooks Online periodically. We’ll explain how to do it – both manually and automatically, on a chosen schedule.
How to export data from QuickBooks Online with Coupler.io
Coupler.io allows you to set up finance automation through scheduled exports of many different data entities from QuickBooks Online, such as details about each employee, sale, customer, etc. You can load this data to spreadsheets (import QuickBooks to Google Sheets or Excel) and even connect QuickBooks to BigQuery and BI tools. And best of all, you can set up a custom schedule for your exports.
1. Collect data
To get started, select the destination for your data in the form below and click Proceed. You’ll be offered to create a Coupler.io account for free without any payment information required.
Note: In addition to raw data, you can export specific QuickBooks reports by selecting the source labeled QuickBooks Reports instead of just QuickBooks.
Then, connect your QuickBooks account and specify what data you’d like to export: Account, Invoice, Payment, and many more.
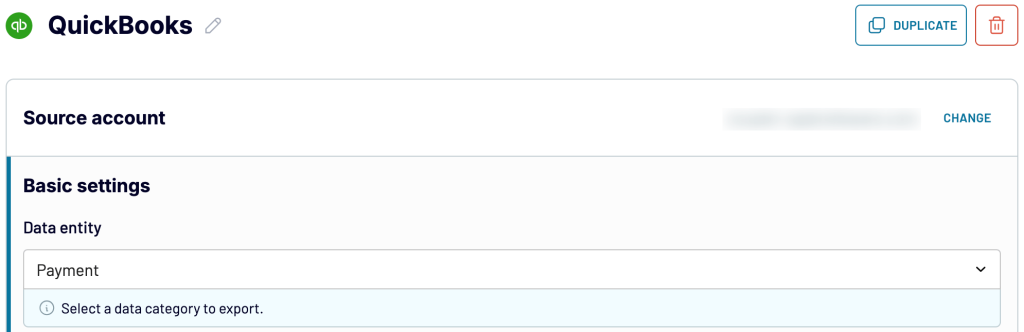
Move forward, and if you need to fetch more than one data entity, simply add QuickBooks as an extra source and follow the same steps. Once you’re done with your source settings, proceed to the next step.
2. Organize data
At the next step, you can organize and adjust the data to make it analysis-ready:
- Rename, rearrange, or hide columns.
- Sort data in ascending or descending order.
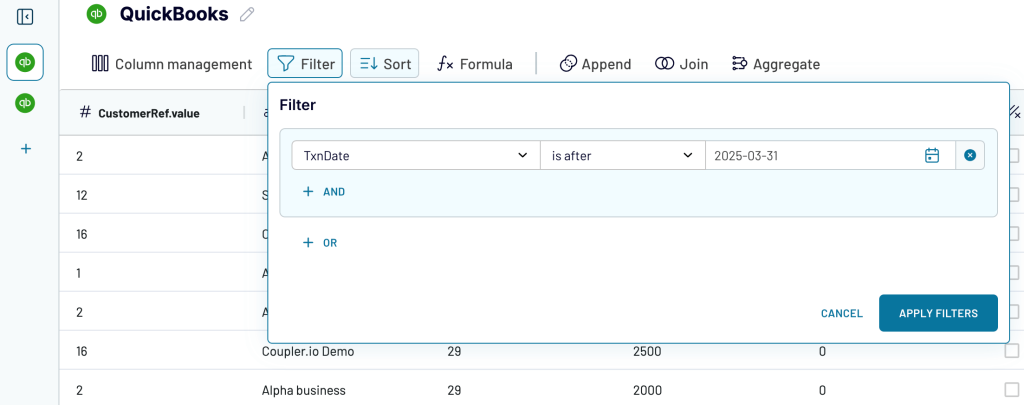
- Filter data to extract it based on required criteria. For instance, you can narrow it down by date, as shown in the example below.
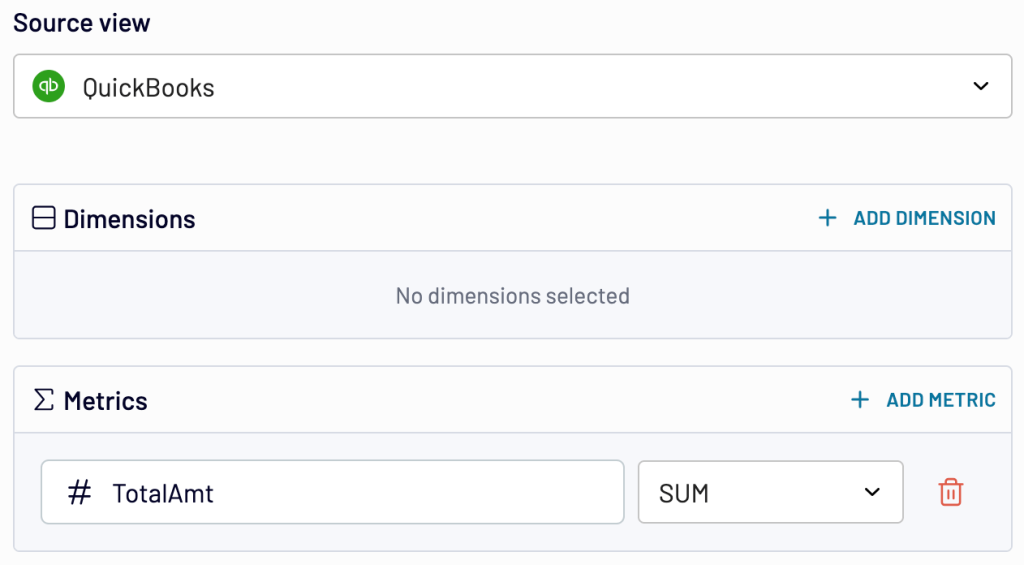
- Aggregate data using operations like sum, avg., count, min., or max. For example, you can sum up the payment amounts:
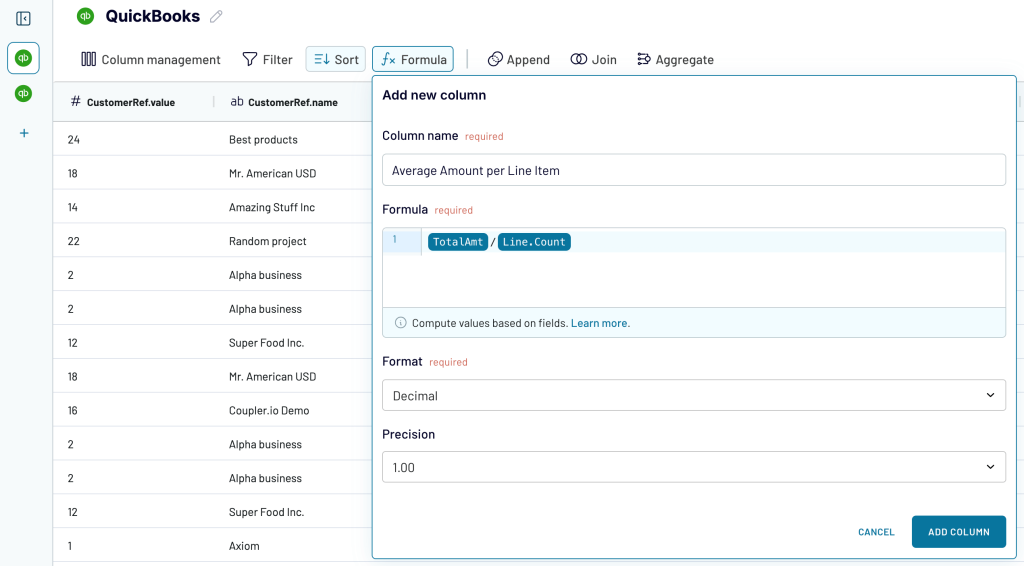
- Create customizable columns with formulas. To give you an idea, the picture below illustrates the calculation of the average amount per line item based on the total amount and line count metrics available in your report:
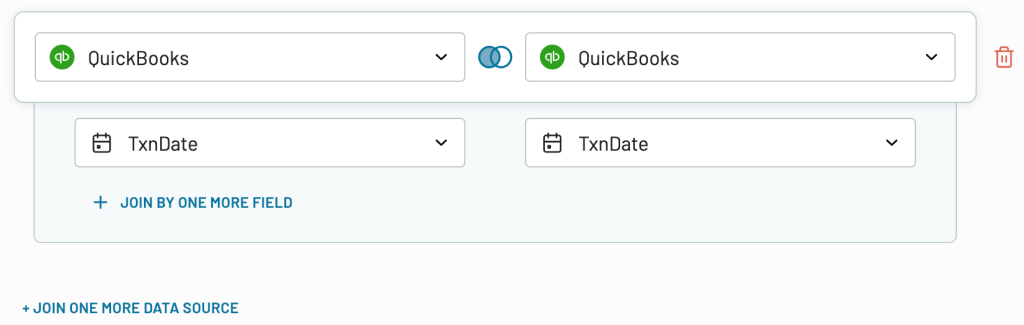
- If you’ve previously connected several sources, blend data in the chosen manner:
- Append – merge datasets with similar structures and columns matched by name.
- Join – combine datasets with different structures and at least one matching column.
Once the data is ready, go ahead to send it to the destination.
3. Load data and schedule refresh
Connect your destination app account and follow Coupler.io’s instructions to load the data into spreadsheets, a BI tool, a database, etc.
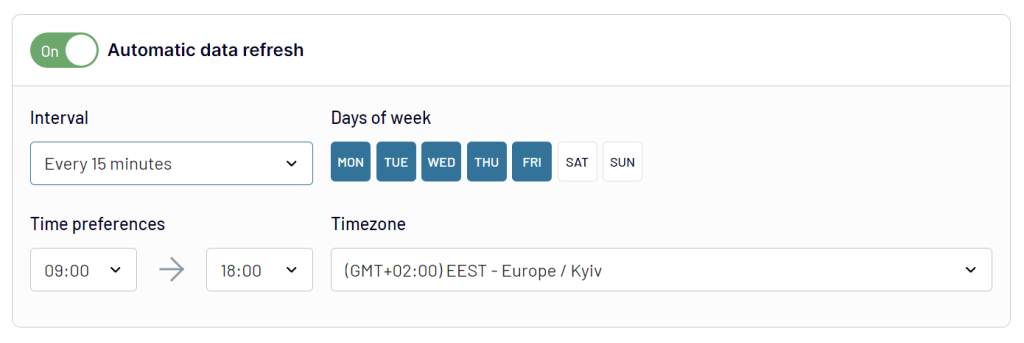
Next, turn on automatic data refresh. Specify the preferred interval, days of the week, hours, and time zone. By default, your report will be updated daily. So, if you need this done more frequently, choose from hourly to every 15 minutes, making it near real-time.
Finally, run the data export and have your QuickBooks records delivered to your destination on schedule with Coupler.io.
Where you can export data from QuickBooks
Coupler.io lets you pull your data from QuickBooks to several destination categories, depending on your needs, including:
- Spreadsheets (Google Sheets and Excel) – to make quick calculations, perform lightweight analysis, and handle small-scale data tasks. It is ideal for simple reports and high-level financial snapshots.
- BI tools (Looker Studio, Power BI, Tableau, and Qlik) – to transform larger, more advanced datasets into detailed, actionable insights by visualizing them through dynamic, interactive dashboards.
- Databases (BigQuery, Redshift, and PostgreSQL) – to store all QuickBooks records in a centralized location, reduce data silos, as well as access complex queries and deeper financial analytics.
Use white-label report templates for QuickBooks Online
Coupler.io is a solution to turn raw data into meaningful reports. Therefore, it provides ready-to-use report templates for specific data sources designed in spreadsheets and BI tools. These templates allow you to kick off reporting without any hassle. You only need to connect your QuickBooks Online account, and the report will be automatically populated with your data. Here are the report templates available for QuickBooks.
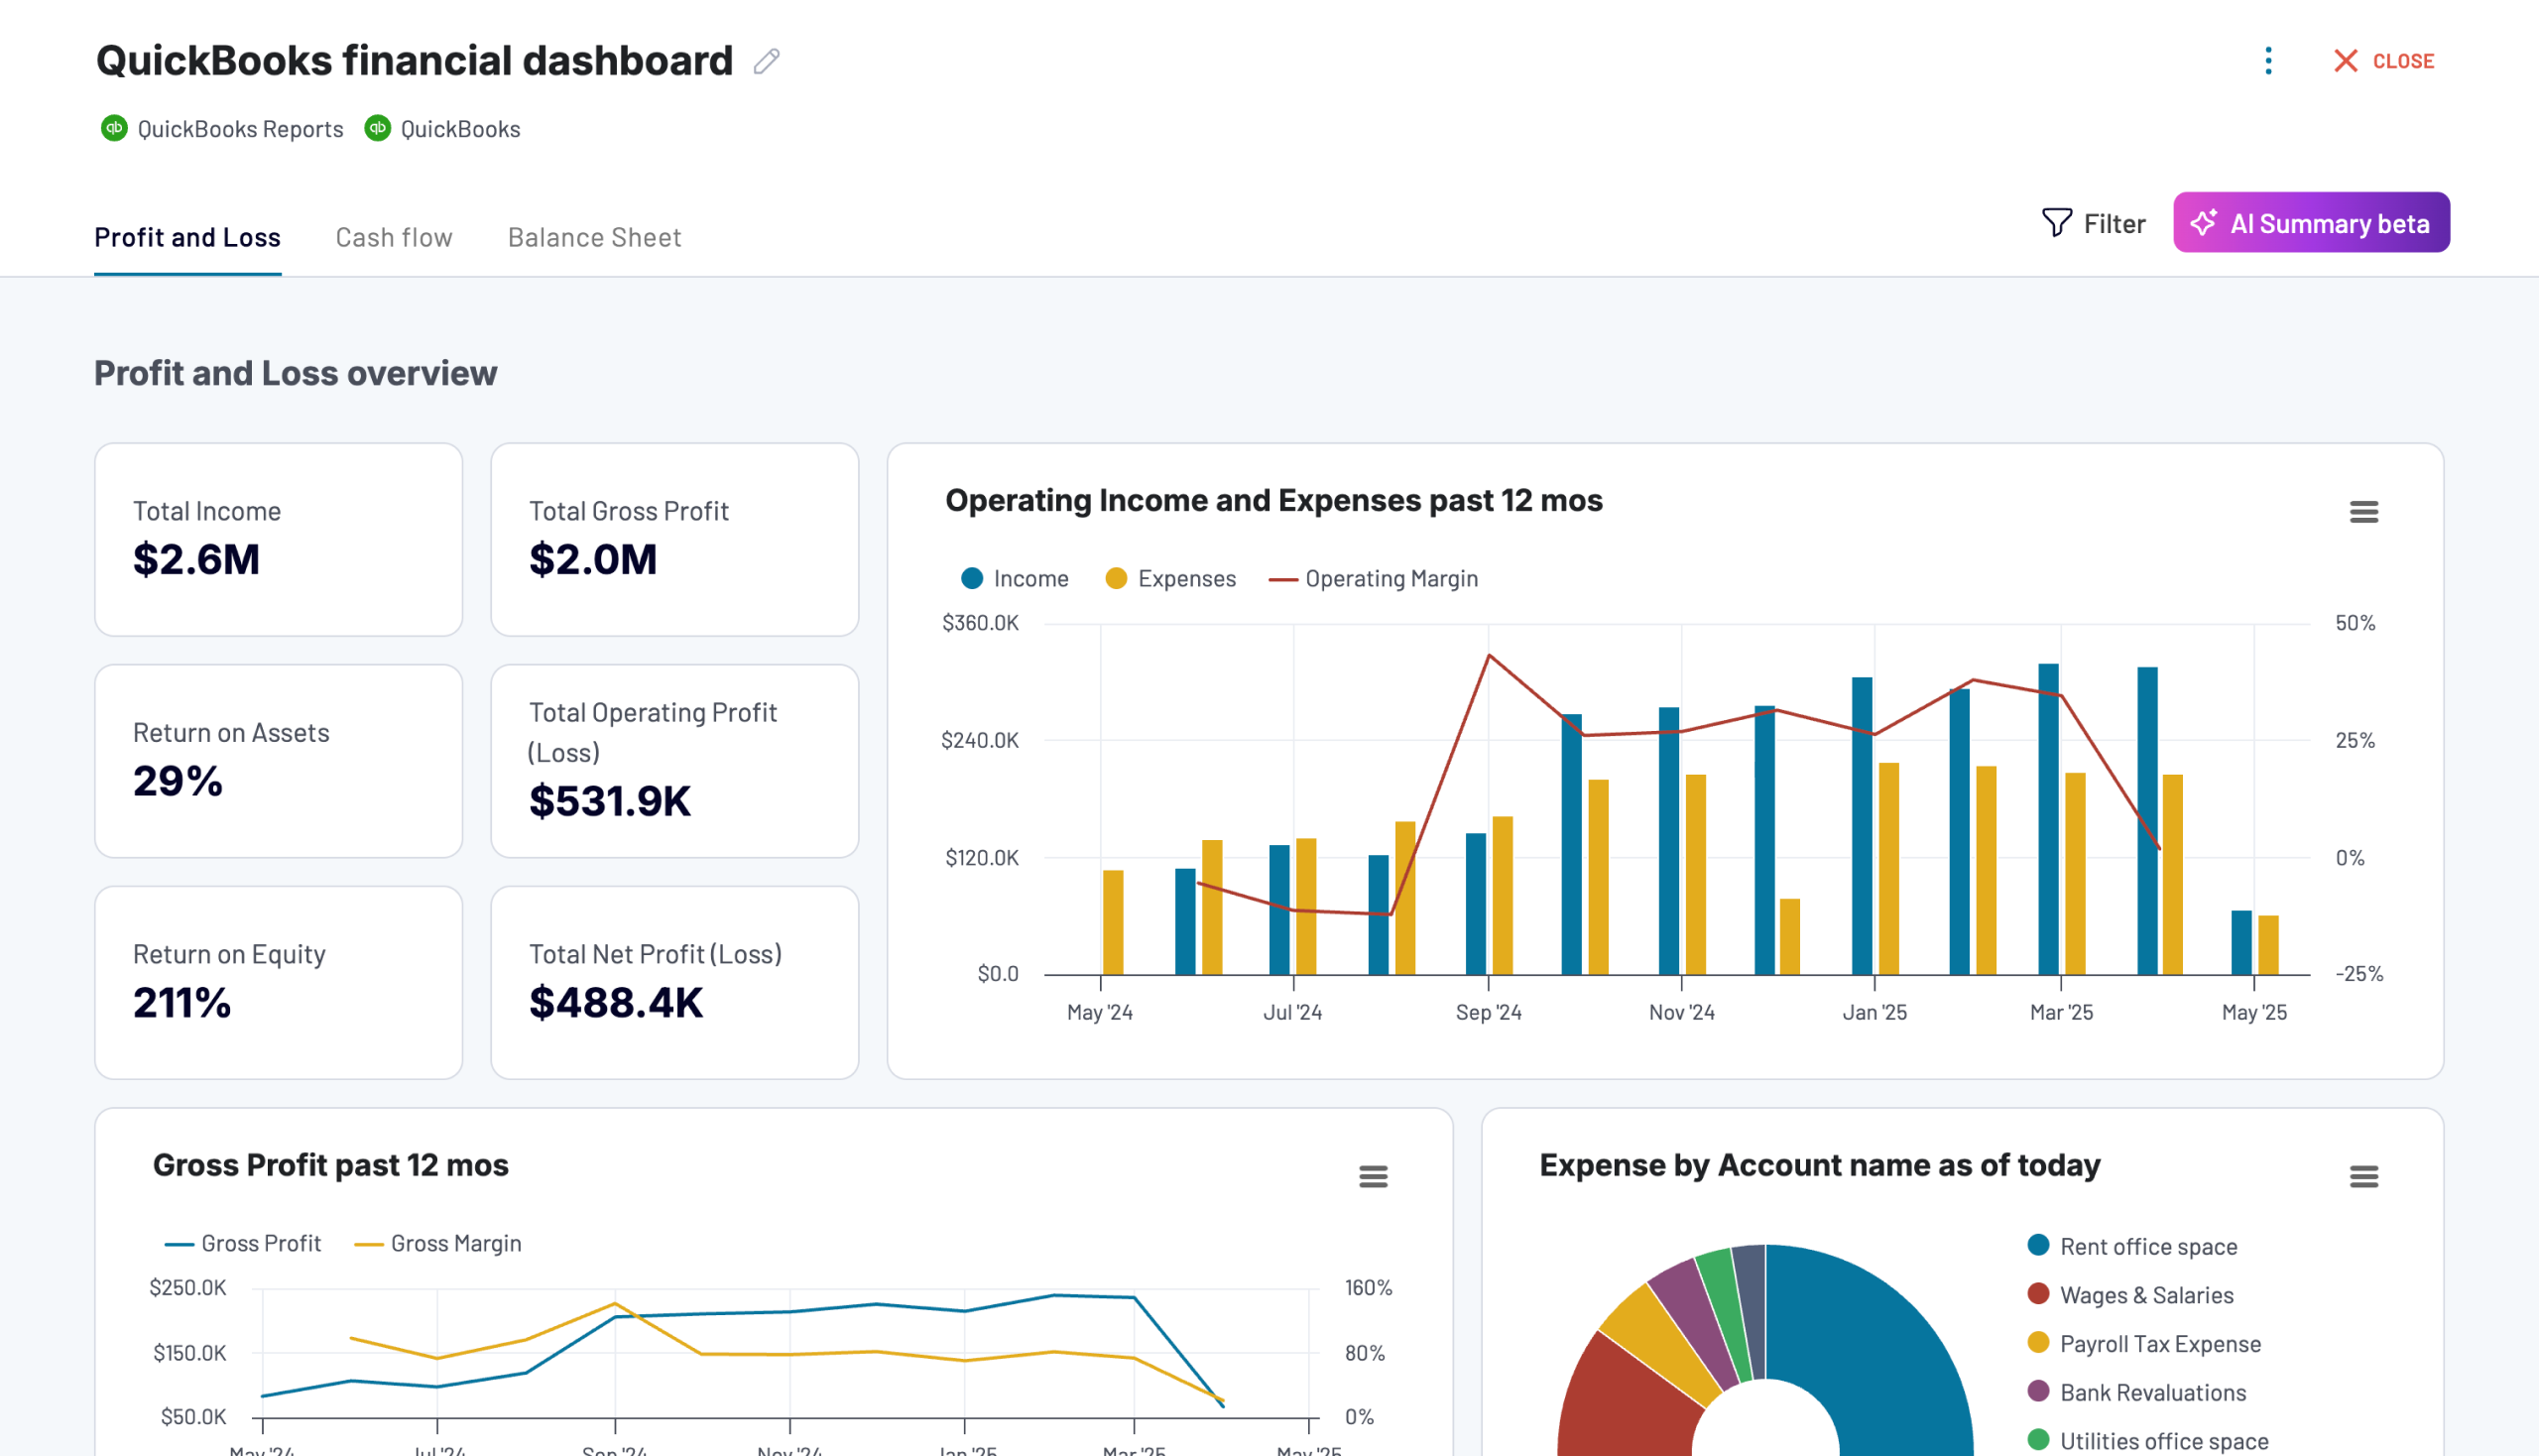
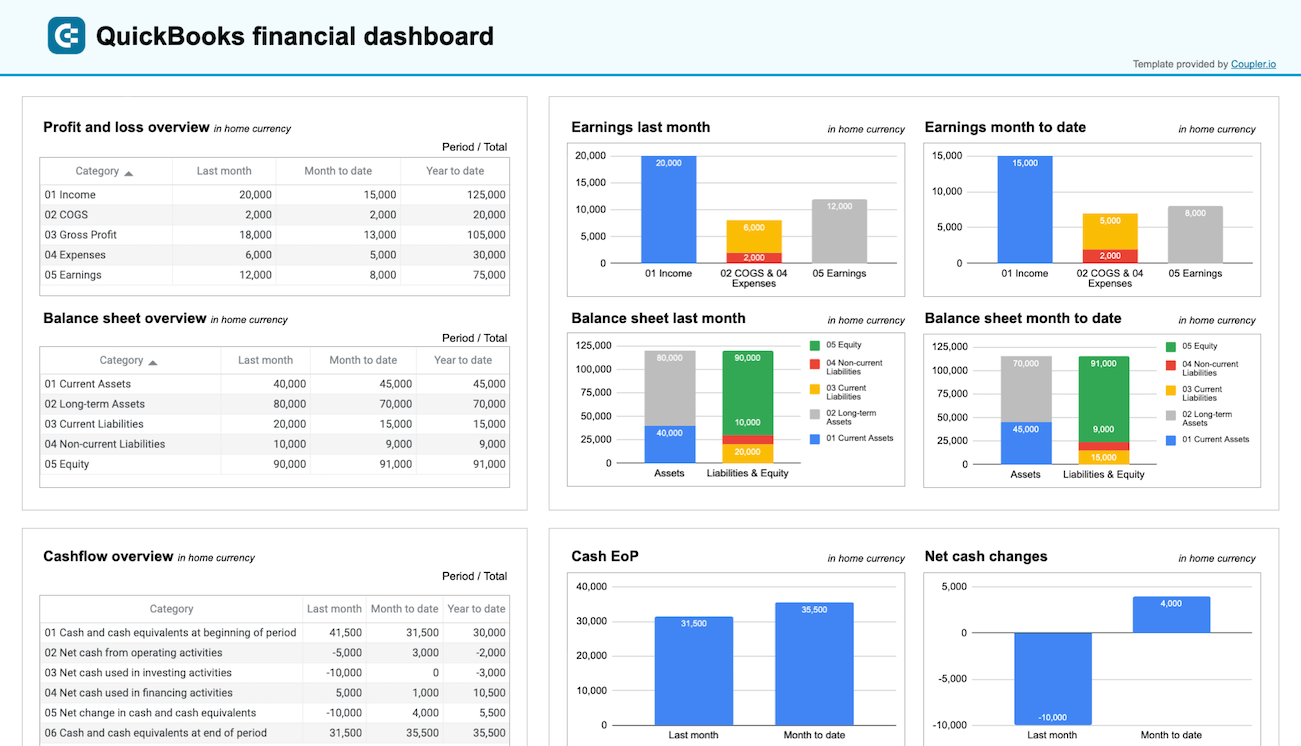
QuickBooks financial dashboard
The QuickBooks financial dashboard provides a real-time view of key financial reports – profit and loss, balance sheet, cash flow, and bank & cash accounts.
Use this dashboard to gain the following insights:
- Profit and loss overview: Get a summary of your revenue, expenses, and net income for the last month, month to date, and year to date to monitor profitability and control your costs. Compare your earning trends to spot growth patterns or areas needing improvement.
- Balance sheet overview: Take a snapshot of your assets, liabilities, and equity to understand your financial position, liquidity, and business health. Place your balance sheet assets alongside liabilities and equity for the last and current month.
- Cash flow overview: Look at net cash changes over the reporting period to see how your position evolves and ensure effective liquidity management. Explore the cash position at the end of the period and net changes to check your financial stability.
- Bank and cash accounts overview: Go over your available funds and list balances for all linked bank and cash accounts to help you verify all are reconciled. If you’re handling multi-currency transactions, view balances by currency to simplify the tracking and monitoring of foreign accounts.
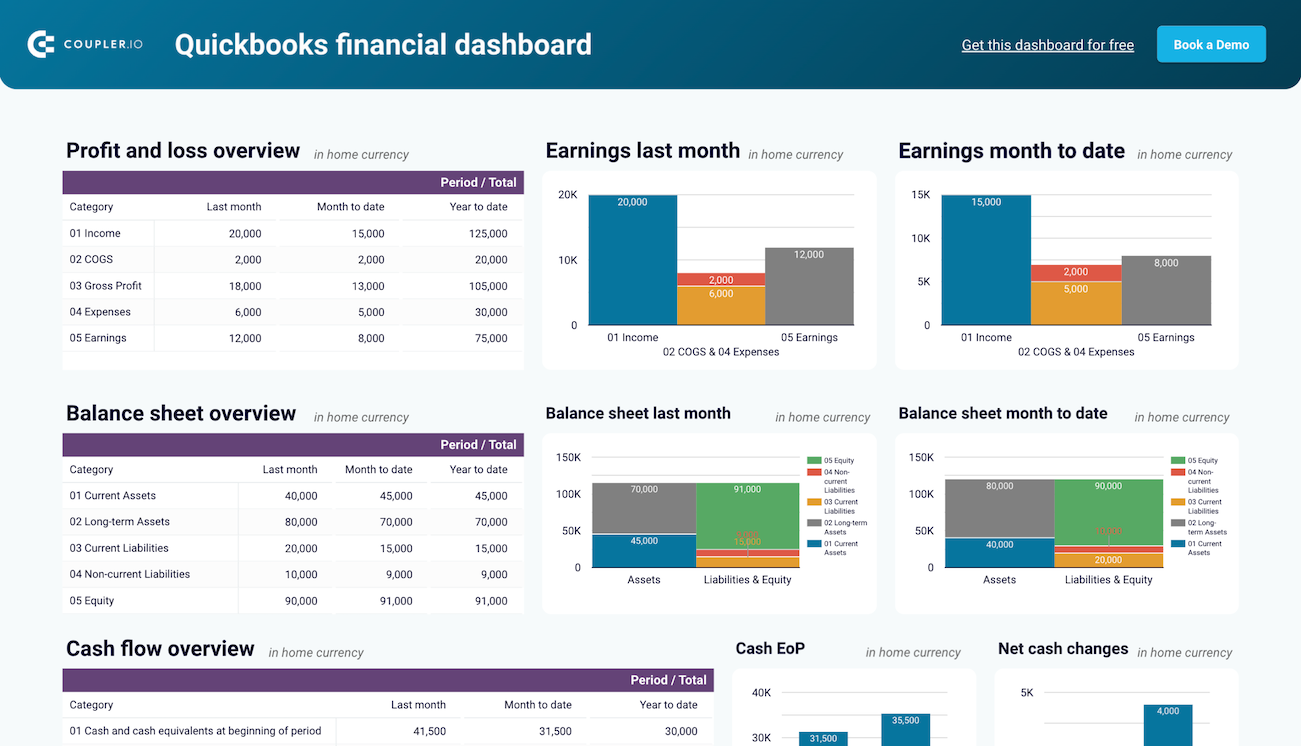
This dashboard is designed in Coupler.io with AI insights available. Also, you can use it as a Looker Studio and Google Sheets template. Set it up with your own data by following the step-by-step guide in the Readme tab.
QuickBooks financial dashboard
Tracks earnings, monitor cash flow, and analyze balance sheet changes with a dedicated dashboard that provides a clear picture of your business finances.


QuickBooks financial dashboard in Looker Studio
Monitor and analyze your business’s financial health with real-time insights into profit and loss, balance sheet, cash flow, and bank & cash accounts.

QuickBooks financial dashboard in Google Sheets
Get a clear snapshot of your business finances, including cash flow, P&L, balance sheets, and bank accounts, powered by data from QuickBooks Online.

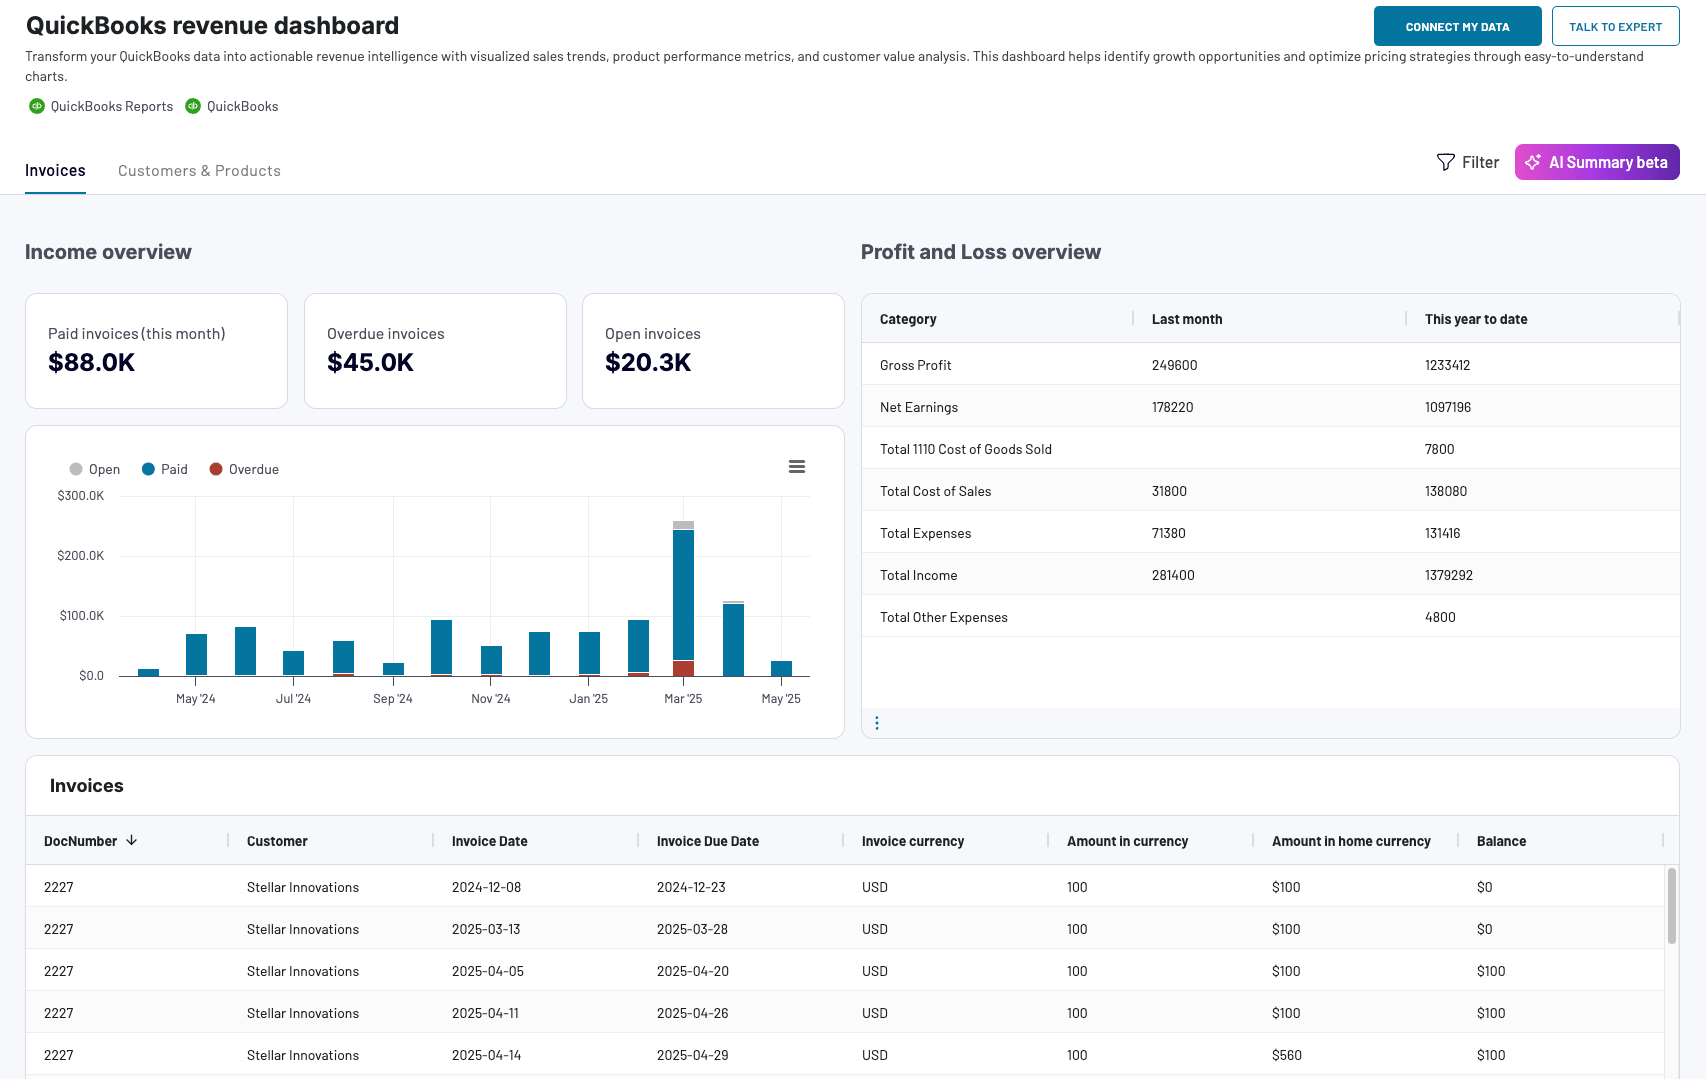
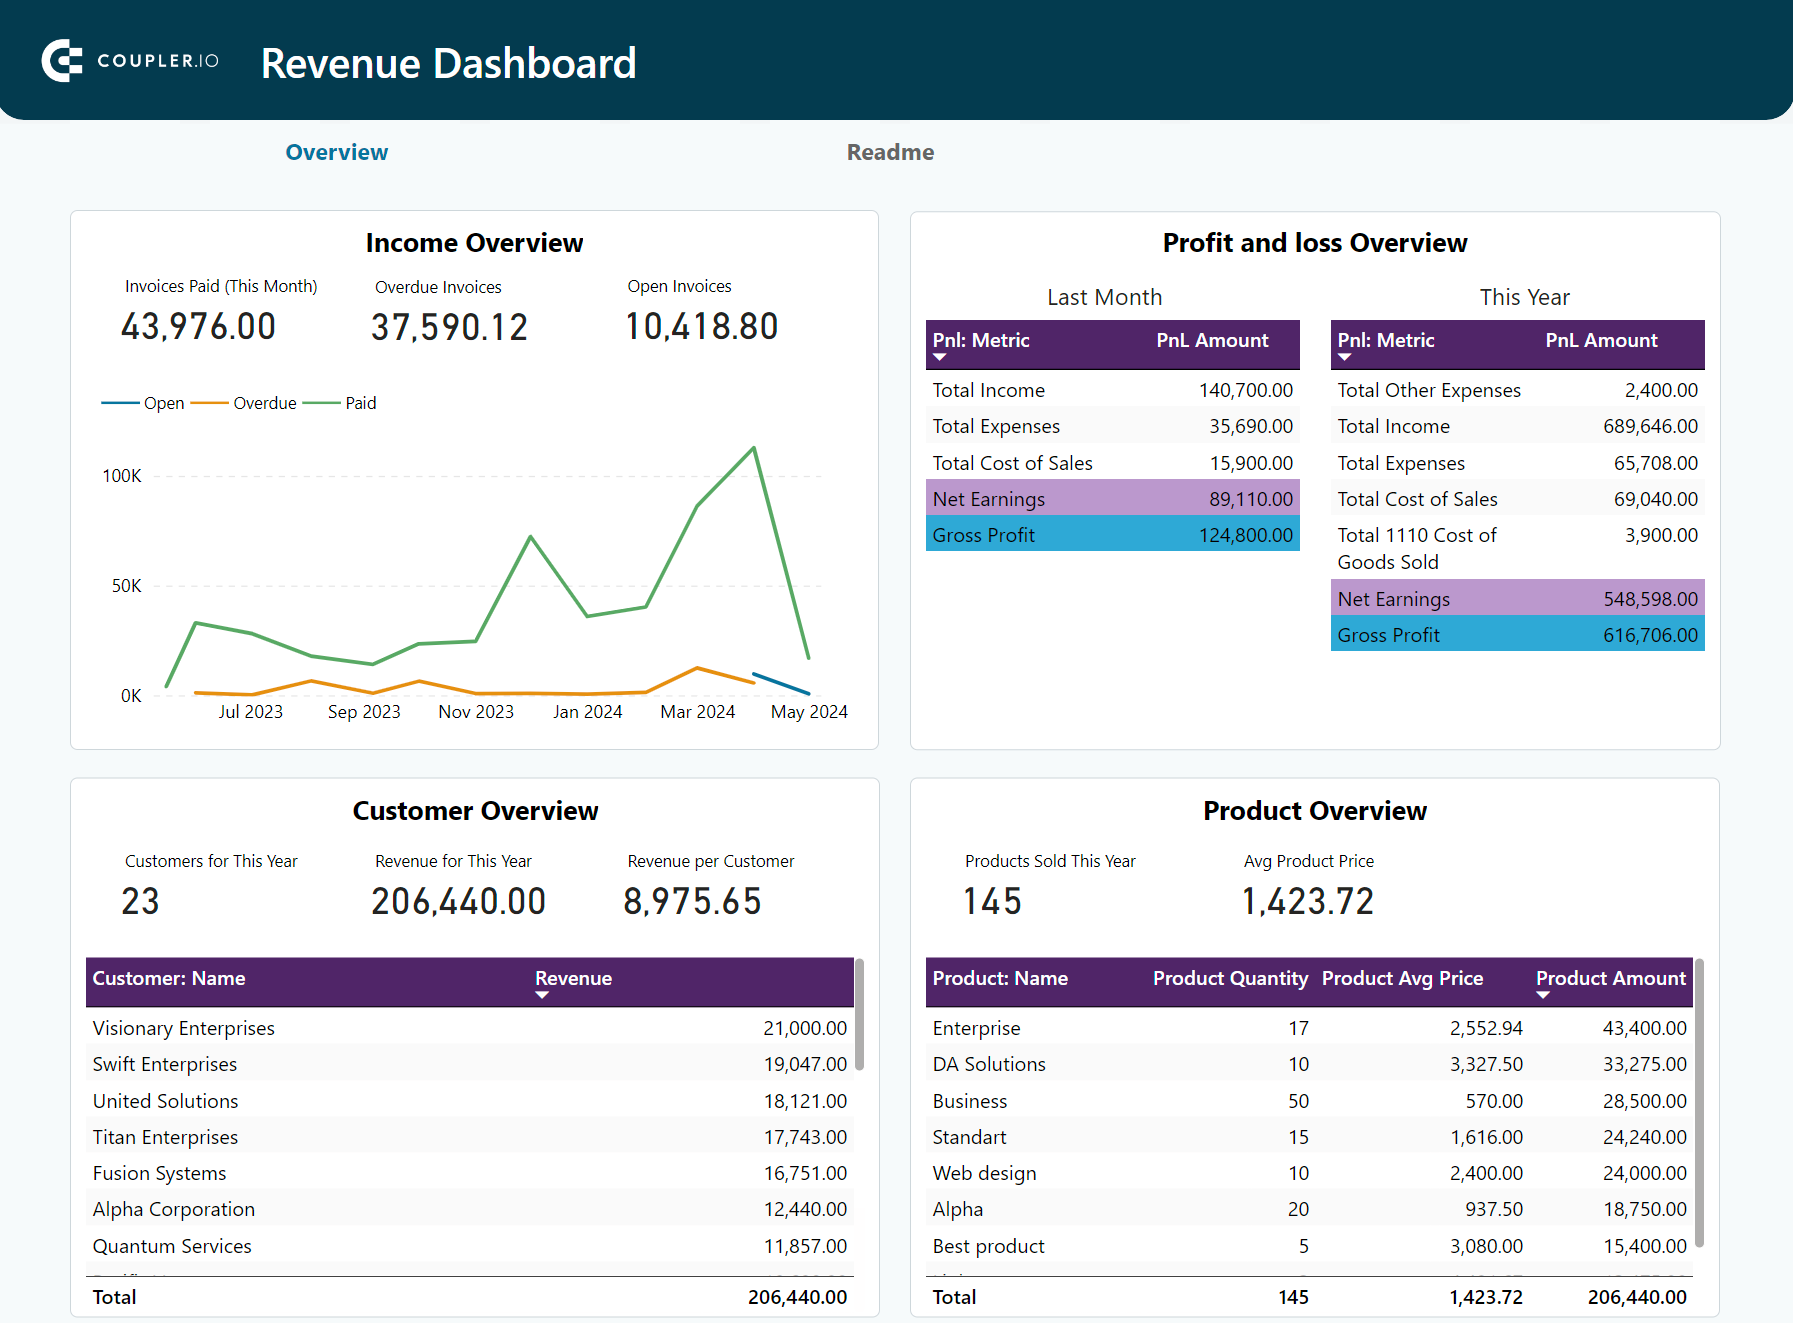
QuickBooks revenue dashboard
The revenue dashboard helps you monitor your income and expenses. It shows the revenue distribution by the customer, aggregates key metrics and displays your business’s top customers.
QuickBooks revenue dashboard + AI insights
 Preview dashboard
QuickBooks revenue dashboard + AI insights
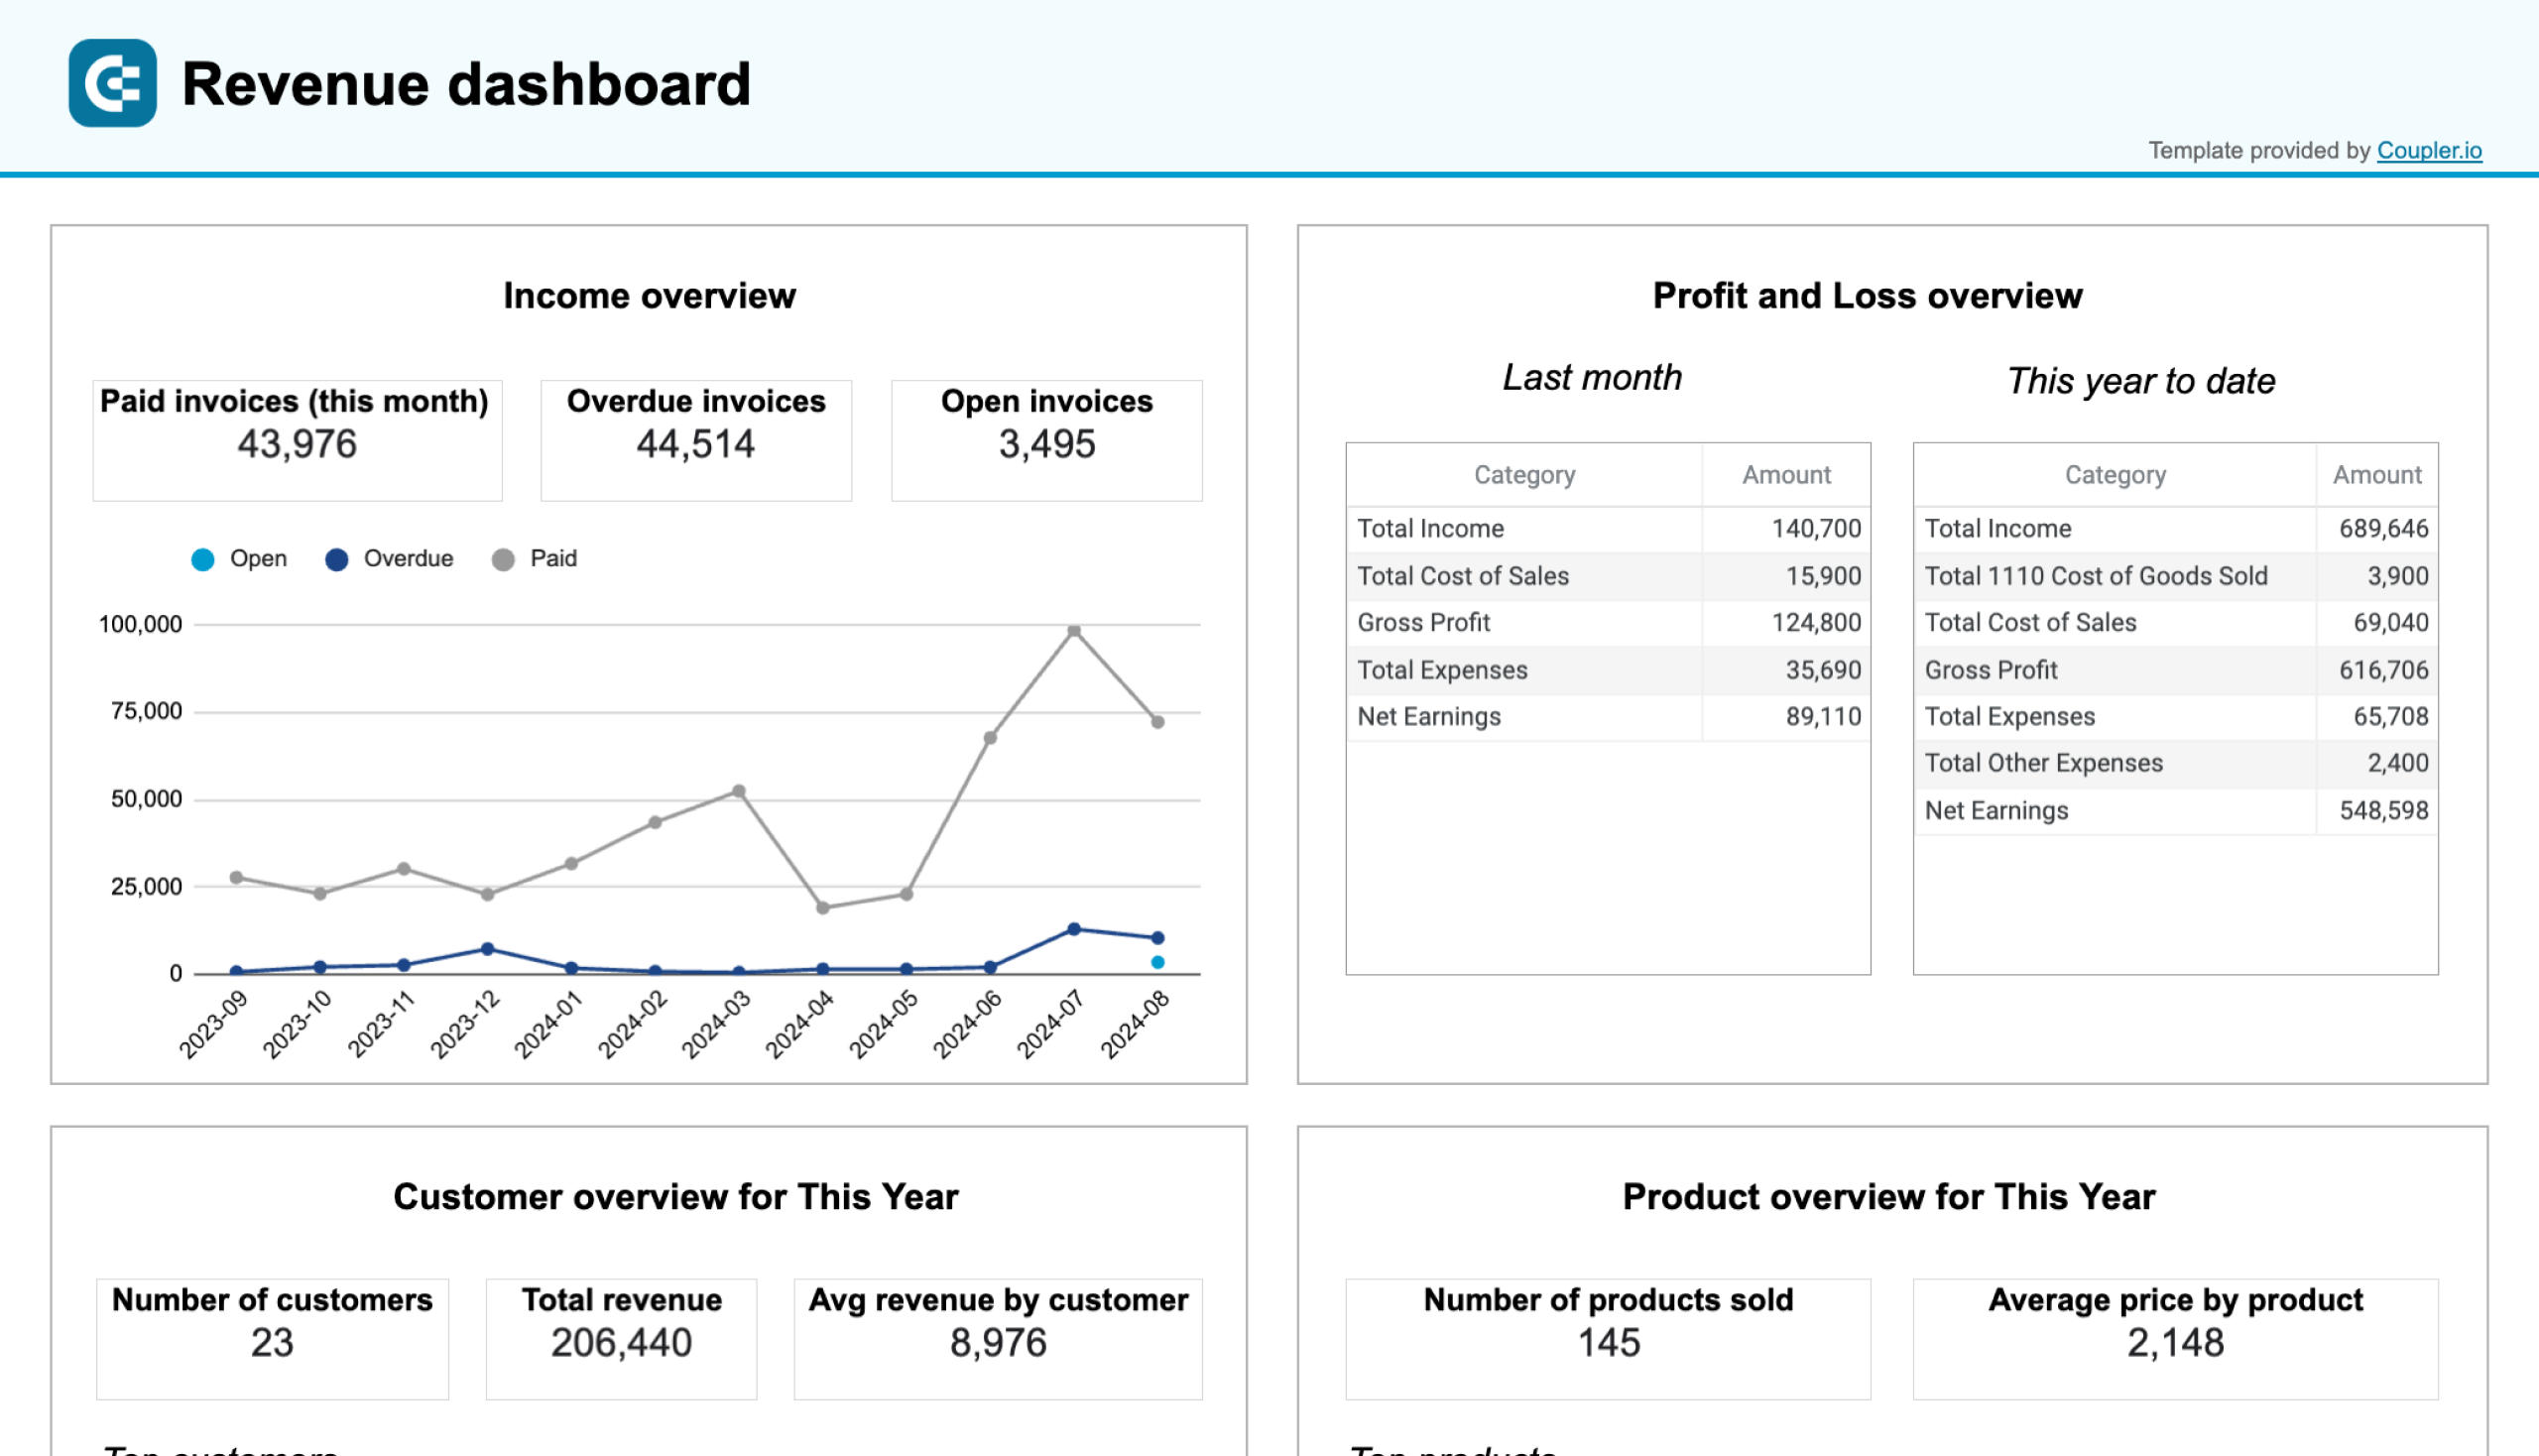
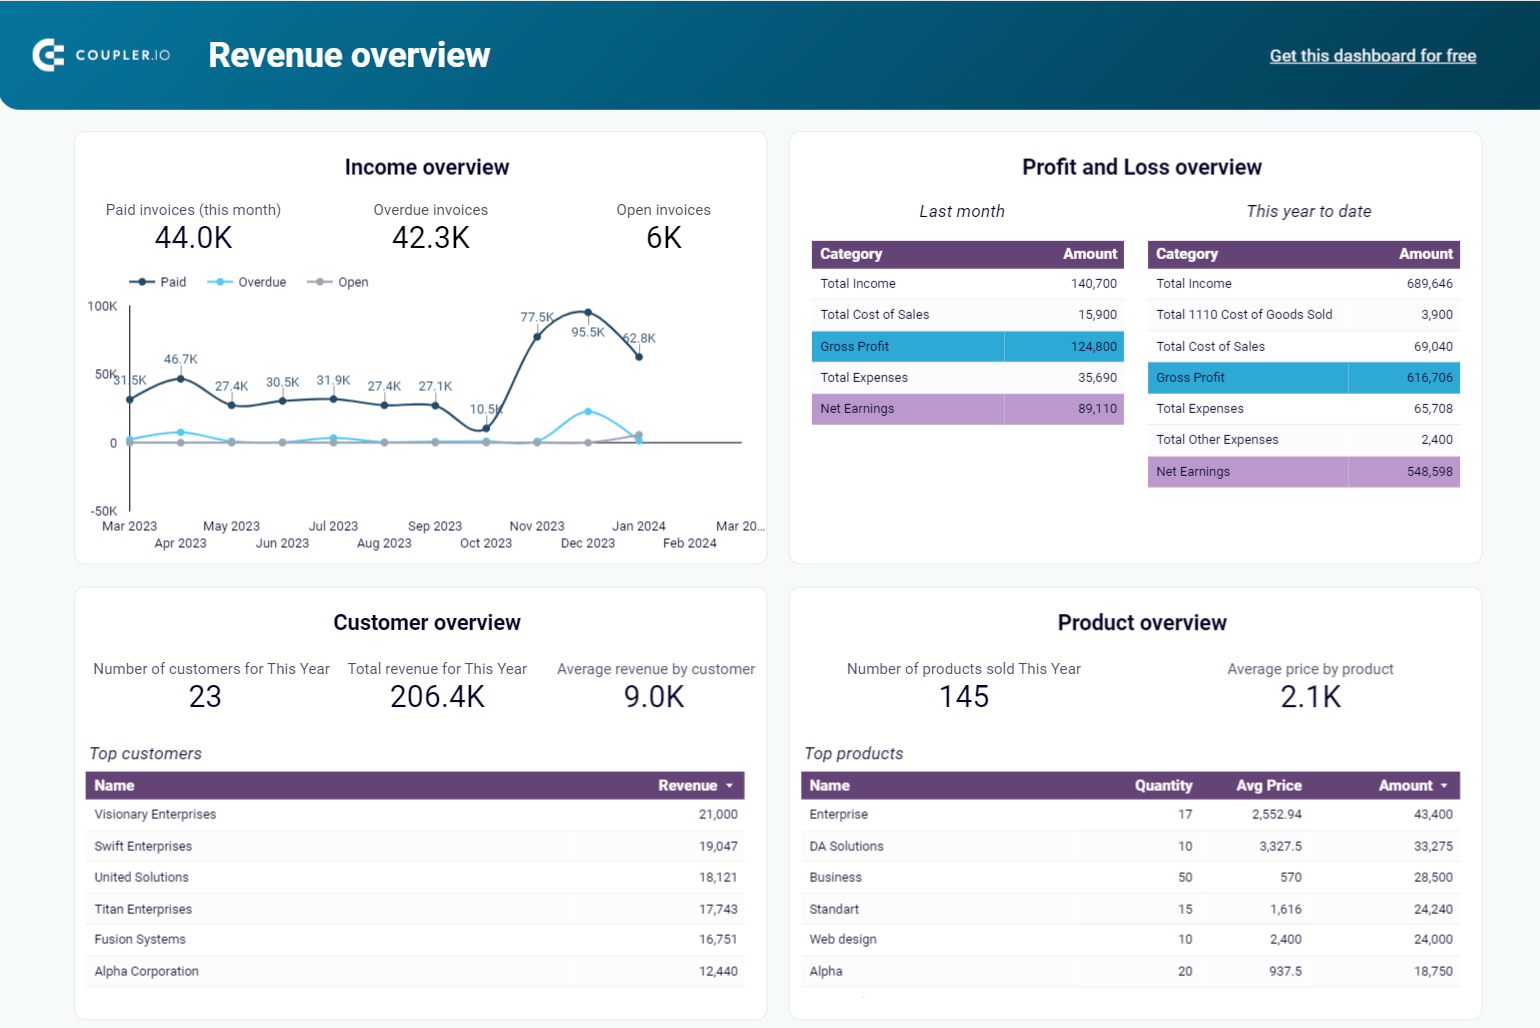
Preview dashboardWhat reports the dashboard provides:
- Income overview: Track overall revenue trends for the last 12 months. Identify seasonal fluctuations, peak revenue periods, and any unexpected dips.
- Profit and loss overview: Compare revenue and expenses to gain insights into net income. Assess how well your business manages costs relative to income to support your budgeting and financial planning.
- Customer overview: See your most valuable customers by their revenue contribution for targeted marketing efforts and retention strategies. For example, you can offer loyalty incentives to high-value customers.
- Product overview: Figure out which products generate the most revenue. Using this information, you can adjust your sales strategies based on the results of high- or low-performing products.
The dashboard is available in Coupler.io with the built-in AI insights feature. At the same time, you can also use it as a template in Google Sheets, Looker Studio, and Power BI. Navigate to the Readme tab inside the chosen template to set up the dashboard according to the instructions provided.
QuickBooks revenue dashboard
Transform your QuickBooks data into actionable revenue intelligence with visualized sales trends, product performance metrics, and customer value analysis. This dashboard helps identify growth opportunities and optimize pricing strategies through easy-to-understand charts.
QuickBooks revenue dashboard in Google Sheets
Analyze your revenue through a set of reports collected from QuickBooks Online on a single dashboard.
QuickBooks revenue dashboard in Looker Studio
Get an overview of your revenue based on the data from QuickBooks and unlock in-depth insights to drive informed business decisions.
QuickBooks revenue dashboard in Power BI
Monitor your income and expenses on an all-in-one revenue dashboard connected to your QuickBooks Online account.

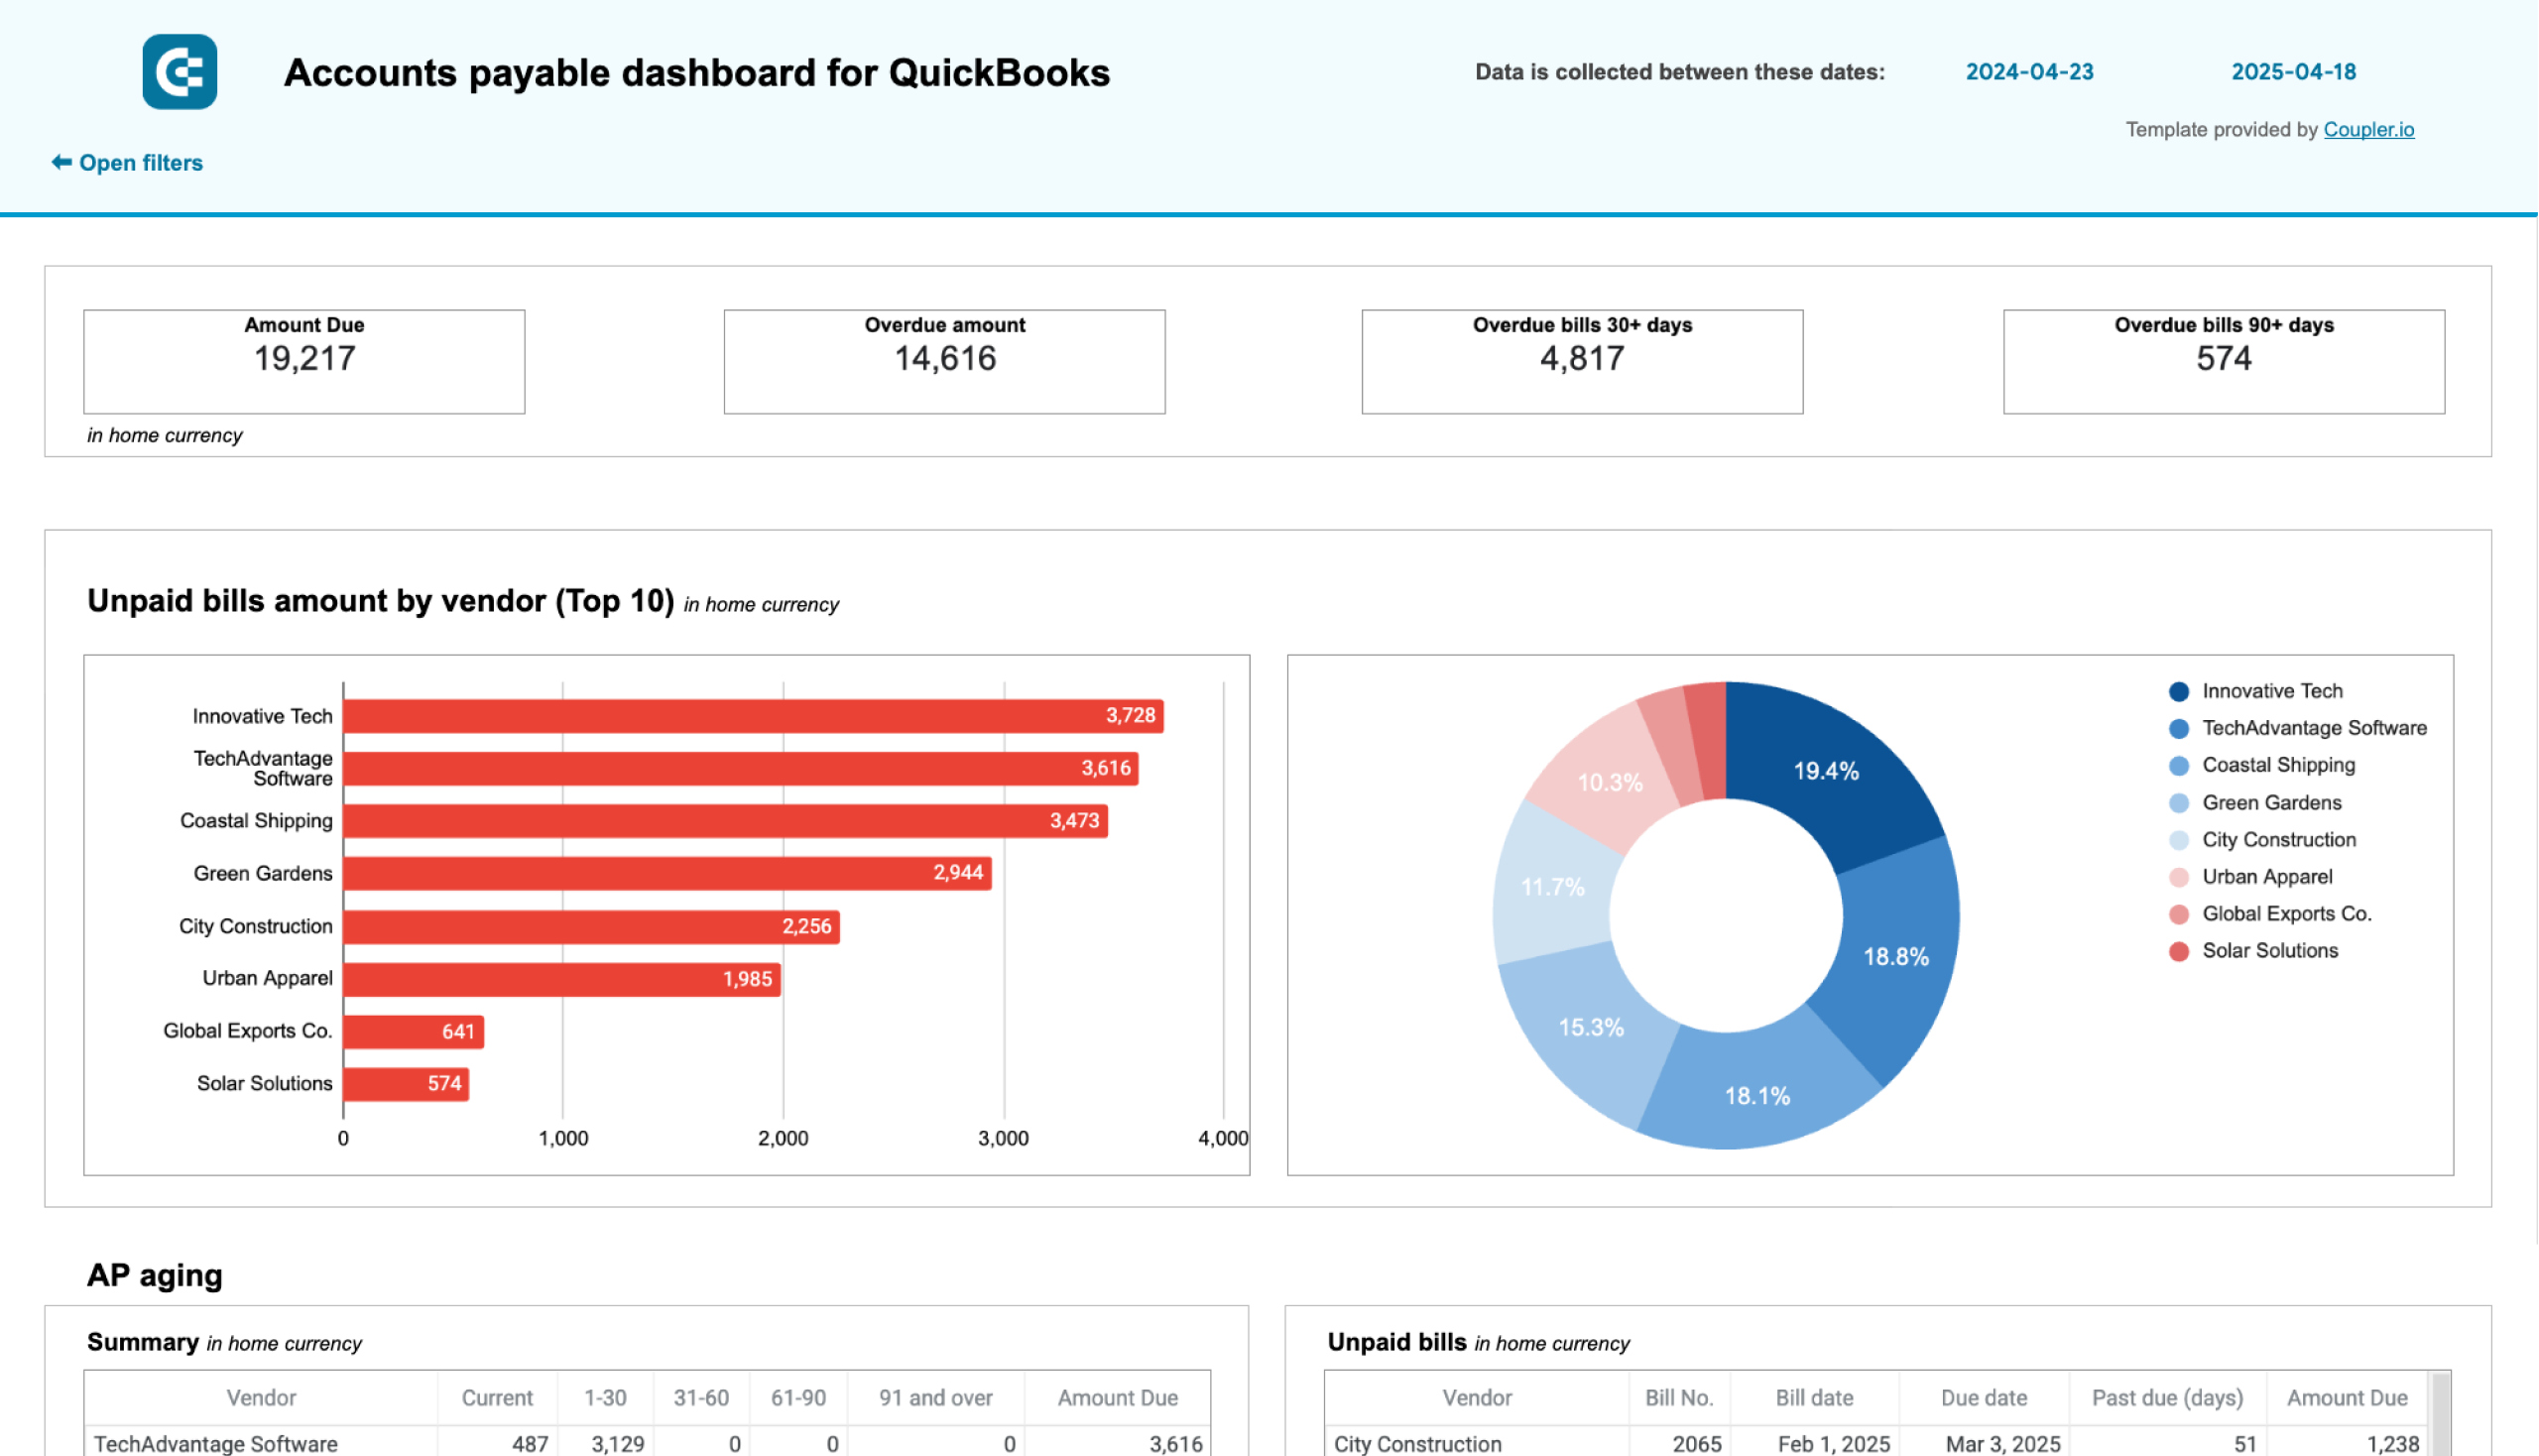
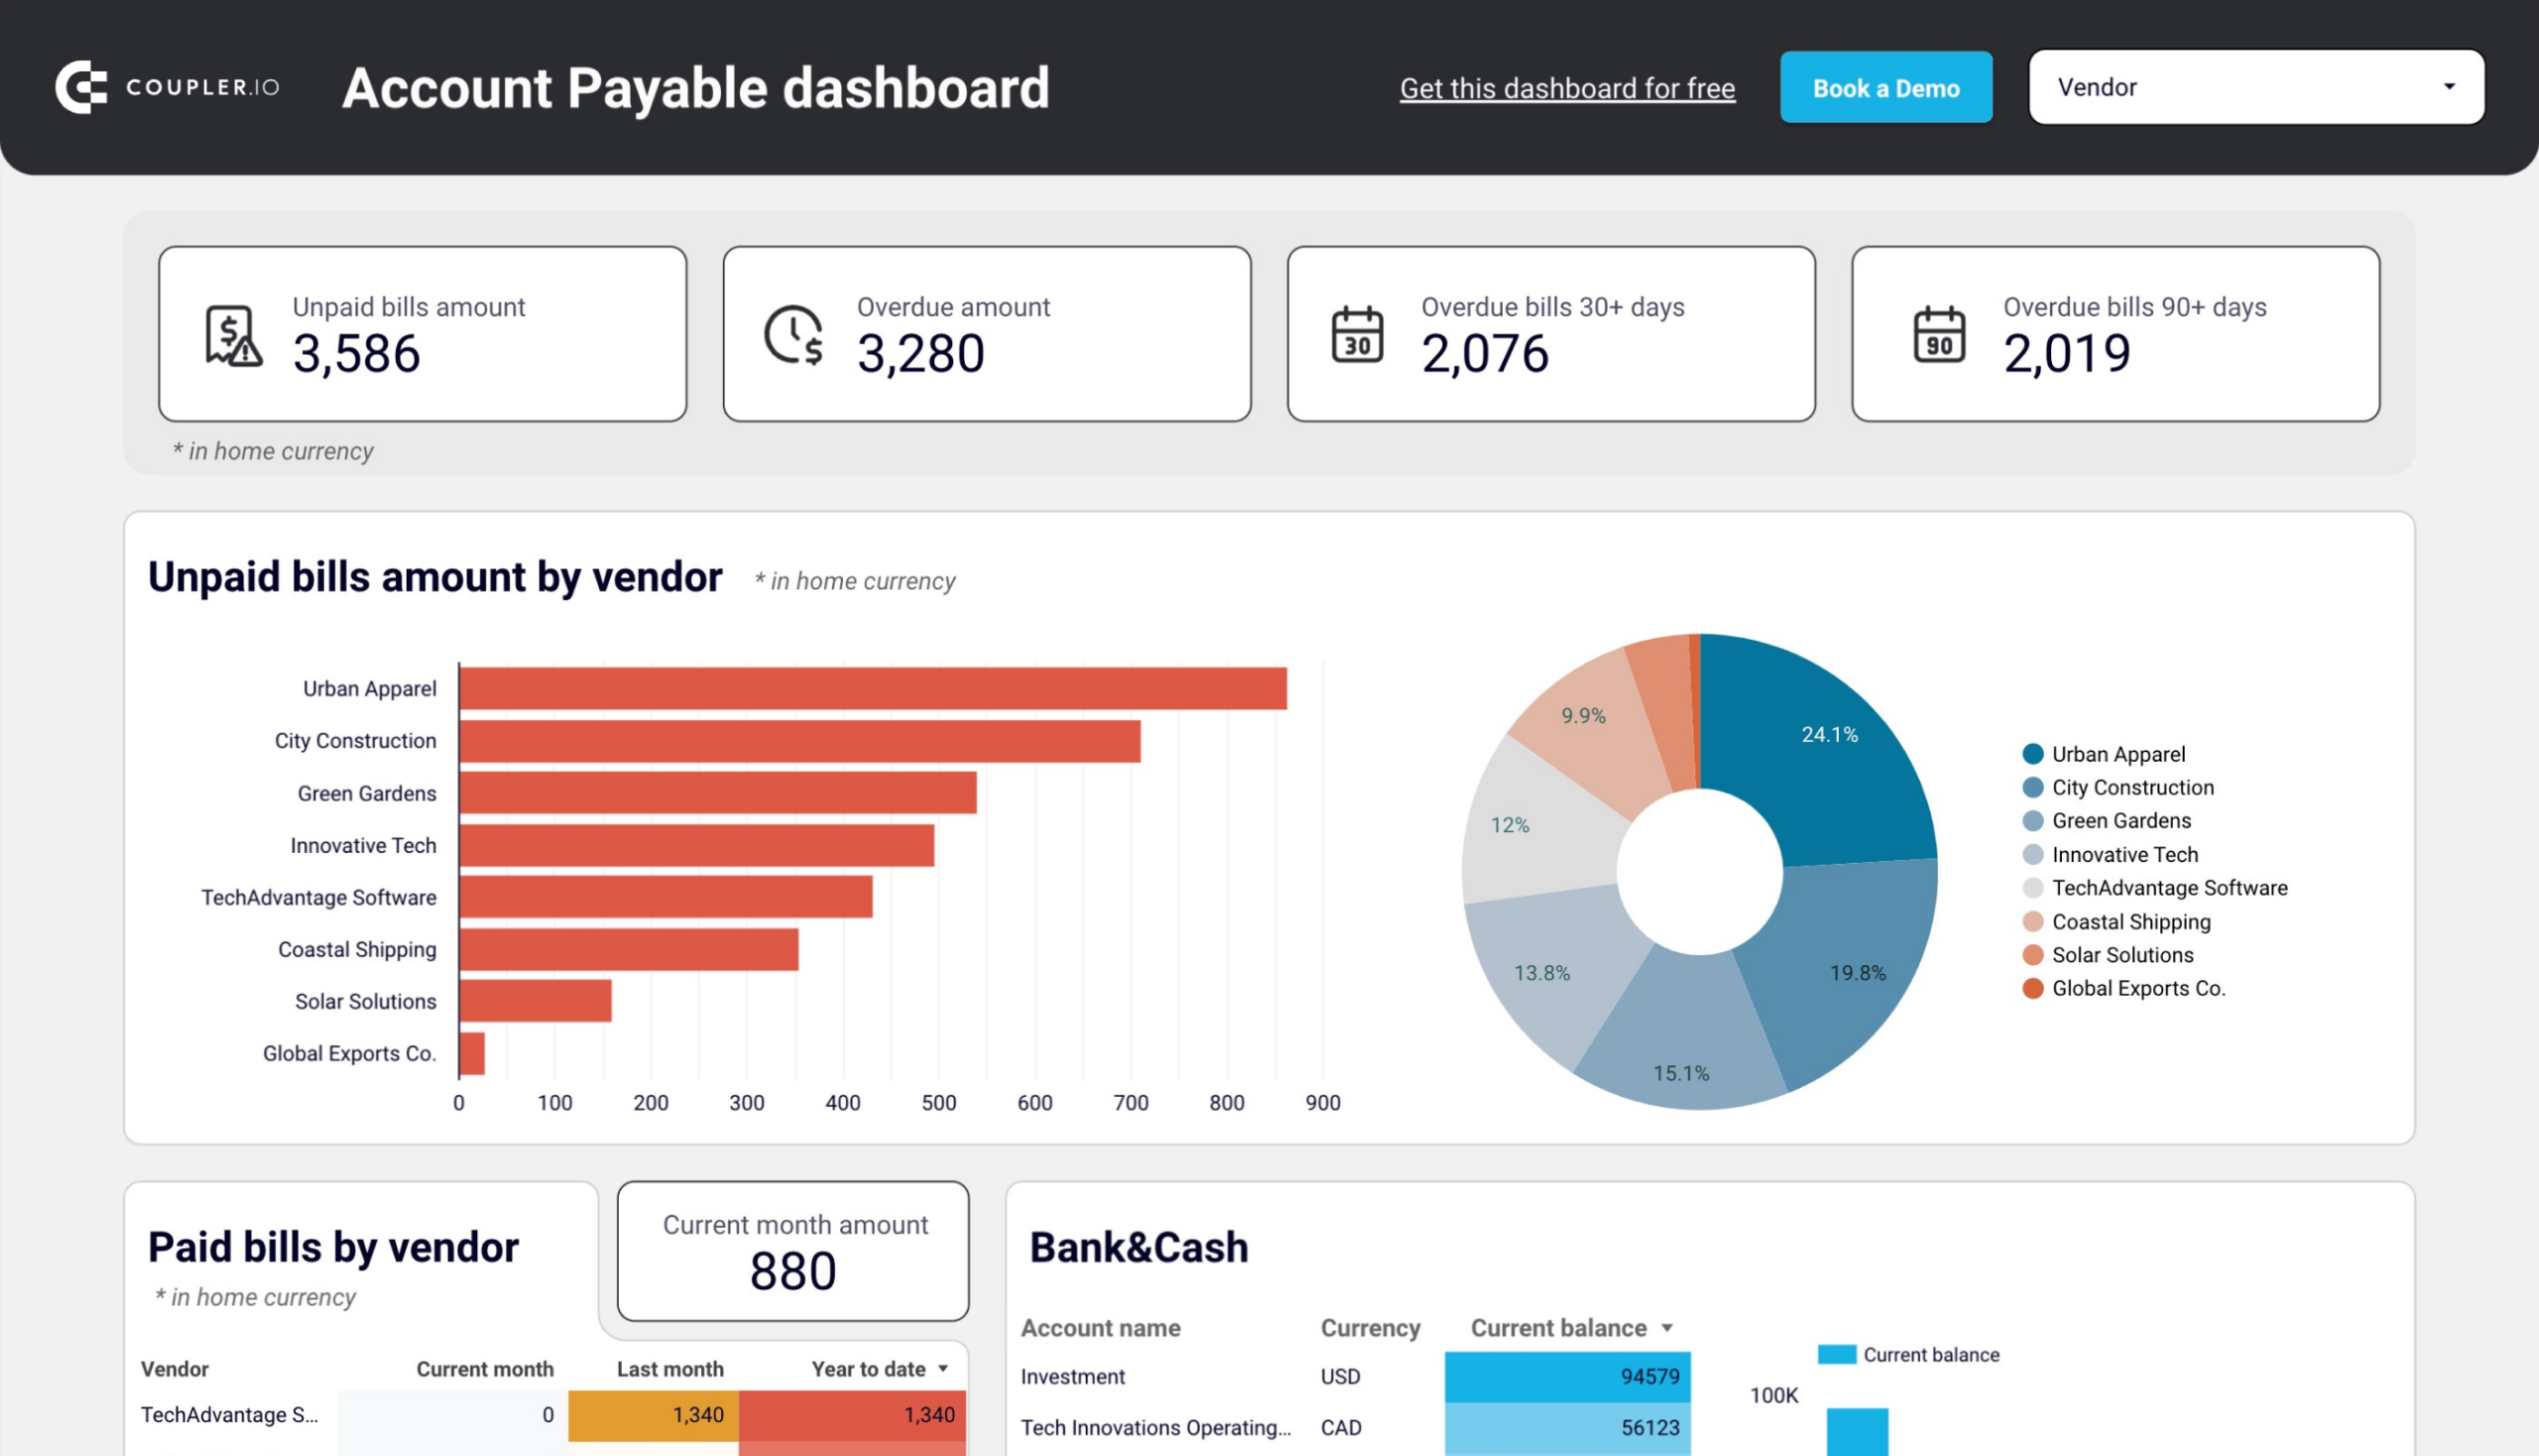
Accounts payable dashboard for QuickBooks
With this accounts payable dashboard, you can monitor your outgoing payments and manage your bills effectively. As a result, it lets you understand your payment obligations to avoid late fees.
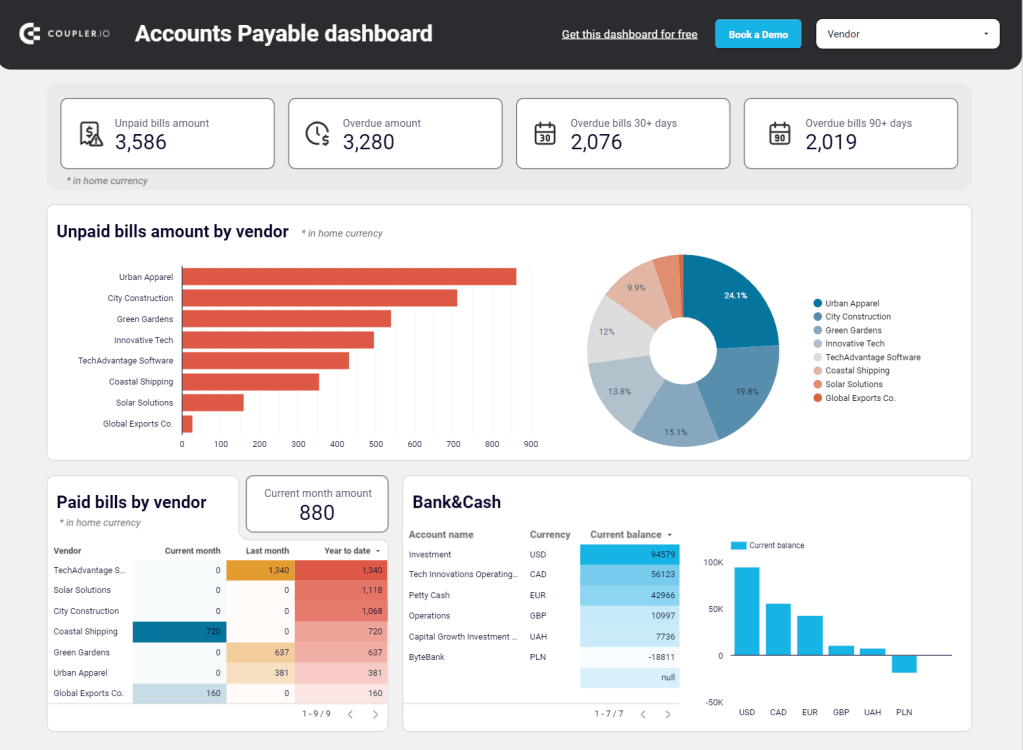
The QuickBooks dashboard reveals the following:
- Unpaid bills overview + filter by creditors: Check the amount of unpaid and overdue bills, with values displayed in the home currency. For unpaid bills, look at the top 10 vendors by credit debt. Additionally, see all the vendors and their share in your accounts payable, identify your major creditors, and prioritize payments to your vendors.
- Paid bills by vendor: Get a summary of bills from your vendors that were previously paid. Based on this data, evaluate your vendors by the size of the amounts you have paid to them to decide on payment prioritization for specific creditors.
- Bank and cash: Easily track your balance by accounts and currency to distribute your money correctly and prioritize payments.
- Aging of accounts payable: Explore the distribution of overdue amounts by vendor and period: current, up to 30 days, 30 to 60 days, 60 to 90 days, and 90+ days. Look at the vendors’ overdue bills that constitute your accounts payable.
- Vendor bills: View the details of all vendor bills, paid and unpaid, for the last 12 months in all currencies.
??The dashboard is available in Google Sheets and Looker Studio. To start using it, click the template’s Readme tab and follow the straightforward setup guide.
Accounts payable dashboard for QuickBooks in Google Sheets
Track outstanding vendor obligations, payment schedules, and expense patterns with data from QuickBooks. This dashboard helps you manage cash flow, identify payment priorities, and maintain healthy supplier relationships through visualized aging reports.
Accounts payable dashboard for QuickBooks in Looker Studio
Get an overview of unpaid, overdue, and paid bills grouped by vendor. The dashboard helps you prioritize payments and improve cash flow management.
Accounts receivable dashboard for QuickBooks
The accounts receivable dashboard enables you to track your incoming payments and ensure timely collections. This allows you to make decisions on communication with customers and activities to settle indebtedness and prevent a cash gap.
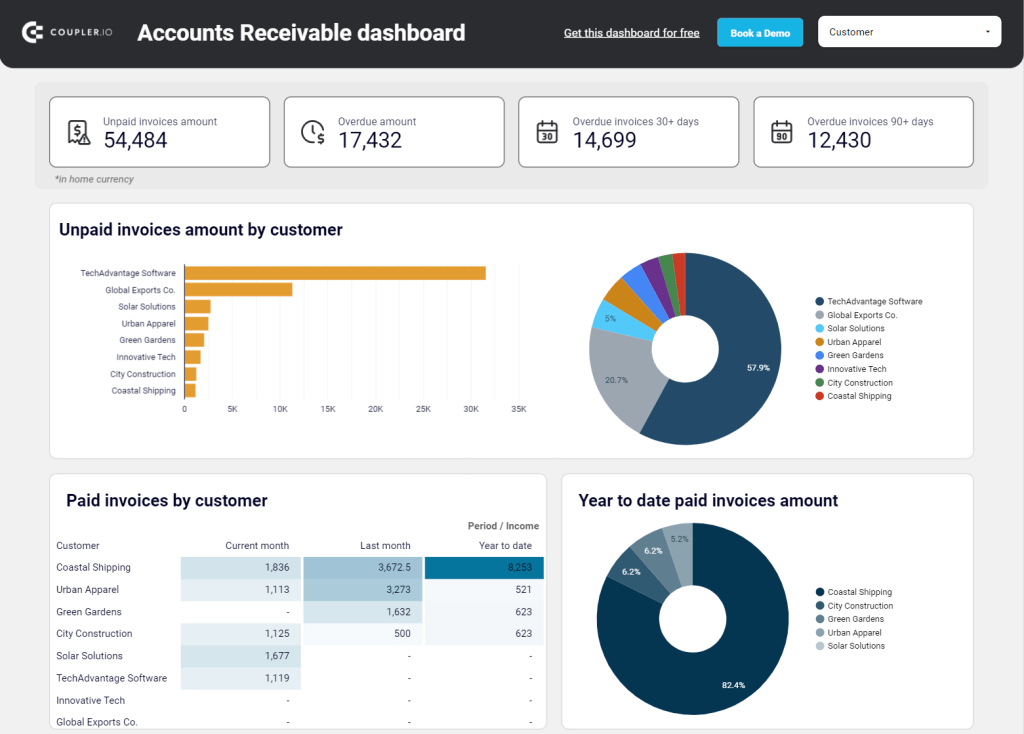
Here’s what you’ll learn using this dashboard:
- Unpaid invoices overview + filter by customers: Check the amount of unpaid and overdue invoices in the home currency. For unpaid invoices, see a selection of the top 10 customers by debit debt. Besides, view all the customers and their share of your accounts receivable. Based on this information, identify your major debtors and prioritize your activities to settle indebtedness.
- Paid invoices by customer + year-to-date amount: Gain insights into invoices previously paid by your customers. Evaluate your customers based on the amount of paid invoices and decide activities for debts to be paid off.
- Month-to-month invoice trends: Track the dynamics of paid and unpaid invoices from the monthly perspective.
- Aging of accounts receivable: Monitor the distribution of the overdue amounts by debtor and period: current, up to 30 days, 30 to 60 days, 60 to 90 days, and 90+ days. Discover the customer’s overdue invoices that constitute your accounts receivable.
- Customer invoices: Unpack the details of all customer invoices for the last 12 months, both paid and unpaid, for all currencies.
You can set up this dashboard in Google Sheets and Looker Studio. To get started, follow the instructions in the Readme tab to have your data visualized in the dashboard.
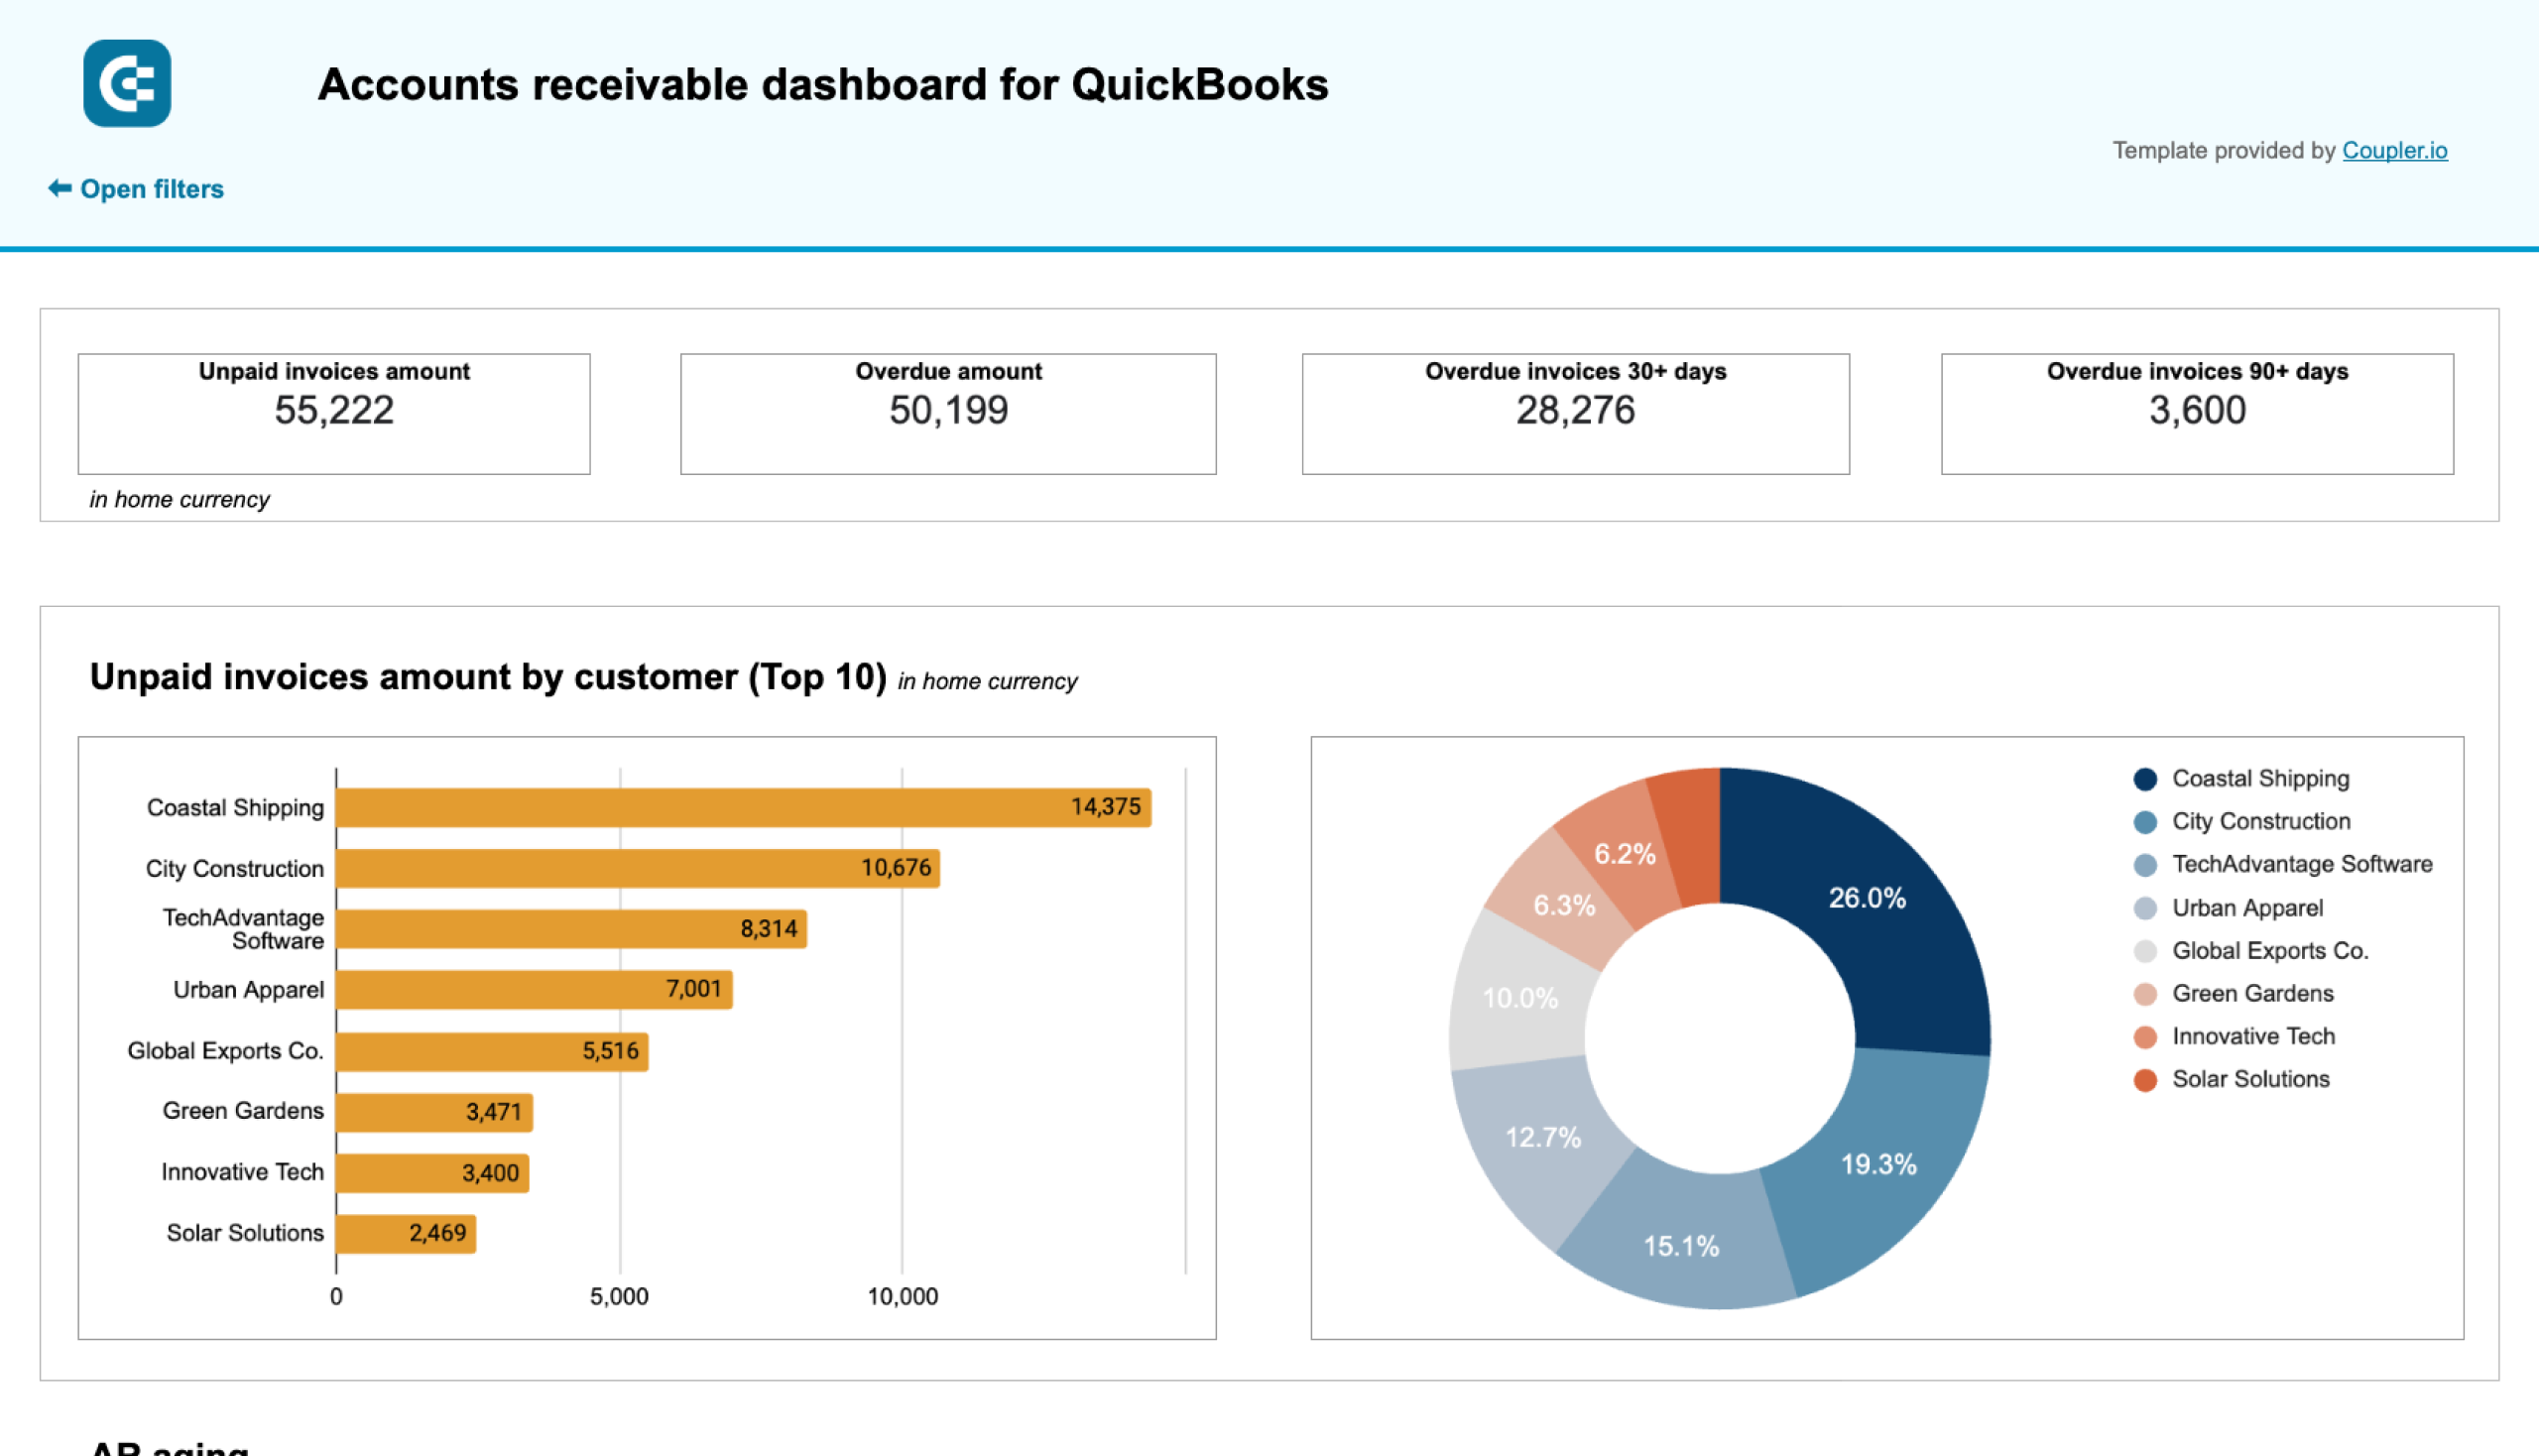
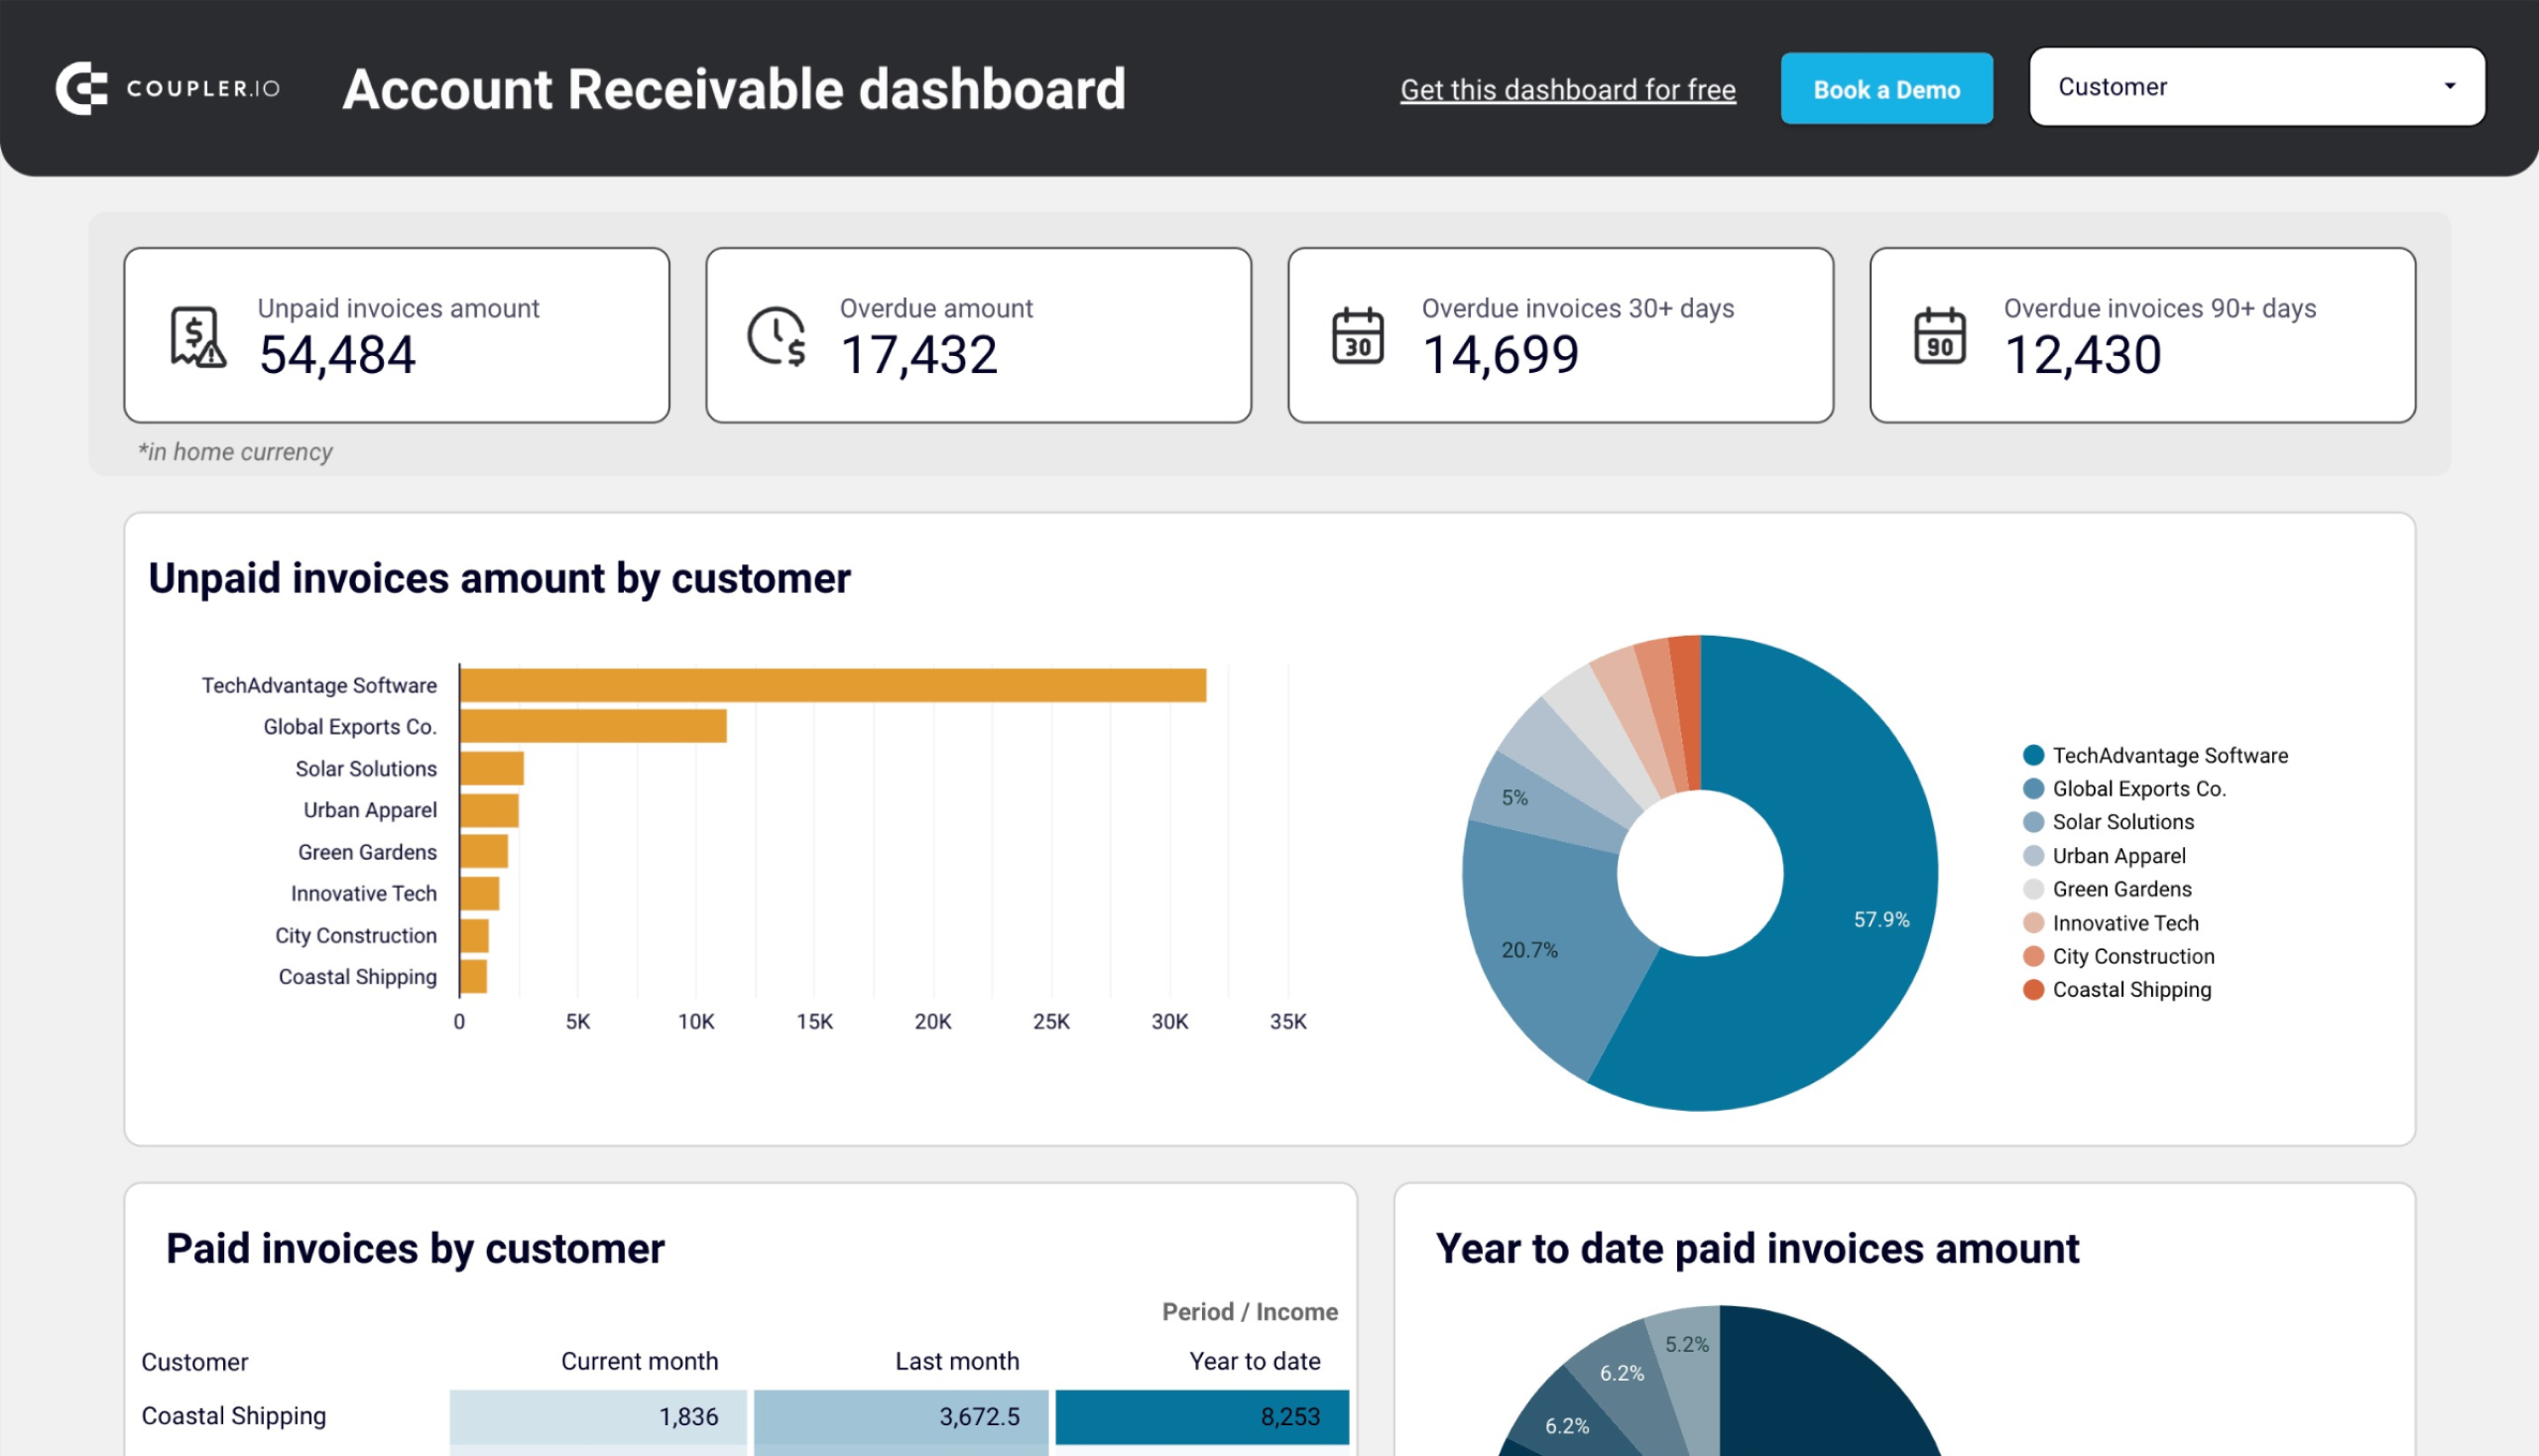
Accounts receivable dashboard for QuickBooks in Google Sheets
Monitor customer payment statuses, overdue invoices, and collection trends with this dashboard connected to QuickBooks. Get clear visibility into your cash flow cycle with aging analysis and customer payment patterns to improve financial forecasting.
Accounts receivable dashboard for QuickBooks in Looker Studio
See which customers accumulate unpaid and overdue invoices, analyze AR aging, and track changes over time. Get useful insights for maintaining financial health.
How to export data from QuickBooks Online the native way
QuickBooks Online features a native method for exporting various types of data into an Excel file. To find it, click on the gear icon in the top-right corner of your screen and select Export data.
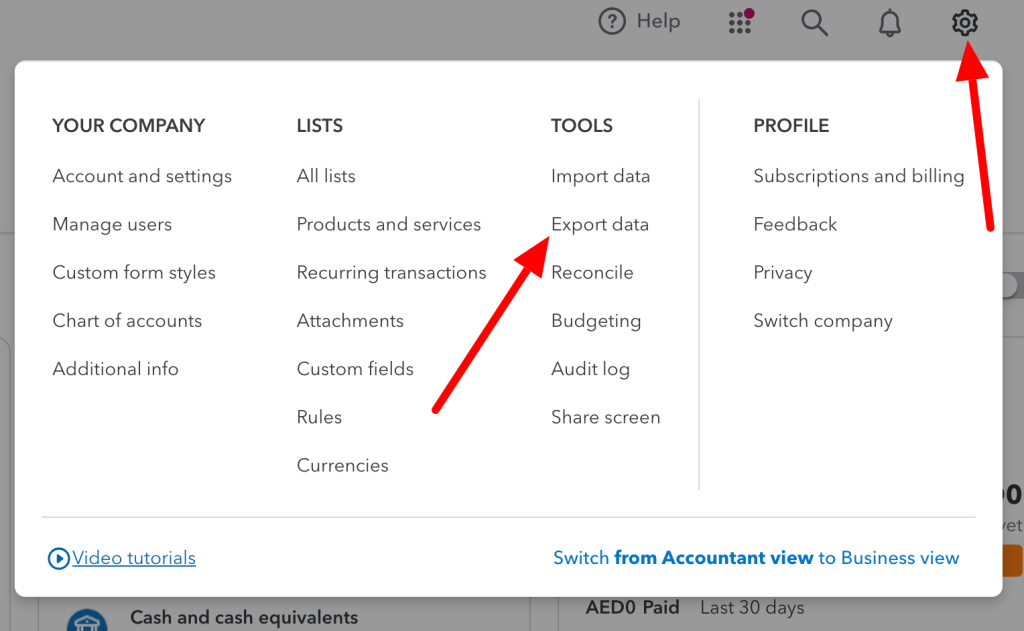
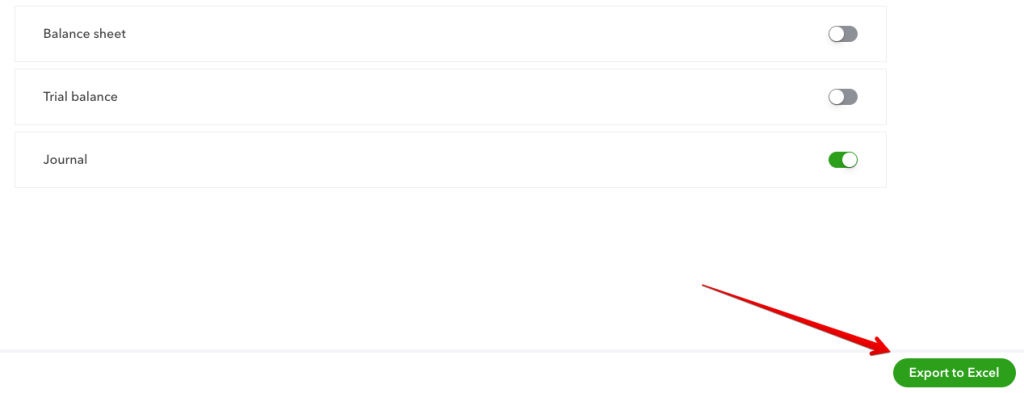
From here, you can export the following reports:
- General ledger
- Profit and loss
- Balance sheet
- Trial balance
- Journal
Read our blog post to learn how to export check register from QuickBooks.
There are also three lists available for download: Customers, Employees, and Suppliers.
Toggle on and off the reports you wish to fetch, and then press the Export to Excel button.
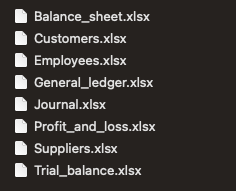
A .zip file will download, containing separate .xlsx files for each report that you picked.
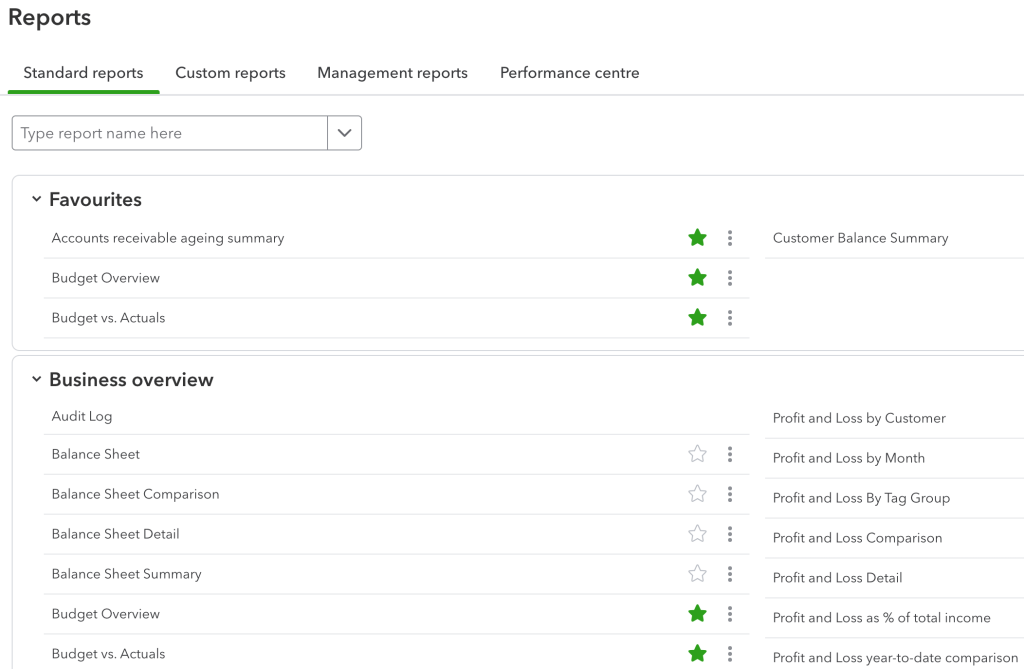
Fetch QuickBooks reports manually
Another place where you can export QuickBooks data is the Reports tab. There, you’ll find dozens of standard QuickBooks Online reports, as well as an option to create custom reports.
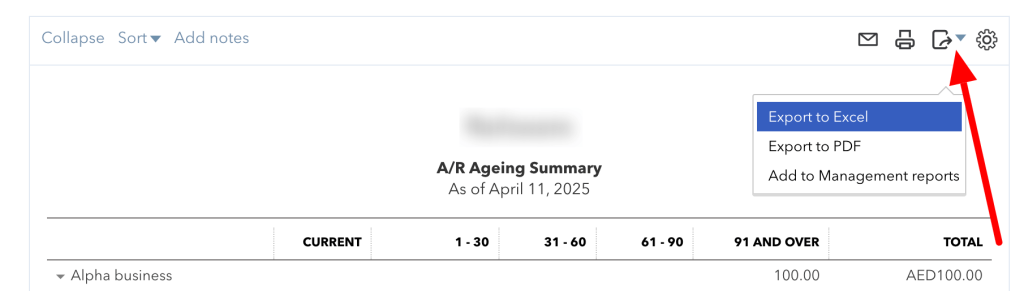
Click on any to view it. Click on the icon above to export QuickBooks to Excel file. A PDF download is also available now.
Limitations of manual data exports from QuickBooks
As you can see, it’s simple to export data from QuickBooks online using the native method. However, easy doesn’t always mean convenient or sufficient. These exports are problematic for several reasons:
- You have to export manually each time you need a report. It’s suitable if you only need a few reports but for weekly or monthly reporting on different things. Then, it can become overwhelming.
- You can only export QuickBooks to Excel and PDF files (for the more detailed reports). If you’re more accustomed to, e.g., Google products, you’ll have to import each file into a spreadsheet and hope it formats as expected.
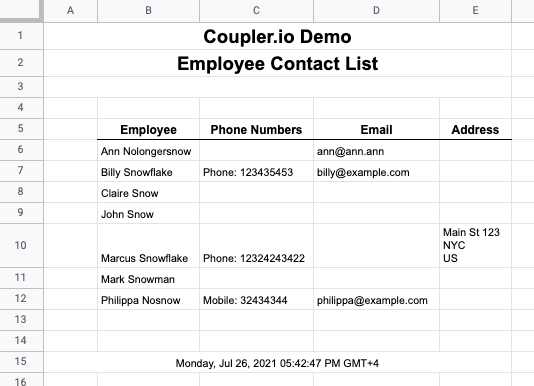
- Most reports show only the basic data. For example, the report we generated for our sample employees contained only the four basic data fields. If you need to fetch, for example, their hire data or hourly wage, you’ll have to resort to other methods.
FAQ on exporting data from QuickBooks Online
What QuickBooks data you can export with Coupler.io
| Data entity | Description |
|---|---|
| Account | Account data provides a comprehensive view of all your financial accounts. This includes bank accounts, credit cards, and asset accounts. This data lets you track financial transactions, manage budgets, and prepare accurate financial reports. |
| Attachable | Attachable data includes files and documents linked to your QuickBooks Online records. As a rule, these are receipts, invoices, and contracts. |
| Bill | Bill data encompasses all vendor bills, including details about the vendor, amounts, due dates, and payment statuses. This information allows you to manage payables, track expenses, and ensure timely payments to vendors. |
| BillPayment | BillPayment data includes records of payments made towards vendor bills. This data is essential for maintaining accurate accounts payable records. It also lets you track cash outflows and ensure all vendor obligations are met. |
| Budget | Budget data consists of financial plans and projections for various categories and time periods. With this information, you can compare actual performance against planned targets. |
| Class | Class data allows you to categorize transactions by department, location, or other segments. It helps you analyze financial performance across different areas of your business. |
| CompanyInfo | This data includes essential details about your business, such as company name, address, and contact information. Export this data to ensure all your business information is up-to-date and readily available for reporting. |
| CreditMemo | CreditMemo data consists of issued credits to customers for returns or refunds. This information is important for managing customer accounts and maintaining accurate sales records. |
| Customer | Customer data includes information about all your customers. This includes names, contact details, and transaction histories. This information lets you manage relationships, analyze sales trends, and support marketing efforts. |
| Department | Department data helps you segment financial data by different business units or divisions. With this information, you can conduct a detailed financial analysis and performance tracking at a departmental level. |
| Deposit | Deposit data includes records of funds deposited into your bank accounts. This information helps reconcile bank statements and ensure accurate financial reporting. |
| Employee | Employee data covers information about your staff. This includes names, contact details, and payroll information. This information is essential for managing payroll and tracking labor costs. |
| Estimate | Estimate data consists of price quotes provided to customers for potential sales. Use this information to track potential revenue, manage sales pipelines, and convert estimates into actual sales. |
| ExchangeRate | ExchangeRate data includes information on currency conversion rates used in transactions. This information is crucial for businesses dealing with multiple currencies to ensure accurate financial reporting. |
| Invoice | Invoice data encompasses all sales invoices issued to customers. This includes details about products, services, amounts, and payment terms. This information is key for managing receivables and tracking sales. |
| Item | Item data includes information about your products and services, such as descriptions, prices, and inventory levels. This data is helpful for managing inventory, pricing strategies, and sales reporting. |
| JournalEntry | JournalEntry data consists of manual entries made to the general ledger, including debits and credits for various accounts. With this information, you can ensure accurate and comprehensive financial records. |
| JournalCode | JournalCode data includes specific codes used to categorize journal entries. This information is helpful for maintaining organized and easily searchable financial records. |
| Payment | Payment data includes records of payments received from customers. It is essential for managing receivables and tracking cash inflows. |
| PaymentMethod | PaymentMethod data consists of the various methods customers use to make payments. These methods include credit cards, bank transfers, or cash. The data helps analyze payment trends and manage payment processing more efficiently. |
| Preferences | Preferences data includes customized settings and configurations within QuickBooks. This information ensures that your preferred settings are documented and can be restored. |
| Purchase | Purchase data covers records of goods and services bought from suppliers. This information is crucial for tracking expenses and managing supplier relationships. |
| PurchaseOrder | PurchaseOrder data consists of orders placed with suppliers for goods and services. This information allows you to track orders, manage inventory, and ensure timely procurement. |
| RefundReceipt | RefundReceipt data includes records of refunds issued to customers. This information is important for managing customer accounts and tracking refund transactions. |
| SalesReceipt | Sales receipt data includes records of sales transactions completed at the point of sale. This information is helpful for tracking daily sales and managing cash flow. |
| TaxAgency | TaxAgency data includes information about tax authorities you deal with. Export this data to ensure accurate tax reporting and compliance with various tax regulations. |
| TaxCode | TaxCode data consists of the various tax rates and codes used in your transactions. This information is crucial for accurate tax calculations and reporting. |
| TaxRate | TaxRate data includes the specific tax rates applicable to your sales and purchases. It is helpful to ensure compliance with tax regulations and accurate financial reporting. |
| Term | Term data includes the payment terms agreed upon with customers and suppliers, such as net 30 or net 60 days. This information is needed to manage cash flow and ensure timely payments and collections. |
| TimeActivity | TimeActivity data includes records of hours worked by employees or billed to customers. It is essential for payroll processing, job costing, and invoicing for billable hours. |
| Transfer | Transfer data consists of records of funds transferred between your accounts. This information is helpful for managing cash flow, reconciling accounts, and ensuring accurate financial records. |
| Vendor | Vendor data includes information about your suppliers, such as names, contact details, and transaction histories. This data is crucial for managing supplier relationships and tracking expenses. |
| VendorCredit | VendorCredit data consists of credits received from suppliers for returns or adjustments. This information helps manage payables and track outstanding credits. |
How to export employee data from QuickBooks
You can export the list of employees directly from QuickBooks Online. But, as we mentioned earlier, the file will be limited. For that reason, it’s better to set up Coupler.io so it can fetch the list of employees for you – for example, once a week.
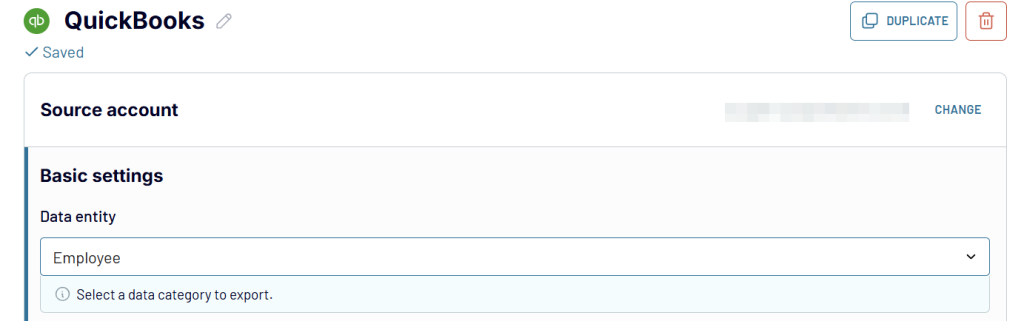
While configuring the source, pick Employee from the Data entity list. Proceed as previously and import to the chosen destination.
The advantage of having this data in a spreadsheet is that you can manipulate it how you want. For example, you could sort the list of employees by seniority, build a pivot table based on locations, or feed the list of birthdays or anniversaries into another tool and make this a special day for your people.
We’re doing exactly that at Coupler.io. We export details such as the hire date or an employee’s birthday into Google Sheets. Then, we feed this data to a Slack bot.
Both operations happen automatically, and the data will refresh when people join or leave. The result is some pretty nice notifications pushed in our Slack channel by the most reliable kitchen bot.

How to export customer data with QuickBooks
Customer reports are available in the Export data menu, just like the employee reports. But they are limited. For that reason, you may want to incorporate Coupler.io same as we did for the earlier data entity.
The only difference will be the Data entity – in this instance, it should be Customers.
How to export customer data with notes from QuickBooks
When you export QuickBooks data directly from the QuickBooks Online dashboard, customer export comes without notes (and plenty of other vital details). Of course, this is something you want to have easy access to, without the need to open each customer’s tab in QuickBooks.
Coupler.io addresses the lack of notes when you use the tool to export the customer data, the same as we described above. Notes are one of the data fields you’ll see in your spreadsheet.
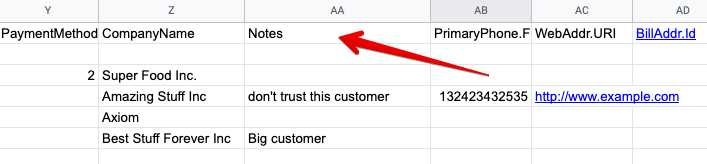
Please note: If no notes are available for any customers, this field won’t be imported.
How to export enterprise data from QuickBooks
Whether you are on an Enterprise or any other plan, exporting data looks exactly the same. You can export many different data entities with Coupler.io in the same way as we described in the earlier chapter.
It also lets you schedule exports of numerous QuickBooks reports, as outlined in our article on exporting QuickBooks reports.
Please note that any custom reports you create with Enterprise’s Advanced Reporting won’t be, at this point, available for automatic export with Coupler.io. You can still export it manually, as we explained earlier.
How to export estimate data from QuickBooks?
If you wish to fetch the estimates, all you need to do is swap the data entity in Coupler.io. Follow the earlier steps to export QuickBooks data automatically. When picking the entity, choose Estimate and run the data export.
The latest estimate data will be quickly fetched into your spreadsheet and updated automatically according to a chosen schedule.
How to export time data from QuickBooks
Exporting time entries from QuickBooks works in the same fashion. Set up a Coupler.io data flow and pick the TimeActivity data entity.
How to export sales data from QuickBooks
The best way to retrieve sales data is to import QuickBooks reports with Coupler.io. Follow the earlier steps. In the form below, we preselected QuickBooks Reports as an application (instead of just QuickBooks). Choose the desired destination app and click Proceed.
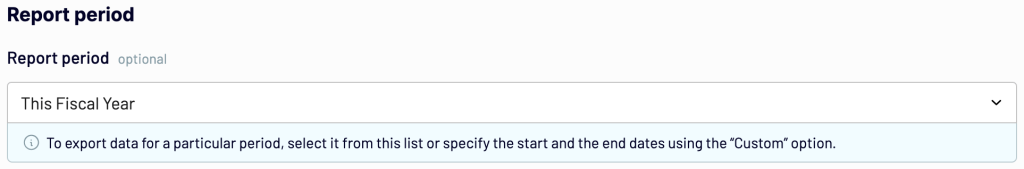
Then, pick from one of the four available sales reports. You can also choose the period for which you want to generate the report. As well as generate more detailed columns.
What QuickBooks reports you can export with Coupler.io
| Report | Description |
|---|---|
| Account List Details | Provides an overview of all your financial accounts. This includes account types, balances, and descriptions. Use this report to manage and review your chart of accounts and ensure accurate financial tracking. |
| AP Aging Detail | Shows unpaid vendor bills, categorized by the number of days they are overdue. Use this report to manage accounts payable and track outstanding liabilities. |
| AP Aging Summary | Provides a summarized view of unpaid vendor bills, grouped by aging periods (e.g., 0-30 days, 31-60 days). This report helps quickly assess the overall state of accounts payable and prioritize payments. |
| AR Aging Detail | Lists outstanding customer invoices, categorized by the number of days they are overdue. Use this report to manage accounts receivable and track overdue payments. |
| AR Aging Summary | Provides a summarized view of outstanding customer invoices, grouped by aging periods. This report helps quickly assess the overall state of accounts receivable. |
| Balance Sheet | Presents a snapshot of your business’s financial position, showing assets, liabilities, and equity. This report is essential for understanding your financial health and preparing for financial audits. Check out the free balance sheet dashboard templates by Coupler.io. |
| Cash Flow | Details the inflows and outflows of cash over a specified period. Use this report to manage liquidity and forecast future cash needs. |
| Customer Balance | Shows the total amount each customer owes you. Use this report to manage accounts receivable and ensure accurate customer account records. |
| Customer Balance Detail | Provides a detailed breakdown of each customer’s outstanding balance. This report is helpful for managing collections and resolving any discrepancies in customer accounts. |
| Customer Income | Shows the total income generated from each customer over a specified period. Use this report to analyze customer profitability and identify top customers. |
| Expenses by Vendor | Details the total expenses incurred with each vendor over a specified period. Use this report to manage supplier relationships and identify opportunities for cost savings. |
| General Ledger Detail | Provides a detailed record of all financial transactions for each account. This report is crucial for comprehensive financial analysis and auditing. |
| Inventory Valuation Summary | Shows the value of your inventory on hand, including quantities and costs. Use this report to manage inventory levels and track inventory costs. |
| Journal Report | Provides a detailed list of all journal entries, including debits and credits for each transaction. This report is essential for maintaining accurate financial records. |
| Profit and Loss Summary | Shows your business’s revenues, expenses, and net income over a specified period. Use this report or our free profit and loss dashboard to evaluate financial performance and prepare for tax filings. |
| Profit and Loss Detail | Provides a detailed breakdown of your revenues and expenses, including individual transactions. Use this report to identify trends and understand the components of your profitability. |
| Sales by Class Summary | Shows sales categorized by classes, such as departments or locations. Use this report to analyze sales performance across different segments of your business. |
| Sales by Customer | Details the total sales to each customer over a specified period. Use this report to understand customer purchasing behavior and develop targeted sales strategies. |
| Sales by Department | Shows sales performance by different departments or business units. Use this report to analyze departmental performance and optimize resources. |
| Sales by Product | Details the total sales of each product or service over a specified period. Use this report to understand product performance and manage inventory. |
| Tax Summary | Provides an overview of tax collected and paid over a specified period. Use this report to ensure compliance with tax regulations, prepare tax returns, and manage tax liabilities. |
| Transaction List | Provides a comprehensive list of all financial transactions over a specified period. Use this report to review and verify all business activities, ensuring accurate record-keeping. |
| Transaction List by Customer | Details all transactions for each customer over a specified period. Use this report to manage customer accounts, track sales, and resolve any discrepancies. |
| Transaction List by Vendor | Provides a detailed list of all transactions with each vendor over a specified period. Use this report to manage supplier relationships, track expenses, and ensure accurate records. |
| Transaction List with Splits | Shows transactions that involve multiple accounts, detailing how amounts are split. Use this report to understand complex transactions, ensure accurate record-keeping, and facilitate audits. |
| Trial Balance | Provides a summary of all account balances at a specific point in time. Use this report to verify the accuracy of your accounts and prepare financial statements. |
| Vendor Balance | Shows the total amount you owe each vendor. Use this report to manage accounts payable, track outstanding balances, and ensure timely payments. |
| Vendor Balance Detail | Provides a detailed breakdown of each vendor’s outstanding balance. Use this report to manage payables and resolve any discrepancies in vendor accounts. |
How to export invoice data without tax from QuickBooks?
You can pull the list of invoices from QuickBooks in the same way we pulled estimates, time entries, customers, and a few other entities. When setting up the source, be sure to pick Invoice this time.
Note that each invoice will take a few lines of your spreadsheet. There will be one line for each of the products or services mentioned on an invoice. Plus, a separate line summarizing what’s on the invoice (even if there’s just one item).
You may need to fetch the invoice data without tax. The imported file is quite detailed and contains all the information you need. Look at the following columns:
- GlobalTaxCalculation states whether tax is included in the price, excluded, or not applicable.
- TxnTaxDetail.TaxLine.0.TaxLineDetail.NetAmountTaxable shows the net taxable amount.
- TxnTaxDetail.TotalTax displays the total amount of tax that was charged.
- TotalAmt is about the total amount on an invoice
Depending on your taxation policy, find the most applicable column and apply it to your calculations.
Benefits of exporting data from QuickBooks
Regular, automated data exports from QuickBooks can be beneficial both for you and your business.
Working with QuickBooks data, you frequently need to look up different numbers, check reports, or generate them yourself. Pulling the data that matters to you directly into a spreadsheet makes it so much simpler – not only to access it but also to manipulate it or feed it to other services.
If you can automate QuickBooks data export, it’s even better. You’ll get rid of the mundane tasks of exporting reports and, perhaps, also converting them into the desired output. You’ll make better use of your time.
Analyzing data from a spreadsheet becomes more manageable when using tools such as Tableau or Looker Studio. You’ll have a better overview of the state of your finances and will have a QuickBooks backup available with barely any effort on your side.
Automate QuickBooks data export with Coupler.io
Get started for free