Do you need to share your report built in Salesforce with external stakeholders? Or do you simply want to visualize your Salesforce data using some external data visualization tool, such as Power BI? There are many reasons why you might want to export a Salesforce report to Excel, but the options are quite limited. Read on to find out which tool or solution works best for you.
Export Salesforce report to Excel – methods to consider
- Manually export Salesforce report to Excel or CSV – This is the native functionality that allows you to manually download Salesforce reports to Excel. You can export formatted reports as Excel files or the raw data as Excel and CSV files.
- Schedule the export of Salesforce data to build custom reports– Use Coupler.io to create reports from multiple Salesforce data types in a single view and load them into Excel with scheduled refresh. You can set your report to update automatically as often as every 15 minutes.
- Export Salesforce reports via the Salesforce API – This is an advanced approach, which may require coding skills to extract data via the Salesforce API. Alternatively, you can use the JSON to Excel connector. This will let you avoid any coding, but you’ll need to map the exported data in Excel.
We’re going to review each section separately. However, if you already know which of these options to export reports from Salesforce to Excel would work best for you, you can skip right to it.
How to export Salesforce report to Excel with Coupler.io
To have Salesforce export data to Excel automatically, use Coupler.io. This reporting platform lets you build custom reports from Salesforce data on the go, enrich them with records from other sources, and fetch them to Excel on schedule. Other than Excel, you can also connect Salesforce to Looker Studio, Google Sheets, BigQuery, etc.
Example of how you can connect Salesforce report to Excel
With Coupler.io, it only takes three steps to automate your data export from Salesforce to Excel:
Step 1. Extract data from Salesforce
Get started by clicking Proceed in the form below:

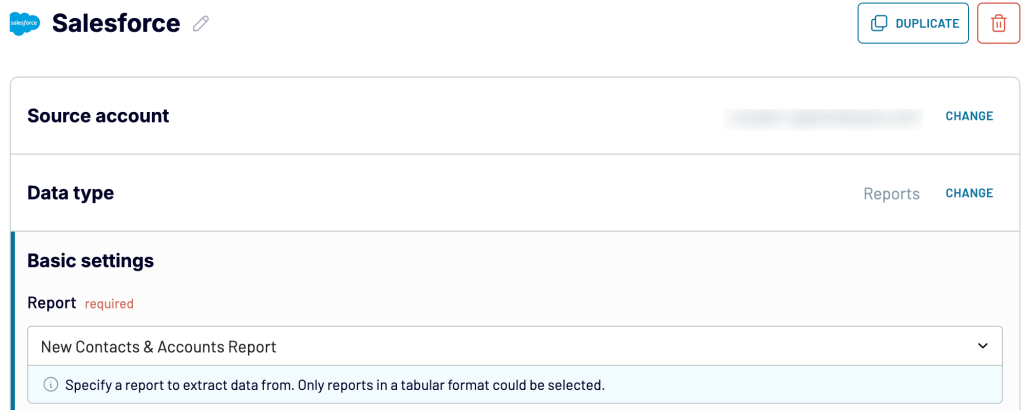
Now, sign up for Coupler.io at no cost. After that, connect your Salesforce account and configure the source settings:
- Select the data type to export – either choose your existing Salesforce data types, such as reports and objects, or enter a custom SOQL request. In our example, let’s choose reports as our data type and pick New Contacts & Accounts Report from the dropdown list.

Moving forward, if you need to fetch more than one data type, simply add Salesforce as an extra source and follow the process described above.

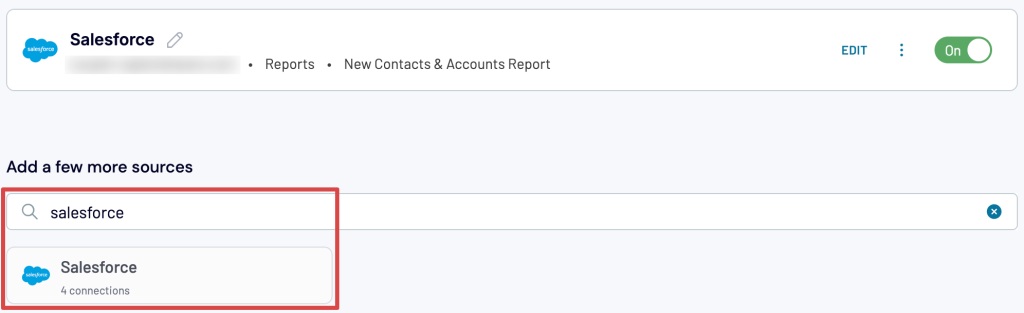
This way, you can also connect other types of sources, such as Google Analytics 4, ad platforms, and more.
Once you’ve configured your source settings, proceed to the next step.
Step 2. Transform data
Preview the data you’re going to export.

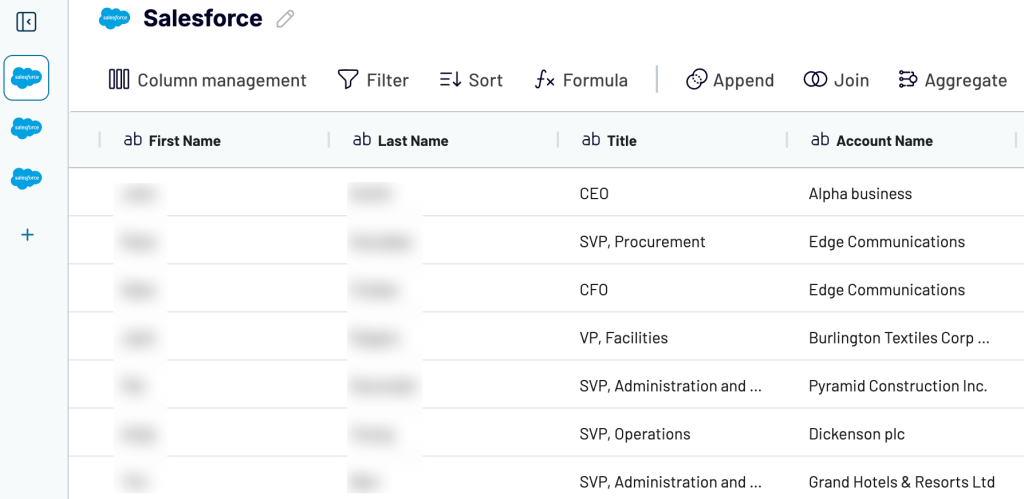
In addition, Coupler.io allows you to implement a few transformations on the go:
- Manage columns: hide, rename, reorder, and change their types.
- Create new columns with custom calculation formulas.
- Sort data in ascending or descending order.
- Filter data based on the required criteria.
- Aggregate data using operations like sum, average, count, min., or max.
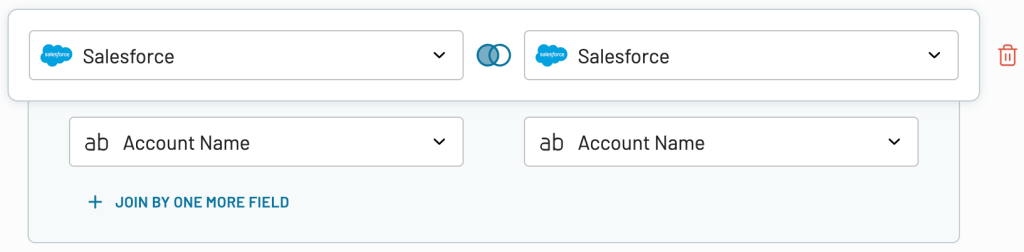
If you’ve previously connected several sources, blend data in the chosen manner:
- Append – merge datasets with similar structures and columns matched by name.
- Join – combine datasets with different structures and at least one matched column.

Once the report is ready, proceed to set up your destination.
Step 3. Load data into Excel
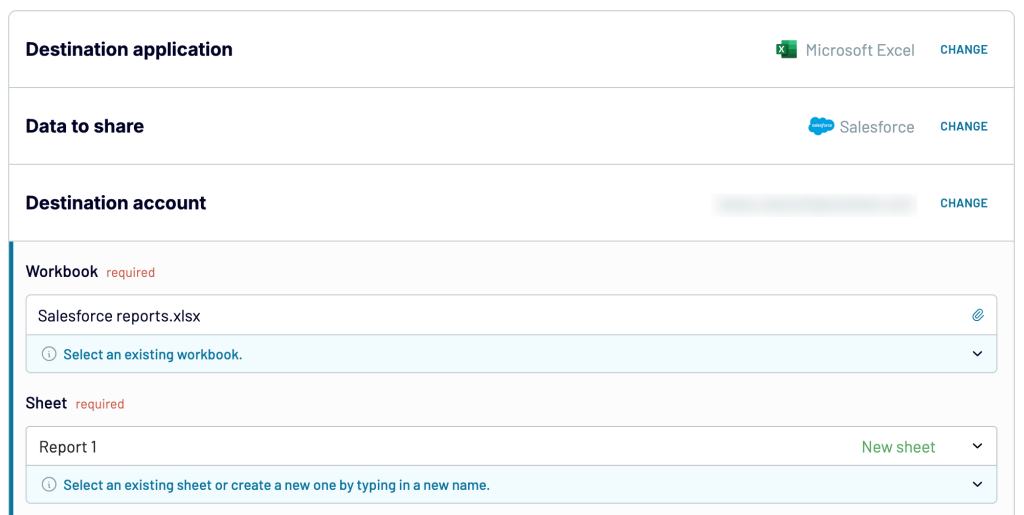
Connect your Microsoft account. Select a workbook stored on your OneDrive, as well as the worksheet where the data will be loaded. Alternatively, you can type in a name to create a new worksheet.

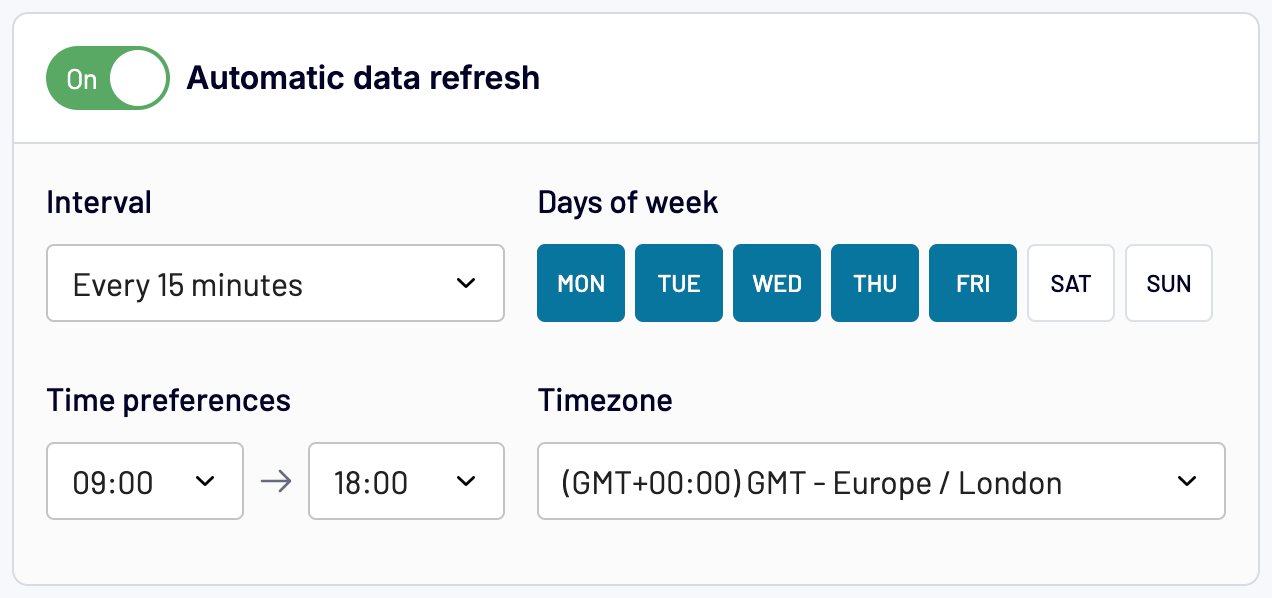
Proceed and, if necessary, set a schedule for automated data refresh. You can automate exports of Salesforce data on a schedule right before running your export. Just toggle on the Automatic data refresh and set the schedule you want. With Coupler.io, you can have your data refreshed up to every 15 minutes. Next, save and run to export the data into your Excel workbook.

And that’s it! Coupler.io will automatically update data from Salesforce in Excel.
Build a report based on the Salesforce data exported to Excel
Now you know how to build a custom report based on Salesforce data and load it into Excel on a schedule with Coupler.io. Alternatively, you can use Coupler.io to export raw Salesforce data into Excel and create a report directly in the worksheet. Let’s see how it’s done.
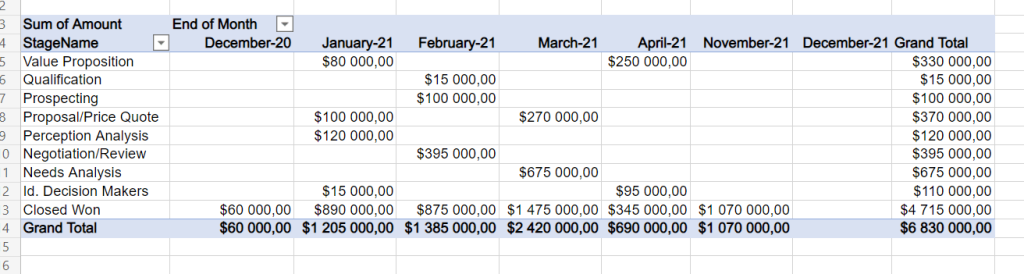
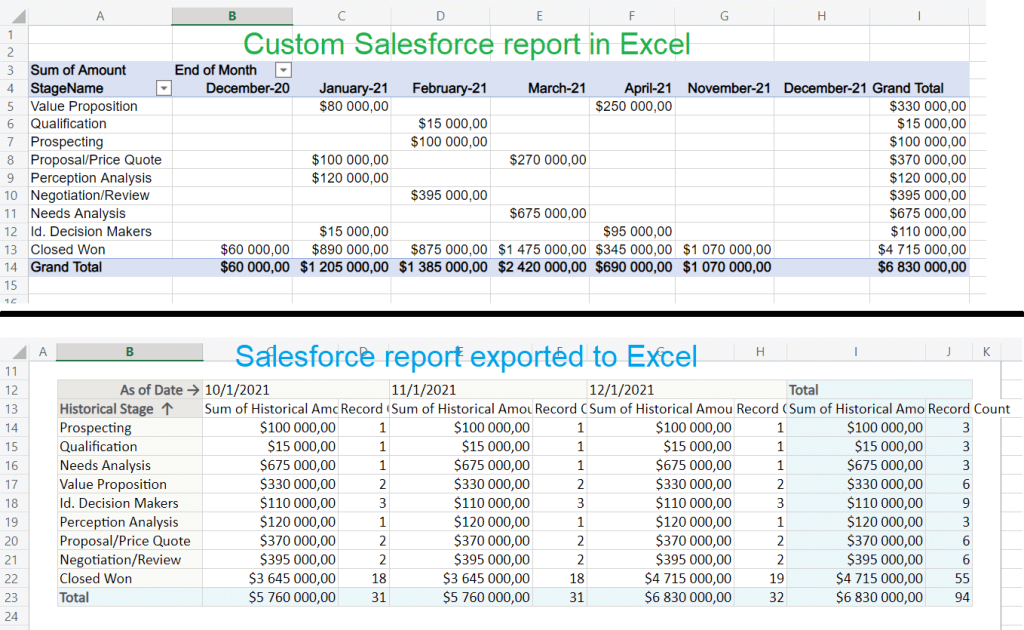
In our example, the report will be based on the raw New Opportunity Trends Report from Salesforce. After exporting it to Excel, we inserted a Pivot table to get the format we needed.

Here are the steps we took:
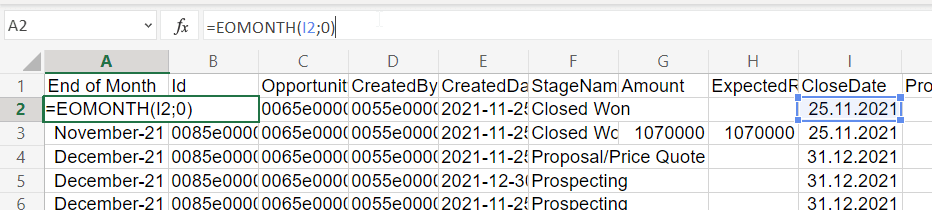
- Added a new column with the End of Month formula to convert values from the CloseDate column.

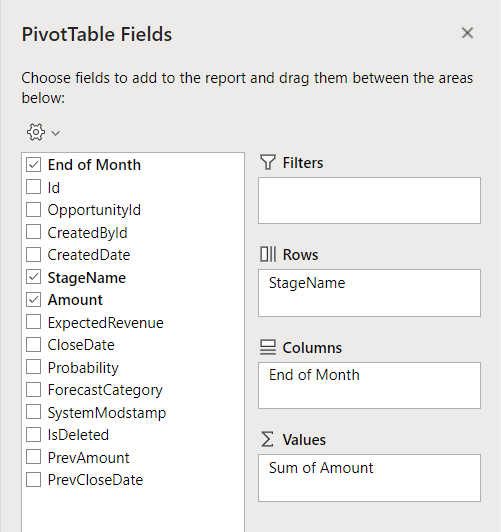
- Inserted a pivot table with the following fields:
- Rows: StageName
- Columns: End of Month
- Values: Sum of Amount

Here is what our custom report looks like compared to the raw New Opportunity Trends Report.

This custom report will also be updated automatically with every data refresh that you set up in Coupler.io. So, you can use this method not only for reporting but also for other tasks, such as creating a Salesforce backup copy.
Pivot table is just an example that we used here. You can create custom reports using Excel functions, Power Query, charts, and other features.
Ready-to-use dashboard templates for Salesforce
As you already know, Salesforce reporting in Excel requires you to collect data and make the necessary transformations to prepare it for analysis. However, a time-saving alternative exists – prebuilt reports. Coupler.io offers a gallery of free Salesforce report templates designed with data viz tools, such as Google Sheets and Looker Studio. Each template has a built-in Coupler.io connector, so the data is automatically loaded into the dashboard and visualized.
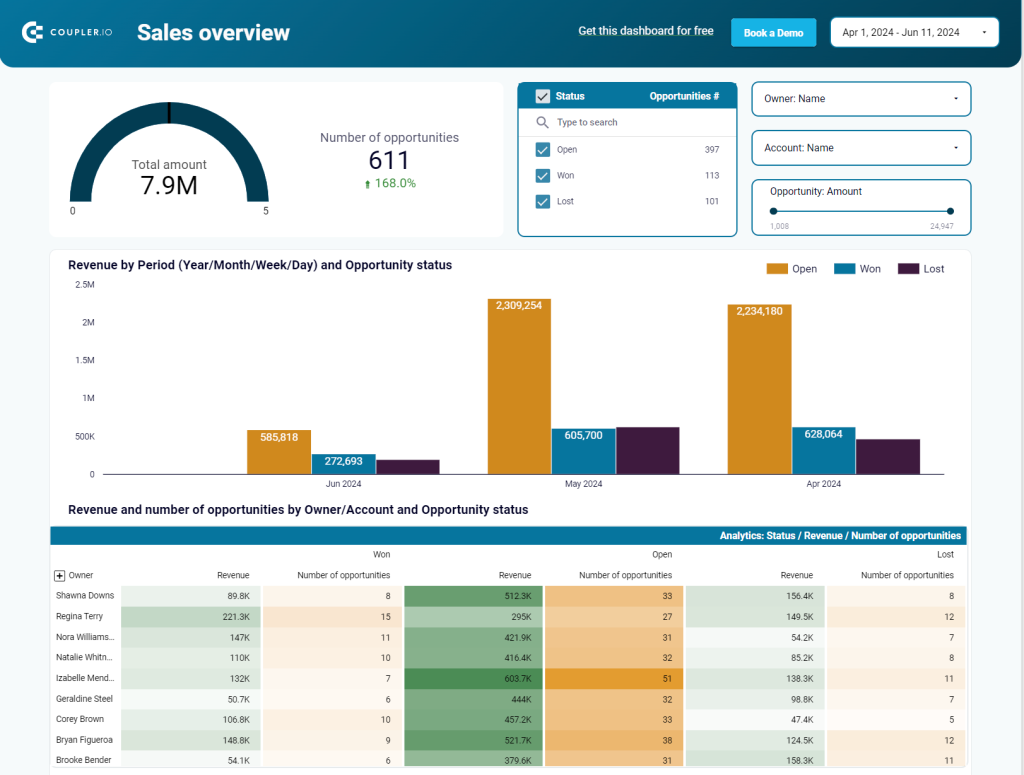
Sales dashboard
This dashboard is focused on essential sales analytics. It provides you with immediate insights into your sales pipeline performance.

Use this dashboard to explore the following:
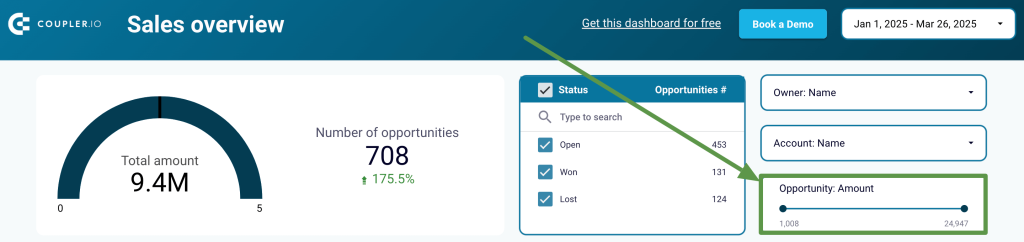
- Analyze deals within specific revenue ranges by filtering data by opportunity amount. For example, assess the performance of high-profit deals by examining their owner, status, and effectiveness.

- Compare the performance of deals from different lead sources to determine where to focus your marketing and lead generation efforts.

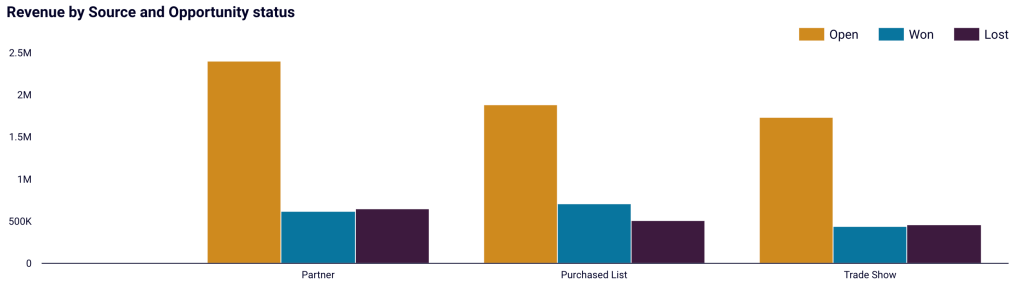
- Delve into won and lost deals, breaking them down by owner, lead source, and revenue. Find the ideal timing for closing deals, filtering data by days to close. You can also see the data visualized by additional parameters, such as deal type.

- Review open opportunities to identify current challenges and understand the reasons behind unclosed deals.
The dashboard is available in Looker Studio. To set it up, go to the template’s Readme tab and follow the instructions.
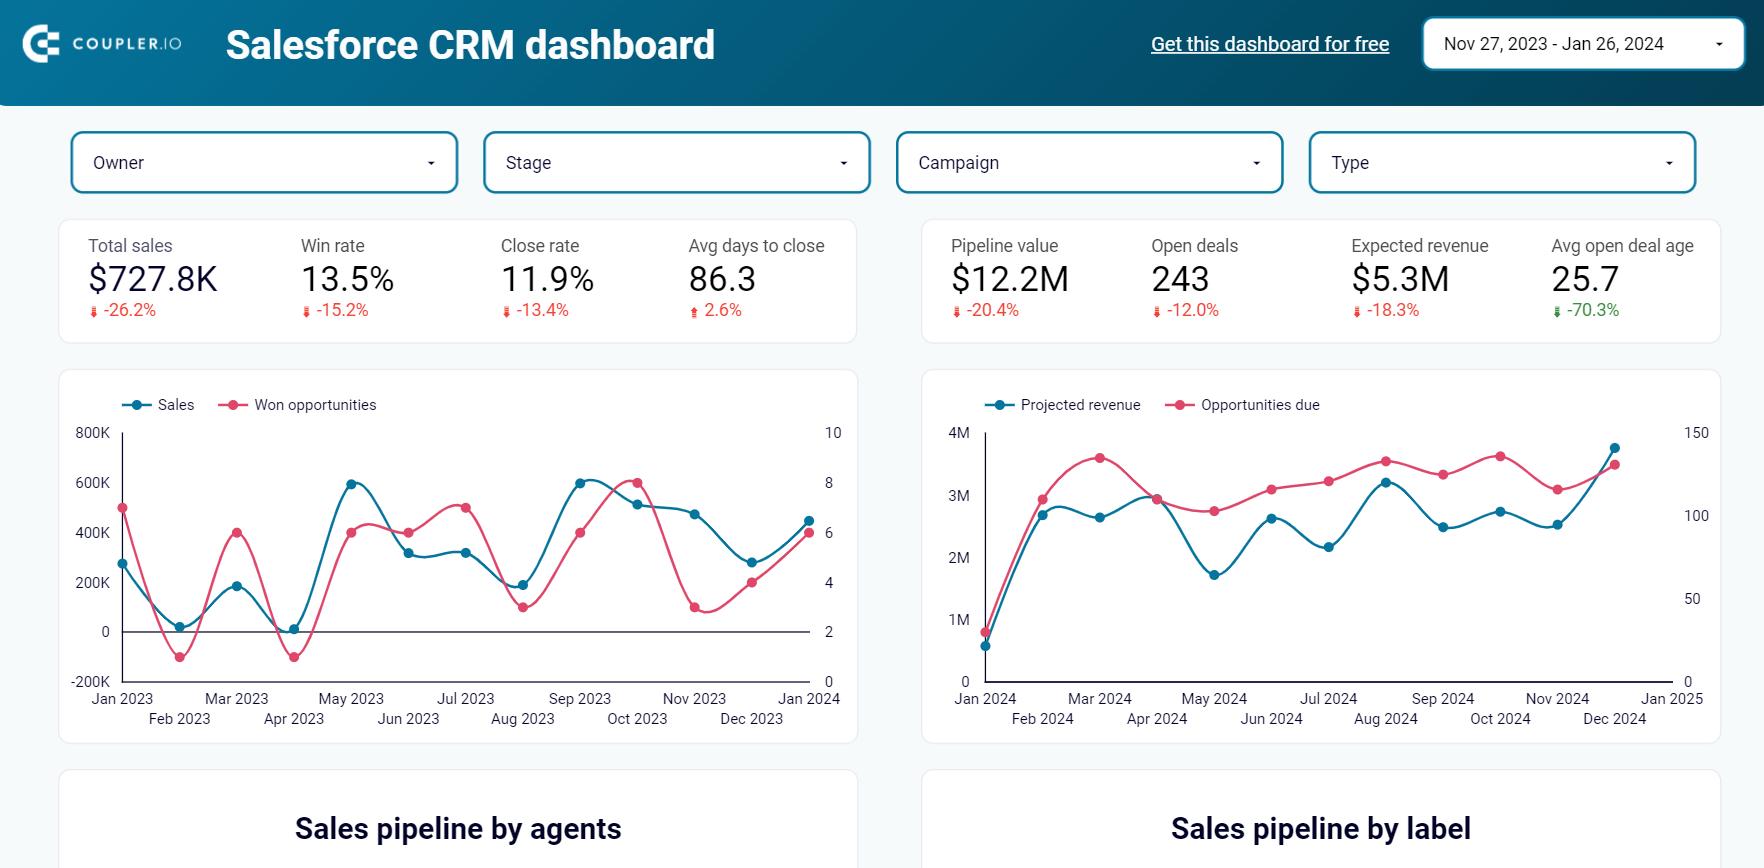
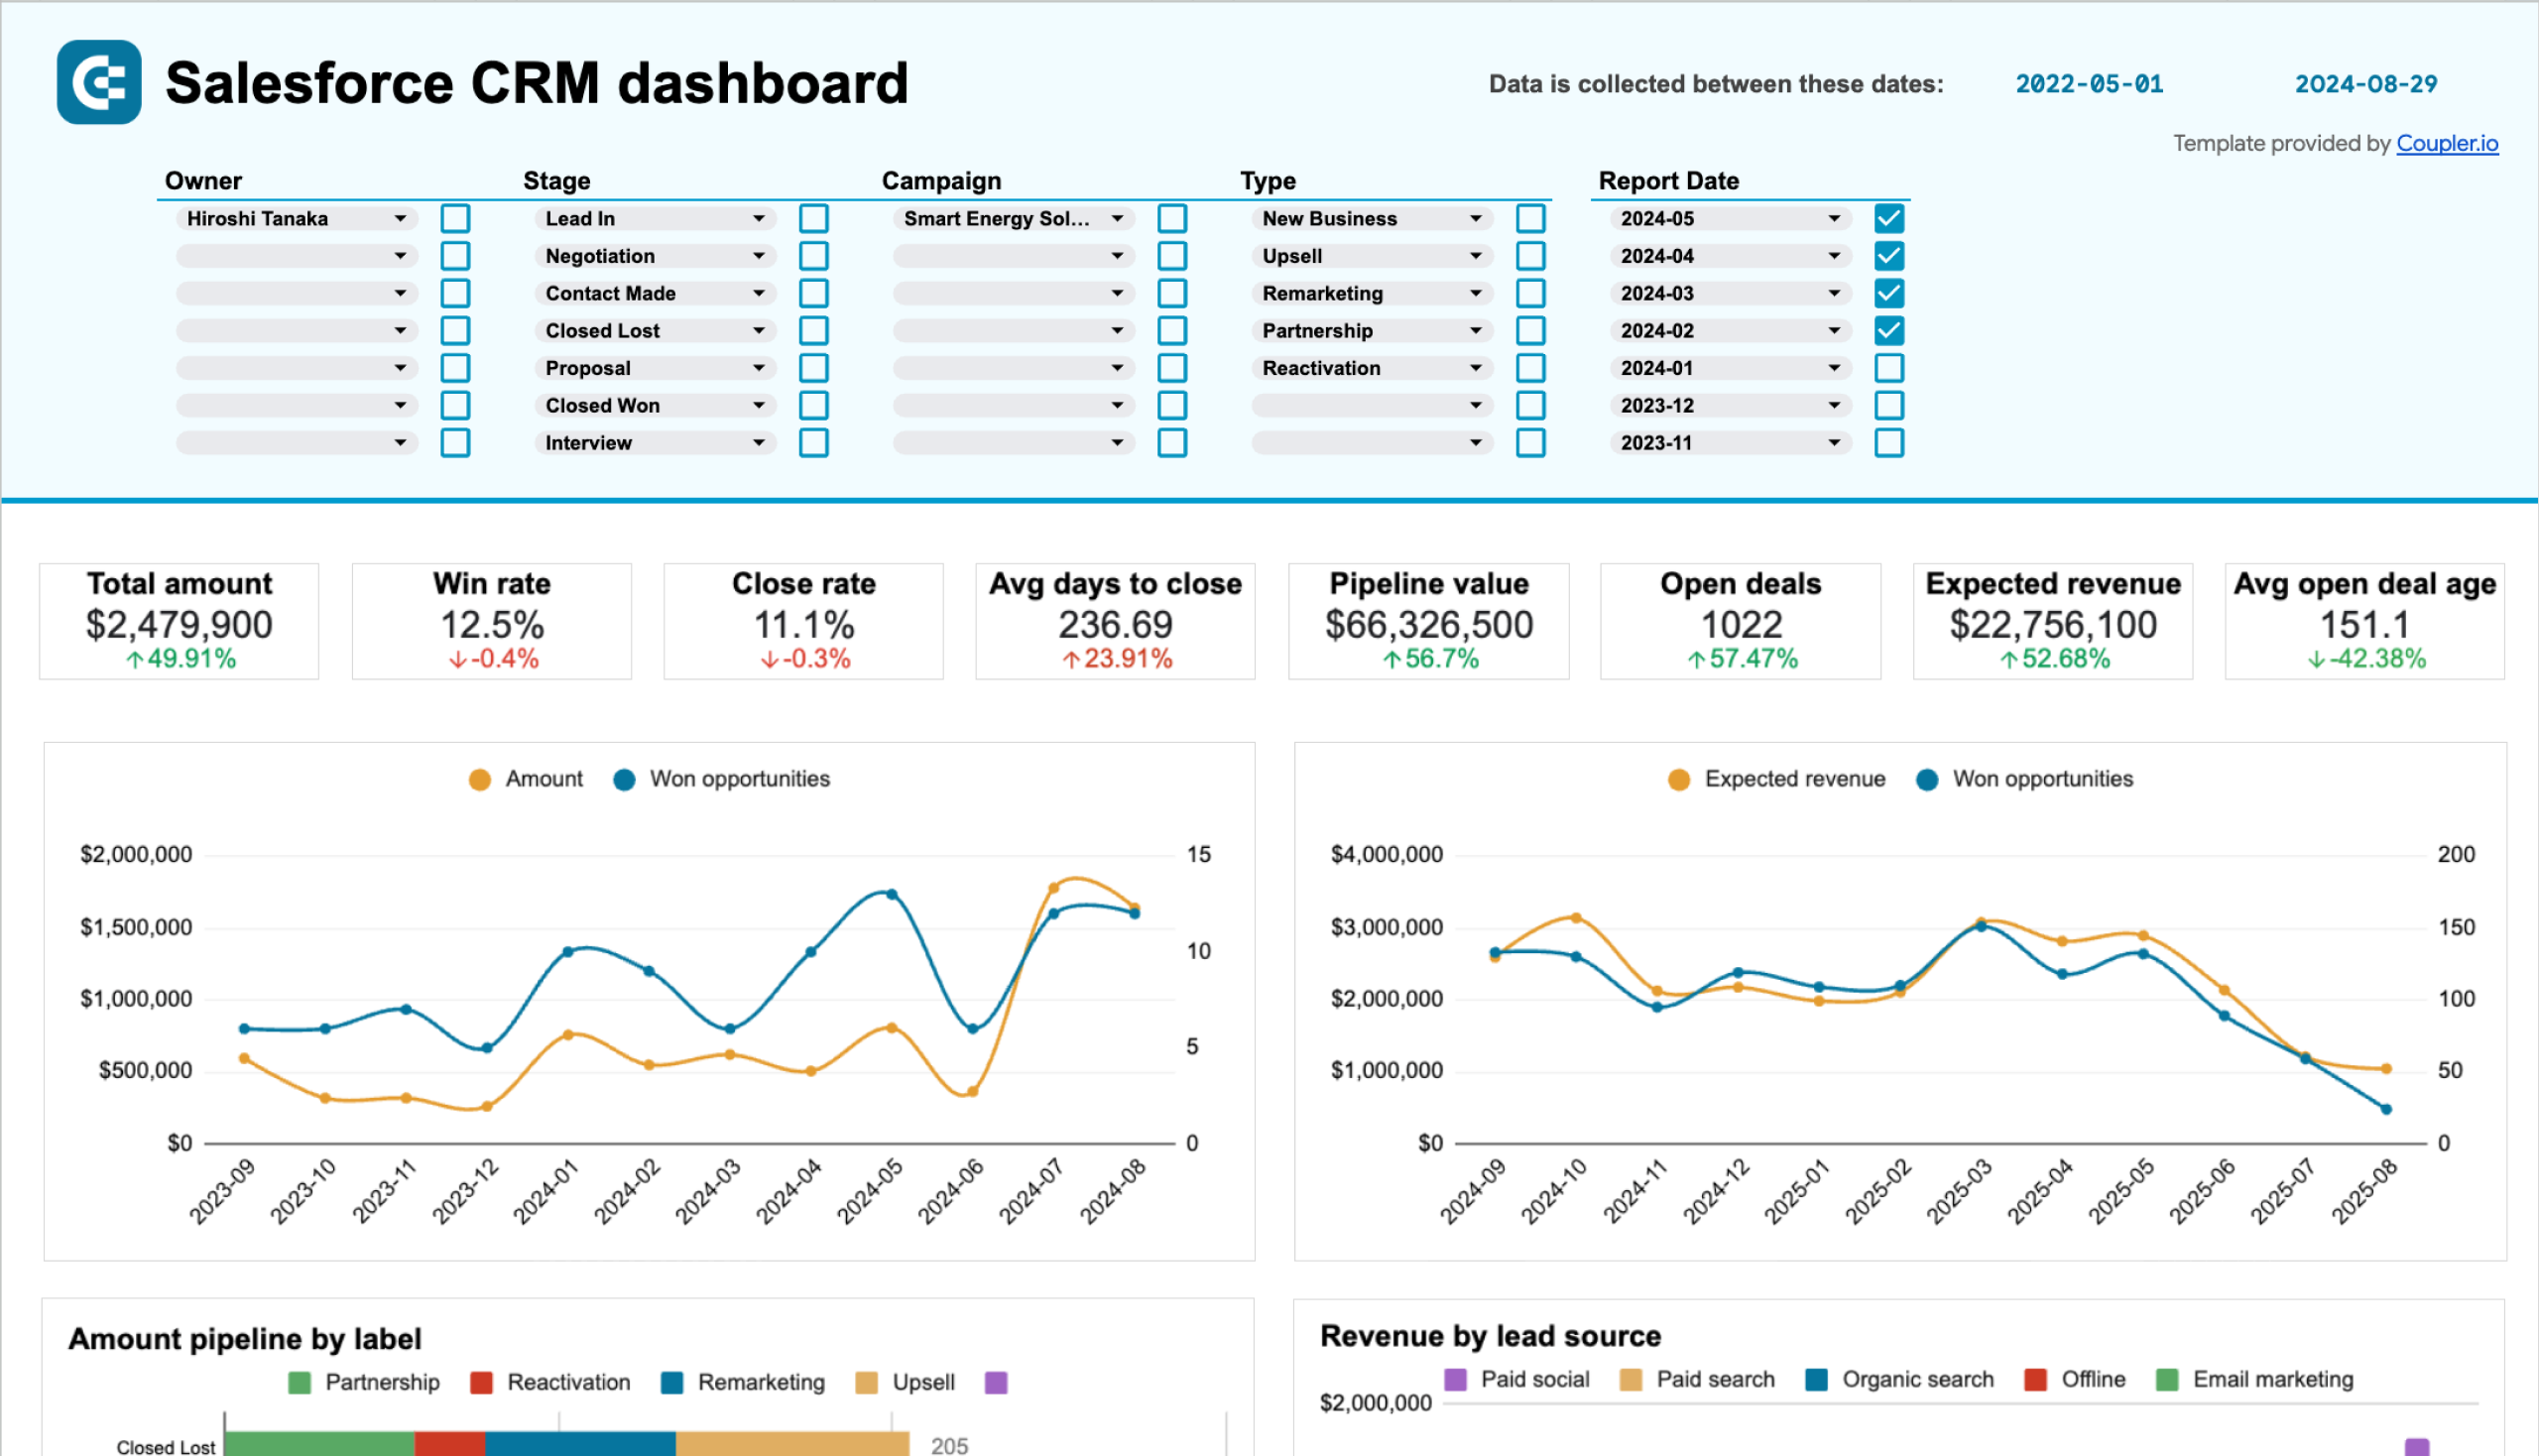
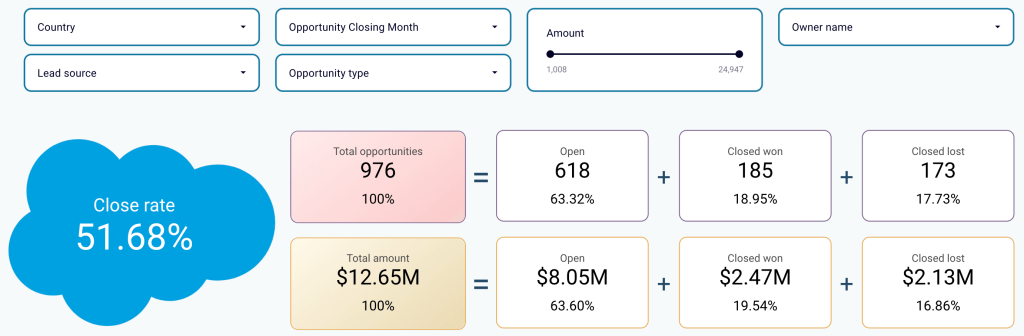
Salesforce CRM dashboard
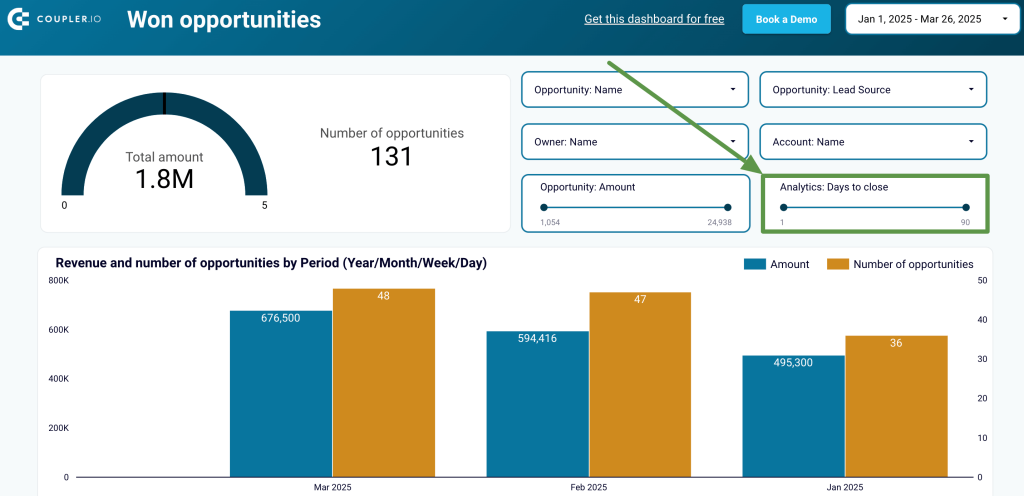
The Salesforce CRM dashboard offers an overview of your sales opportunities and lets you drill down into the specifics of your pipeline.


Here’s what insights you’ll gain using this dashboard:
- Go over your sales opportunities by owner (your sales team member), stage, name (campaign), and type. This will help you uncover the specifics of each case that might be overlooked when viewing the general picture of your sales pipeline.

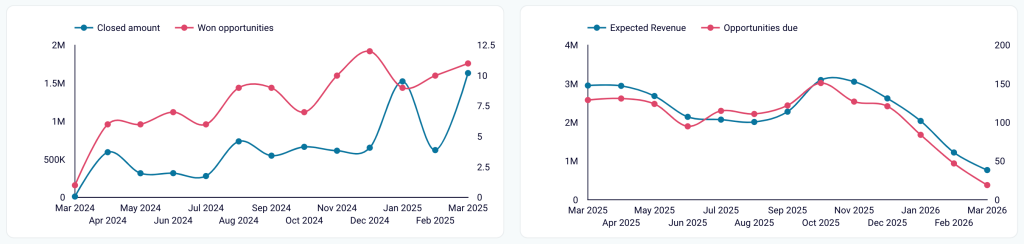
- Reveal the correlation between:
- the generated revenue and the number of won opportunities
- projected revenue and the number of upcoming opportunities
Use this information to spot growth trends and prioritize high-potential leads.

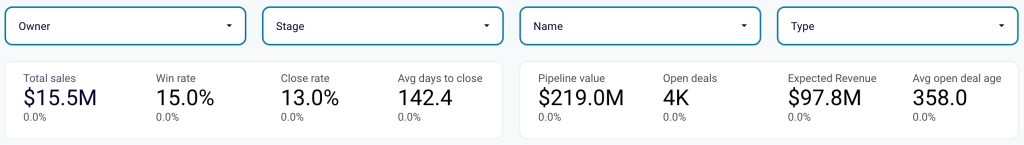
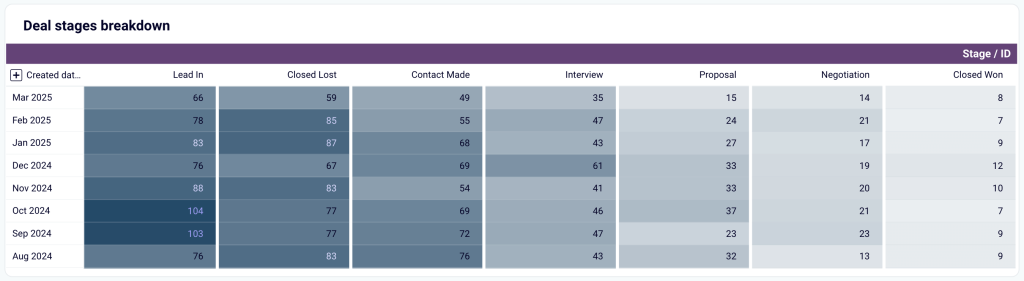
- View a detailed breakdown of opportunities across deal stages. This will let you assess pipeline health and analyze the distribution and movement of deals from lead-in to closed, either won or lost.
For example, you may discover that a significant percentage of deals are stuck in the negotiation stage, while fewer progress to closed-won. This points to a bottleneck in the final decision-making process.

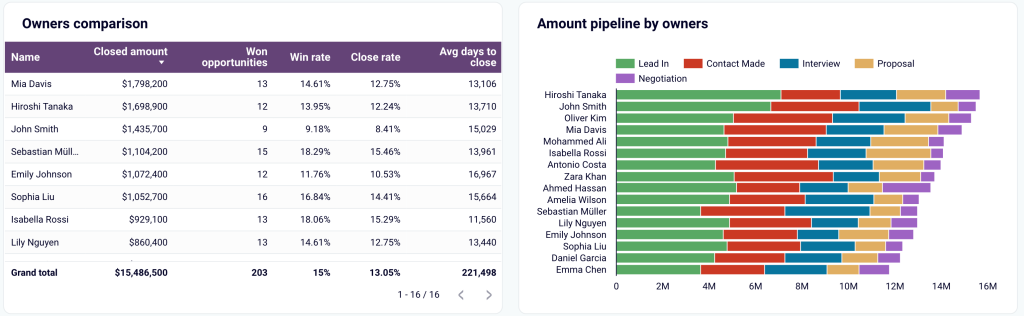
- Monitor the performance of your sales team members. You’ll be able to understand their win and close rates, as well as the time they take to close deals. This insight is valuable for distributing high-priority deals among the sales reps. In addition, check out each team member’s pipeline progress.

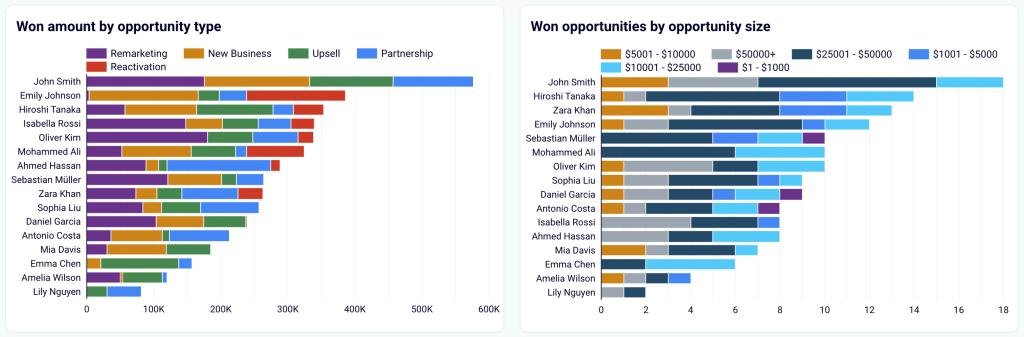
- Dive into opportunity-specific data, such as:
- Amount by opportunity type: Track revenue by opportunity type to evaluate the effectiveness of different sales strategies or campaigns.
- Top open and won opportunities: Identify the highest-value open and won deals to focus on opportunities with the biggest impact.
- Stalled opportunities: Spot inactive opportunities so your team can take proactive steps to re-engage leads.
- Open opportunities: Get a structured view of all open opportunities, including key details like stage, owner, lead source, probability, and amount.
- Accounts and campaigns: Analyze account and campaign performance to align efforts and measure the success of targeted initiatives.
- Amount by opportunity type: Track revenue by opportunity type to evaluate the effectiveness of different sales strategies or campaigns.
This dashboard has Looker Studio and Google Sheets versions. Navigate to the Readme tab inside the chosen template for step-by-step setup instructions.

CRM dashboard for Salesforce
Use our CRM dashboard for Salesforce to track key metrics, check how your sales team performs, and understand what drives your revenues.


Salesforce CRM dashboard in Google Sheets
Get a detailed overview of your opportunities in Salesforce and analyze the performance of your sales team.

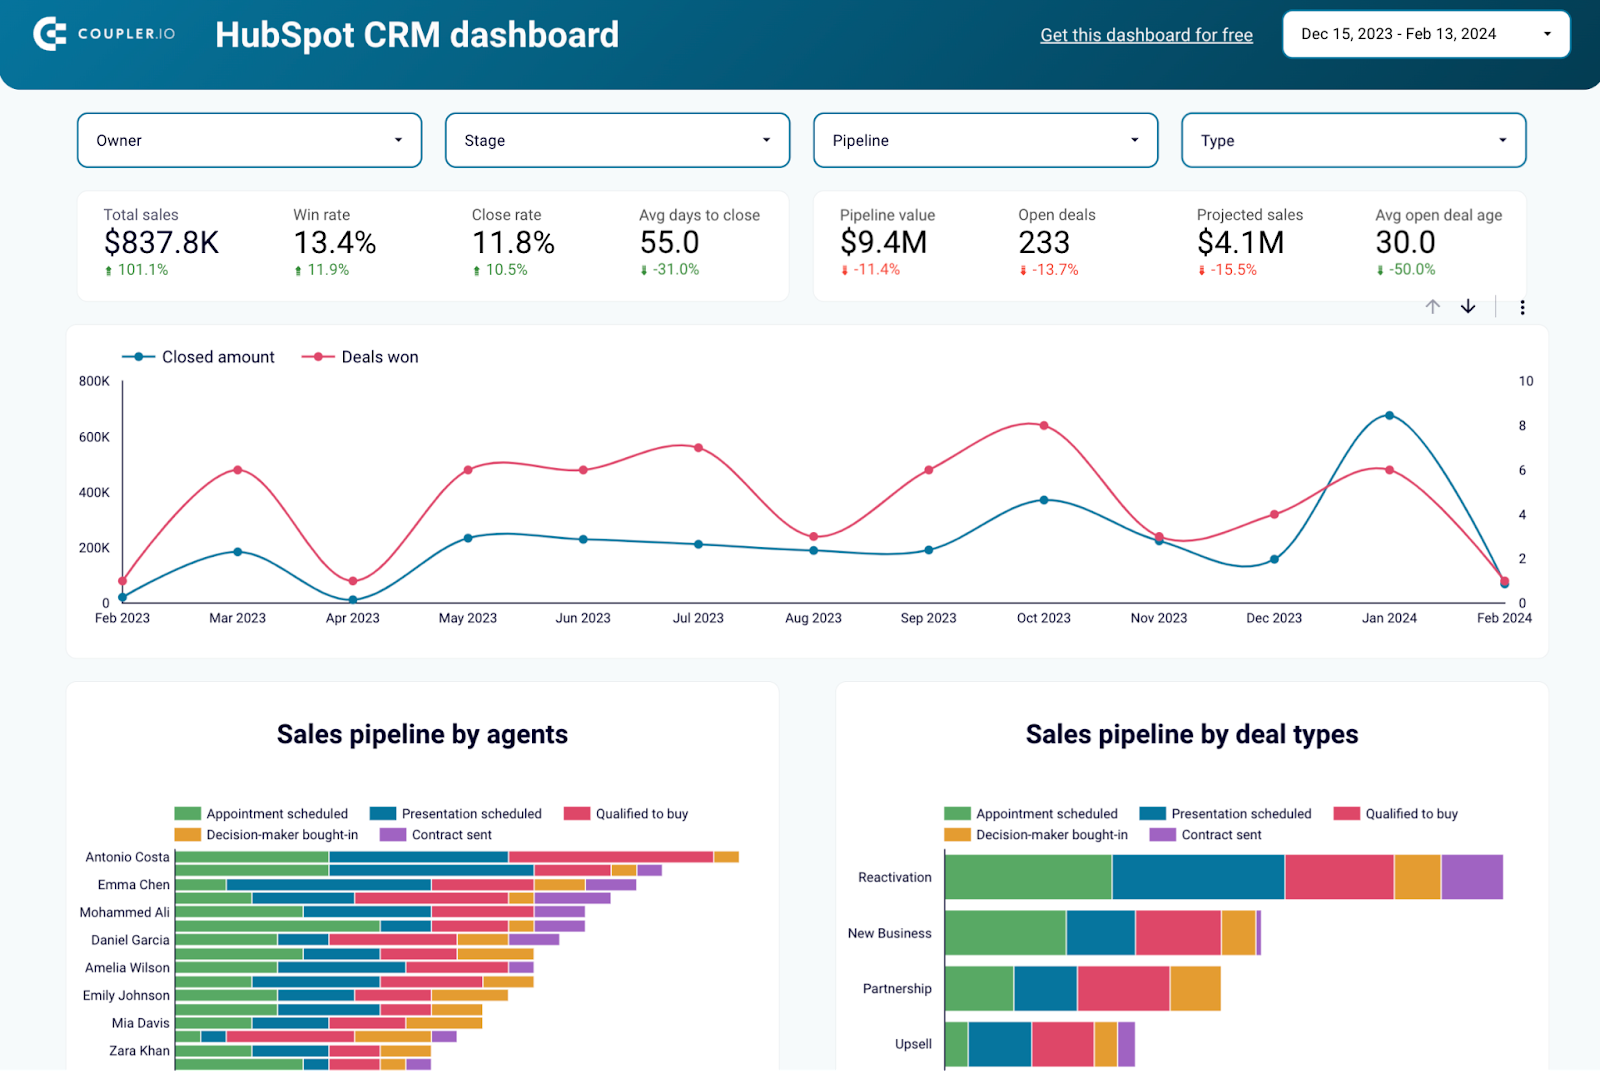
CRM dashboard for HubSpot
Use our CRM dashboard for Salesforce to track key metrics, check how your sales team performs, and understand what drives your revenues.

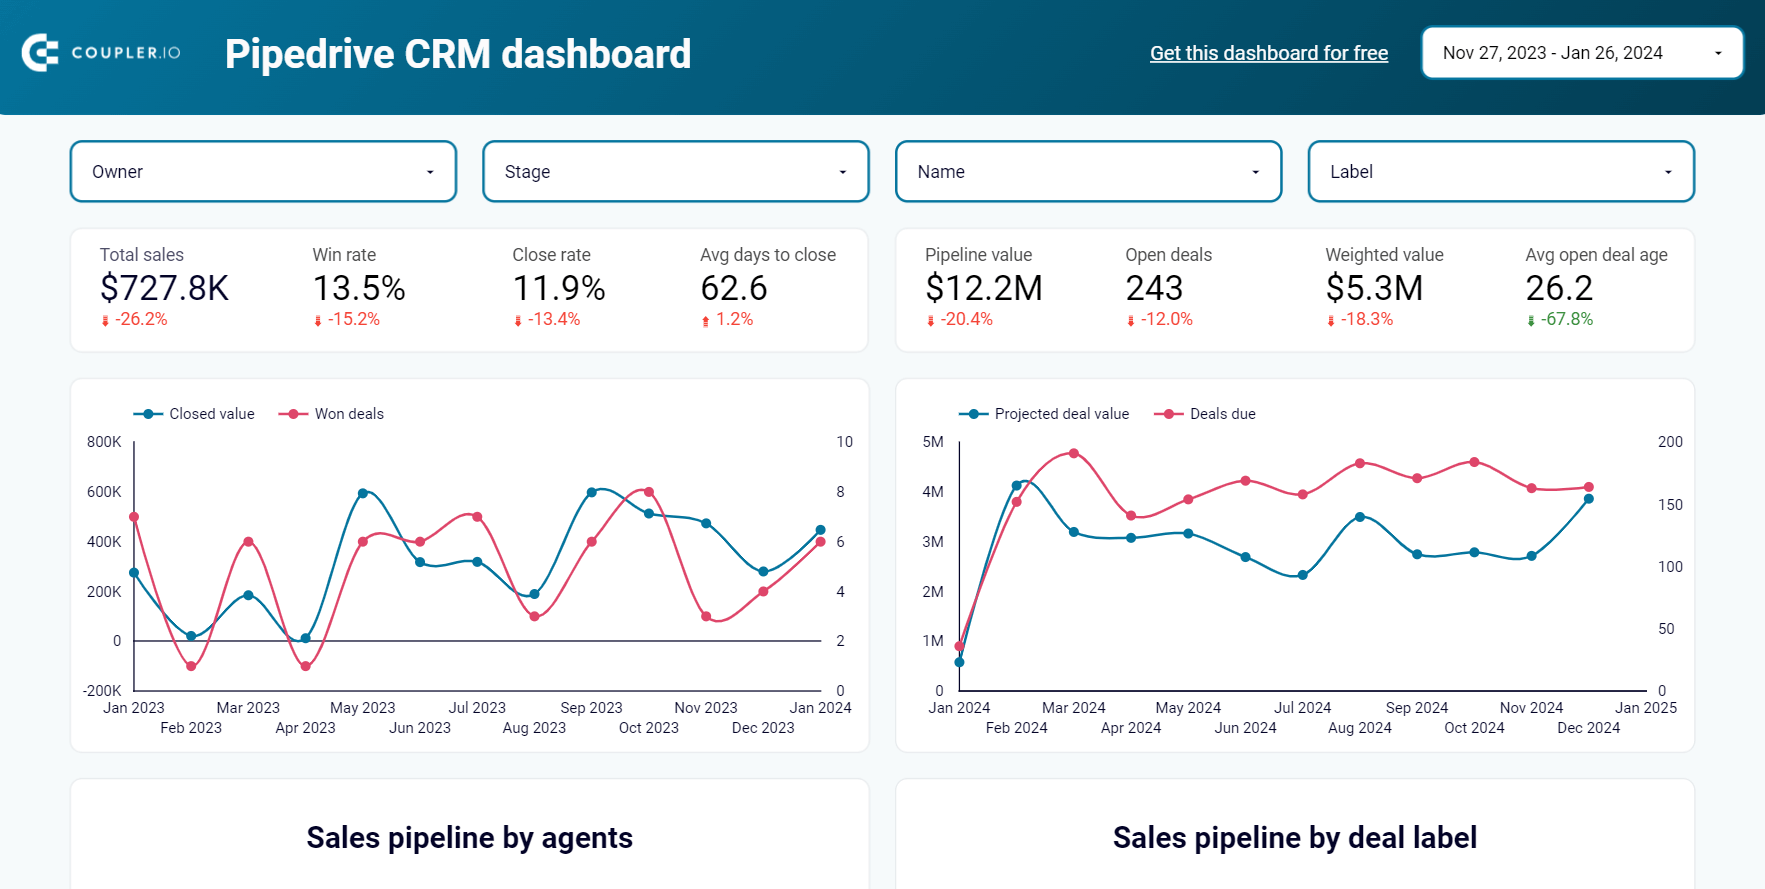
CRM dashboard for Pipedrive
Stay on top of your Pipedrive sales using our CRM dashboard which allows you to analyze your sales department’s performance.
Sales analytics dashboard
This dashboard pulls data from Salesforce, Google Analytics 4, and major ad platforms to attribute leads and revenue to specific marketing channels.

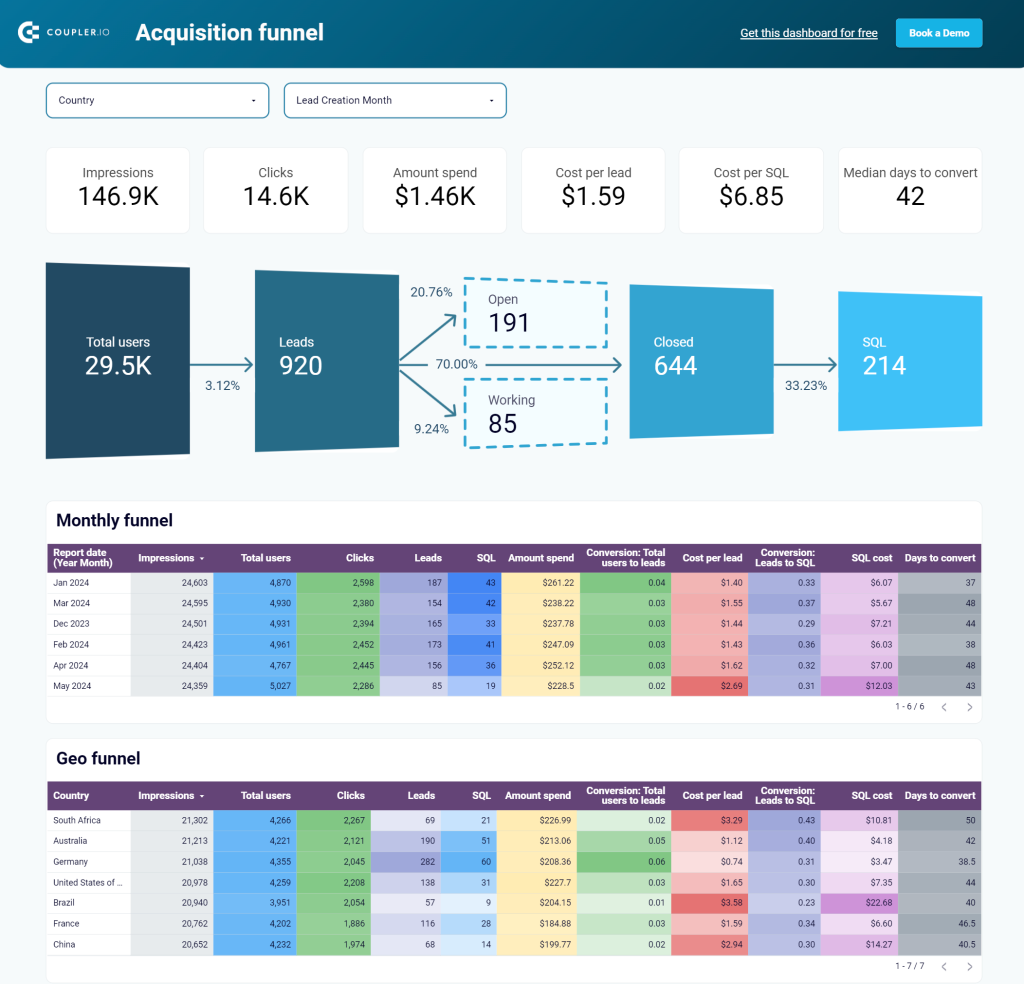
Using this dashboard, you’ll reveal the following:
- Assess the effectiveness of generated traffic (total users) by comparing conversion rates against your industry benchmark. Identify underperforming stages and develop hypotheses to drive more revenue from your existing pipeline.
- Break down data by country to pinpoint the best-performing regions for lead generation or conversion. If one country generates many leads but has low conversion rates, the issue could stem from language barriers, shipping options, or other localized factors.

- Compare performance across different periods and regions using table-view funnels. Identify the best-performing segments and link them to marketing or lead-generation activities to uncover growth opportunities.

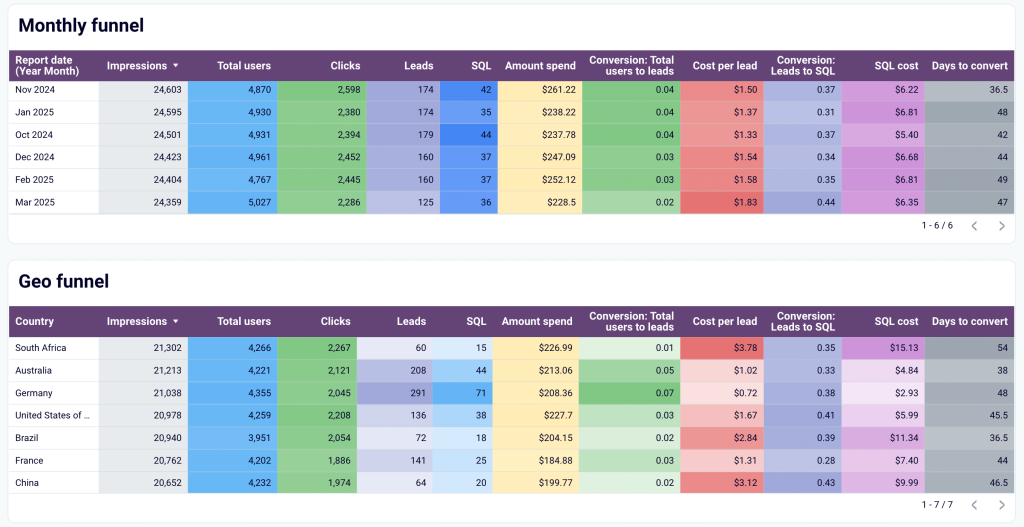
- Track key acquisition metrics over time. Analyze data by geography to focus on prioritized destinations.
- Get a detailed view of open deals to determine where to focus your efforts right now. Explore deals by owner, revenue amount, or deal type.

To start using the dashboard in Looker Studio, click the template’s Readme tab and follow the straightforward setup guide.
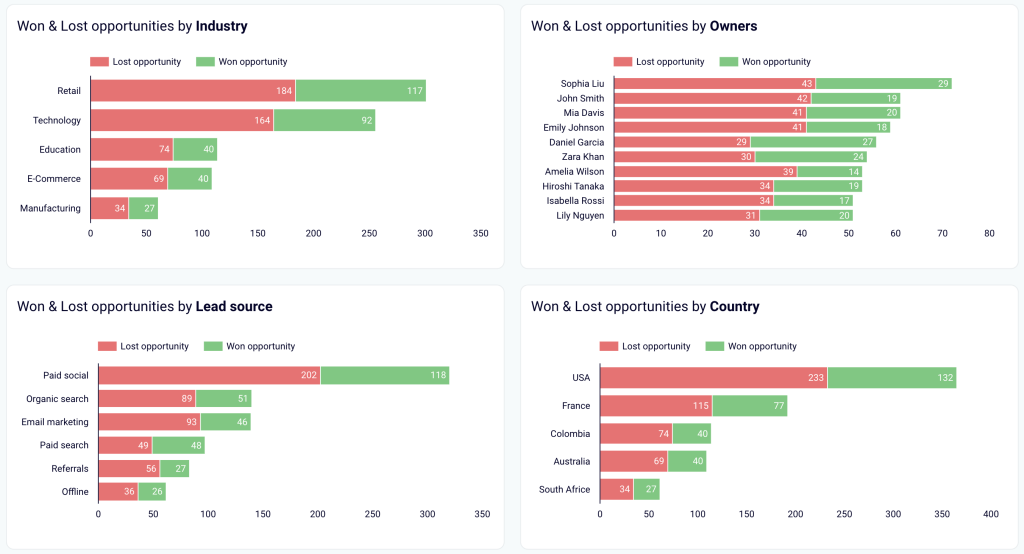
Salesforce win/loss analysis dashboard
The Salesforce win/loss analysis dashboard lets you compare won and lost deals with detailed breakdowns. This way, you can understand the reasons behind both successful and unsuccessful sales to address weak points and double down on what works.

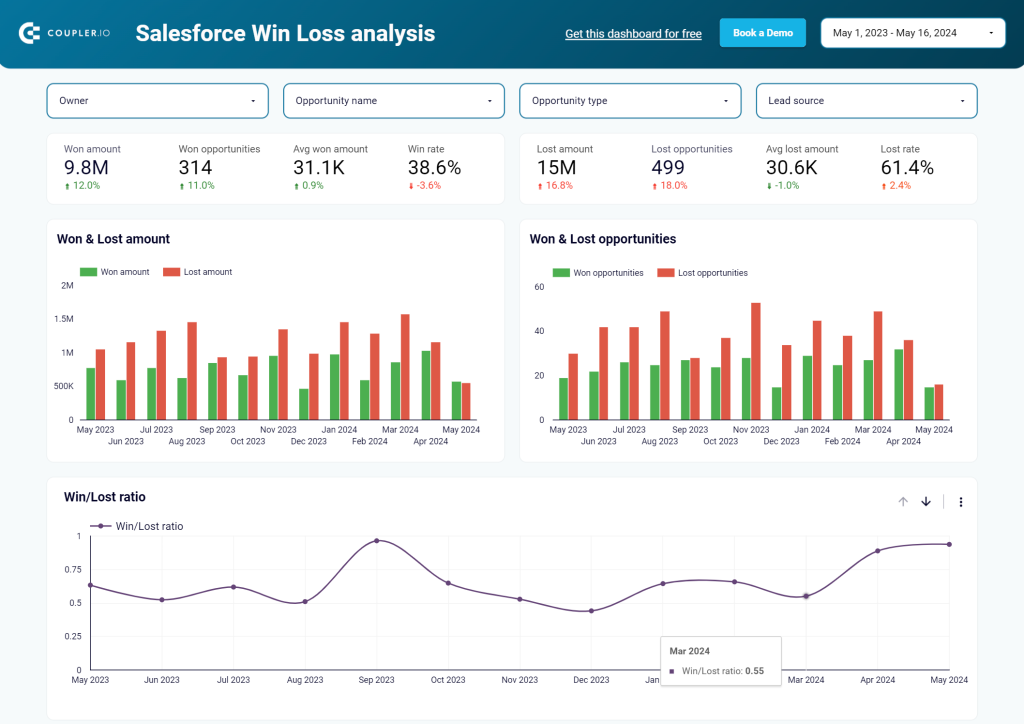
With this dashboard, you can:
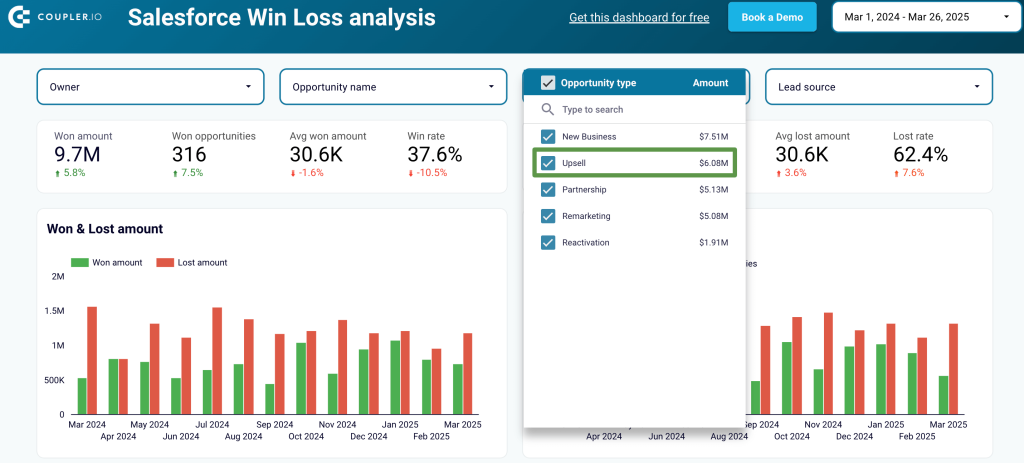
- Check different types of opportunities to understand their effectiveness. For example, if your team focuses heavily on upsells, you can explore data by upsell deals to see if they generate the expected revenue.

- Analyze all won and lost deals segmented by categories such as industry, owner, lead source, country, and more. Identify the best-performing segments to focus on specific deal types. Plus, identify underperforming segments to find opportunities to reduce efforts in those areas.

This dashboard template is created in Looker Studio. Simply follow the instructions in the Readme tab to get started for free.
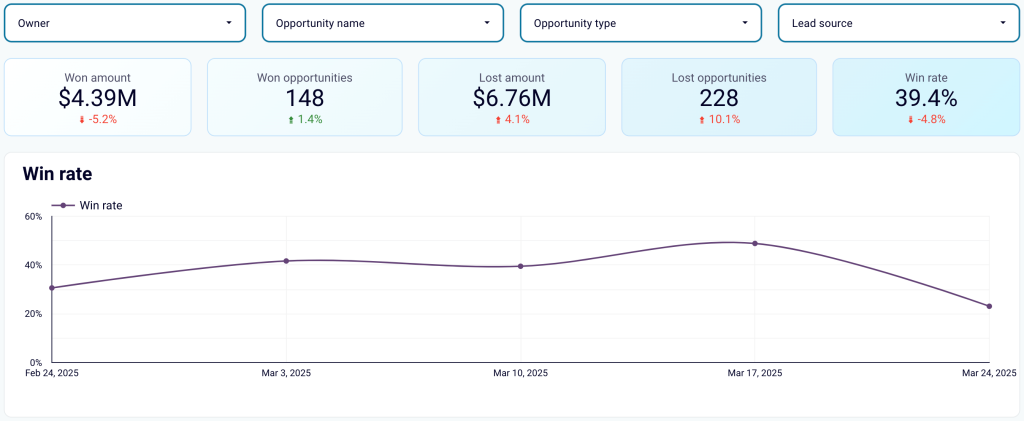
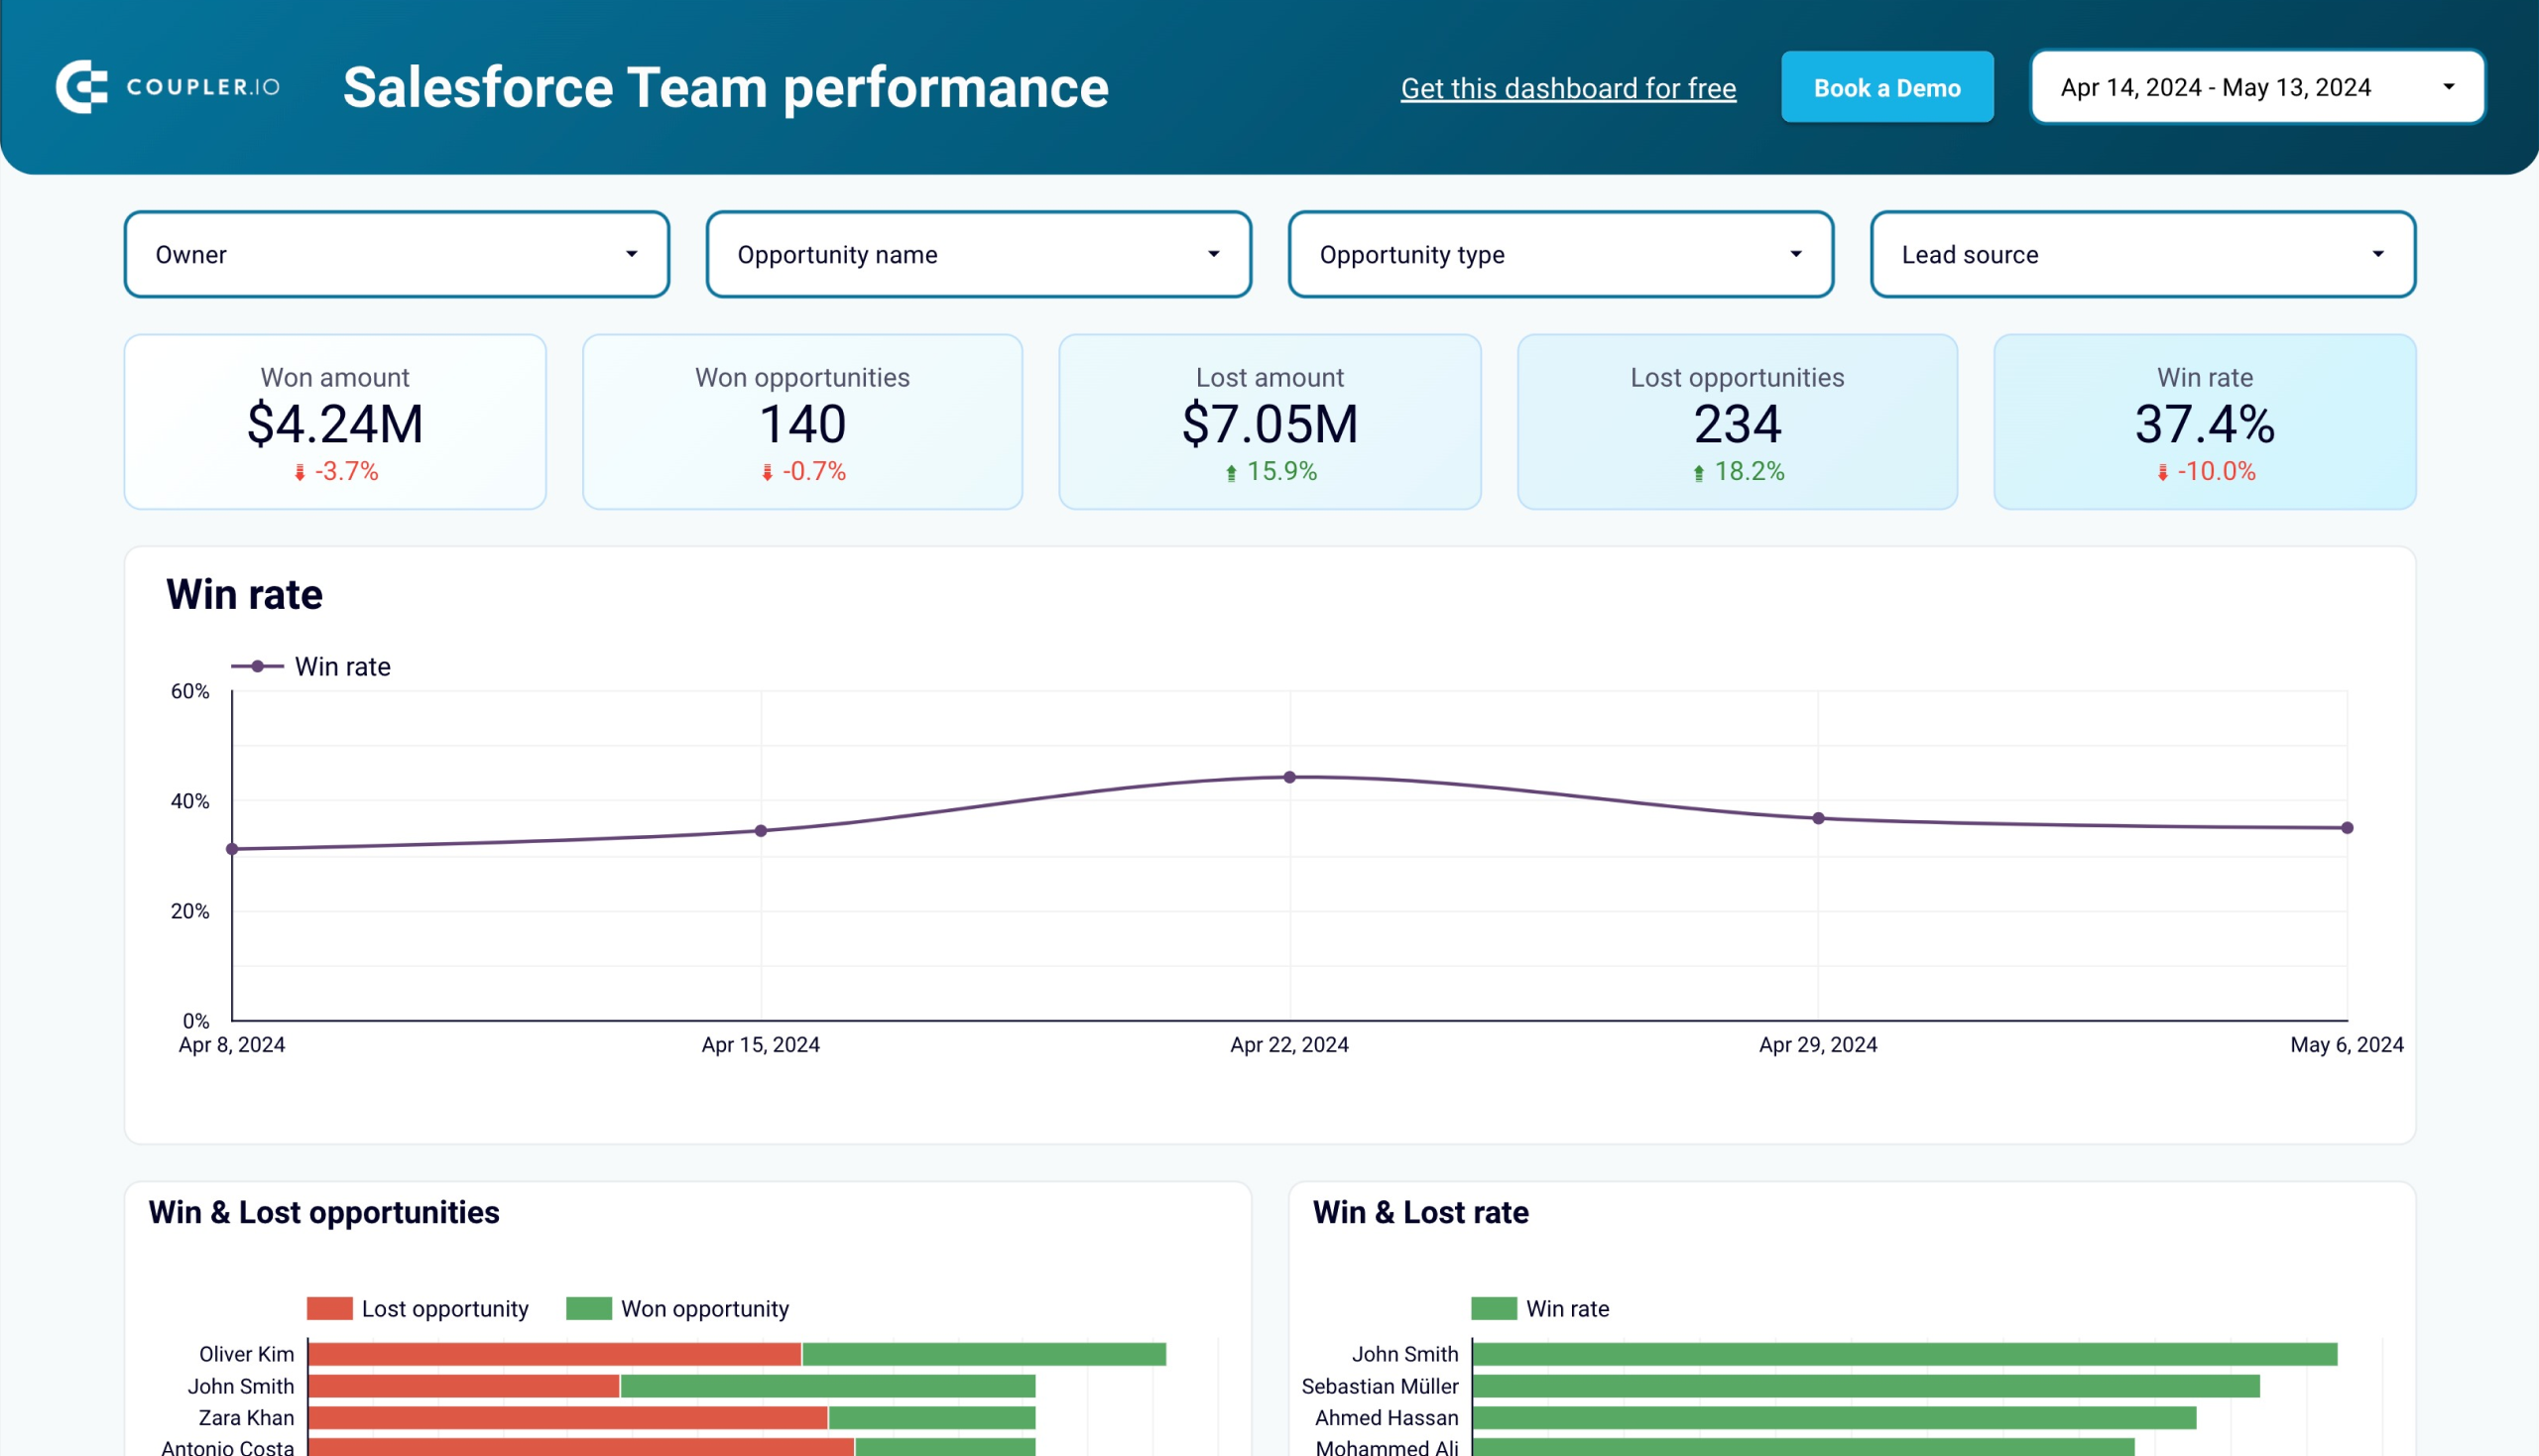
Sales team performance dashboard
This dashboard is designed to provide an overview of each sales team member’s performance. It works best for teams with at least two sales managers.

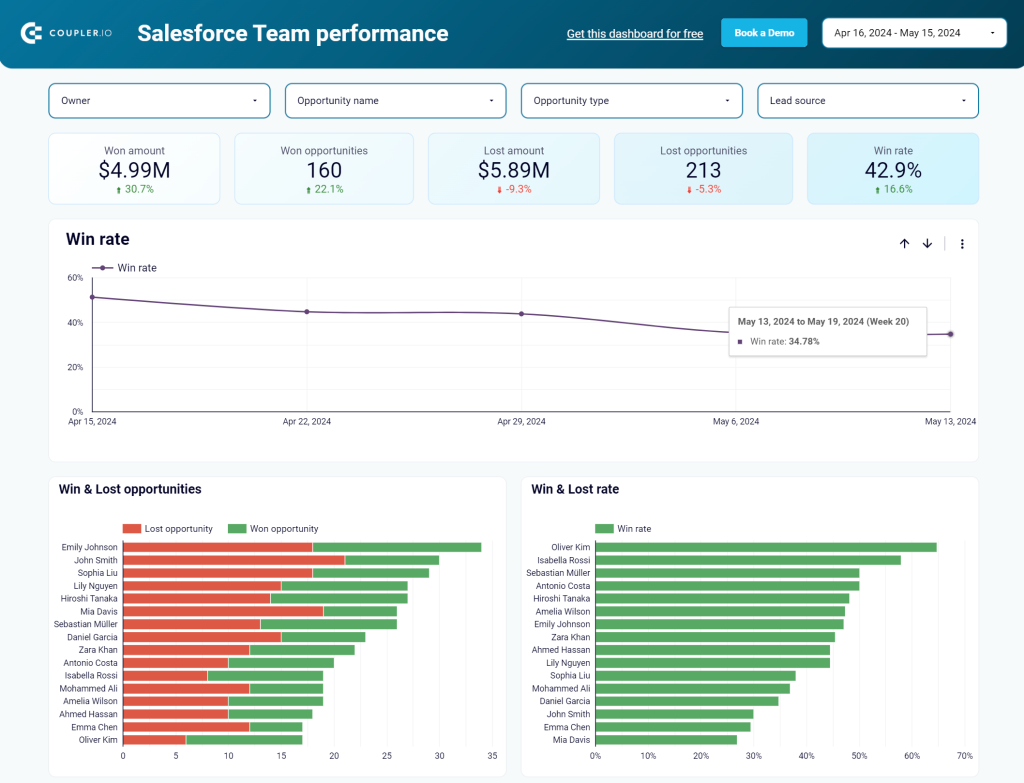
What you can accomplish with this dashboard:
- Make informed decisions on allocating team members, rather than relying on gut feelings, do the following:
- View specific team members’ performance metrics and the types of deals they handle, segmented by geography, stage, and lead source. Understand the deal types to explain performance variations.
- Explore deals by type to identify which team member is most frequently responsible for each deal type.

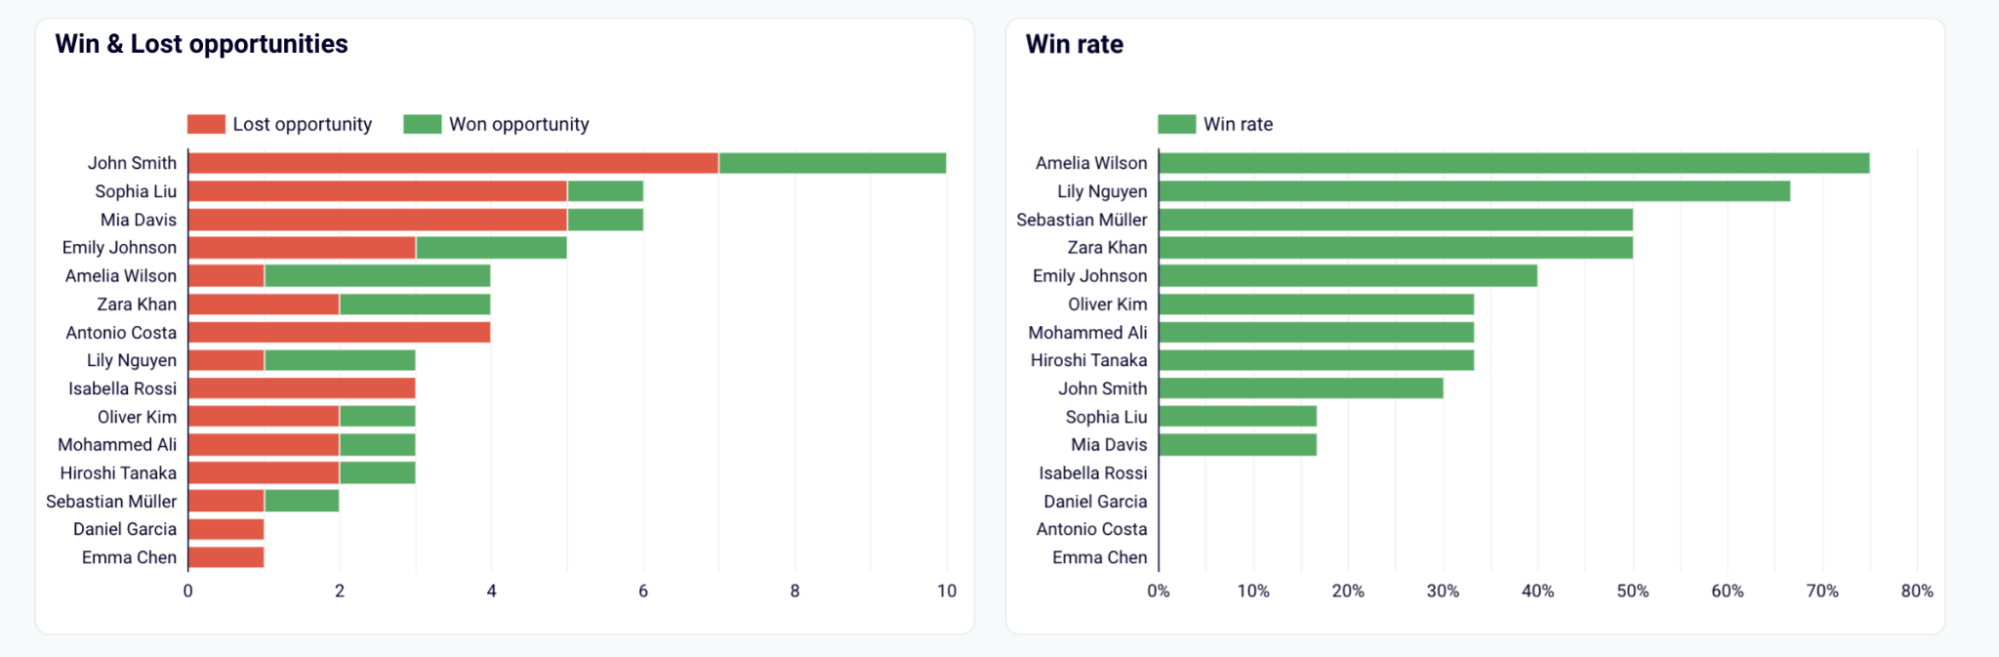
- Compare the win and loss rates of all your team members to quickly identify the best and worst performers.
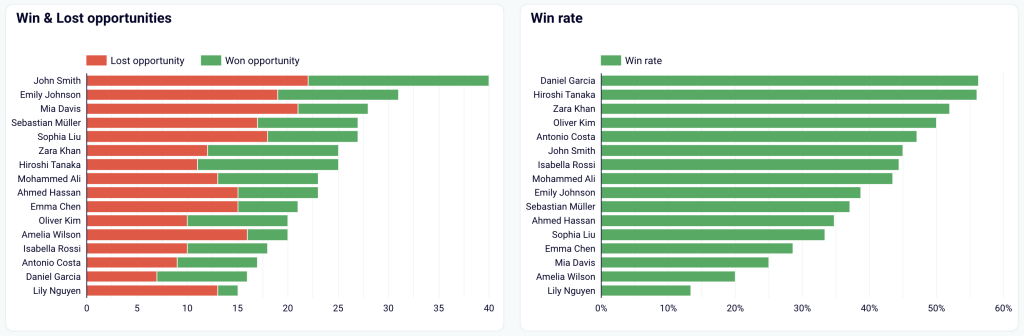
- Base this comparison on the number of deals or revenue generated, as different team members may handle varying deal types. To maximize profits, assign your top sales managers to the deals with the highest potential revenue.
- Collate the types of closed deals per sales manager. This helps you understand each manager’s strengths. For example, if one manager closes most partnership deals, it might make sense to reallocate similar opportunities to them from their peers. The comparison is available by deal type and revenue size.

- Check how each sales manager’s funnel looks at different sales stages.
- Identify the top-performing sales managers based on key metrics, such as won revenue, won opportunities, win rate, and more.
You can set up this dashboard in Looker Studio or Google Sheets. To begin, follow the instructions in the Readme tab to have your data visualized in the dashboard.
Sales team performance dashboard for Salesforce in Looker Studio
Get insights into your sales team’s effectiveness in converting opportunities within your sales pipeline in Salesforce.

Sales team performance dashboard for Salesforce in Google Sheets
Monitor the effectiveness of your sales team and derive insights into how to optimize your sales pipeline conversions in Salesforce.
How to export Salesforce report to Excel natively
We’ll check out the flow separately for each Salesforce UI version.
Note: To export reports from Salesforce, a user must have Export Reports permission.
Export Salesforce report to Excel in Lightning Experience
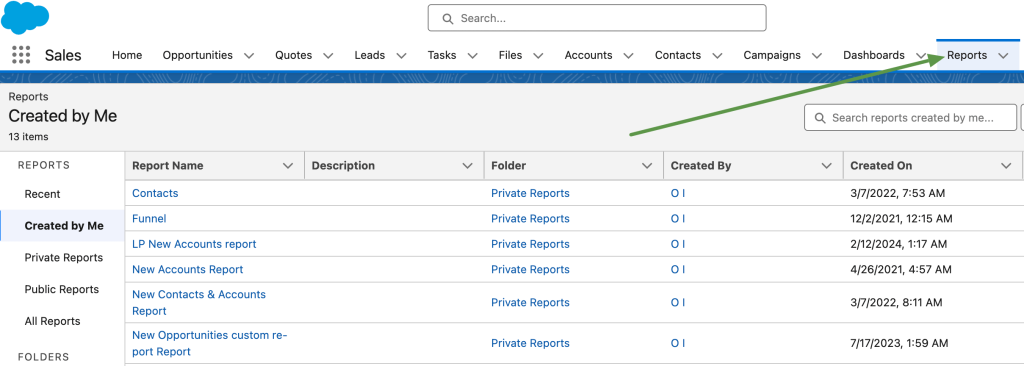
- Go to the Reports tab and open the report you want to export.

- Click the Edit drop-down menu on the right side of your Salesforce report and select Export.

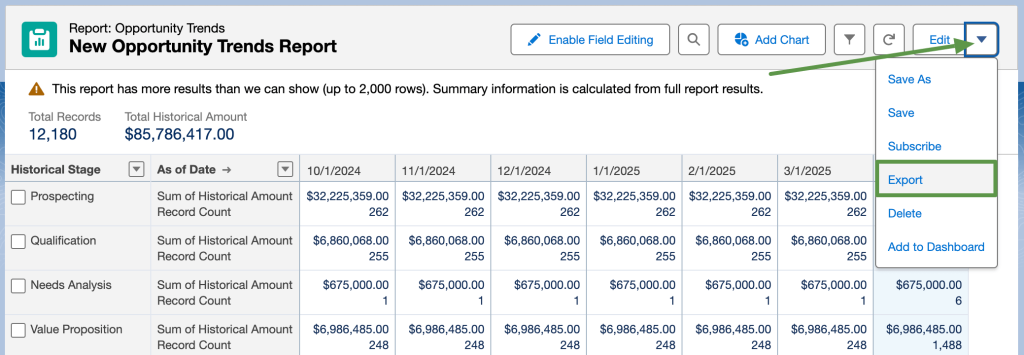
- Select the format to export Salesforce report to Excel
- Formatted Report is available for export only as an XLSX Excel file
- Details Only is available for export as XLSX or XLS file, as well as CSV

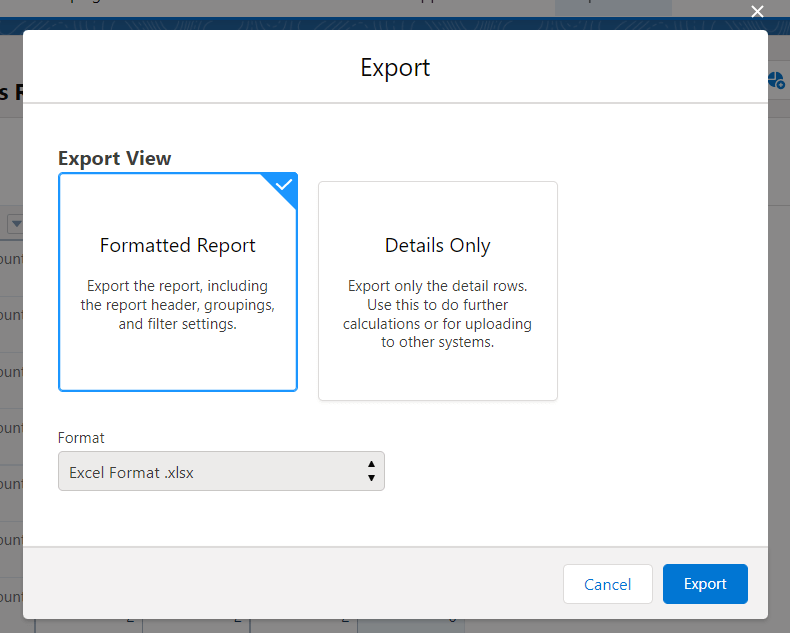
- Click Export – the file with your Salesforce report will be downloaded to your device.
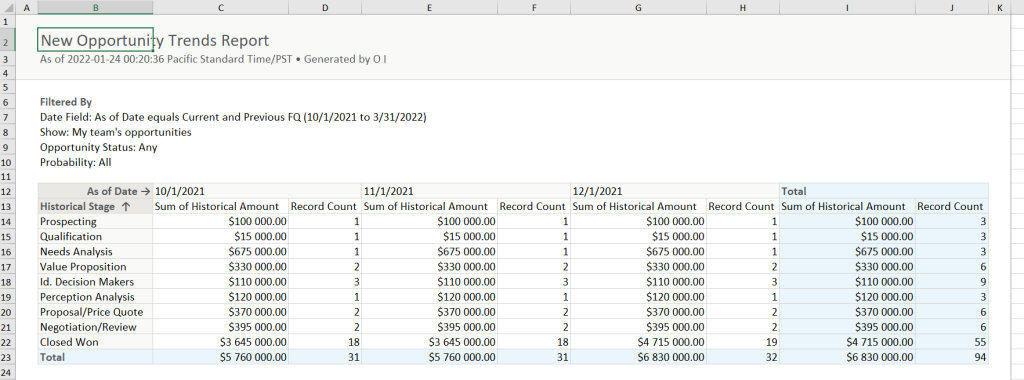
Here is an example of a New Opportunity Trends Report exported as a Formatted Report from Salesforce Lightning Experience:

Salesforce report export in Salesforce Classic
- Go to the Reports tab and open the report you want to export.

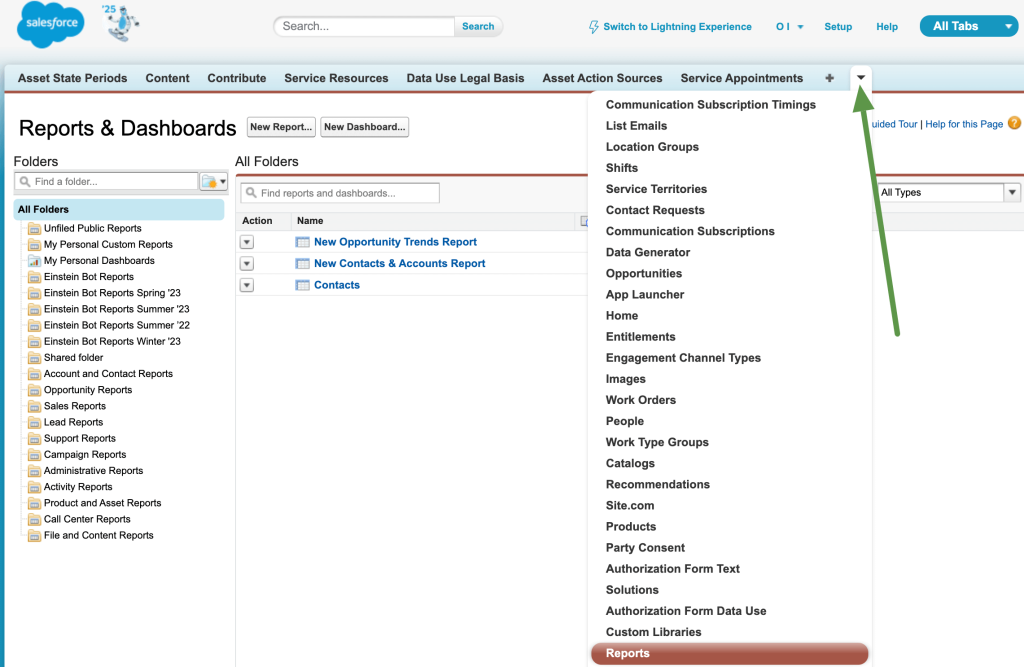
In Salesforce Classic, reports do not have an Export button with exporting formats. You can choose them right away with the following buttons:
- Printable View – to export the formatted report in XLS format
- Export Details – to export the report’s data in XLS or CSV

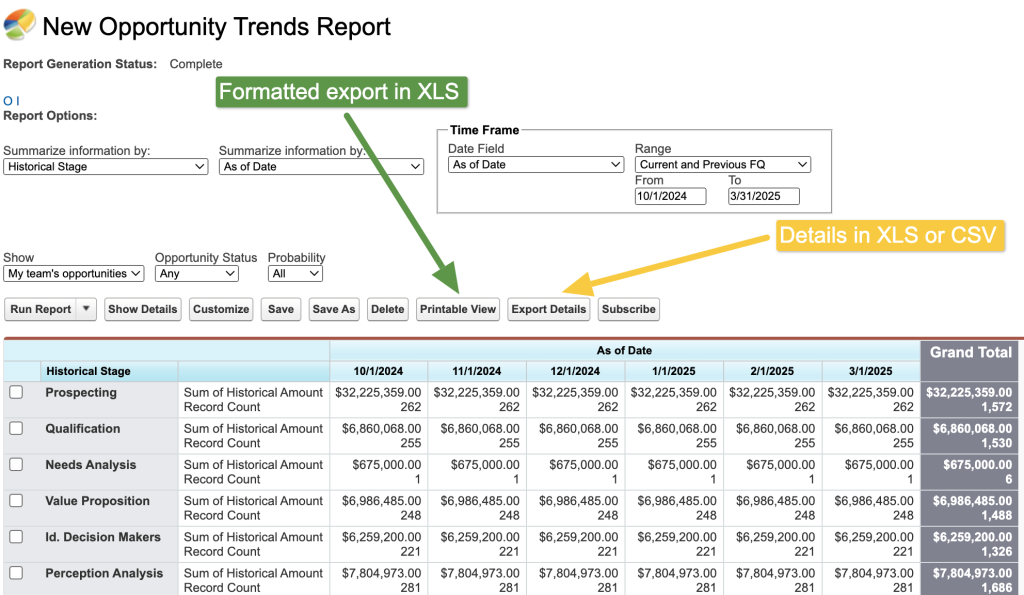
For example, here is what a New Opportunity Trends Report looks like if exported as Printable View from Salesforce Classic:

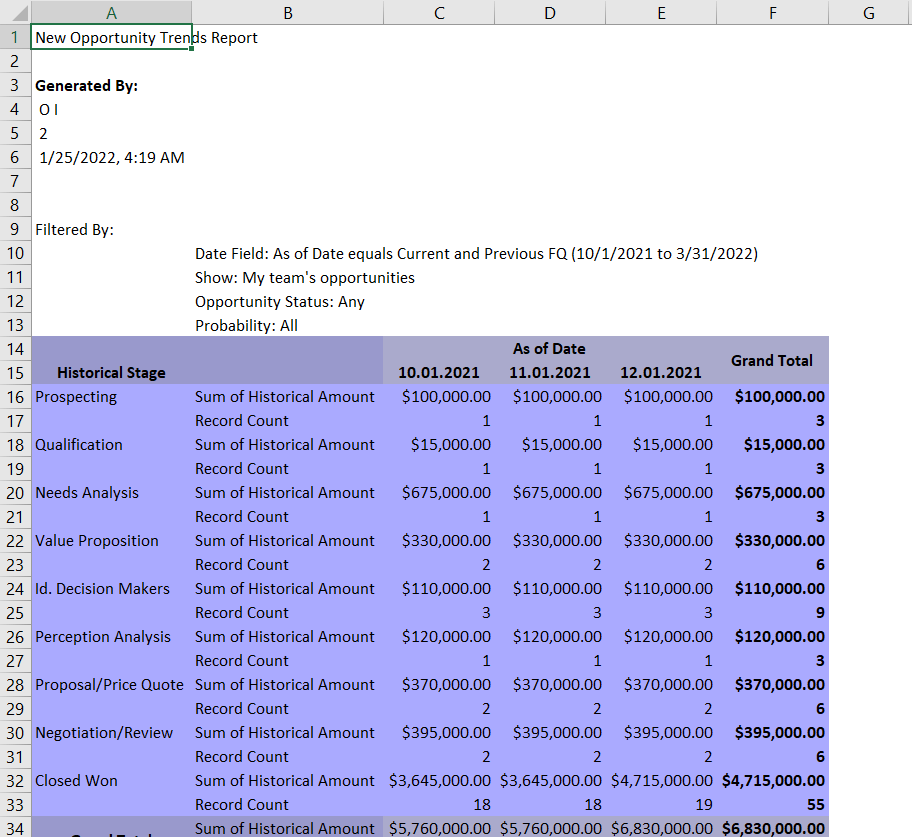
The difference between Formatted Report (Lightning Experience) and Printable View (Salesforce Classic) is obvious.
At the same time, there is no difference if you export report details from both Salesforce UI versions:


This is how you can export a Salesforce report to Excel. Also, check out the restrictions associated with this action.
Salesforce reports for Excel export limitations
- Up to 5 reports at once.
- An unlimited number of rows and columns for Details Only reports in XLS or CSV formats.
- When exporting a report in Lightning Experience using the Formatted Report option, you can pull up to 2,000 rows and 100 columns.
- Up to 100,000 rows and 100 columns for Details Only in XLSX format.
- Historical trending reports are not available for export.
- Joined reports can include a maximum of 2,000 rows and are available for export only as a Formatted Report..
Can I auto-export Salesforce report to Excel?
Unfortunately, Salesforce does not allow you to export Salesforce reports to Excel on a schedule. This is rather frustrating because automation would allow you to save much of the time for your reporting tasks.
However, you can always go with Coupler.io, which allows you to set up automation for your Salesforce reports.
Link Salesforce report to Excel using the Salesforce API
The last option on our list of solutions for exporting Salesforce reports to Excel is the Salesforce REST API. We’ve covered this in more detail in our article on Salesforce data export. To do this, you’ll need to complete the following steps:
- Create a Connected App in Salesforce
- Get an access token
With an access token, you can send a GET request to the following API URL:
curl "{instance-URL}/services/data/{api_version}/analytics/reports/{report-ID} \
  -H "Authorization: Bearer {access_token}"
where:
{instance-URL}is the instance URL, which you obtained along with the access token, for example,
https://zrecords-dev-ed.my.salesforce.com
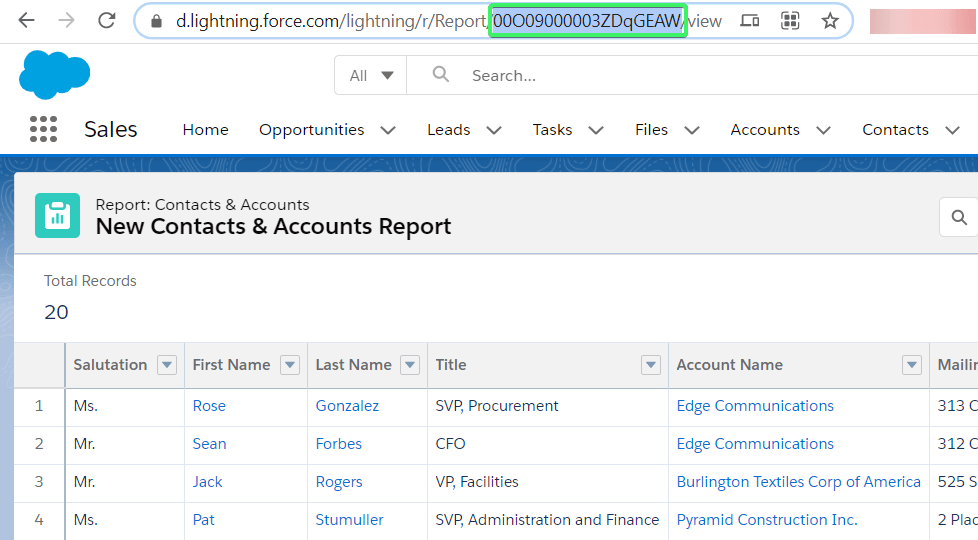
{api_version}is the version of the Salesforce API{access_token}is your access token{report-ID}is the ID of your Salesforce report. You can learn the report ID by opening the report and checking the URL bar.

This step is more technical since it requires you to work with the Salesforce API documentation, as well as write a script to extract data and map it into your Excel file.
Alternatively, you can learn how to connect API to Excel without coding.
Do you need the no-code integration to export Salesforce reports to Excel?
For Salesforce reporting in Excel, you need to pull records from the CRM and load them into a worksheet. There’s no automated native integration to connect Salesforce to Excel. Manual data export, which may initially seem like a solution, will be time-consuming, especially when required frequently. Plus, every update in the sheet must be done by hand to keep up with Salesforce’s ever-changing data.
If you try to work around this by exporting data from the Salesforce API, coding skills will be necessary. Without them, you’ll need to rely on data analysts or developers, who may not always be available.
To avoid these pitfalls, automate reporting with a no-code Salesforce-to-Excel integration by Coupler.io. It will only take a few minutes to create a custom report from extracted Salesforce data and bring it to Excel with scheduled data refreshes.
Use Coupler.io to connect your Salesforce data to Excel and watch your reporting run on its own!
Automate Salesforce data exports for custom reporting with Coupler.io
Get started for free