Often, you can have related datasets scattered across different apps that need to be analyzed in Power BI. Rather than create a separate dashboard for each source, you can consolidate data for a more holistic analysis. In this article, we’ll discuss the different options to merge queries in Power BI and how you can configure them.
Ways to merge queries in Power BI
Power Query Editor
In Microsoft Power BI, the native data connection and transformation engine enables users to retrieve data from supported sources and manage queries. To merge related tables, you can utilize the Merge Queries function, select columns, and specify the join type. The process of merging data in the Power Query editor is straightforward. However, it’s important to note that the merged dataset remains static, requiring the process to be repeated each time new data is available.
Coupler.io
To merge data from cloud sources and automatically send data into Power BI, you should consider Coupler.io. It’s a reporting automation platform that connects over 60+ sources such as LinkedIn Ads, QuickBooks, Shopify, and others. You can join or append data from multiple sources, transform it, and automate data refresh in Power BI on a schedule. Coupler.io lets you collect data from cloud sources that aren’t accessible in Power BI. Additionally, it supports other data destinations including spreadsheets (Google Sheets, Microsoft Excel), BI tools (Looker Studio, Tableau), and data warehouses (BigQuery, RedShift).
How to merge queries in Power BI with Coupler.io ?
To merge data, you need to connect two or more sources that contain related tables. Choose the initial data source in the form below and click Proceed.

If you’re a new user, you need to sign up for a free Coupler.io account (No credit card is required).
1. Collect data
Next, you’ll be redirected to the importer where you’ll configure the source.
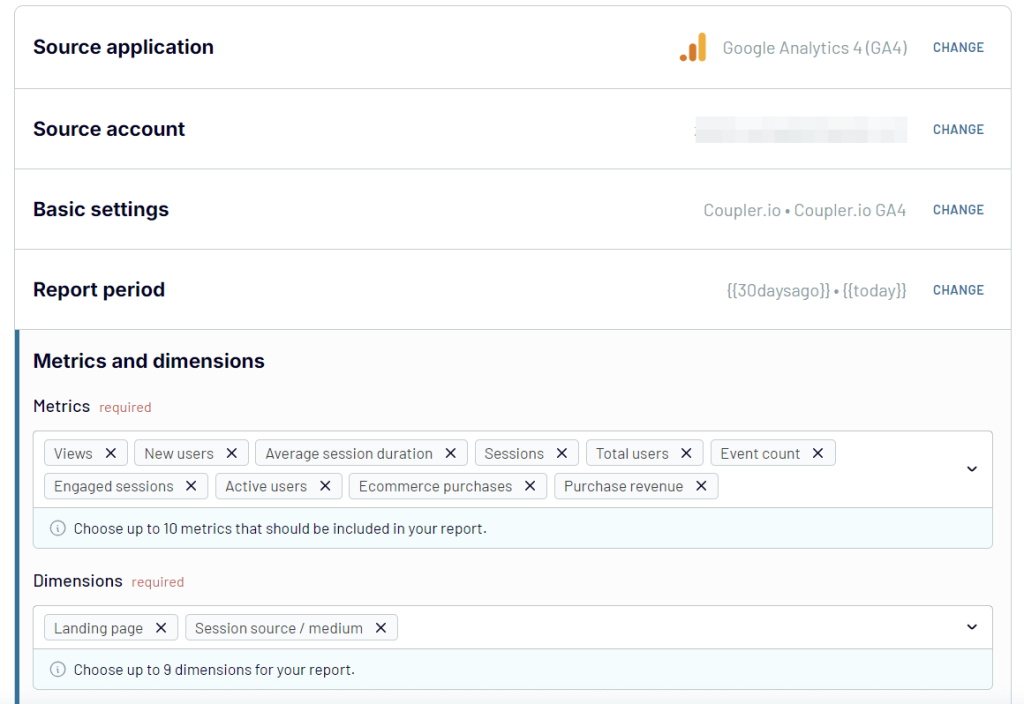
Depending on the app you’re getting data from, you’ll authorize access to your account, select the reporting period, and pick any parameters or metrics required in your report. For example, here is what it looks like for Google Analytics 4:

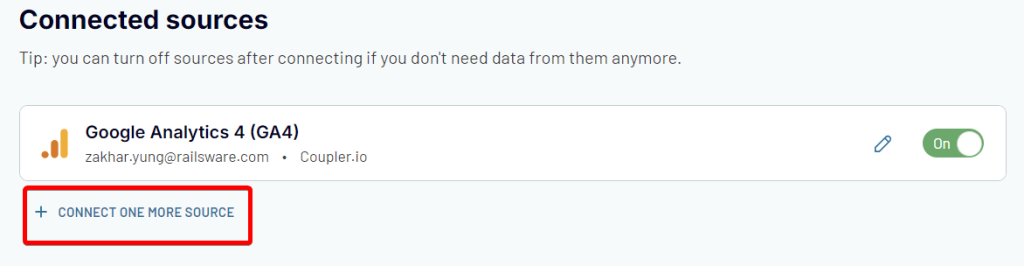
Proceed to the next step where you can connect one or more data sources.

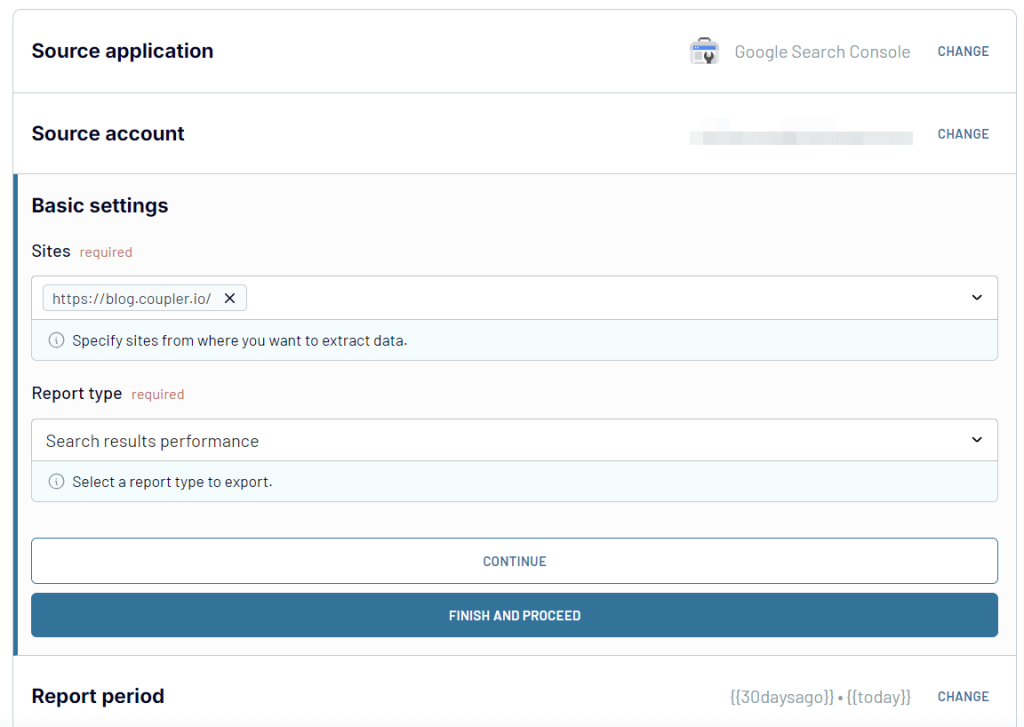
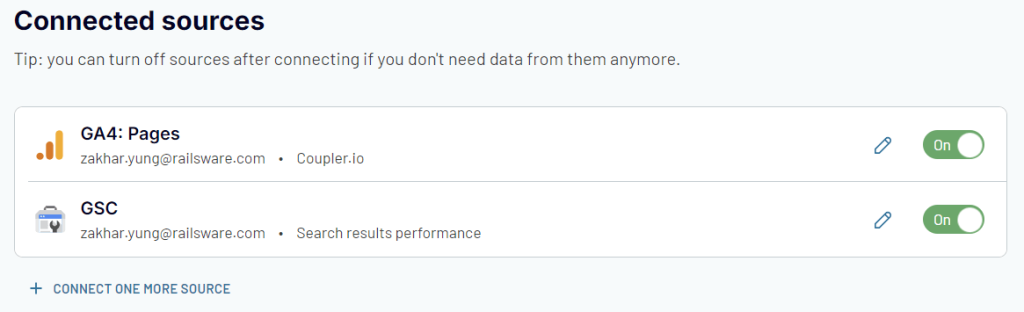
You’ll need to connect it following the in-app instructions. For example, we’ve connected Google Search Console for our report, and here is what its connection looks like:

Once you’ve connected your data sources, proceed to the Transformations step.

2. Transform data
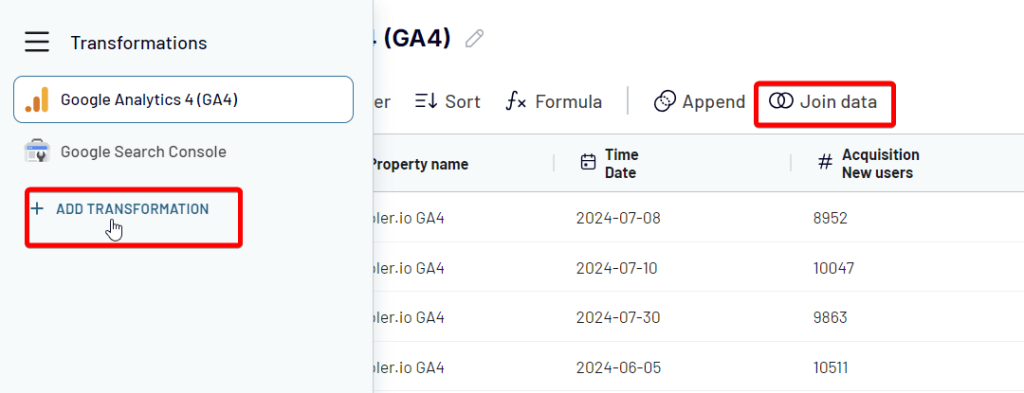
This step is where you can merge your queries and transform data before loading to Power BI. To merge data from your sources, you can use the Join data tab or click the Add Transformation button and select Create join.

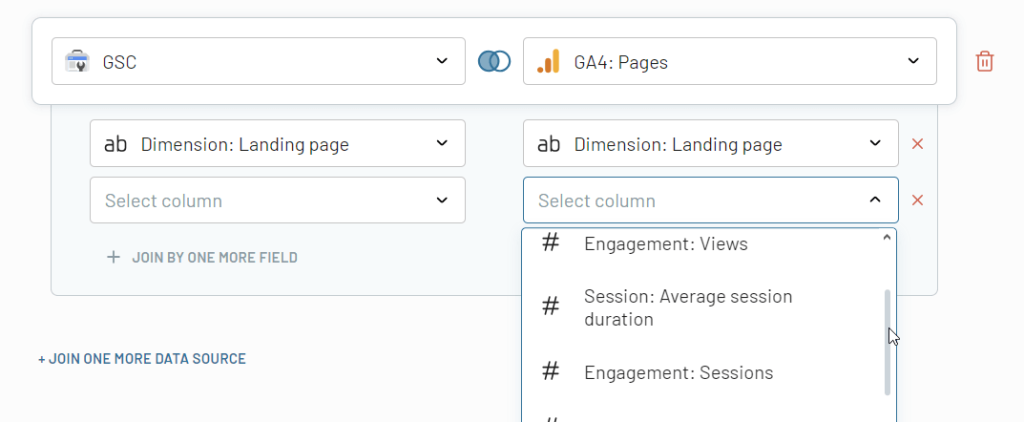
Next, you’ll select one or multiple related columns to merge together.

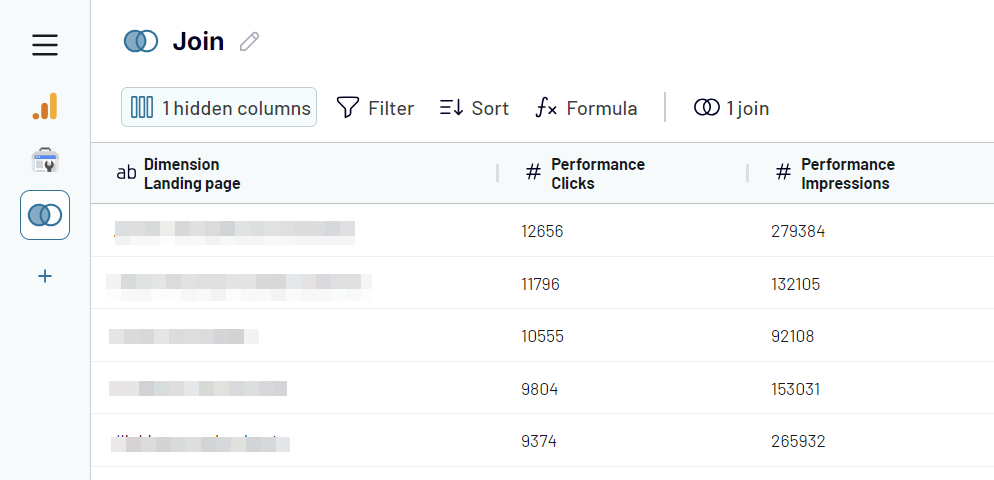
You can preview, organize and transform the merged tables with features such as:
- Hide columns that aren’t necessary.
- Filter data to focus on relevant columns.
- Sort data to arrange the columns within your dataset.
- Use formulas to calculate new columns.

Once you’re done, you can proceed to load your merged queries to Power BI.
3. Load data and schedule refresh
Choose the merged dataset, generate the integration URL, and run the importer.
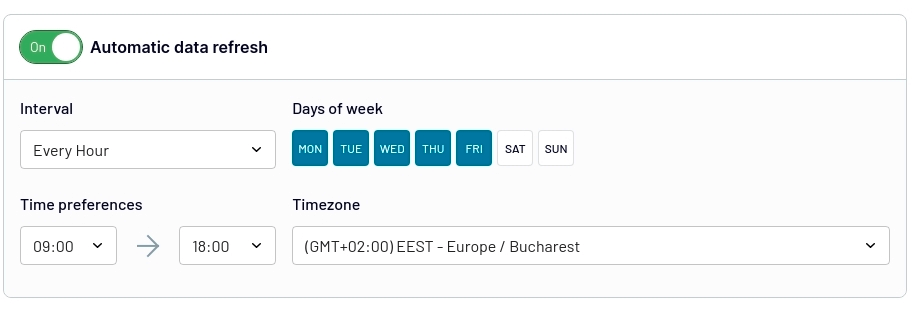
You can automate data refresh right away. Toggle on Automatic data refresh and configure the schedule.

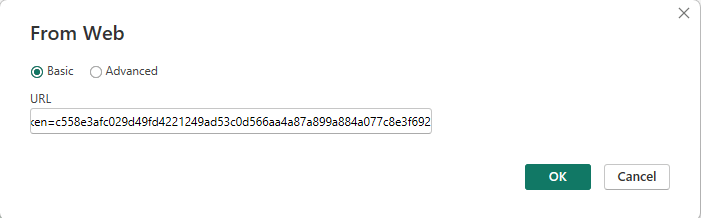
Go to Power BI Desktop, click Get Data, select Web and paste your integration link.

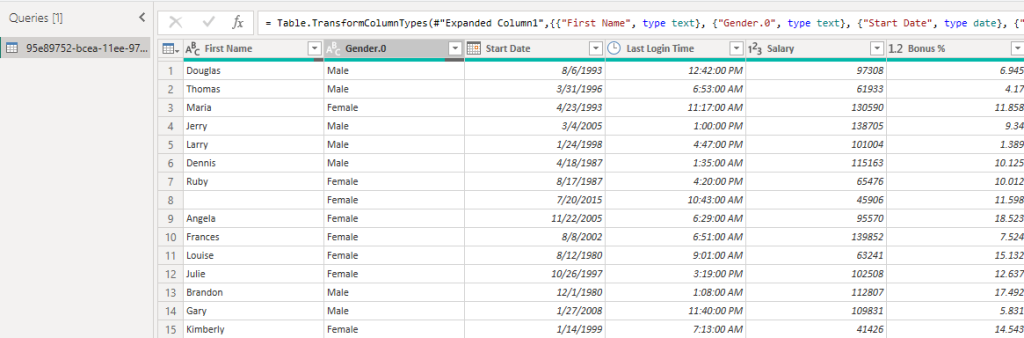
If successful, you can preview the merged dataset in Power Query Editor. Next, you have to load data so you can use it to create reports in Power BI.

Now, you can use Coupler.io to merge tables from different sources and get real-time updates in your destination. It helps to refresh your Power BI reports efficiently.
Modes to merge data in Coupler.io
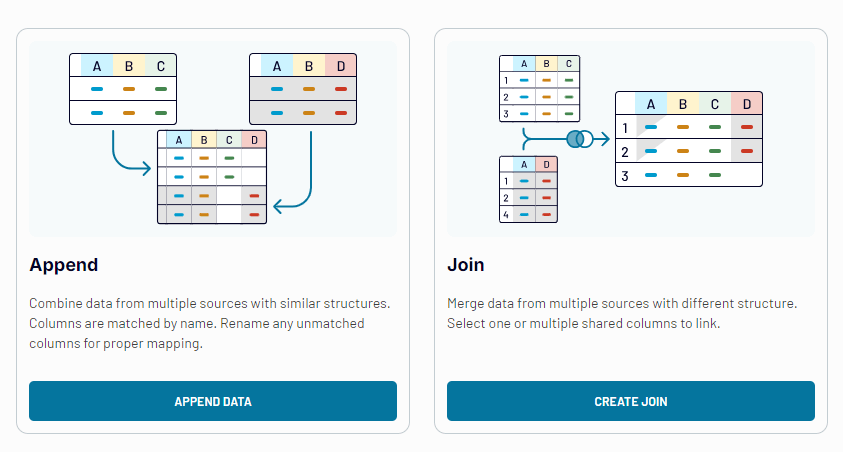
There are two modes for merging queries in Coupler.io:
Join
Data Join refers to the process of joining two or more sources using Left Join (A term used in SQL). This simply means that all rows from the left query are included, but only matching rows from the right query are added to the merged dataset.
Append
Data Append is the process of merging values for the same data attribute from two or more datasets and adding them to the same column(s) in the destination file.

How to use merge queries in Power BI with Power Query Editor?
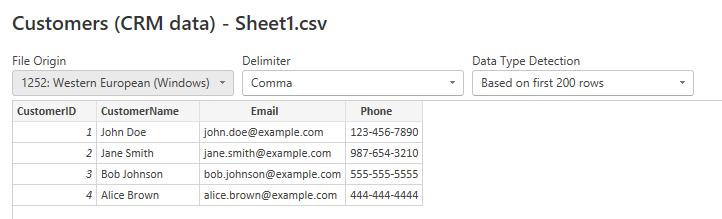
To demonstrate how you can use Power Query in Power BI to merge queries, we’ll use two CSV tables – customers (CRM data) and orders (Ecommerce data).
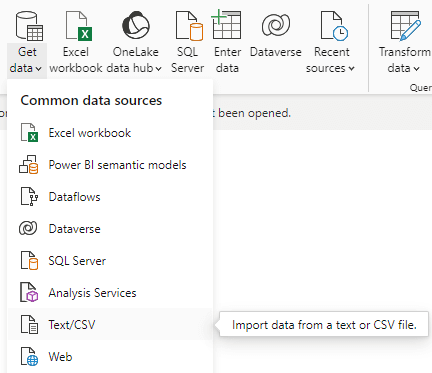
Open Power BI Desktop, click Get data, choose Text/CSV, and upload the first table.

It will show a preview of your data.
Click the transform data button to open the Power Query Editor.

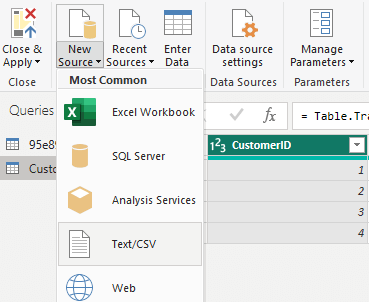
To add a new source, click on New Source, select Text/CSV and load the second table.

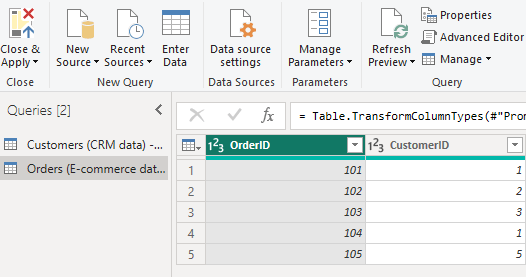
It will show a preview of the second CSV file. Simply click OK to continue.
On the left side of Power Query Editor, you can see a list of all the imported tables.

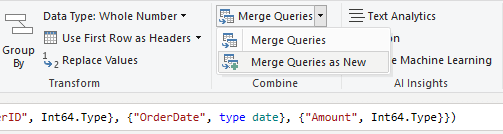
On the home tab, click on Merge Queries and select Merge Queries as New to add a new table to your data model. Ensure that the column names and data types match.

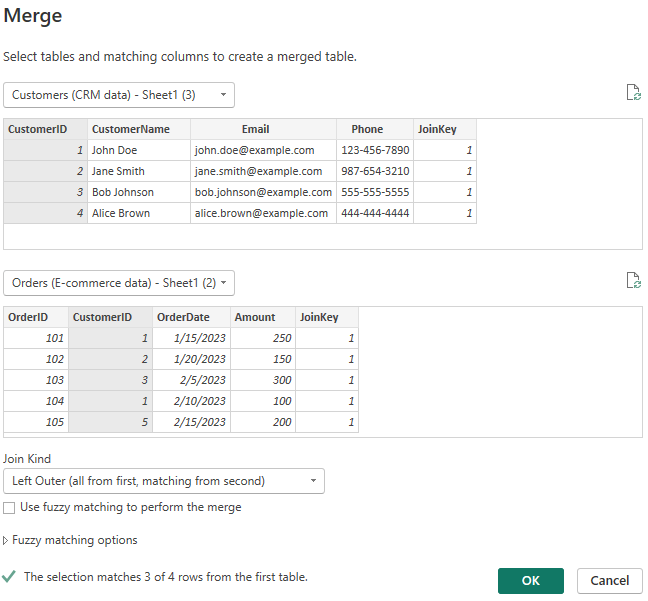
In the merge dialog box, you’ll choose the tables and select the unique identifier column that’s present in both tables e.g.CustomerID. Next, select Left Outer join and click OK.

It will create a new table that contains the merged queries. You can click the expand button beside the column header to select the secondary columns to include. It also allows you to choose whether you want to use the original column name as a prefix.

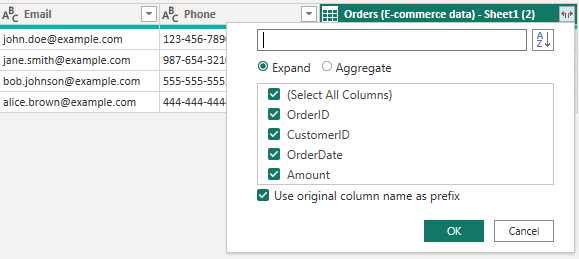
Click OK to expand the columns.

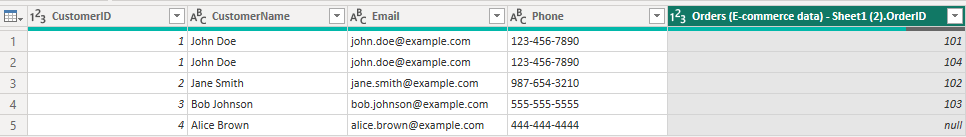
On the right side of Power Query Editor, you can find the Query Settings. It allows you to rename your queries and also switch between the different query levels easily.
Join kinds in Power Query Editor
A join kind is an SQL term used to describe the type of merge operation that’s being performed between two or more tables. Let’s look at the different types of joins that are available.
For clarity, the left table is the query you select before you click Merge Queries. You can change it using the first dropdown. You’ll pick the right table using the second dropdown. Here, we’ll use Sales as the left table and Countries as the right table.
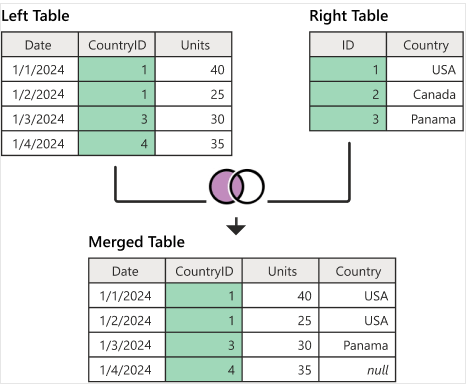
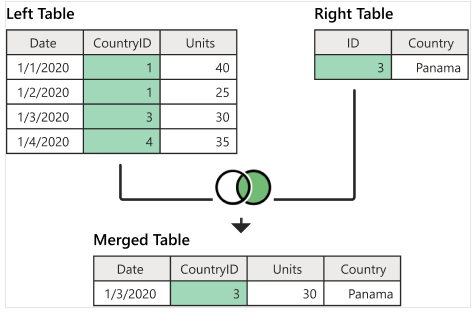
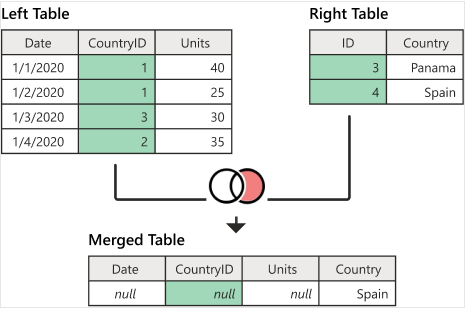
Left outer join: It combines all rows from the left table with only matching rows from the right table. E.g. matching sales records to each country.

Right outer join: It joins all rows from the right table with only matching rows from the left table.

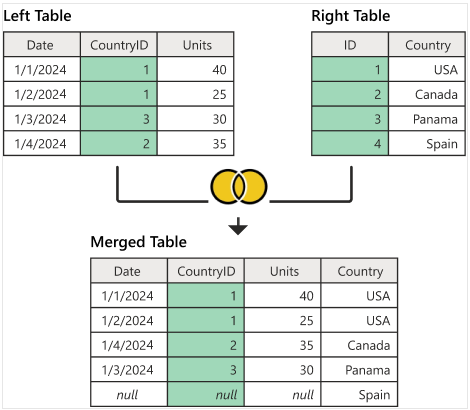
Full outer join: It merges all rows from both tables

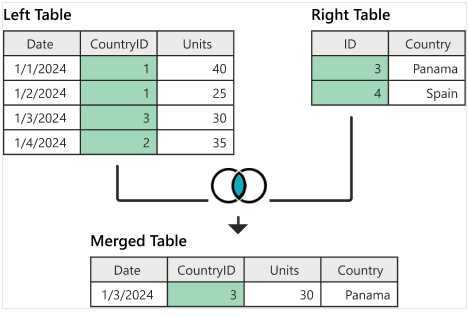
Inner join: It joins matching rows from both tables.

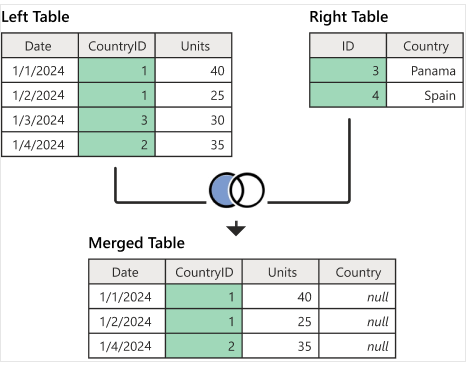
Left anti join: It includes rows from the left table that have no matching rows in the right table.

Right anti join: It returns rows from the right table that have no matching rows in the left table.

How to use fuzzy merge?
The fuzzy matching algorithm compares and discovers the similarity between two sets of data that aren’t exactly the same. You can use it to merge columns from tables that don’t match but are close enough to be considered a match. It only works with text columns and allows you to deal with typos, incorrect spelling, etc. Select similar identifier columns and check the “Use fuzzy matching to perform the merge” box.
Note that only the Left outer join and inner join can be used with fuzzy merge.
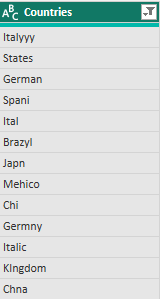
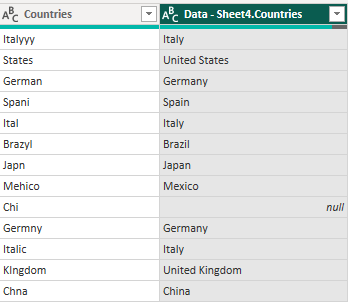
Here’s an example that merges two variations of country names:
These are country names with typos, bad spelling, and different variations. Let’s use it to see how the fuzzy merge can detect the original spellings and make them a match.

Here’s the reference table that contains the correct spellings of each country. We’ll allow the fuzzy matching algorithm to compare both columns and decide if there’s a match.

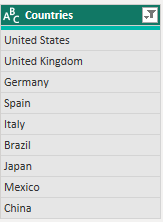
Our goal is to merge the incorrect column with the correct version of it.
First, we’ll initiate a merge operation using the left outer join. The left table should be the incorrect dataset and the reference table will be the right table. We’ll select both columns and also check the “Use fuzzy matching to perform the merge” box.

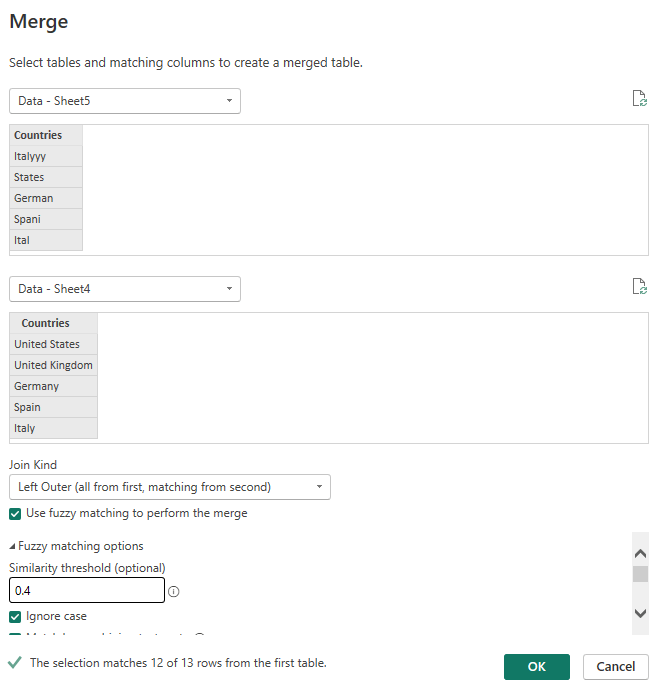
If you notice the selection matches only a small number of rows, then you can click to show the fuzzy matching options. For instance, It allows you to adjust the similarity threshold. A threshold of 0.4 can match strings that have a similarity score of 40% or higher.
Lastly, you should expand the merged table to display the result. The left column shows our incorrect data, while the right table shows the correct spelling of each country.

Fuzzy matching options
- Similarity threshold (optional) – Matches rows above a certain similarity score. You can set it to any value between 0.00 and 1.00 (no match to exact match). By default, the value is 0.80 so you’ll need to adjust to match more rows.
- Ignore case – Helps to ignore the cases when matching.
- Match by combining text parts – Combines text parts to find a match e.g. Jan uary will be matched with January if the option is enabled.
- Maximum number of matches (optional) – Specify the maximum number of matching rows that can be returned for each input row. e.g. For one matching row per input, enter the value 1.
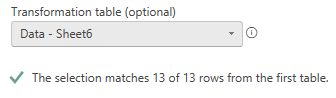
- Transformation table (optional) – Uses a transformation table that contains a “From and To column” to match values. This allows you to create custom matches for columns that have no similarity.
For example: There’s no matching value for “Chi” above but we can create a separate table and specify the desired match for it.


Then, we’ll repeat the merge settings done earlier and select the newly created transformation table, as shown below. This allows us to match Chi with China.

Here’s the resulting table:

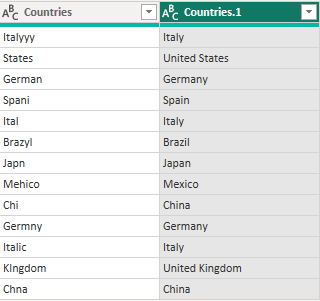
We’ve been able to merge the incorrect spellings with their correct versions.
How to perform a cross join?
A cross join returns the Cartesian product of rows from two tables (i.e. combines each row from the first table with each row from the second table).
In our example, we have two tables – product promotions and sales channels. We want to pair each of them together and analyze each promotion across every sales channel.
The left table:

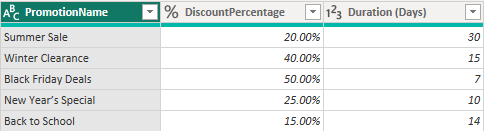
The right table:

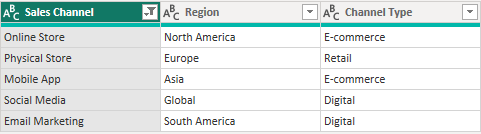
Our goal is to merge each promotion strategy with each sales channel.
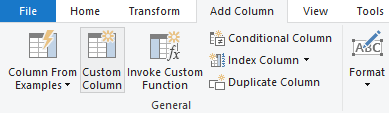
First, we’ll click the left table (Promotions) and go to Add Column > Custom Column.

On the dialog box, you’ll type the name of the right table (e.g., Sales Channels). While typing, you’ll see suggestions for your existing tables. Simply click on the correct one.

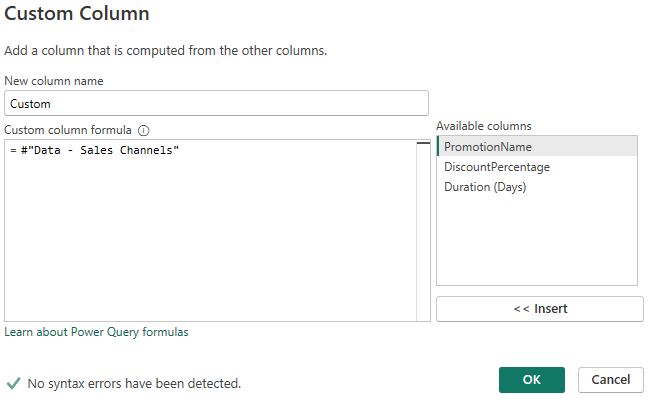
As soon as you click OK, your tables will be merged. Then, you’ll expand the table to display all the merged rows.

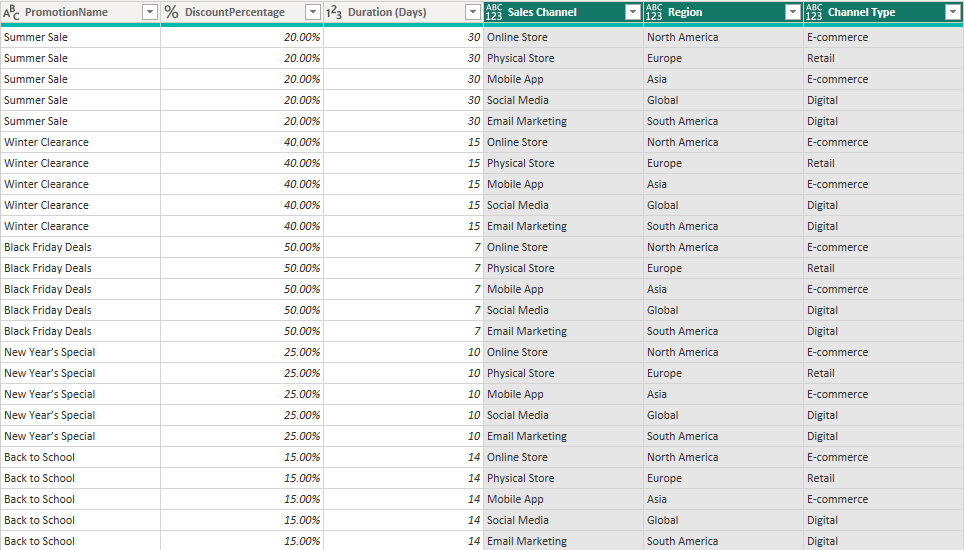
We’ve combined every promotion with each sales channel and region.
Power BI merge queries vs append queries
Merge Queries in Power BI allow you to combine two or more tables into a single table. It often uses a unique identifier column to match values from different datasets. Some possible use cases for merging data include customer and order data, product and sales data, employee and department data, invoice and payment data, etc.
Appending Queries allows you to consolidate values from two or more tables into a single table. This feature enables you to merge datasets with the same structures (columns). Some examples of usage include combining financial data from different quarters, inventory data from various warehouses, and paid advertising data from different platforms.
The merge queries option is possible when there’s a unique identifier key in both tables. While Append queries work for data with similar structures and column values.
Both Power Query Editor and Coupler.io allow users to merge and append data.
The best way to merge queries in Power BI
You can merge queries in Power BI via the Power Query Editor or by using Coupler.io. Each option’s steps require close attention to avoid any mistakes. While the Power Query Editor provides various join kinds for merging data, it’s static and has to be manually updated. However, Coupler.io allows you to connect numerous sources, set up the merge, and create a schedule for near real-time updates. It ensures that there’s always fresh data ready for exploration and analysis in your data destination.
Load and merge data from cloud sources with Coupler.io
Get started for free