When creating a complex report, you may have to combine data from different sources. However, these sources might have different structures, making manual data aggregation time-consuming and error-prone. Thankfully, there are options available to easily merge tables in Power BI.
How you can merge tables in Power BI
1. Merge tables with Power Query Editor
The Power Query Editor is a built-in feature in Power BI that lets you combine tables based on matching columns. It offers a user-friendly interface for selecting different types of joins (such as inner or left outer) and expanding the desired columns from the merged data. This tool allows you to clean, transform, and prepare data for analysis and visualization within a visually intuitive environment.
Power Query Editor is especially useful when you need to perform lookups, bring together related data from multiple sources, or consolidate information for more comprehensive analysis.
2. Merge tables with Coupler.io
Coupler.io is a reporting automation platform that allows you to gather and merge data from cloud sources that are not directly supported by native Power BI connectors. It works with over 60 marketing and business apps, including Facebook Ads, Google Sheets, Google Search Console, Google Analytics, and more. Additionally, Coupler.io offers ready-to-use dashboard templates in Power BI for marketing, web analyzing, accounting, and other reporting needs.
How to merge two tables in Power BI with Coupler.io?
It only takes three steps to load and merge data from cloud sources using Coupler.io. First, select the initial data source from the dropdown menu and click Proceed. Next, continue by creating a free account on Coupler.io.

You can connect the second and subsequent sources later during the setup. Make sure you’ve configured the necessary settings, such as exporting data from your preferred sources, before connecting them.
Step 1: Collect data
For example, we’ll merge two tables from Google Analytics 4 and Google Search Console to create a search performance report with user behavior insights over a specific period. Let’s collect data from them.
1.1 Connect primary source
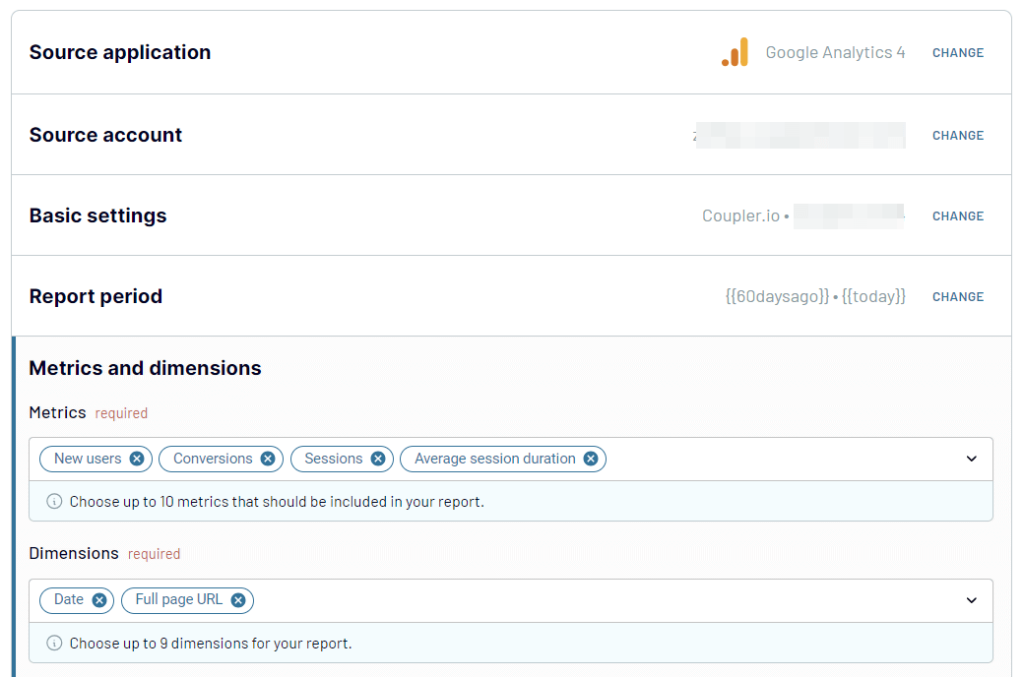
Our primary source is GA4, so we need to connect Google account and configure the connection by selecting metrics and dimensions, start/end dates, etc.

1.2 Connect secondary source(s)
Now, you need to connect the secondary source to collect data and merge it with the primary table data. To do so, click +CONNECT ONE MORE SOURCE.

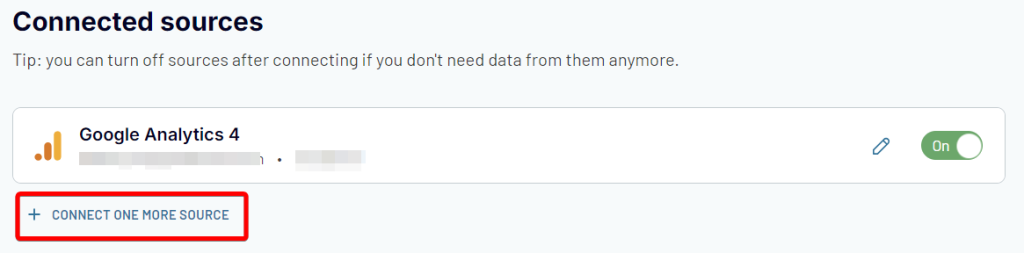
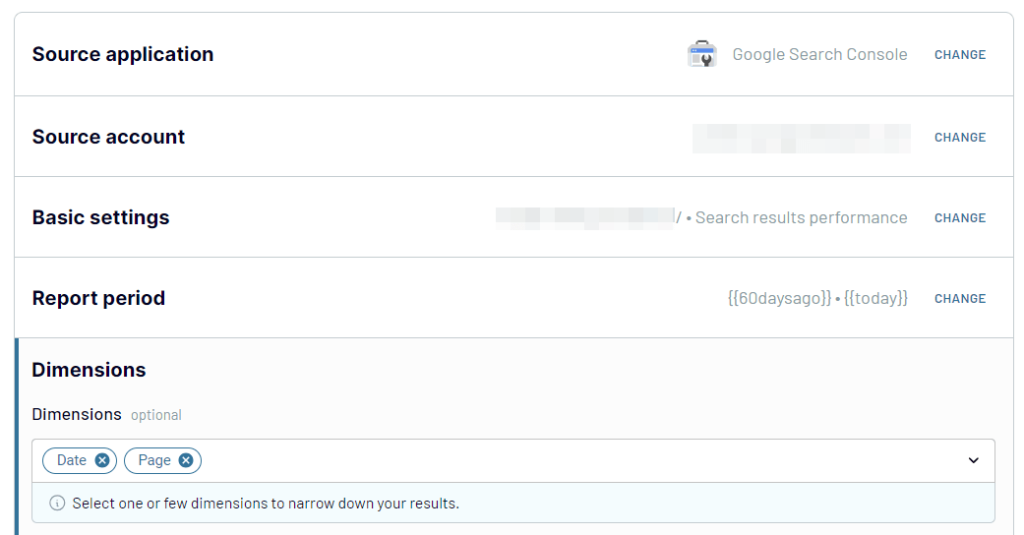
In the dropdown list, select your data source. In our case, this is Google Search Console. Configure the connection following the in-app instructions.

With all the required data collected, proceed to the next step.
Step 2: Merge and transform data
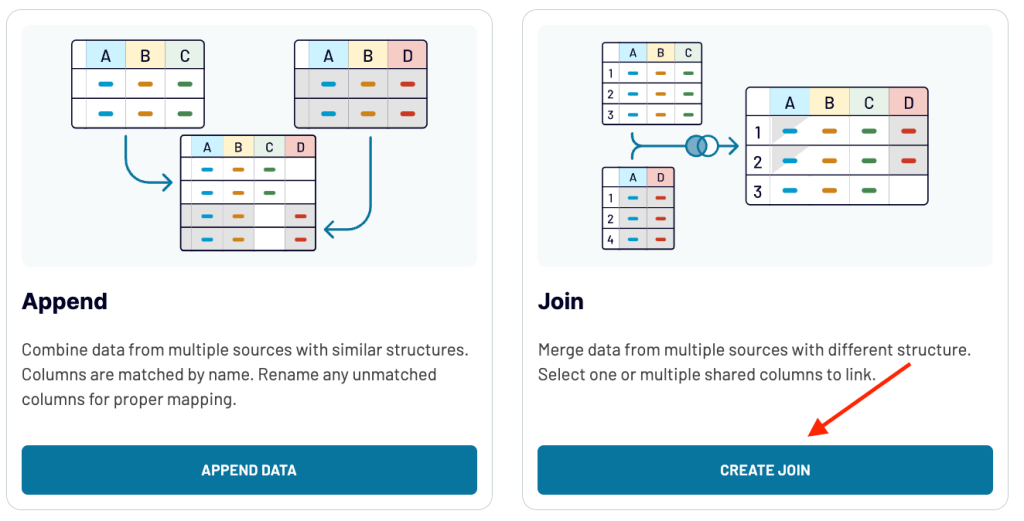
Now, you can aggregate and transform data from the connected sources. Here you’ll see two options: Join and Append. As we want to merge tables, we need to choose the Join option.

Choose the unique identifier column from the primary and secondary sources. For instance, we’ve chosen the Date column from the Google Search Console and the Time: Date column from Google Analytics 4.

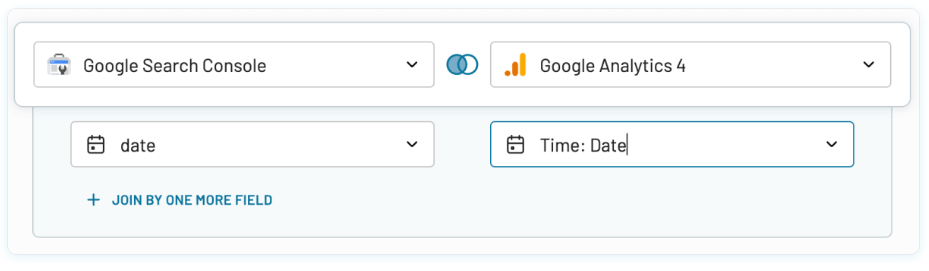
You can also add more identities by cloning on the + JOIN BY ONE MORE FIELD option.
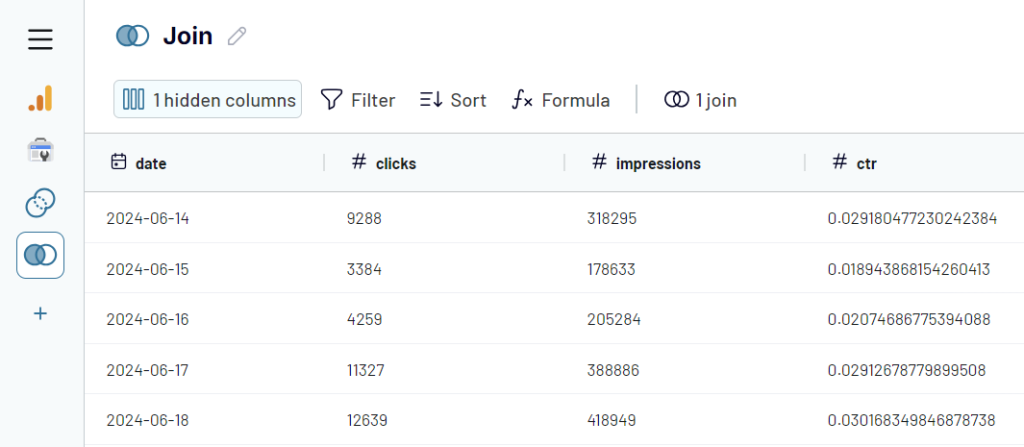
Next, click Join Data and, in just a few seconds, you’ll see a preview of the merged data. With Coupler.io’s data transformation features, you can refine and organize this combined data for export:
- Column Management: Hide unwanted columns, rename them, and adjust their order.
- Filter: Apply filters to highlight key data, like pages with over 1,000 unique clicks.
- Sort: Organize your data by sorting it in descending order based on impressions.
- Custom Formulas: Generate calculated fields to extract additional insights.

Step 3: Load data and schedule refresh
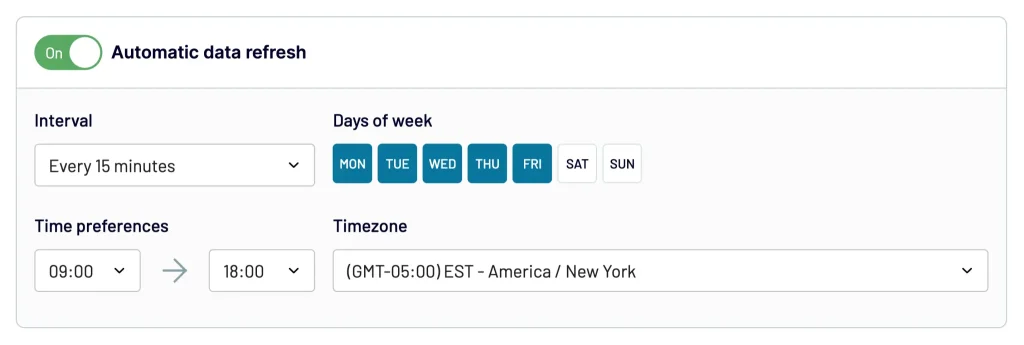
In the destinations section, choose the merged dataset, generate the integration URL, and run the importer. You can schedule data refresh right away by enabling the Automatic data refresh feature and configuring the schedule.

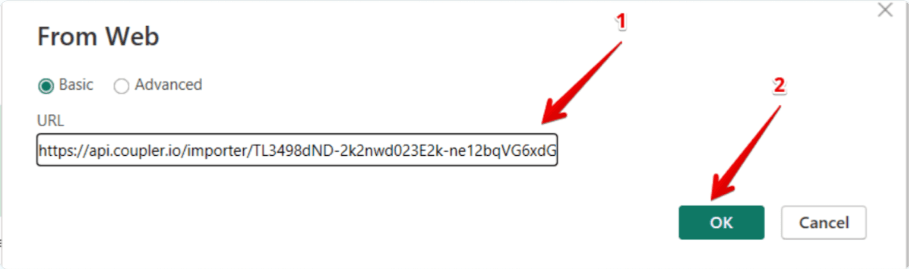
Go to your Power BI Desktop, and click on Get data. Next, choose the Web option and mark the Basic setting. Finally, paste the integration URL to bring the data into Power BI and press OK.

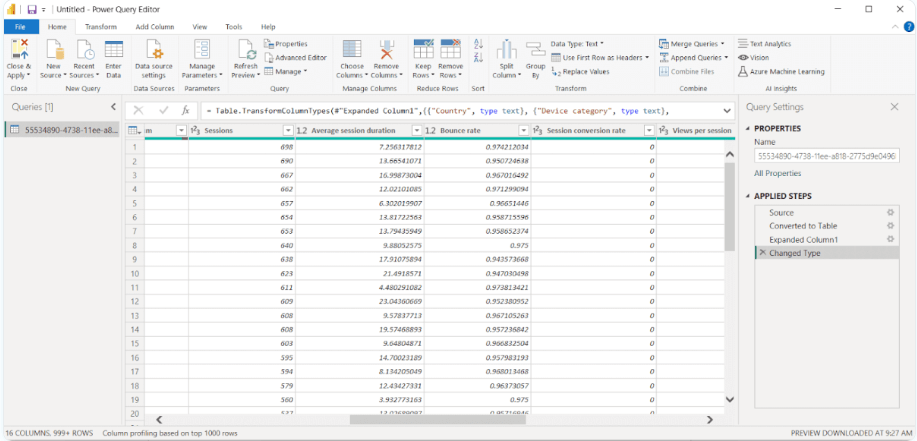
You can see the preview of merged table data from Google Search Console and Google Analytics 4 in Power Query Editor. Apply additional transformations if needed and then load data to create reports in Power BI.

With Coupler.io, you do not exactly merge tables in Power BI as the aggregation happens before the data is loaded to PBI. And that’s the benefit since you can get your data analysis ready on the go.
Another advantage is that Coupler.io lets you collect data from over 60 cloud apps and sources that are not natively supported by Power BI. So, try it out for free right away.
Collect and merge data from cloud sources with Coupler.io
Get started for freeHow to use merge tables with the same columns in Power BI with Power Query Editor?
In this section, we’ll show you how to use Merge Queries in the Power Query editor to combine table data for reporting and visualization.
Step 1: Load data
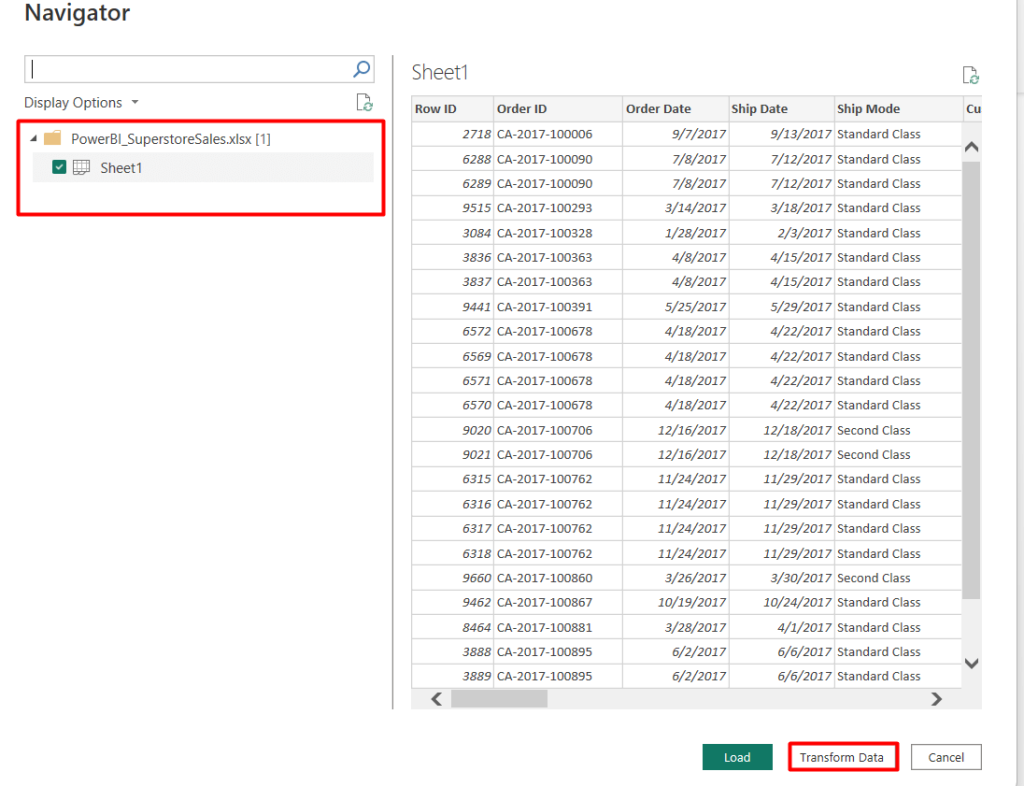
Start by loading the data tables that you want to merge. Select Get Data in the Power BI desktop app and choose your data source such as Excel, CSV, etc. Next, tick the table you want to start with as your primary table and click Transform Data to open the Power Query Editor.

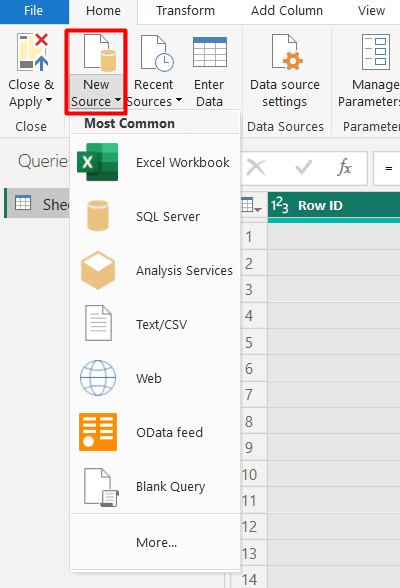
Now, click on New Source and load the secondary source of the dataset that you want to merge with the first table data.

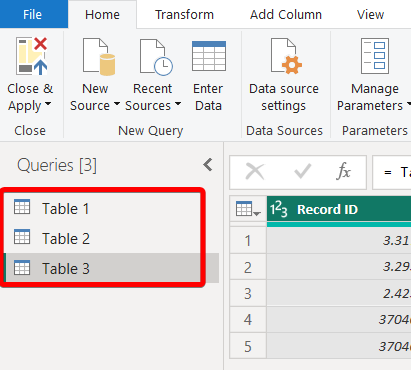
After loading all the needed data sources, you can see them in the left sidebar of your Power Query Editor.

Step 2: Merge tables in Power BI
Go to the Combine section on the toolbar and select the merge operation option between Merge Queries and Merge Queries as New.
- Merge Queries – to merge the selected query with another query.
- Merge Queries as New – to create a new query for the merged data.

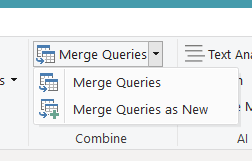
For this case, we choose Merge Queries. After this, the dialog box will open.

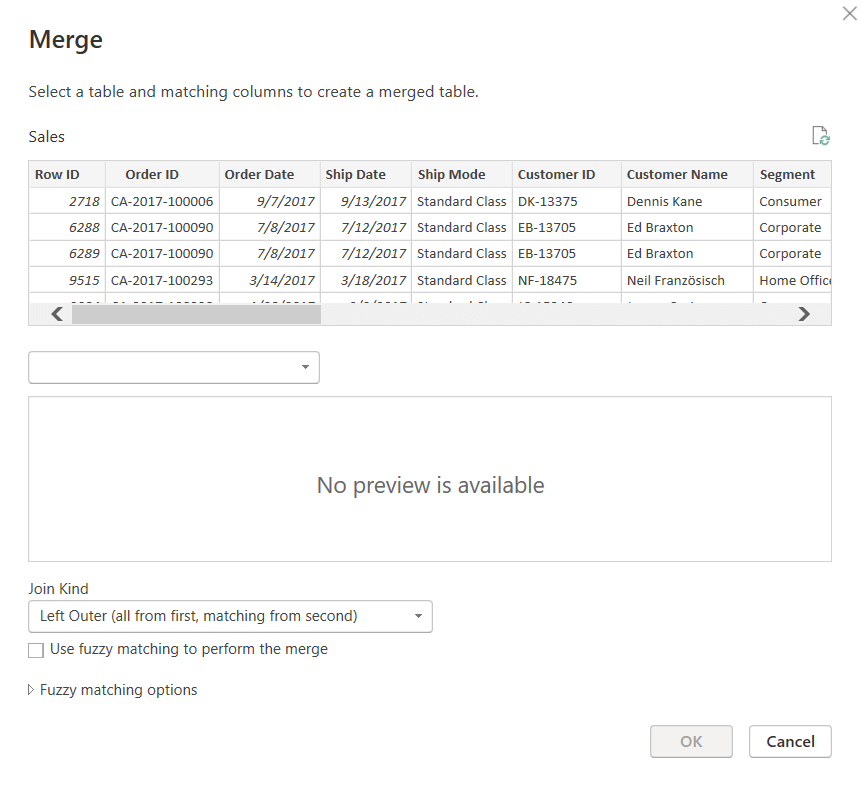
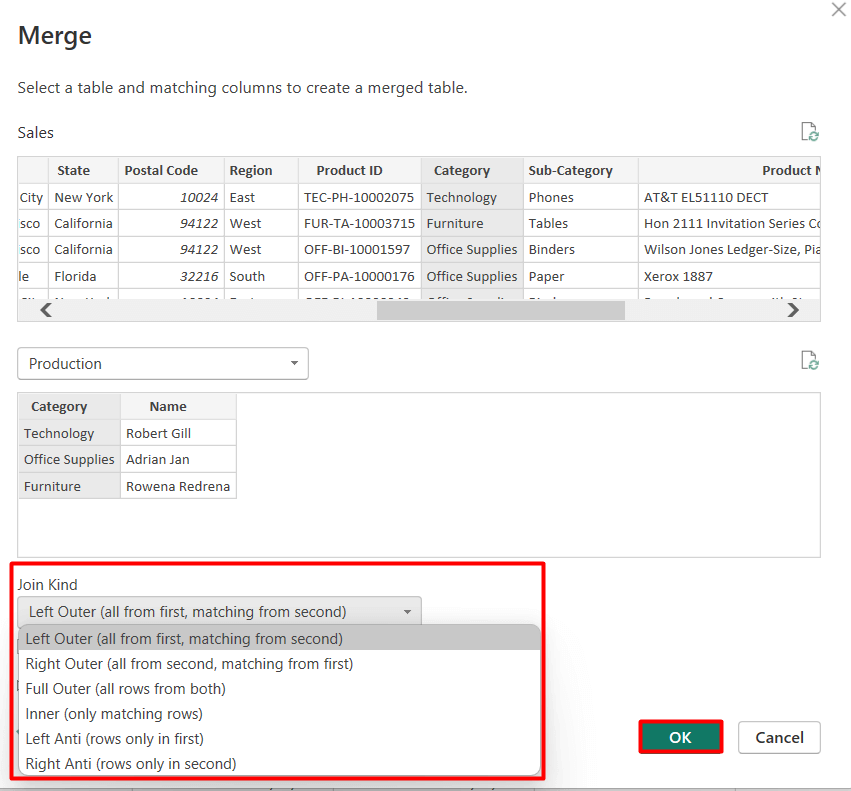
Now, you need to:
- Choose the second table you want to merge with from the drop-down list.
- Select the columns from both tables that you want to use as the matching key. Power Query will match rows from both tables based on these key columns. In our example, we chose the Category column.
- Select the Join Kind from the drop-down list. Power Query Editor offers six types of joining options to merge table data, such as Left Outer, Right Outer, Inner, Full Outer, Left Anti, and Right Anti. You need to choose the type of join that suits your data merging needs. It’ll show the number of matched rows of the first table. Finally, click on OK.

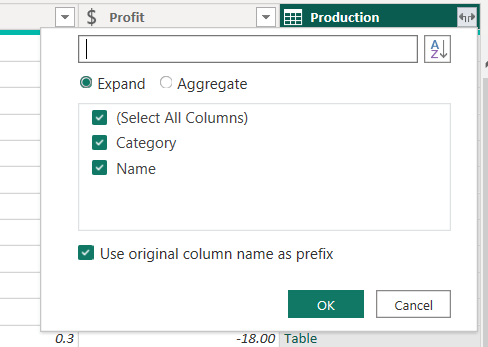
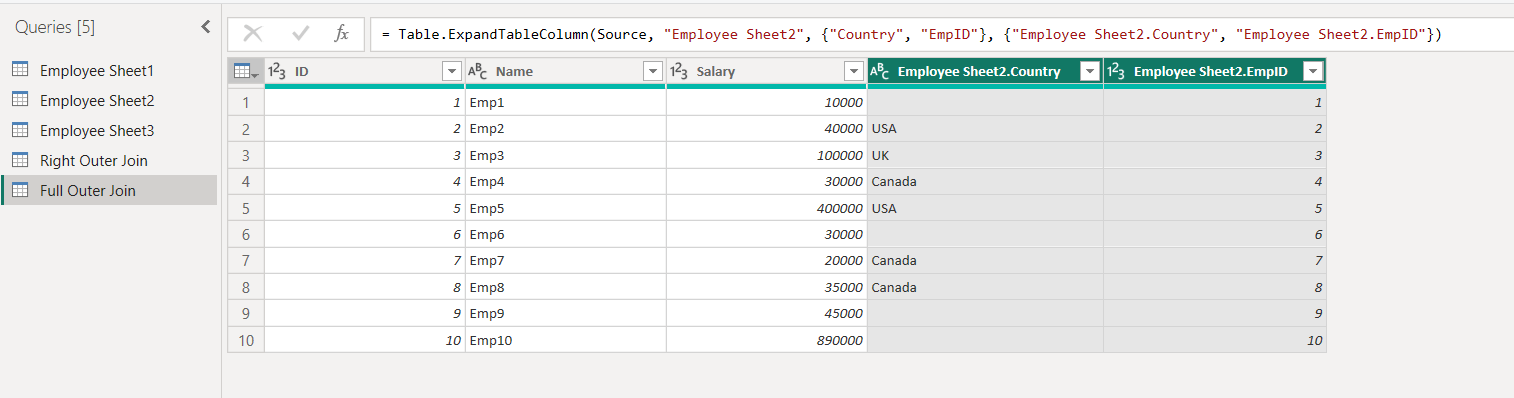
Step 3: Expand and select columns
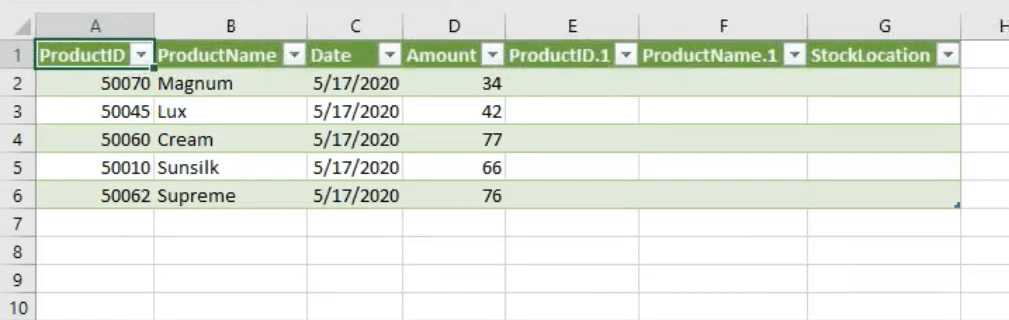
After merging, a new column will be added to your primary table, containing a nested table from the related table.

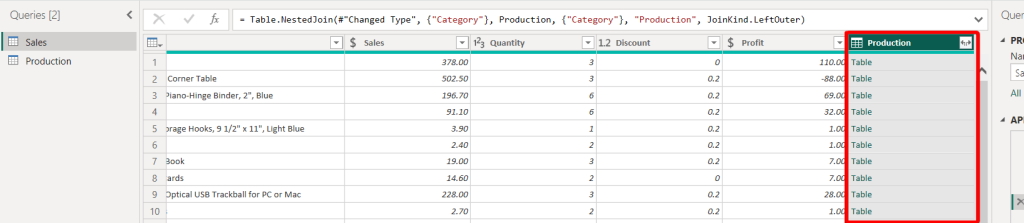
Click on the expand icon (two arrows) next to this new column to expand and select the columns you want to include from the related table. Here, you can also uncheck the Use original column name as prefix if you don’t want the column names prefixed with the table name. Then, click OK.

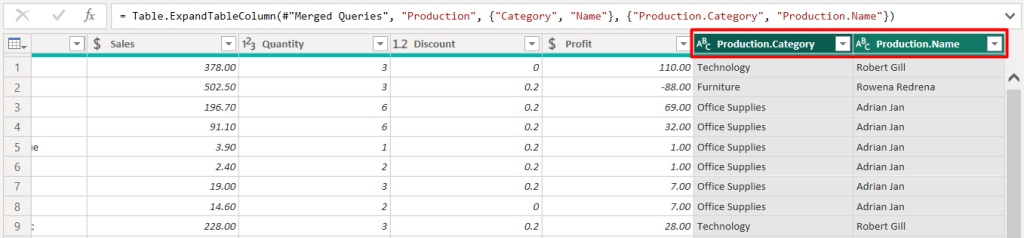
Now, you can see the corresponding tables are merged (Product.Category) and show the corresponding data (Product.Name).

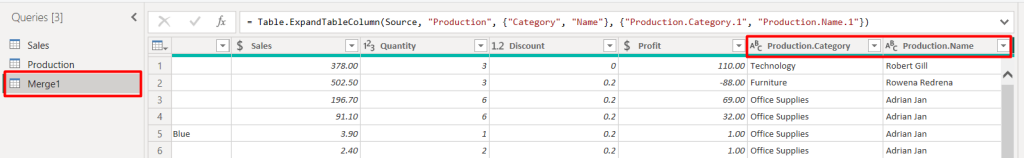
Note: However, if you want to create a new table with the merged data, you can choose the Merge as a New option. Then follow the same procedure as selecting the table data, columns, and join types. Finally, click OK.
You can see a new table is created on the left sidebar. Once you have merged and expanded your data, you can make additional transformations if necessary (like renaming columns, changing data types, etc.).

After completing your data preparation, click Close & Apply in the Power Query Editor to load the data into Power BI.
Merge table use cases
Track the ad campaign performance across multiple channels
If you run ad campaigns on different platforms such as Meta, Google, TikTok, and so on, it makes sense to create a report to track their performance. For this, you need to collect data from multiple sources so you can access the ad spend, clicks, conversions, and other essential metrics.
Creating such a report in Power BI would be challenging since you need to connect the required ad platforms and merge data from them. Fortunately, Coupler.io offers a ready-to-use report template.

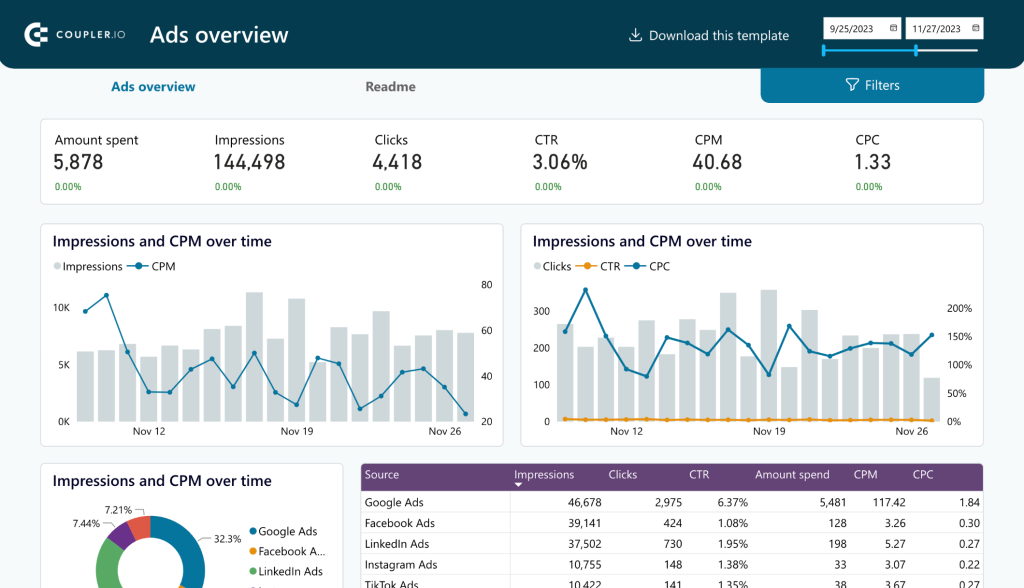
Equipped with a built-in connector, it automates the collection and merging of data from the advertising platforms you use. You only need to connect your ad accounts and complete the report setup following the enclosed instructions. In just a few minutes, you’ll receive aggregated performance data across different platforms.
The dashboard lets you track ad performance for individual channels, identify the best-performing platforms, and adjust your budget accordingly.
Compare paid and branded impressions
If you want to understand how paid impressions/clicks correlate with those on the branded search, you need to create a brand awareness report. This report will gather and aggregate data from various advertising platforms and Google Search Console to help you pinpoint the most effective ad campaigns.
You can build such a report on your own or use the plug-in dashboard template by Coupler.io.

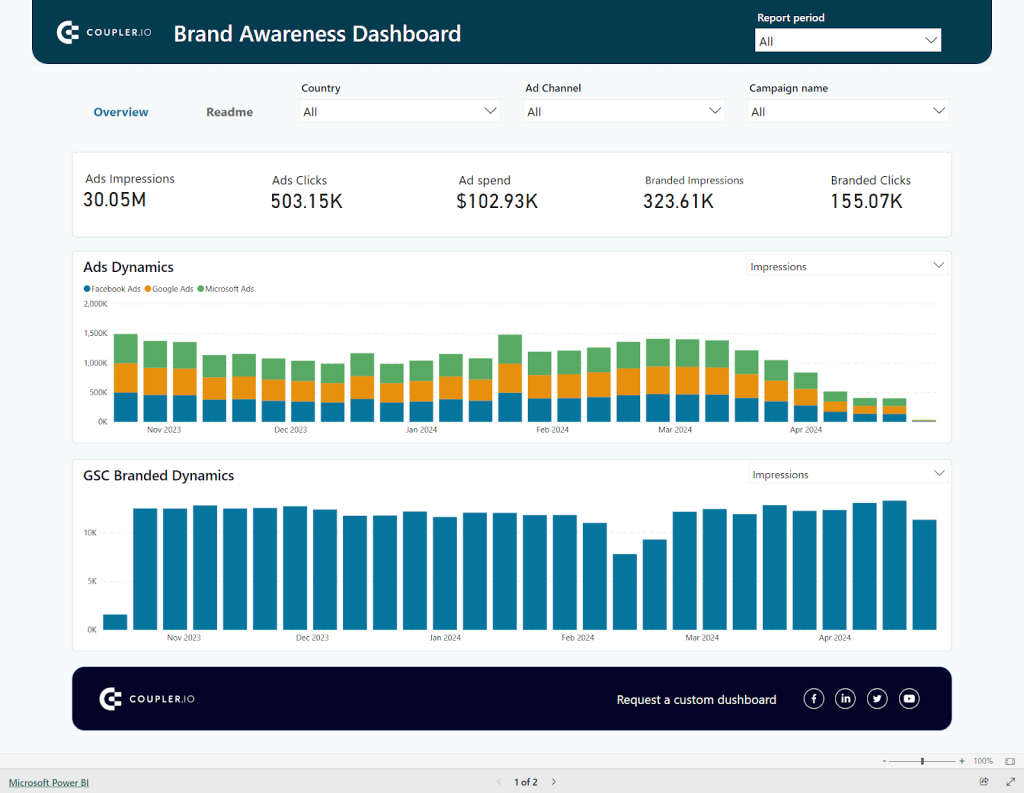
The brand awareness dashboard aggregates data from GSC with information from Google Ads, Facebook Ads, and Microsoft Ads. This allows you to track how your ad spending affects impressions and clicks, adjust your budget allocation, and measure your brand’s visibility by tracking branded impressions. Additionally, you can compare impressions and clicks to evaluate campaign performance and analyze the results of content and marketing strategies for different regions.
The template includes a built-in connector that gathers and merges data from the necessary sources. With just a few clicks, you can connect your accounts and load the data into the Power BI report.
Types of join to merge tables in Power BI
The various types of merges in Power Query are crucial because they provide flexibility in combining data from multiple tables. They can also be used for preparing data for specific analytical requirements.
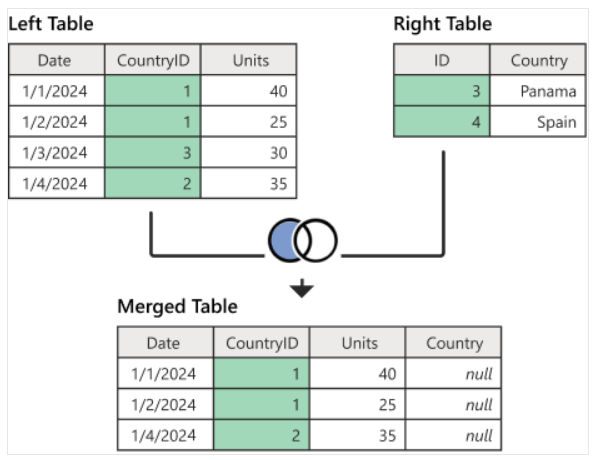
Left Outer Join
The left outer join keeps all rows from the primary table and matches rows from the secondary table. This type is ideal for when you want to retain all data from a primary table and add related data from another table. In our previous example, we merged the production head names with the product category.

This join kind is also useful for scenarios like enriching a dataset with additional information while ensuring no primary data is lost.
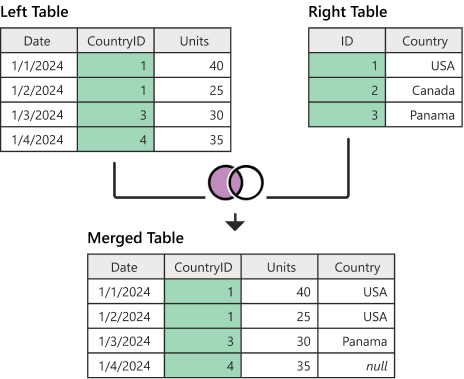
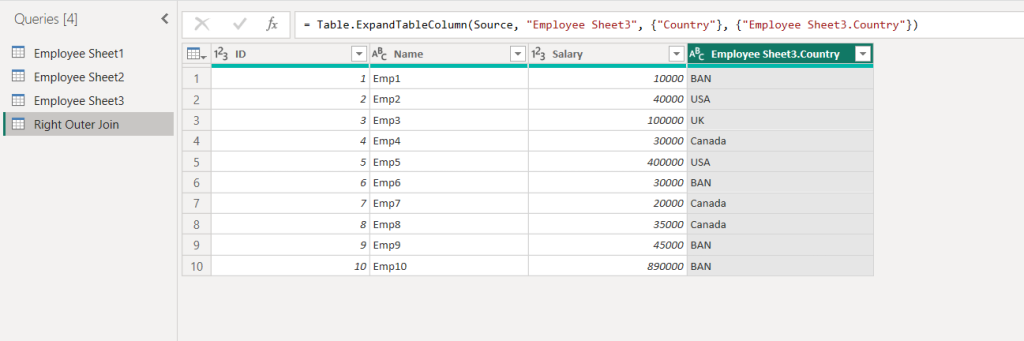
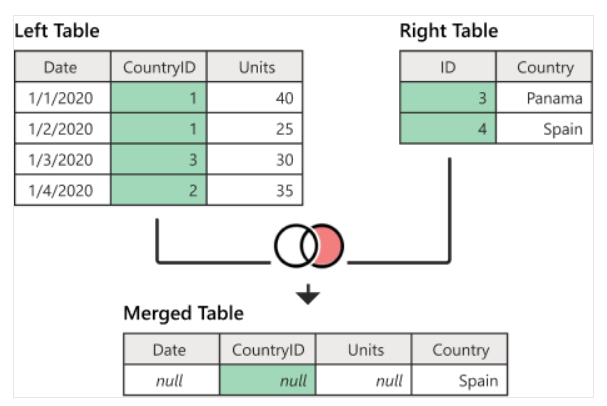
Right Outer Join
This is opposite to the left outer join feature. It keeps all rows from the secondary (right) table and includes matched rows from the primary (left) table.

To merge tables in Power BI using this join, select the columns, and choose the join type as Right Outer.
After merging, expand the table, and here is the result:

Right outer join is useful when the secondary table’s data is more critical, and you want to ensure all its rows are included even if there is no match in the primary table. This is also helpful for validating or cross-referencing data.
Full Outer Join
Full outer join allows all rows from both tables, whether there is a match or not. Non-matching rows will have null values in the columns from the table that do not have a corresponding match.

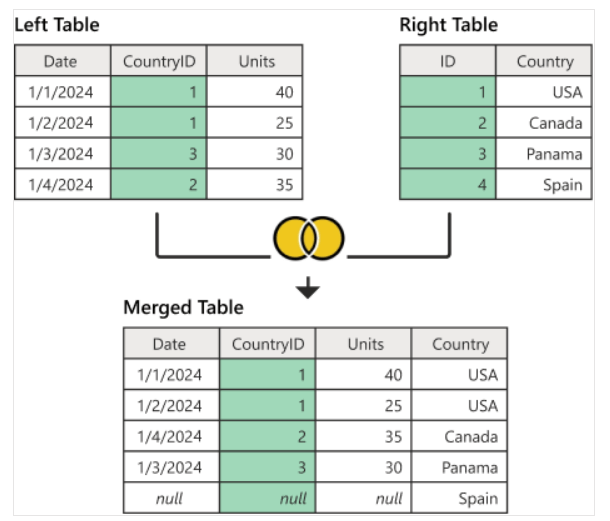
Select the corresponding columns and choose Full Outer (all rows from both).
The resulting merged table using full outer join will look like the below table:

So, you should ensure no data is left out from either table, which is crucial for obtaining a comprehensive view of all data points, including identifying any gaps or mismatches.
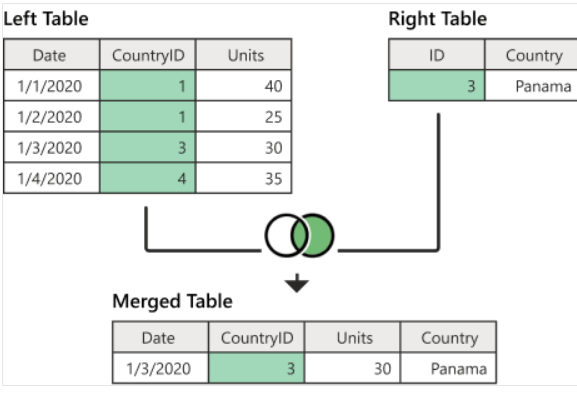
Inner Join
This join category only includes rows where there is a match between both tables. If there is no match, the row is excluded from the results.

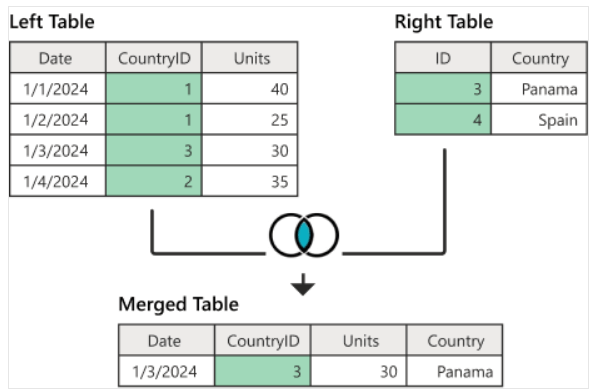
To merge using inner join, select the tables and columns. Then select Inner (only matching rows), and click OK.
Inner join is crucial when you need to focus only on the relationships between two datasets, filtering out any data that doesn’t have a match in both tables. This is commonly used in scenarios where data completeness and consistency are required. Below is the resulting merge between two tables of data using the Inner Join.

Left Anti Join
Left Anti returns only the rows from the left table that do not have any matching rows in the right table.

Choose the option Left Anti (rows only in first) after selecting the corresponding primary and secondary tables’ columns.
This joining category is important for identifying and isolating data in Table 1 that has no corresponding match in Table 2. As a result, you will use them for tasks like identifying discrepancies or orphaned records.

Right Anti Join
Right Anti Join is similar to the Left Anti Join but focuses on identifying unmatched data in the secondary table.

Like the other kinds of joins, you need to choose the primary and secondary tables. Then choose the columns you want to merge. Next, select Right Anti (rows only in second). Click OK.
This merging type returns only the rows from the right table that do not have any matching rows in the left table. You can use Right Anti Join when you need to find data points that exist in one source but not in another.

What is Fuzzy merge?
Fuzzy merge in Power Query allows you to combine tables based on approximate matching of values rather than exact matches. This is useful when you have data with slight variations, misspellings, or inconsistencies.
To use this merge, select the Merge Queries category and choose the tables and columns you want to combine. Next, check the Use fuzzy matching to perform the merge option in the merge dialog. Click Ok.

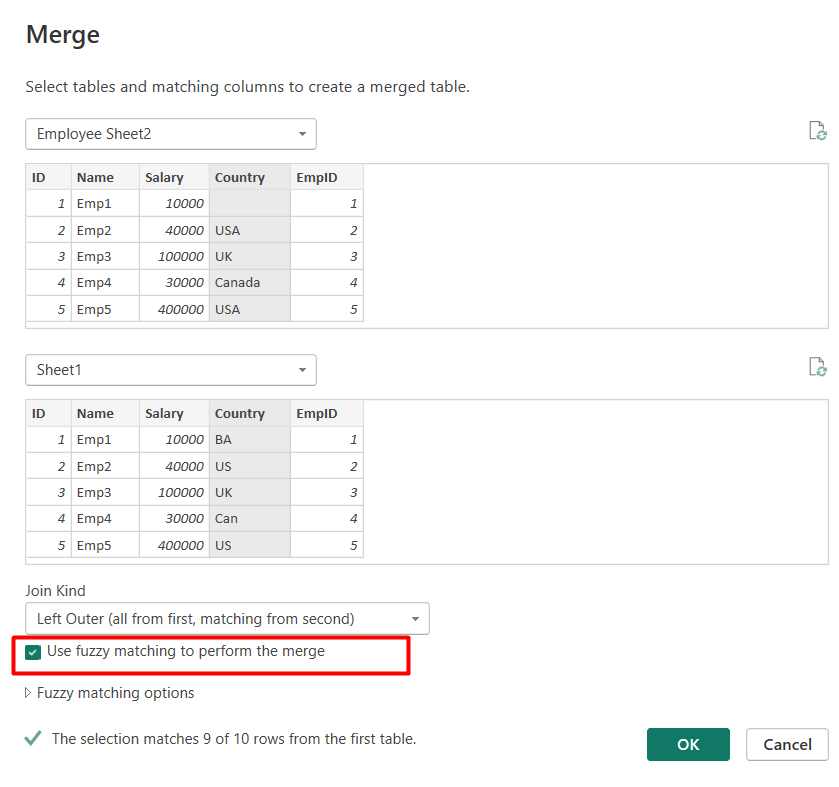
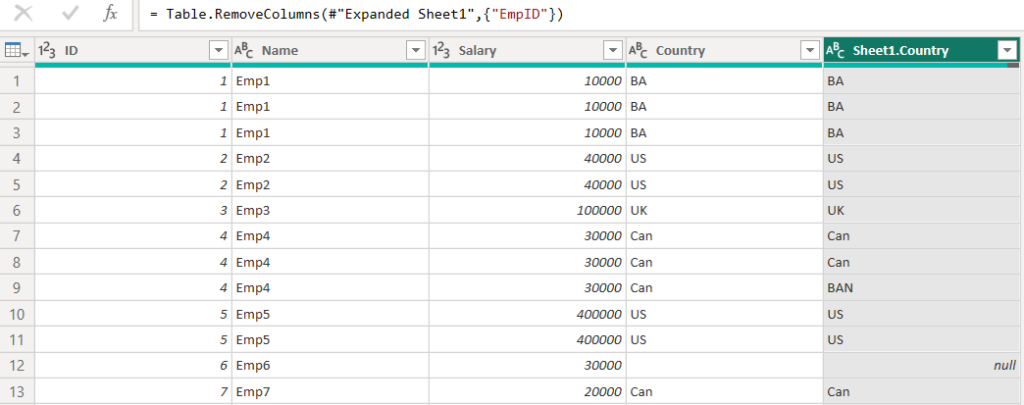
You can see that similar entries of the selected columns (e.g. Country) are merged and show the results.

Power BI merge vs. append tables
Append and merge queries in Power BI are different ways to combine data, but they differ significantly in their operation and arrangement.
Merging adds columns from one table to another side-by-side based on a matching key, similar to a join in SQL. Appending, on the other hand, stacks tables on top of each other, combining rows from one table below another, like UNION ALL in SQL.
Understanding the structure of your data and the desired outcome is crucial for choosing the correct method. Here is a quick overview table to distinguish between merge queries and append queries in Power BI:
| Aspect | Merge Queries | Append Queries |
|---|---|---|
| How It Works | Select primary and secondary tables- Match columns and choose join type (e.g., Left Outer, Inner)- Combine data horizontally | – Select tables with the same schema – Combine rows into one continuous dataset- Stack data vertically |
| Benefits | – Combines related data- Flexible join options- Integrates supplementary information | – Simple consolidation of similar datasets- Provides a unified dataset- Easy to combine rows from similar sources |
| Limitations | – Requires matching columns for accurate alignment- Potential for null values if keys do not match | – Requires schema consistency among tables. – Limited to row combination, not for key-based integration |
| Best Fit For | – Adding supplementary data (e.g., merging customer details with transactions)- Data integration based on key columns | – Aggregating similar datasets (e.g., combining monthly reports into a yearly dataset)- Appending historical data with consistent schema |
Merge vs. append using Coupler.io
Coupler.io supports two main data-combining methods: data join and append.
Data Join
The data join method integrates data based on a common field, including all rows from the primary source and only the matching rows from the secondary source. It is similar to the LEFT JOIN operation in SQL and it’s ideal for adding extra details to your existing data. You can merge two or multiple tables using this feature.
Append
In Coupler.io, the data append method merges datasets by aligning values from the same attribute into corresponding columns. Rows are appended sequentially, making it suitable for consolidating data with similar structures into a unified dataset. Additionally, data append is formerly known as Data Union or Data Stitching.
FAQs
How to merge tables with the same columns in Power BI?
To merge tables with the same columns in Power BI, click on Append Queries > Append Queries as New in Power Query Editor. Next, choose the tables you want to combine, ensuring they have the same column structure, and click OK to create a new merged table containing all rows from both tables.
How to merge tables with different columns in Power BI?
To merge tables with different columns, use Merge Queries in Power Query Editor. Select the tables and matching columns, and choose a join type (e.g., Left Outer, Full Outer). Next, click OK, then expand the merged column to include the desired columns.
What are the advantages of merging tables in Power BI?
The advantages of merging tables in Power BI include the seamless integration of data from multiple sources, efficient data management, reduced redundancy, and consolidation of related data into a single view for easier reporting.
Are there any disadvantages to merging Power BI tables?
Merging Power BI tables may lead to performance issues with large datasets. Additionally, improper joins may result in data loss or inaccurate analysis if not handled carefully.
Beyond merging: Power BI relationships
In Power BI, creating relationships between tables is a crucial step that goes beyond simply merging data. Relationships define how data in different tables are connected, enabling more complex analyses without data duplication.
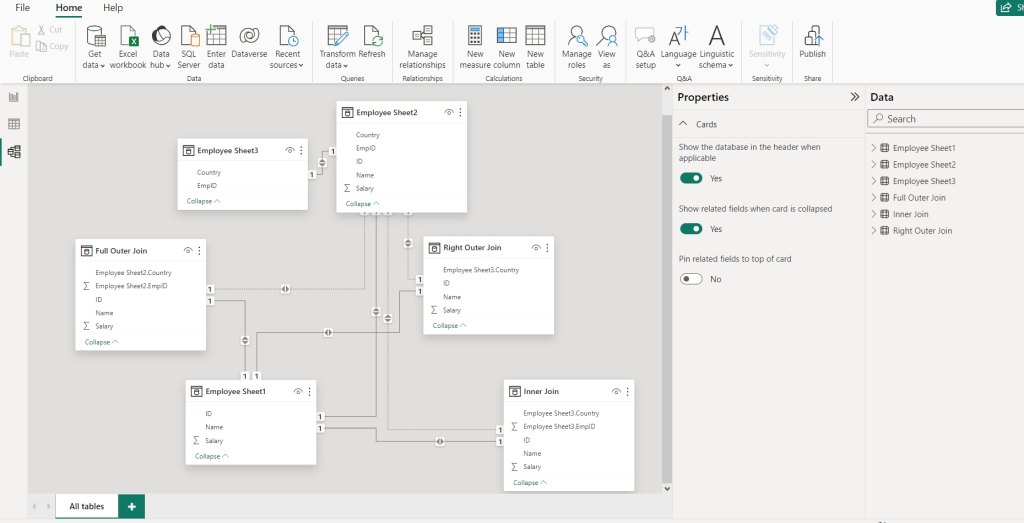
To create and manage relationships in Power BI merging tables, go to the Model view tab. You can see the relationship blocks between tables.

You can also add new relationships and edit or delete them if required. To create a new relationship or modify it, click Manage relationships. A window will pop up showing the relationship of the columns and other options.

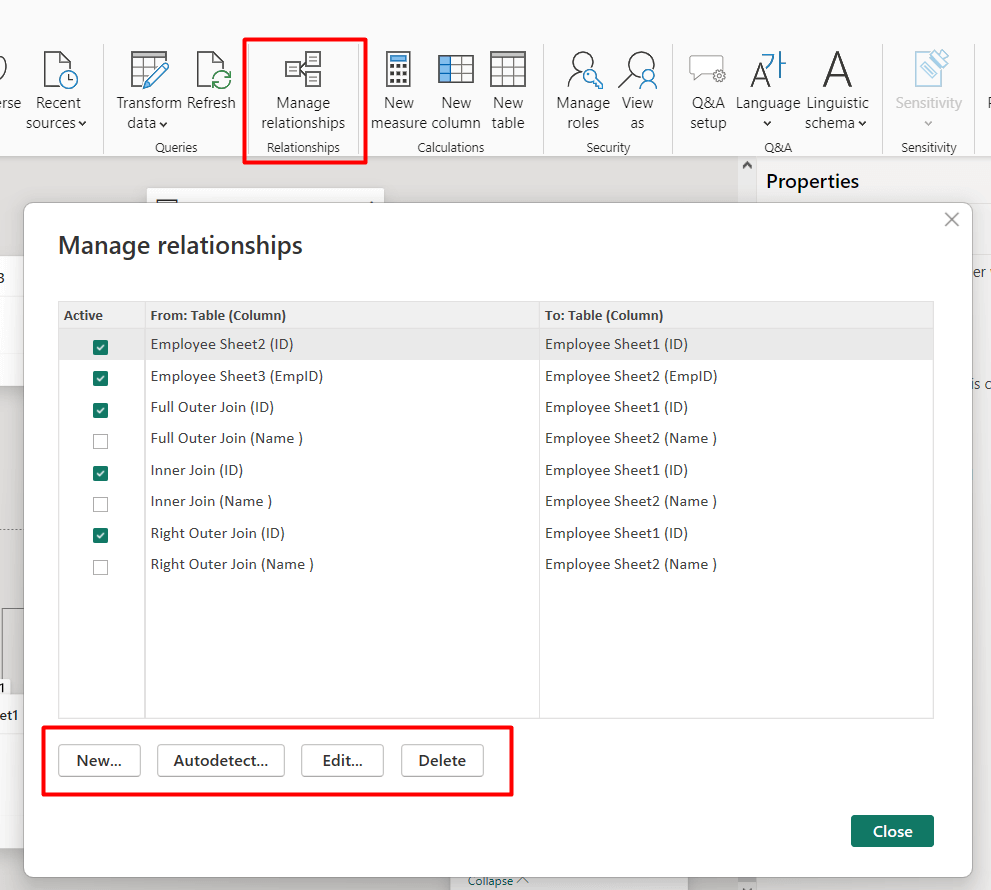
To create a new relation, click on New. Next, select the two tables and their corresponding columns. Select Cardinality such as one to one, one to many, many to one. Also, select the Cross filter direction as a single of both. Then, click OK.

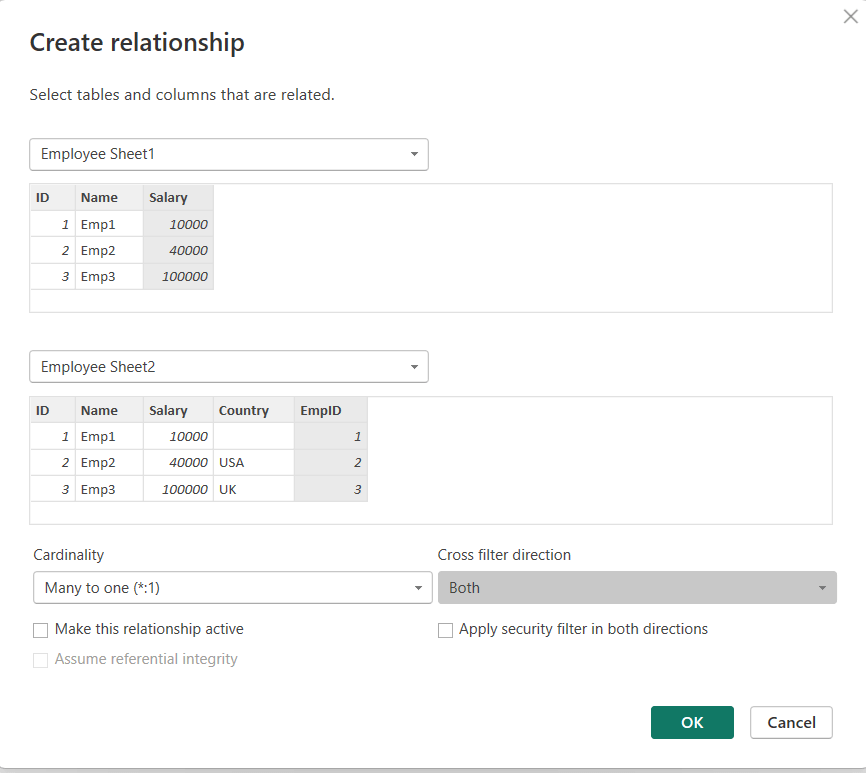
You will see the newly created relationship in the Model view dashboard.

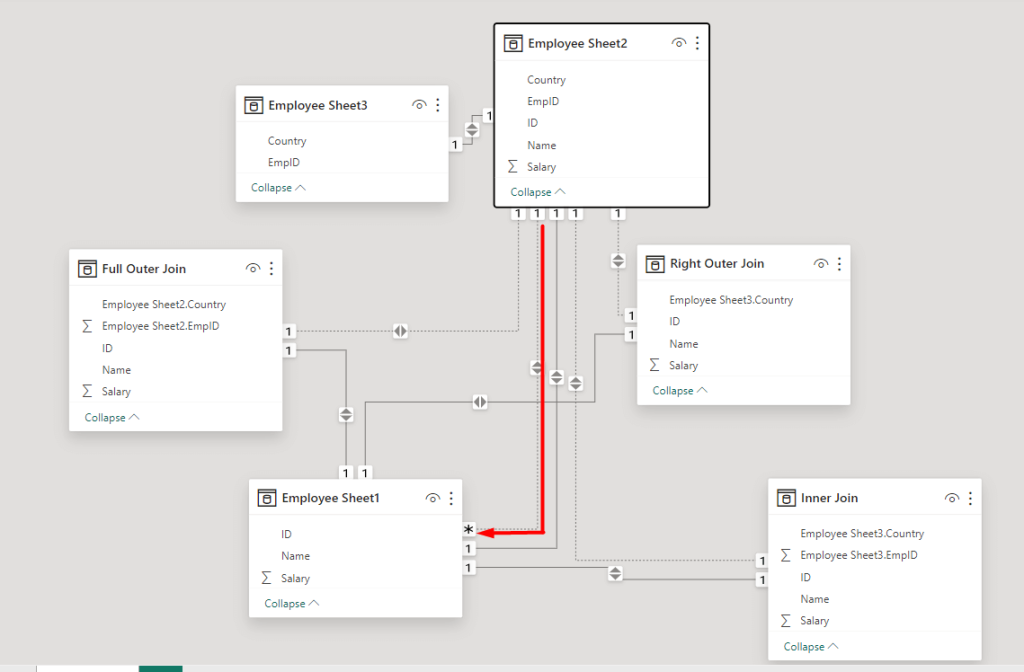
Similarly, you can edit the relationship manually or simply drag/move the components.
Establishing relationships between tables enables you to generate dynamic and interactive reports that can extract insights from multiple datasets. By defining how tables relate to each other, you can incorporate fields from different tables in your visualizations, conduct cross-filtering, and maintain data integrity across your reports. This not only improves the precision of your analysis but also streamlines the data model, making it more manageable and updatable.
Get the best way to merge tables in Power BI
The best way to merge tables in Power BI depends on your data source and transformation needs.
Power Query, a built-in and cost-free feature in Power BI, provides a wide range of join types and allows users to directly transform merged data within the interface.
On the other hand, Coupler.io is capable of merging data from various cloud sources, enabling users to integrate data from multiple online platforms and set up automated schedule refresh.
Collect and merge data from cloud sources with Coupler.io
Get started for free