Why is it important to measure ad creative effectiveness?
In the most comprehensive analysis of what drives incremental sales, Nielsen and NCS found that creative quality accounts for 56% of a campaign’s total sales impact. It is the dominant factor, surpassing media placement, targeting, and frequency. Google also reports that the creative determines 70% of a campaign’s success.
Platforms like Meta are actively validating these insights. Through collaborations with global research firms and leading brands, they’ve shown that applying creative best practices can lead to a 1.2 to 2.7 times increase in long-term sales and a 1.2 to 7.4 times increase in short-term sales.
In other words, creative matters. However, without proper measurement, even the strongest asset can be misunderstood. You risk misattribution, wasted budget, and optimizing for the wrong outcomes.
This raises a more important question: How to track the performance of ad creatives quickly and effectively, especially in the age of AI?
That’s what we’ll explore next, including how Coupler.io can help turn creative data into clear, actionable insights.
How to do ad creative analysis
Here are six simple but powerful ways to structure your ad creative analysis and gain more value from your campaigns.
1. Set creative goals that match the funnel
Not all ads are built for the same job. Some are meant to raise awareness; others aim to engage or drive a specific action. Every creative should serve a clear purpose tied to your campaign’s goal.
A good starting point is to map creatives to a simple three-stage funnel: awareness, engagement, and conversion. Awareness (or acquisition) creatives aim to make people discover your brand. Engagement creatives are there to build interest and foster connections. Conversion creatives are meant to close the deal, often featuring stronger calls to action or more compelling offers.
Using the same creative across all stages might save time, but it can easily miss the mark. At the very least, adapt your copy and call-to-action (CTA) buttons. A conversion ad, for example, should feel more urgent or persuasive than one meant for awareness.
Pro tip: You can also use UTM parameters to tag your creatives and track their purpose. Then, with tools like Google Analytics, you can analyze performance based on user behavior, going beyond what the ad platform reports. Here, we’re using the UTM parameter utm_content, to distinguish between creatives that started a session.

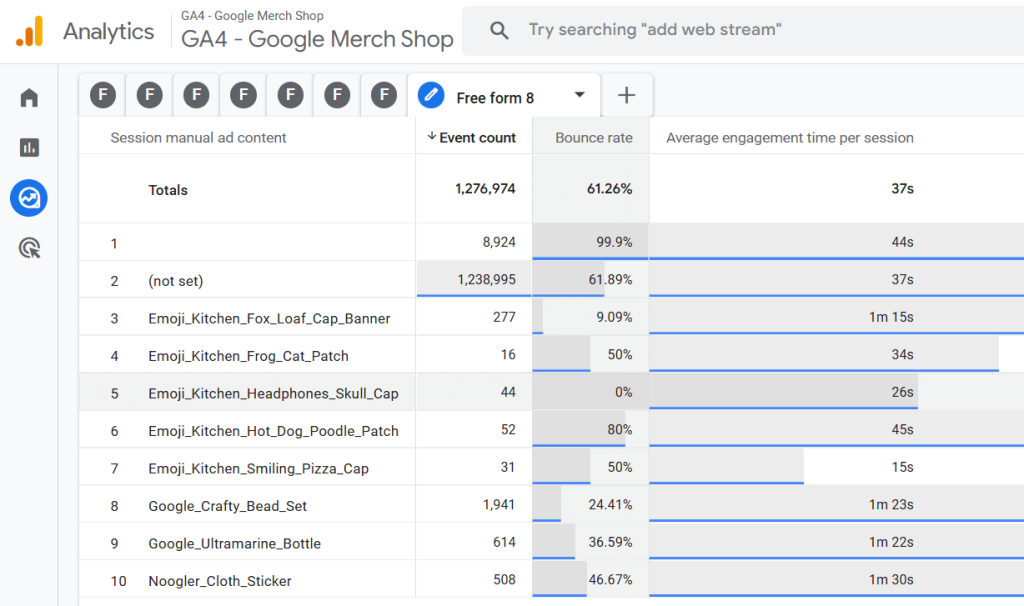
You may discover that a creative performs well in terms of engagement, even if it didn’t directly convert. This insight can help you improve future campaigns or adjust messaging across channels.
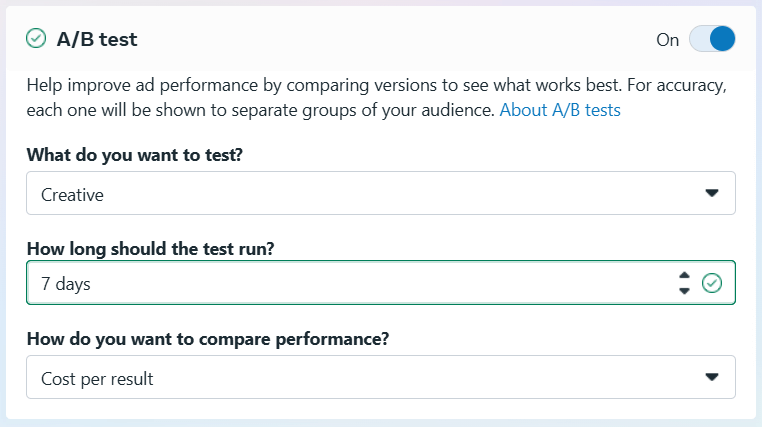
2. Run A/B tests to compare creatives
A/B testing ad creatives is one of the most reliable ways to understand what works. A/B testing, also known as split testing, helps you identify the winning variation by comparing different ad versions to determine which one performs best based on your chosen objective.

Begin with a clear hypothesis based on data. For example, “This headline will drive more clicks because it’s benefit-driven.”
Modern A/B testing has evolved beyond traditional methods.
“Testing ad creatives is still essential, but in Google Ads, much of the experimentation is now handled by AI — especially within campaign types like Performance Max, Demand Gen, or responsive search ads in Search campaigns. Instead of the traditional A/B tests we used to run, we now rely more on asset-level data and performance ratings.”


You can test headlines, visuals, formats, or even tones of voice. Tools like Meta Ads and Google Ads enable you to systematically compare different versions, and you can layer on additional tools, such as session recording or heatmaps, to identify user friction that metrics alone might not reveal.
Don’t forget to test for different funnel stages as well. A creative that performs well in a conversion campaign might not be the best choice for awareness. This method is essential for identifying top-performing ad creatives and understanding which elements drive the strongest results.
When running tests, Hana recommends
“prioritizing tests of headlines, value propositions, and calls to action, as these elements typically have the strongest influence on performance.”
3. Establish benchmarks by channel or format
Not all platforms work the same, and neither do all formats. One reason benchmarks by channel and format matter is that overall campaign averages can hide what’s actually working. By tracking performance by format, such as comparing Facebook video ads to carousel ads, you get a more accurate view of where your budget delivers results.
For example, you might find that short video ads consistently drive more conversions than carousels, especially when they’re designed with clear messaging and a strong call to action.
This kind of insight helps you shift spend based on what performs best, rather than relying on broad assumptions.
4. Monitor performance over time, not just snapshots
Performance needs context. Examining a campaign over a single week can obscure significant trends, such as seasonality, audience fatigue, or timing issues.
These specific benchmarks (0.1-0.2 point drops) provide concrete thresholds for when to refresh your creatives, rather than relying on gut feelings.
If you offer outdoor experiences, for example, a sudden drop in performance might have nothing to do with your creative. It could simply be due to weather or seasonal habits.
Comparing performance over periods such as month-over-month or year-over-year helps spot patterns and isolate unusual results. You can also use this approach to set internal benchmarks.
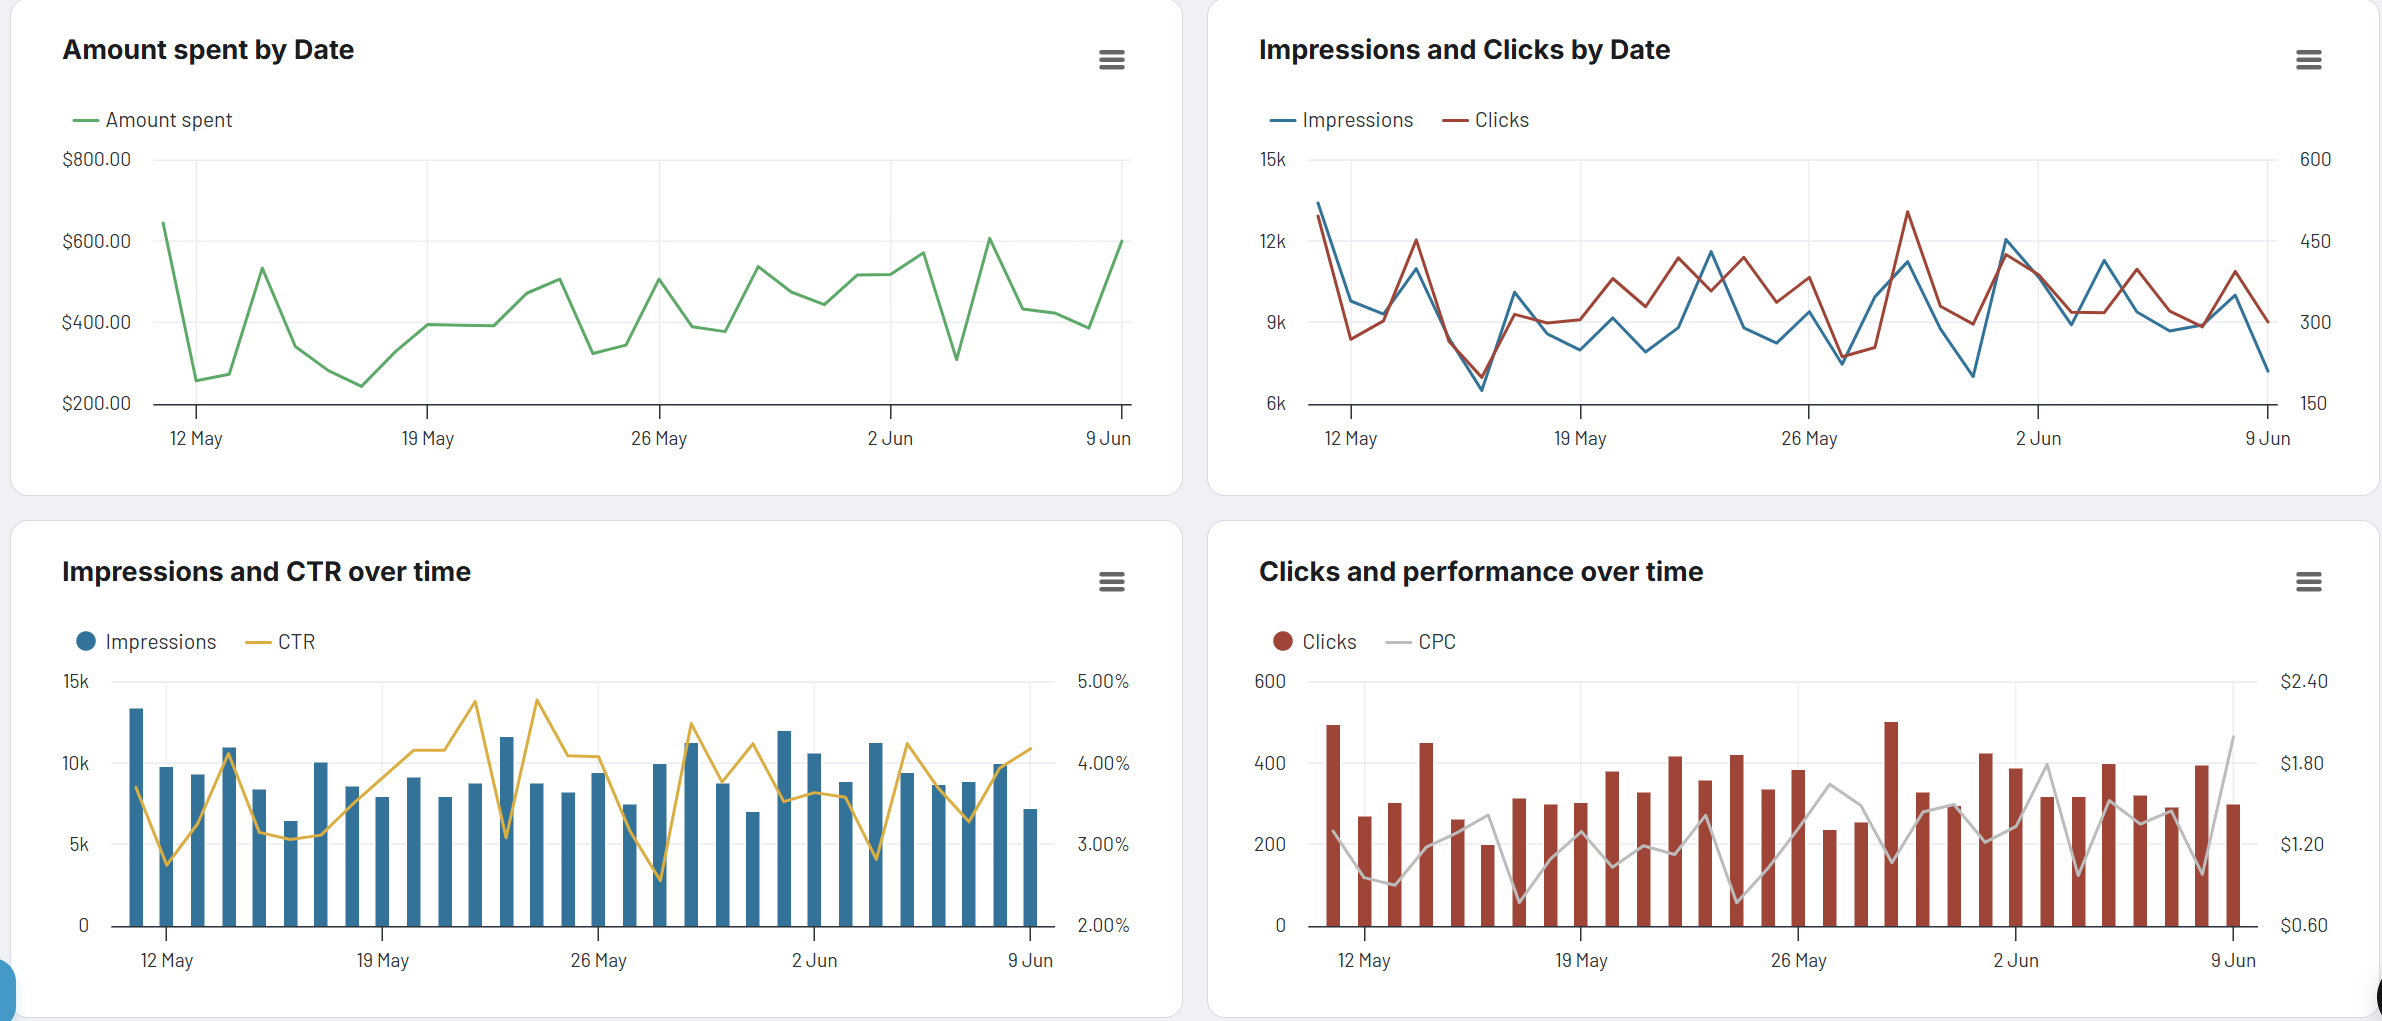
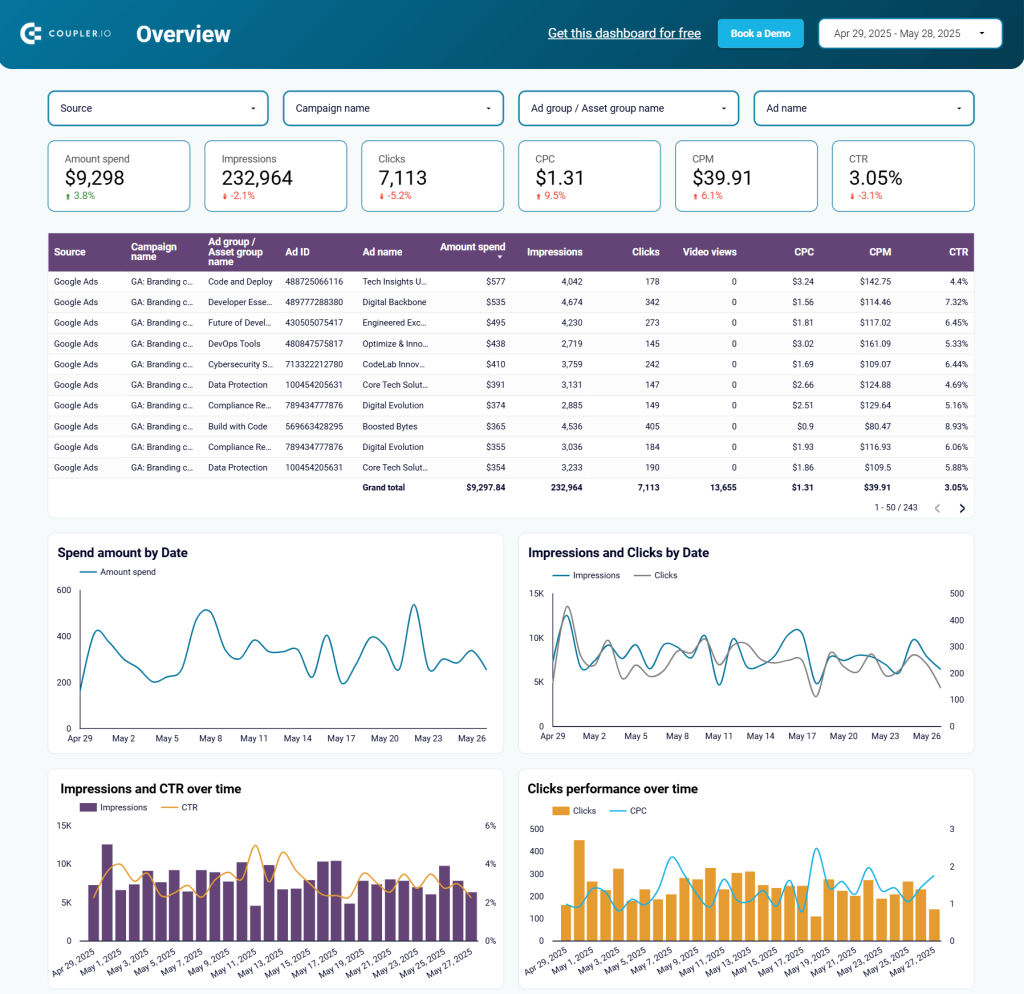
Whether you review results weekly or monthly, tracking your averages will help you recognize when a campaign is slipping below expectations or doing better than usual. This makes it easier to adjust quickly and plan future budgets more effectively. For instance, here is what it looks like in the multichannel ads dashboard by Coupler.io.

5. Analyze cost-efficiency, not just volume
Stick to cost-efficiency metrics like Cost per conversion, CPM, and CPC, to avoid getting caught up in vanity KPIs. This approach helps you optimize ad creative performance by focusing on what delivers actual business value.
“I focus on conversion metrics first, as they reflect the true impact of the creative. When conversion volume is low, I pay attention to CTR, view rate, earned actions, and similar signals that indicate the ad captured the user’s interest.”
Ask yourself:
- What are we paying to get this result?
- Is a high CTR worth it if the CPC is twice our usual?
- Are we generating reach at a low CPM but seeing no downstream conversions?
Look at spend in relation to outcomes, not just quantity. Ideally, efficient creatives don’t just perform. They do it without draining your budget.
Learn more about PPC KPIs and OKRs.
6. Use AI to speed up insights and spot patterns
AI is enabling faster and smarter creative analysis, making it essential for staying ahead, particularly when managing campaigns at scale.
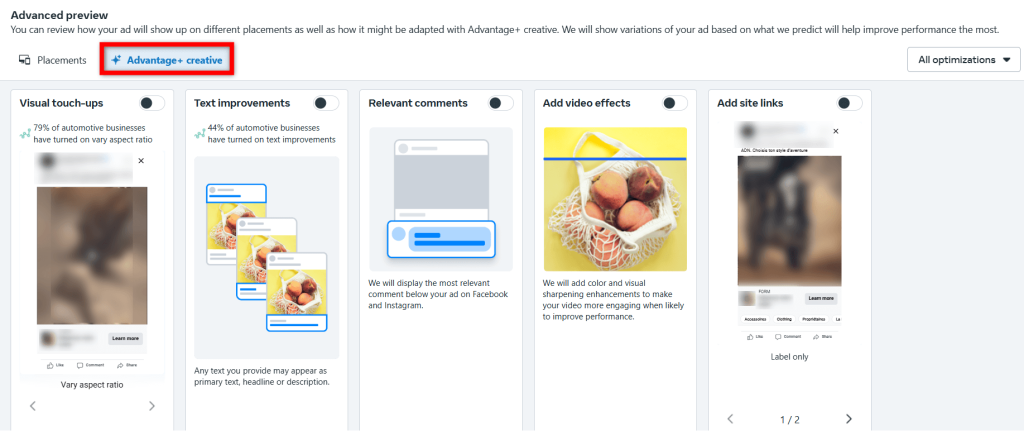
One example is Meta’s Advantage+ Creative, which automatically generates multiple versions of your ad and delivers the most relevant variation to each user based on what they are most likely to respond to.

Google Ads uses advanced AI-powered solutions that continuously learn which assets (text, images, videos) and combinations perform best. For Search campaigns, this means identifying the most effective creatives for different user queries in real time.
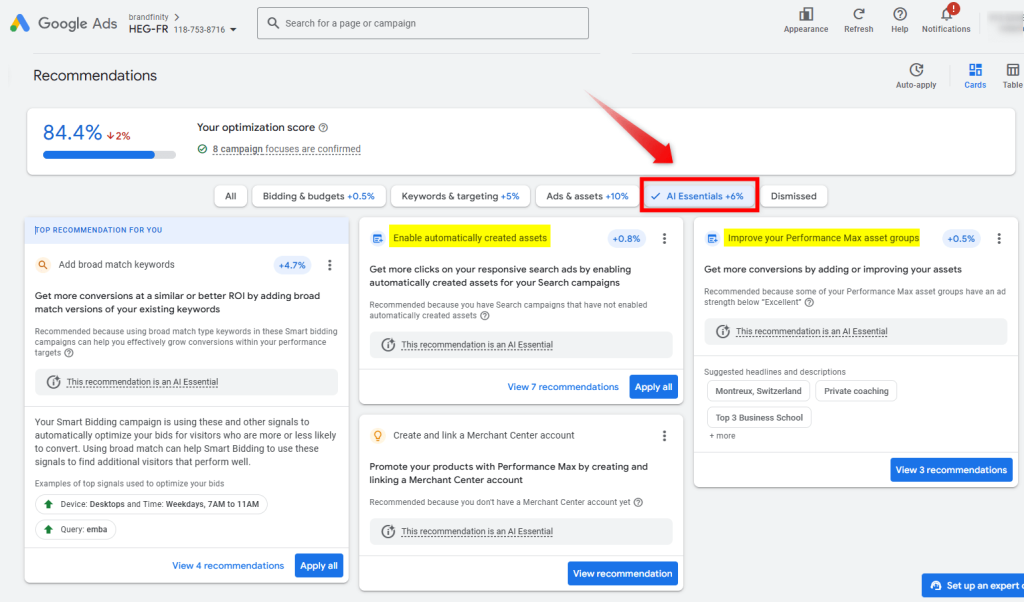
You can also take advantage of Google Ads Recommendations, which highlight quick-win optimization opportunities based on recent campaign data.

More recently, Google has introduced AI Max for Search Campaigns, a feature designed to go beyond traditional keyword matching. Instead of relying solely on user queries, AI Max uses broader signals, including intent, behavior, and content from your landing pages, to dynamically generate new headlines, calls to action, and creative combinations.

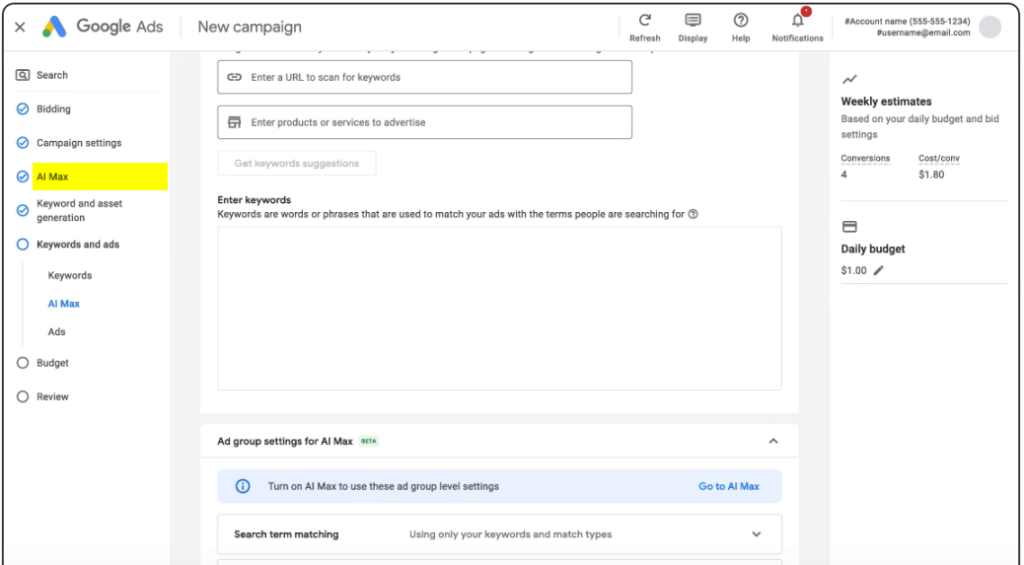
It adapts in real time to serve more relevant ads and capture previously untapped search demand.
This type of automation helps you test more variations without increasing your workload. AI can also flag declining performance, detect ad fatigue, and suggest new formats and messages to maintain high engagement.
Once you’ve built a habit of analyzing creative performance, the next challenge is making it scalable. This is where the right tools—and especially, dashboards—make a difference.
Track performance of ad creatives: native tools vs smarter dashboards
If you’ve ever tried to track performance of ad creatives directly in Meta, Google, or LinkedIn, you know the feeling: too many tabs, endless tables, and performance data scattered everywhere. The challenge of ad creatives performance tracking becomes even more complex when managing multiple platforms simultaneously.
Each tool does offer native options to track creative results. For example:
- In Meta Ads, performance data resides in a horizontal scroll nightmare, with constant jumping between views.
- In Google Ads, ad-level insights are buried in layers of campaign structure.
All of this makes it more complicated than it should be to answer a simple question: which creatives are working, and why? That is why dashboards are a better approach.
Instead of clicking through platforms or exporting CSVs, you can plug your data into a Coupler.io-powered dashboard. It automatically pulls your ad data from Meta, Google, or LinkedIn, providing a single, clean view of how your creatives are performing.
Setup is simple. Just connect your ad account via Coupler.io and you’re ready to go. No coding. No delays. From there, you get:
- A unified, visual overview of creative performance across channels
- Key metrics side by side: impressions, clicks, CTR, CPC, CPM, conversions, and spend
- Time-based charts to track trends and spot anomalies
- A performance table to quickly identify what’s working and what’s not
With Coupler.io, you can stop guessing, start comparing, and optimize with clarity. Below, we’ll look at a set of dashboards built to help you do exactly that.
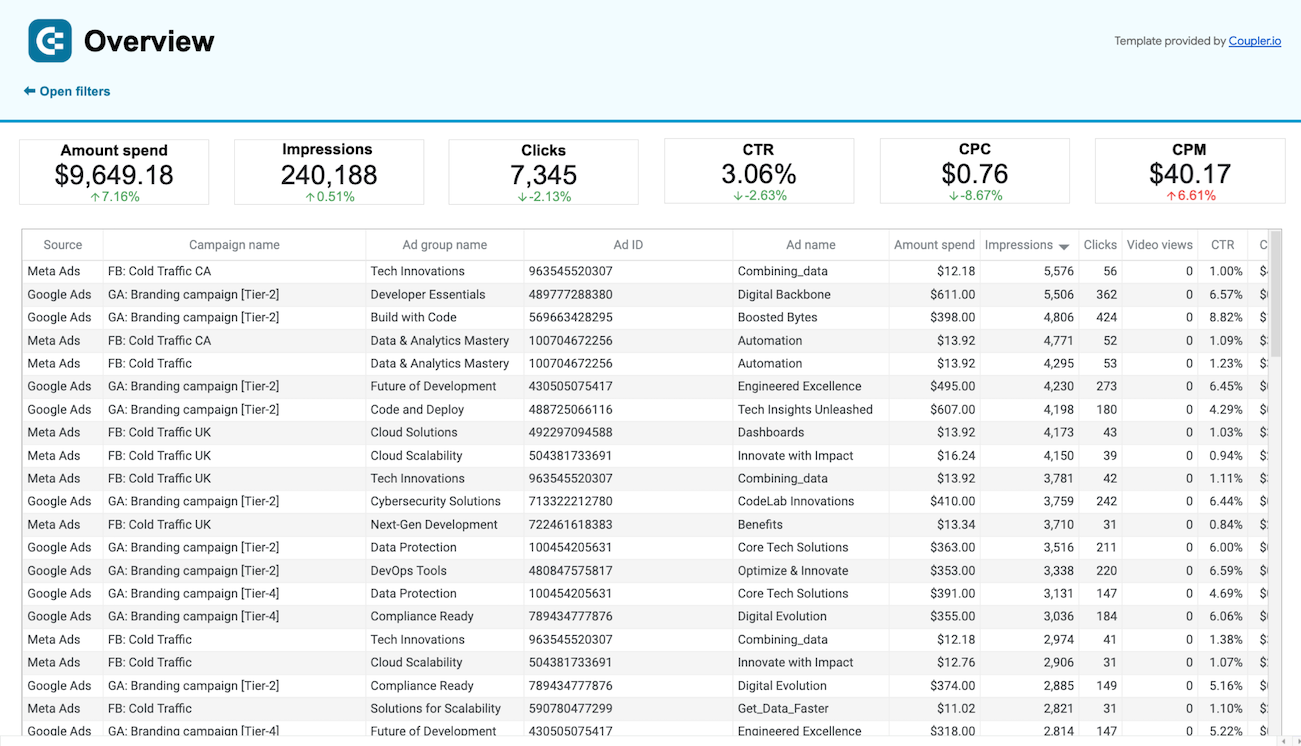
Multi-channel creatives performance dashboard
A multi-platform view isn’t just a nice-to-have; it’s essential, especially for agencies or multi-channel brands. Imagine repeating that process across multiple clients, countries, or teams. It’s messy, error-prone, and unsustainable.
Coupler.io’s multi-channel creatives performance dashboard fixes that. It gives you a clear, visual overview of creative performance across platforms in one place: no more switching tabs, decoding naming conventions, or syncing spreadsheets.

The multi-channel creatives dashboard consolidates campaign data from platforms like Meta, Google Ads, Bing Ads, and TikTok Ads into a single, clean interface designed specifically for ad creatives performance tracking. It combines key metrics such as impressions, clicks, CTR, CPM, CPC, and amount spent so you can evaluate your creatives without switching tools.
Here’s what you can do with it:
- Compare creative performance across platforms
See how your campaigns are performing side by side and identify trends by channel. - Spot top-performing creatives by CTR and clicks
Quickly identify which ads attract the most attention and drive the highest engagement. - Analyze cost-efficiency with CPC and spend breakdowns
View how much you’re spending per click, by platform and by campaign, and adjust your strategy accordingly. - Track performance trends over time
Visual charts help you monitor changes in spend, impressions, CTR, and clicks so you can catch issues early or double down on what’s working. - Use filters to dig deeper
Aggregate data from multiple sources and filter by platform to get focused insights on specific channels. - Explore a detailed campaign performance table
Review all key metrics in one place, including spend, impressions, clicks, CTR, and CPC, making it easier to assess performance and spot patterns. - Understand how visibility impacts engagement
Use dynamic charts, such as Impressions vs. CTR or Clicks over time, to see how your reach relates to outcomes. - Evaluate cost and performance together
Analyze how your ad spend and cost per click are distributed across time and platforms, helping you focus your budget where it delivers the most impact. - Get an overview by creative
Identify your best-performing creatives based on CTR and clicks, and determine which ones consistently drive results across channels.
The dashboard is available in two versions: Looker Studio and Google Sheets. Both are equipped with the Coupler.io connector, which automates data loading from your ad platforms. Check out how it works for yourself. Even better, use it to bring the kind of clear, time-saving insight your team will appreciate and your clients or execs will thank you for.

Multi-channel creatives performance dashboard in Looker Studio
Check the performance of advertising campaigns you run on different platforms and compare their outcomes to improve your creatives.


Multi-channel creatives performance dashboard in Google Sheets
View and compare the performance of ad creatives across multiple platforms in one place to identify top-performing visuals and messages.
Meta Ads (Facebook & Instagram) creatives dashboard
The Meta Ads creatives dashboard provides instant clarity on key metrics for your Facebook Ads and Instagram Ads campaigns in a single view.

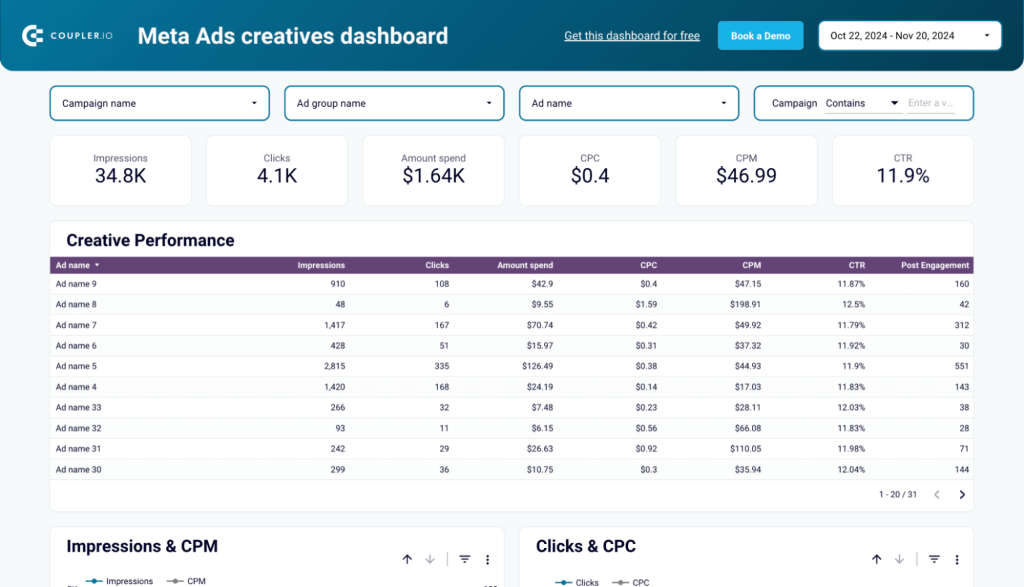
The dashboard helps you compare, prioritize, and refine your Meta creatives:
- Track spend dynamics over time to ensure your budget aligns with your campaign goals
- Spot top-performing creatives by engagement, conversions, and CTR using the detailed performance table
- Visualize click and CPC trends to detect engagement shifts or cost inefficiencies
- Assess creative impact over time with impression and CPM charts to measure reach and cost-effectiveness
The dashboard is available as a Looker Studio template with the Coupler.io connector, allowing you to load data from Facebook Ads Manager. Start using it today for a clear performance snapshot in seconds.
Google Ads creatives dashboard
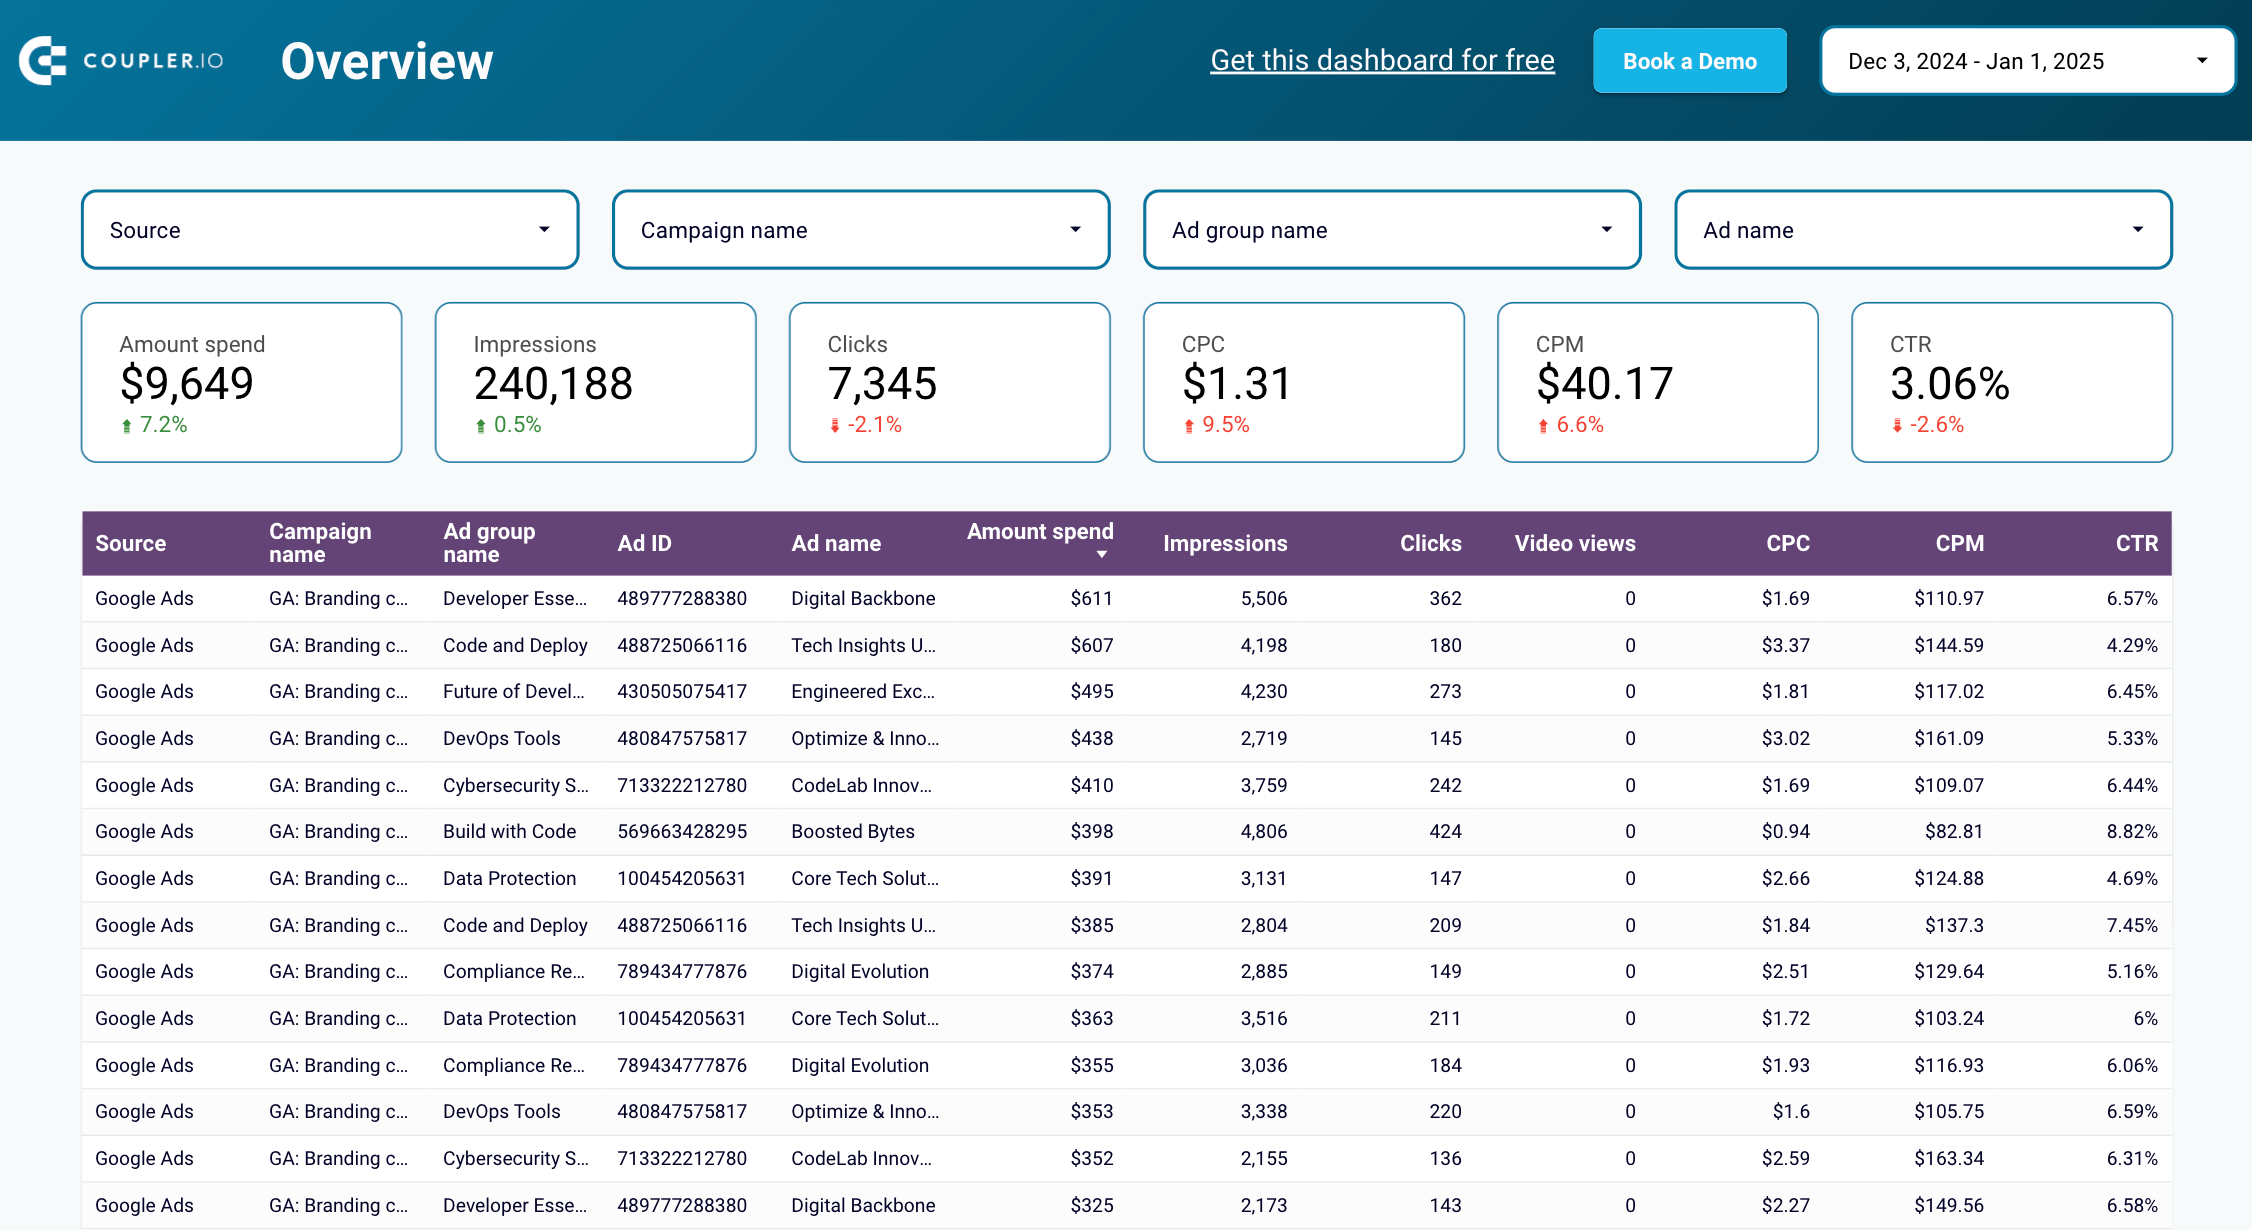
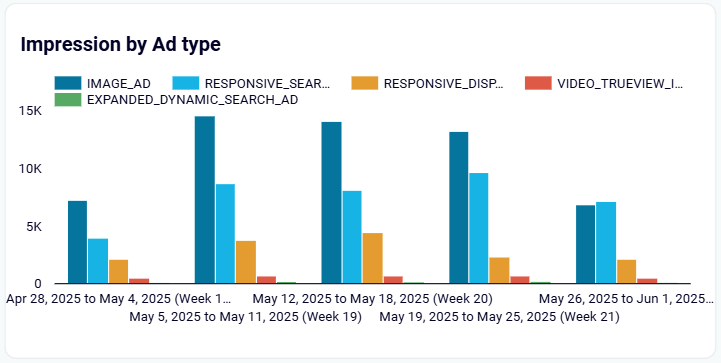
The Google Ads creatives dashboard addresses the challenge of accessing ad-level insights that are typically buried within Google’s campaign structure layers. It centralizes Search and Display creative performance data, making it easier to evaluate what drives actual conversions.
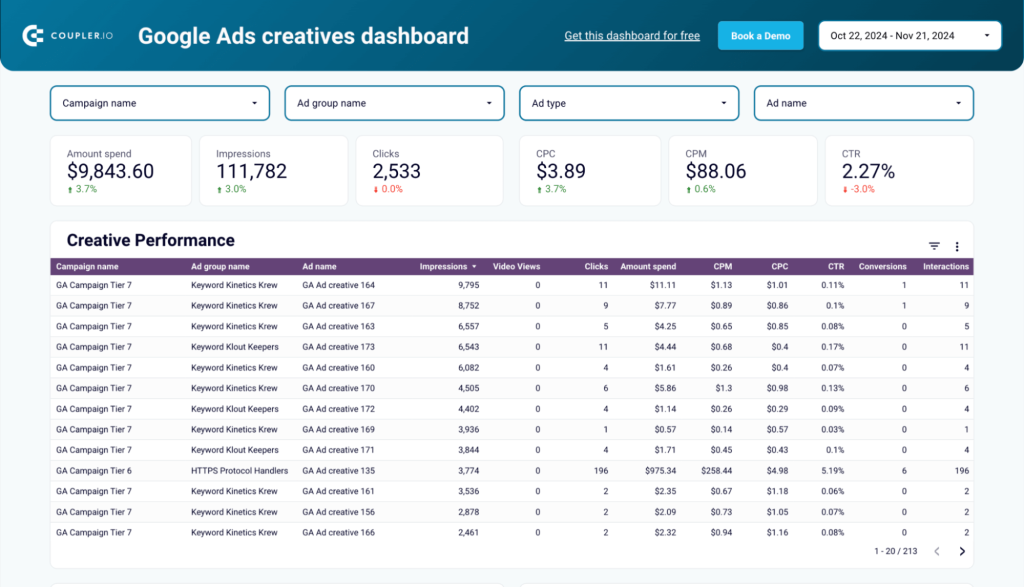
Use it to surface high-performing ads, monitor cost efficiency, and catch anomalies in performance over time. The dashboard also allows you to:
- Analyze how different creative types (Search ads, Display creatives, video content) perform against each other using standardized metrics.
- Track how individual creatives contribute to business objectives through detailed conversion metrics and performance attribution.
- Monitor CTR, CPC, CPM, engagements, and conversions to understand which creative elements generate the strongest audience response.
- Filter performance data by campaign, ad group, and creative type to optimize targeting strategies and creative approaches.
- Identify cost spikes, engagement drops, or unusual performance patterns through time-based trend visualization.
Refer to the instructions in the Readme tab of this Looker Studio dashboard template for guidance on loading your data. The Coupler.io connector will do the job – you only need to connect your Google Ads account.
LinkedIn Ads creatives dashboard
Designed specifically for B2B campaign analysis, the LinkedIn Ads creatives dashboard enables professional marketers to understand the performance of their creative assets within LinkedIn’s business-focused environment. This dashboard reveals insights into what resonates with professional audiences across different creative formats and targeting approaches.
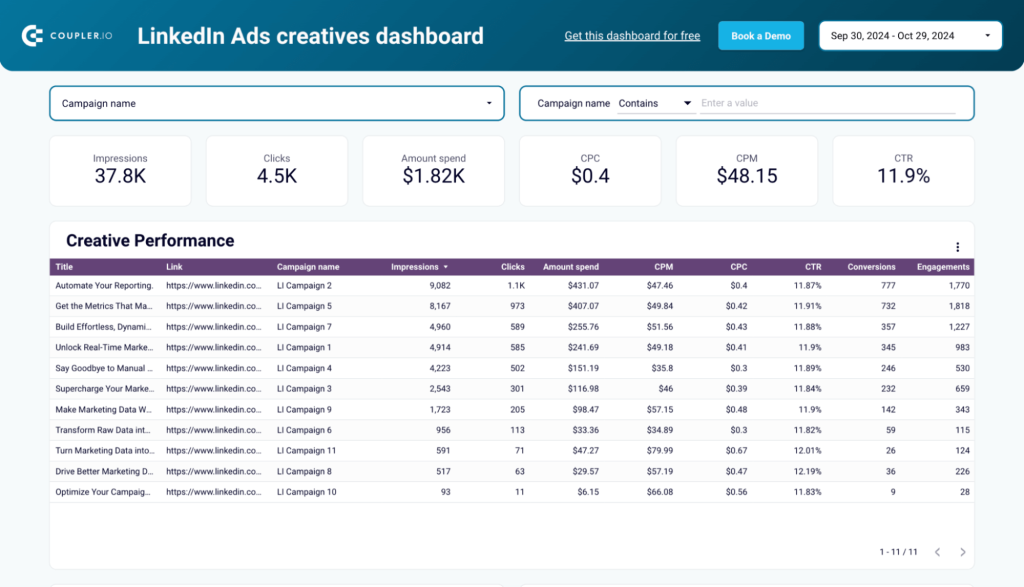
With this performance dashboard, you can:
- Track engagement patterns specific to business audiences, including CTR, conversions, and cost efficiency metrics tailored for B2B campaigns
- Compare performance between sponsored content, message ads, dynamic ads, and other LinkedIn-specific formats to optimize creative strategy
- Monitor how different creative approaches contribute to lead form completions and progression through professional conversion funnels
- Understand creative performance across different professional demographics, industries, company sizes, and job functions
- Track spend efficiency and CPC trends specific to professional advertising to ensure optimal budget allocation for business audiences
The dashboard is also available as a template in Looker Studio. Connect it to your data in under 5 minutes to enjoy instant insights into the performance of your ad creatives.
Key ad creative performance metrics
In this section, we’ll break down 8 key metrics that help you evaluate creative performance. You’ll get a quick snapshot of what each one tells you, how it behaves across platforms, and what benchmarks to aim for.
Note: Benchmarks vary across industries. Use these numbers as general guidance, not fixed targets.
Check out our dedicated guides on platform-specific metrics:
1. Impressions – Visibility and reach
Impressions refer to the number of times your ad is displayed on a screen. However, “shown” doesn’t always mean “seen”. A partially loaded image or a video below the fold can still be counted.
Still, impressions are useful. They help detect delivery issues early and give context to CTR and CPM.

Impression volume varies significantly across platforms. To give you a sense of scale, the average number of monthly impressions in October 2023, according to Databox, was:
- Facebook Ads: 250,700
- Google Ads: 42,870
- LinkedIn Ads: 54,070
These numbers help set expectations when evaluating creative visibility, especially if you’re running campaigns across multiple channels.
2. Clicks – Engagement indicators
A click shows interest, but not necessarily action. People might bounce before the page loads or click on the page accidentally. Still, it’s a strong early signal that your creative is attracting attention.
Track clicks alongside sessions in your analytics to understand real engagement.
3. CTR (Click-through rate)
CTR = Clicks ÷ Impressions. It’s a quick pulse check on how well your ad connects with your audience.
A higher CTR indicates that your creative is visually compelling, clearly messaged, and likely aligned with user intent.

Watch for specific decline patterns. Expert practitioners track CTR drops as early warning systems.
“When a creative’s thumb-stopping power starts to drop (watch for CTR or video watch rate going soft by 0.1-0.2 absolute points week-over-week), no headline rewrite or CTA swap can rescue it.”


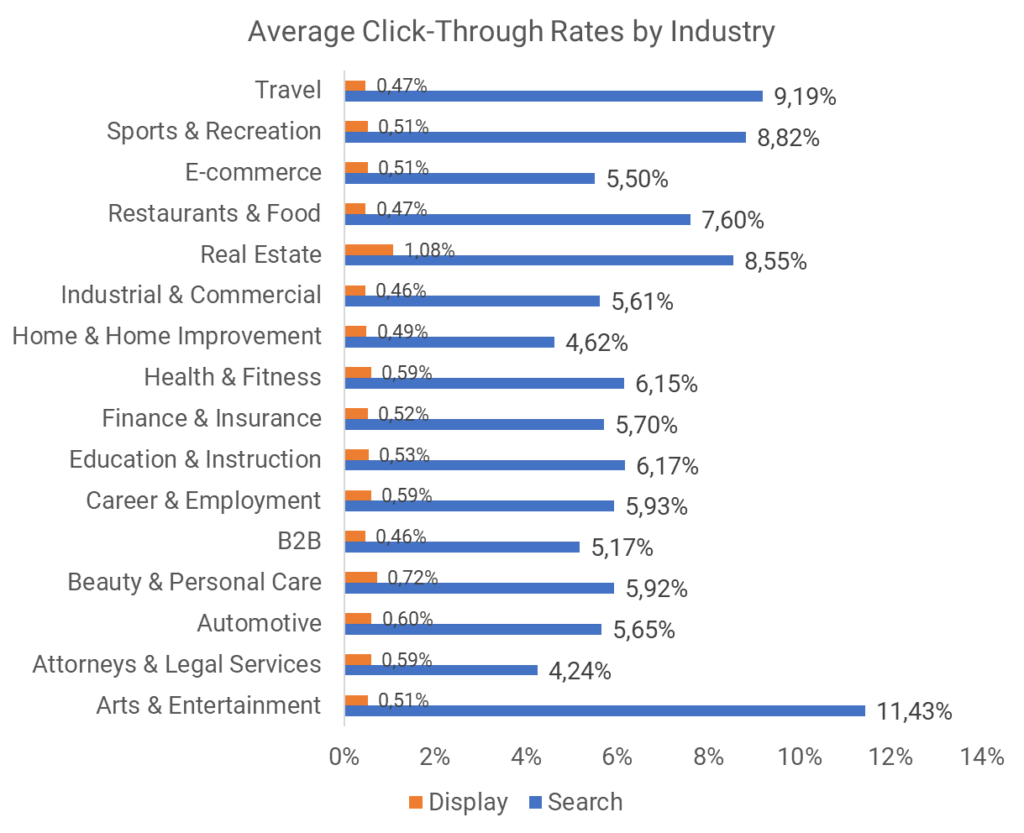
Benchmarks (CXL):
- Search Ads: 6.64% average CTR
- Display Ads: 0.57% average CTR
Any number above your industry benchmark is a strong sign of relevance.
4. Amount spent – Your budget in action
This is the total cost to deliver your ads over a set period. While simple, it serves as your baseline for measuring efficiency.
Tip: Daily spend can fluctuate slightly even with caps, as platforms optimize delivery across days. For example, in Google Ads, your daily budget or maximum CPC might be exceeded on high-traffic days and balanced out later. Meta does the same with daily budgets, adjusting spend across the week to stay within your overall budget. Use the PPC monthly budget dashboard by Coupler.io to monitor how much you spend on your ads across multiple platforms.
Monthly ads budget overview dashboard
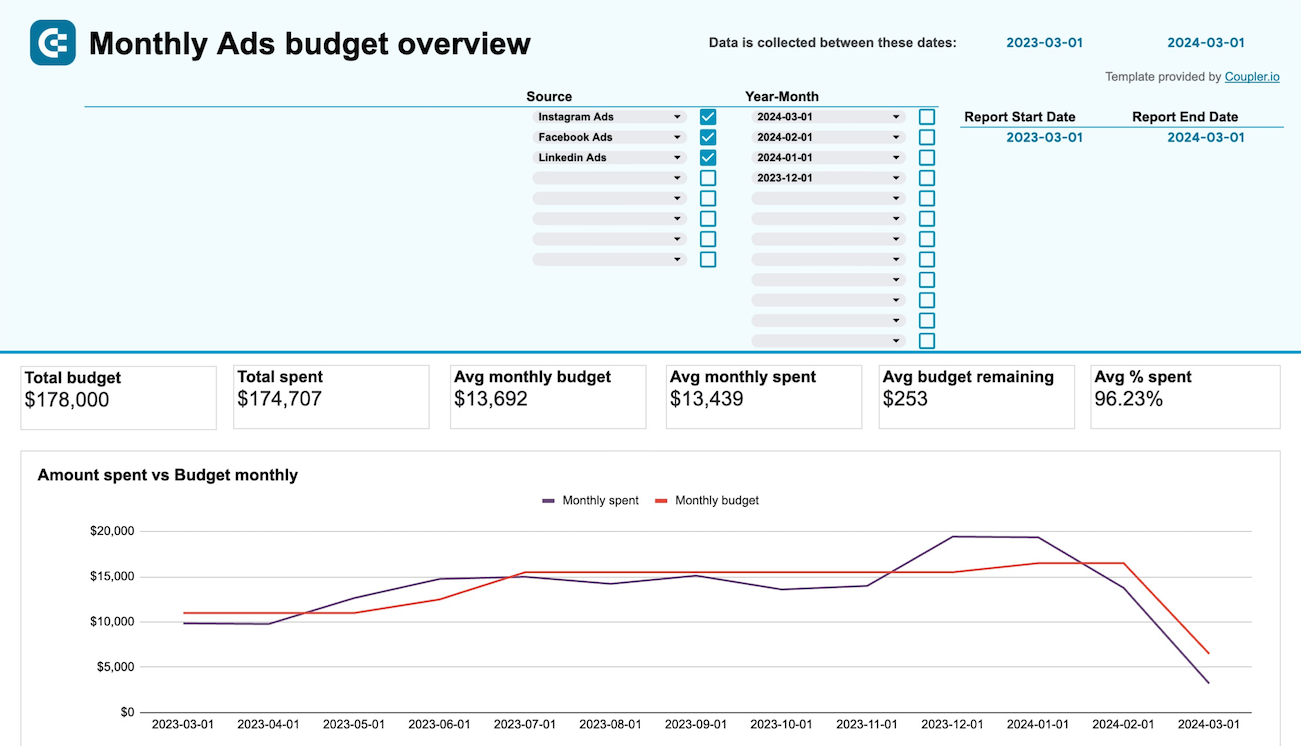
Monthly ads budget overview dashboard
Preview dashboard5. CPM (Cost per mille) – Cost for 1,000 impressions
CPM is your price for visibility. It tells you how much you pay for every 1,000 ad impressions. It’s common in brand awareness campaigns, where visibility matters more than clicks.
That said, not all impressions are fully visible. Some appear below the fold or only partially load. Google Ads, for instance, offers viewable CPM, where an impression only counts if at least 50% of the ad is visible for one second (or a few seconds for video).

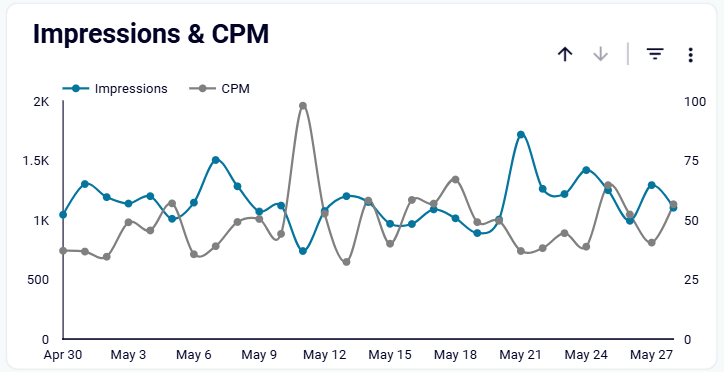
CPM is useful for reaching large audiences and testing creative at scale without overspending. Once you see what gets noticed, you can adjust your budget to focus on what performs best.
6. CPC (Cost per click) – What attention costs you
CPC, or cost per click, indicates the amount you pay for each user interaction. It’s the go-to metric for performance-focused campaigns.
In platforms like Google Ads, you can set a maximum CPC, which is the highest amount you’re willing to pay for a click. What you actually pay is typically lower and is shown as average CPC, which varies based on competition, ad relevance, and targeting.
Meta Ads use similar but slightly different CPC-style metrics.

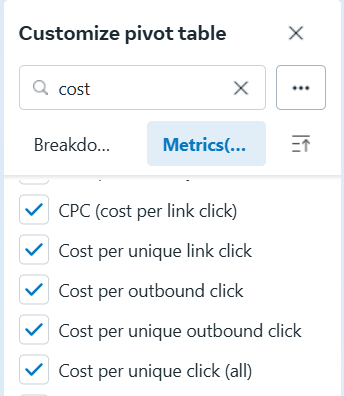
These are:
- CPC (cost per link click)
- Cost per unique link click
- Cost per outbound click
- Cost per unique outbound click
- Cost per unique click (all)
If your CPC is consistently high, the issue may not be targeting. It could be your message, creative, or call to action. Use CPC in combination with engagement and conversion data to troubleshoot what’s not landing.
7. Conversions – End-goal performance
A conversion is the action you care about most. It could be a sale, a lead form, a newsletter signup, or any other goal tied to your business. That’s why it’s important to know which creative helped drive the conversion. For instance, here is what it looks like in the Google Ads creatrives dashboard by Coupler.io:

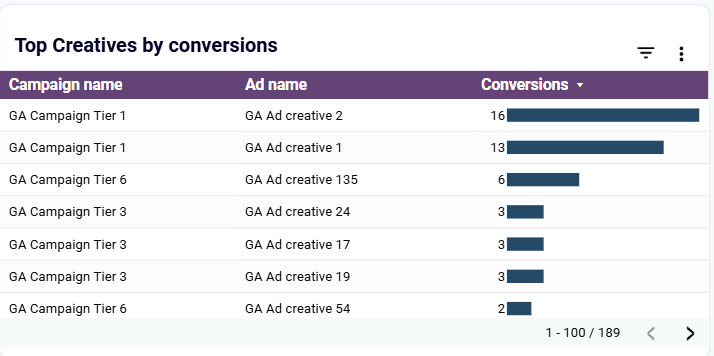
Conversions usually happen outside the ad platform, so they’re tracked through analytics tools or conversion APIs. They represent the culmination of the user journey and often determine the success of your campaign.
Depending on the platform, conversions may also appear as Results or Conversions.
8. Engagements – Signs of deeper interest
Engagement includes likes, comments, shares, reactions, scrolls, or plays. It shows that your ad didn’t just appear. It resonated. They reflect not just attention, but advocacy.
While conversions show commitment, engagement helps you see what resonates. Comments and reactions reveal emotional responses, helping shape messaging and creative direction.
With analytics tools, you can go even deeper. Metrics such as video watch time, scroll depth, and hover interactions reveal where users remain engaged and where you may be losing their attention.
When it comes to format, nothing beats video. According to Sprout Social’s social media statistics, 78% of people prefer to learn about new products through short video content.

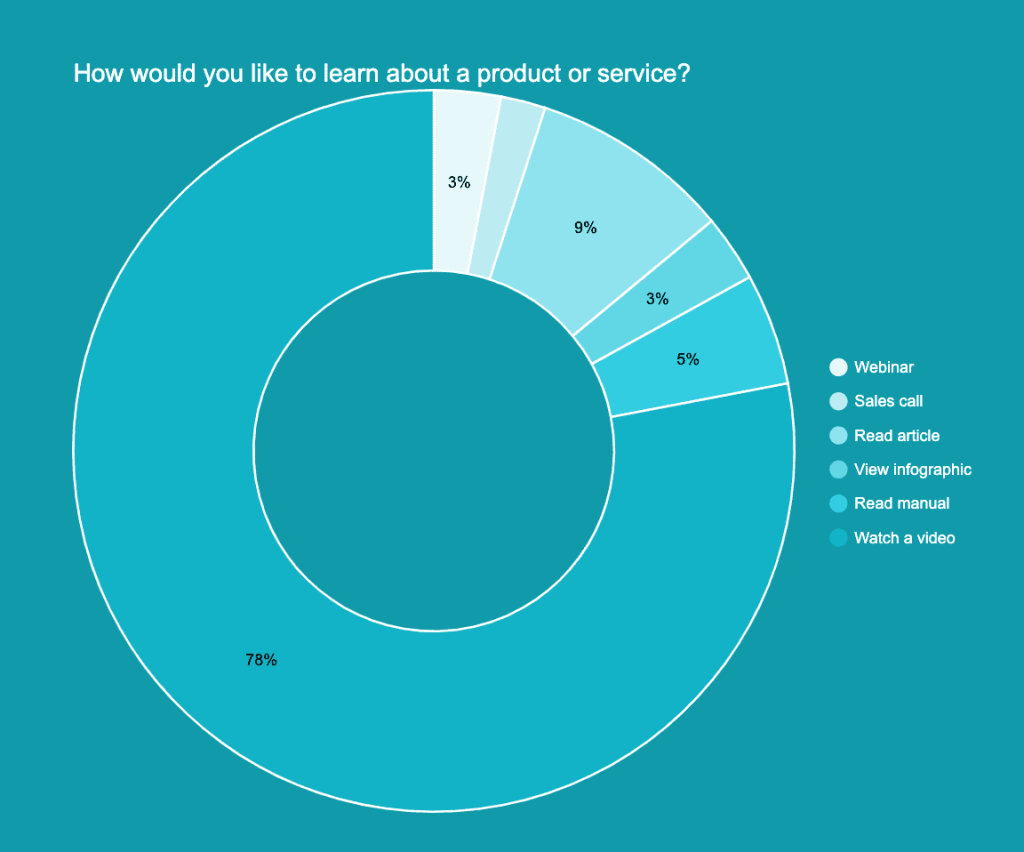
Additionally, 99% of marketers say video has helped users better understand their products or services, increased brand awareness (96%), generated leads (88%), and boosted website traffic (82%).
Yevhenii Tymoshenko’s testing approach proves this point:
“When we launched our photo editing product, we prototyped over 20 ad creatives with different ‘first frame’ visuals – think: brightly colored product in hand, dynamic before/after edits, real users, even unexpected animals with our software UI. Copy, CTAs, and offers stayed constant. Only that initial visual element changed.
Engagement difference between top and bottom performers were up to 4x, even when everything else matched. As a rule, creatives with a bold, emotionally-resonant or highly relevant image up front (often with a human face or striking color contrast) drove the highest CTR and, crucially, sustained that level as frequency grew.”
Use Coupler.io’s dashboards to track engagement more effectively
Coupler.io provides a ready-to-use dashboard that automatically aggregates engagement metrics from Meta, LinkedIn, Google, and other platforms into a single, intuitive visual view. It gives you a clear and consolidated view of how users interact with your creatives, without requiring you to switch between tools.
In addition to ad creatives performance analysis, Coupler.io offers dashboards for tracking other aspects of PPC advertising and marketing. Try it out for free with no credit card required.
Set up your dashboard with Coupler.io

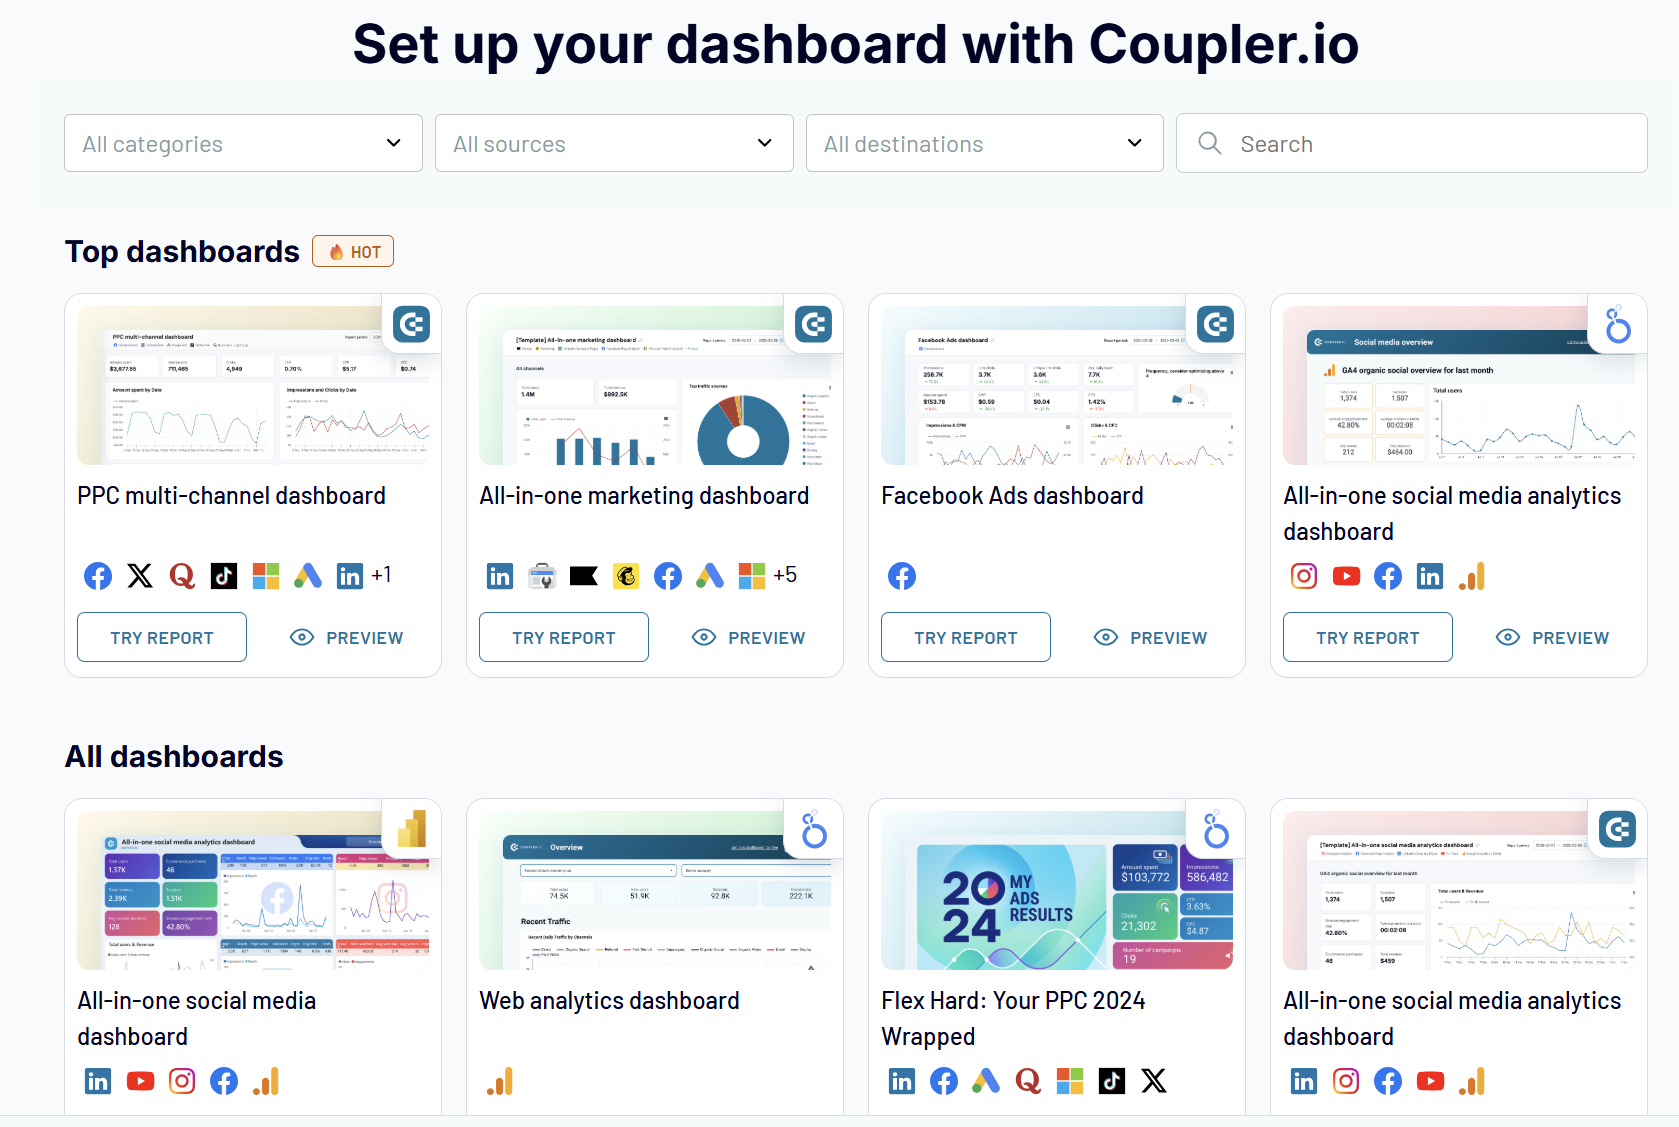
Set up your dashboard with Coupler.io
Get started for freeAI in performance creative tracking
AI is becoming a valuable ally in creative analysis. When used well, it helps advertisers save time, spot patterns, and make faster, data-driven decisions, especially when managing a high volume of ads or campaigns.
What AI can do
AI tools can automate some of the most time-consuming parts of creative analysis.
| What AI can do | Benefit |
| Tag/categorize creatives | Group by format or messaging automatically |
| Score by CTR/conversion | Focus on top-performing assets |
| Predict outcomes using history | Prioritize creatives worth scaling |
| Detect fatigue/performance drops | Take early action before budget waste |
This makes AI particularly helpful when you’re dealing with multiple creatives across different campaigns or platforms. Instead of starting from scratch, AI can guide you toward what’s worth your attention.
Real-world use cases
Tools like AdCreative.ai or Meta’s Advantage+ Creative are built to support this exact process.
Meta’s system, for example, automatically generates and tests creative variations, showing each user the version they’re most likely to engage with. In one case, PRESS Healthfoods saw a 40% increase in product sales and a 33% lower cost per purchase after using Advantage+ Creative with generative AI features compared to their usual campaign setup.
Some tools even generate reports that rank creatives by predicted ROI, helping you quickly see which ones to scale or retire.
The pros and caveats
AI can significantly reduce analysis time. Even when everything appears to be performing well, it’s not always clear where to start looking or what to test next. AI helps break that “analysis paralysis” by surfacing patterns that might otherwise go unnoticed.
That said, AI isn’t magic; it needs data. To make smart predictions, it relies on a sufficient amount of recent and relevant performance history. For example, Meta’s conversion-optimized campaigns may require a certain threshold, like at least 17 purchases on your site and 5 via Meta, to unlock their full learning potential. Some systems only look back 30 days, which means campaigns with low volume or irregular activity may not provide AI enough data to work with.
Explore our guide on why Facebook Ads not converting.
Turning data into action – how to improve your ad creatives to boost your performance
Tracking performance is one thing. Acting on it is what drives results. Here’s how to turn your creative data into meaningful next steps.
Spot what works and scale it
When you find a creative that performs well, don’t just leave it where it is. Scale it across channels that share similar audience behavior or funnel goals. A high-performing video on Instagram, for example, might do just as well on YouTube Shorts or TikTok if repackaged correctly. Modern scaling requires creative variety, not just budget increases.
“Scaling isn’t about finding one golden creative and hammering it. I load main ad sets with 15-30 winners at once. Meta’s allocation engine now favors ad sets with creative variety, dynamically shifting budget to what still converts while throttling fatigued assets.
Single-creative strategies caused our top ads’ costs to spike the moment they tired out. Since embracing variety, we see steadier CPLs, even as ad fatigue creeps up, because the machine always finds new ground to push.”

Optimize underperformers
If a creative isn’t delivering, start by reviewing targeting, format, and messaging.
A common issue is using the same creative across multiple ad sets with slightly different copy but overly narrow audiences. This limits reach and often results in a weak conversion volume. Watch for inflated metrics that don’t convert.
“Another signal to pause or audit creatives is a sudden spike in clicks or impressions, with conversion rates staying flat or even dipping. Nine times out of ten, this links back ‘partner networks’ on Meta… click spikes up to 60% on paper, but attribution reports showed a drop in qualified leads.
Our best-performing campaigns deliberately kept these expansion levers off. We’d rather hit a frequency ceiling and refresh creative, than burn budget on inflated vanity metrics.”
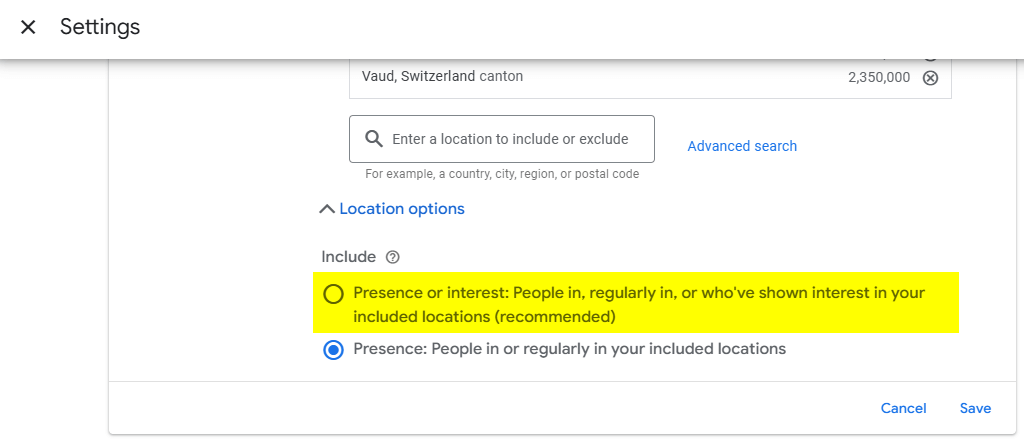
Try widening your audience with broader lookalikes, custom lists, and interest targeting. You can also expand your location settings, though options like Google’s “Presence or interest” can sometimes result in low-quality leads, so use them carefully.

Meta’s Advantage+ audience also allows Meta to go slightly beyond your original targeting.

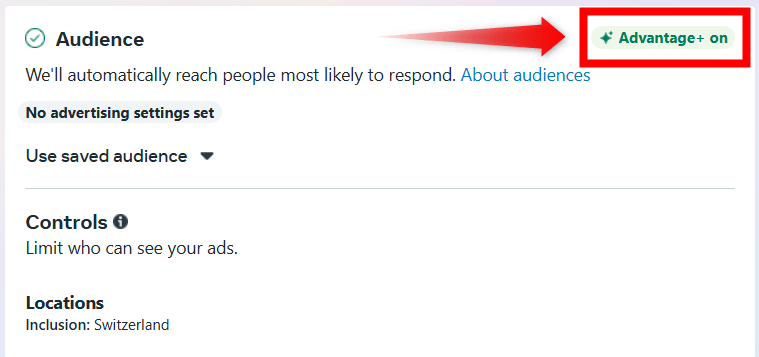
Unlike Google’s broader settings, this often performs well, especially when the algorithm has some past data to work with. Still, always keep an eye on quality and results.
Test hypotheses often
Time of day, placement, format, and messaging are all worth testing, even though they’re easy to overlook. Time of day, for instance, is a standard setting most advertisers forget to revisit. Testing could reveal simple wins. Don’t test blindly, but test often and with clear intent.
Attribute conversions by stage and channel
Not all conversions come from where you expect. Sometimes, a creative designed for engagement ends up converting. When that happens, consider shifting the campaign objective to match.
This is why it’s helpful to categorize creatives by funnel stage and analyze how they behave across platforms. Think of each channel like a player on a sports team. Some are great at closing; others build momentum. For example, if TikTok consistently drives high engagement but low conversions, use it to generate interest rather than push for sales.
Let AI help
Many tools now assist with creative insights. AI can flag performance issues early or suggest formats and angles worth exploring. Meta, for instance, now provides ad creative status before and during your campaign. Before launch, it can predict if a creative is likely to cause fatigue within the first 7 days.

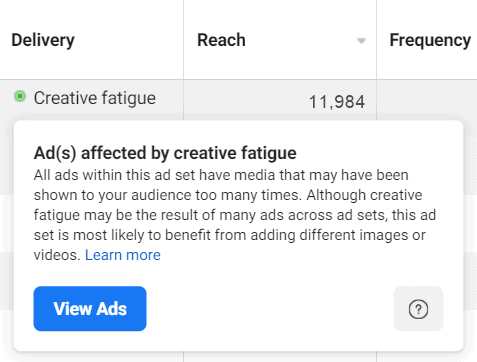
Once your campaign is live, Meta will alert you if your cost per result becomes more than twice as expensive as your past campaigns, labeling the creative with a Creative fatigue status.
Automate your creative reporting
Manual reporting may feel manageable at first, but as campaigns grow, so does the effort required to track them. Automating your creative reporting is one of the most effective ways to save time and focus on what actually drives results.
Tools to support creative tracking
Platforms like Creatopy are especially useful for advertisers managing multiple formats and creative specs. It’s a solid option for environments like DV360, where working with HTML5 display creatives can quickly become complex.
AdCreative.ai offers an additional layer by helping you generate and score creatives using predictive models. It’s a valuable tool for speeding up ideation and performance testing.
Coupler.io complements these tools by taking care of the reporting side. It connects your advertising data from multiple platforms and brings it into a single report or dashboard. As a result, it’s easier to track, compare, and analyze creative performance without jumping between accounts or spreadsheets.
Dashboards vs. spreadsheets
Excel remains a simple and powerful tool for basic analysis. However, it doesn’t scale well with large or frequently updated datasets. Despite its 1 million row limit, performance can start to lag after just 50,000 rows (especially if you’re using many columns or heavy formulas).
For enterprise-level or high-volume reporting, real-time dashboards are a better fit. They handle large datasets more efficiently and present performance visually, making it easier for teams and decision-makers to understand what’s going on at a glance.
Unlike spreadsheets, dashboards update automatically. You don’t need to manually refresh formulas, clean up columns, or worry about version control. Everything stays up to date and easy to read.
Bonus: Dashboards that talk to you
Some tools now offer more than just visual reports. With platforms like Coupler.io, you can now interact directly with its AI insights. These dashboards don’t just display data; they help you interpret it, highlighting trends, spotting anomalies, and providing you with recommendations.

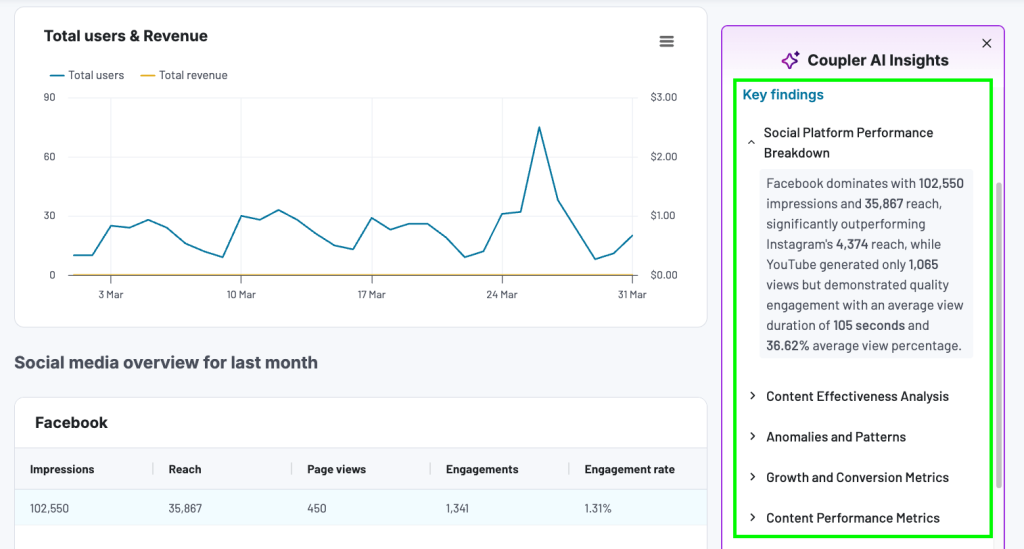
This kind of automation saves hours of analysis and helps you to act faster on the insights that matter, whether it’s tweaking a creative, refining your targeting, or reallocating spend.
Note: Coupler.io AI insights are currently only available for native dashboards, such as the PPC multi-channel dashboard, Facebook Ads dashboard, and more. Try out Coupler.io for free and use them right away!
Common pitfalls when creatives are not measured properly
Measuring creative performance sounds simple, but it’s easy to get it wrong. Without the proper context and tracking, even good creatives can be misunderstood. Let’s look at common pitfalls:
Attributing success or failure to creatives without context
There’s a common logical fallacy in advertising: assuming that creatives are solely responsible for how an ad performs. Many factors beyond the creative itself can impact ad creative effectiveness. As the saying goes, correlation isn’t causation. This flawed reasoning applies whether an ad performs well or poorly.
Advertisers may incorrectly attribute success to creatives that were never intended to last, or unfairly blame creatives for results influenced by entirely different factors, such as targeting, budget, or bidding strategy.
Asking for more budget without fixing the real problem
When campaigns underperform, the default reaction is often to increase the budget. However, if the issue isn’t money, throwing more money at the problem just fuels a vicious cycle of poor performance and misdiagnosis.
Optimizing for the wrong goals
Another frequent mistake is tracking the wrong conversions or relying too heavily on engagement-based actions. For instance, using top-of-funnel interactions as conversion goals can mislead optimization. Even worse, some campaigns are built around irrelevant conversions, leaving performance data disconnected from real business value.
The evolving role of creative assets in modern advertising
Creative assets were once reduced to little more than wrappers for a call to action or a marketing message. As people became overwhelmed by the sheer volume of ads, ad blockers didn’t just emerge; they became a necessity.
“LinkedIn and Google approaches differ with their nuances, but the principle remains: let platform algorithms do the heavy lifting, as long as you give them a strategic set of proven, varied assets to work with.”
Campaigns just stopped connecting. Messages lost their impact. Ads became easy to ignore, and their effectiveness dropped.
Sticking to features, advantages, and benefits (FAB) wasn’t enough. A music curator hears a sea of similar sounds until something unexpected cuts through. Ads today face the same challenge. When everything looks and sounds the same, nothing stands out.
To break through the noise, brands had no choice but to rethink how they connect with their audience. The answer came through creatives that sparked emotion and built trust.
Creative performance is not subjective—back it with data
Creatives don’t exist in a vacuum. Their performance is closely tied to your broader business context: seasonality, audience shifts, platform changes, and more. That’s why tracking creatives in isolation rarely gives you the complete picture. Always pair key performance indicators with related signals such as placements, audience types, and funnel stages, to better understand what’s driving results.
AI won’t replace your creative strategy, but it can significantly speed up how fast you learn what works. Make sure your performance dashboards help you connect the dots. They should combine raw metrics with AI-generated insights in a way that enables you to act with clarity.
Most importantly, creative optimization is an ongoing process. Test, track, refine, and repeat.