

Often, the data you load into Power BI may not be immediately ready for analysis — it might contain inconsistencies and errors or simply be in the wrong format. As a result, you may need to transform the data before using it to build visuals for the report.
But how do you transform data in Power BI?
Here’s the complete tutorial covering various methods, including an option to transform data efficiently without performance issues.
Ways to transform data in Power BI
In Power BI, you have several options for transforming data. You can use Power Query, the built-in tool that lets you extract, transform, and load data or use the DAX (data analysis expressions) formulas to perform transformations. You can also use platforms like Coupler.io to transform data before loading it. Here’s an overview of the options you have:
- Power Query editor – It offers a graphical interface to preview the connected data model and perform transformations such as sorting, filtering, merging, and shaping data. All these steps are converted into M language code, which is used to query the data source.
- Power Query M language – You can directly edit the query in the M language code for advanced transformations. This method enables you to perform operations that may not be possible using Power Query’s graphical interface. However, it may not be suitable for users without coding skills.
- DAX formulas – This is not exactly a data transformation feature in Power BI, but you can use DAX to perform calculations and aggregations on the existing data models.
- Coupler.io – It’s a no-code reporting automation platform that provides Power BI data connectors to 60+ popular apps. The platform also includes a data transformation module, which helps you modify the data before loading it in Power BI. This lets you optimize the performance of your report as data transformation occurs outside of Power BI.
Let’s go through each of the methods one by one.
Transform data with Power Query Editor
Go to the Home tab and click Transform data.

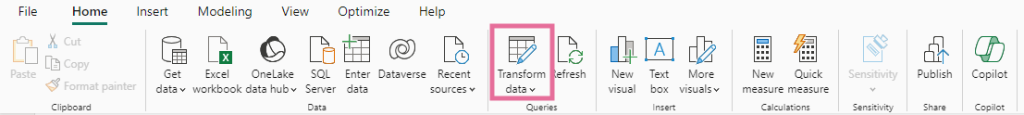
This will open the Power Query editor interface in a popup window.
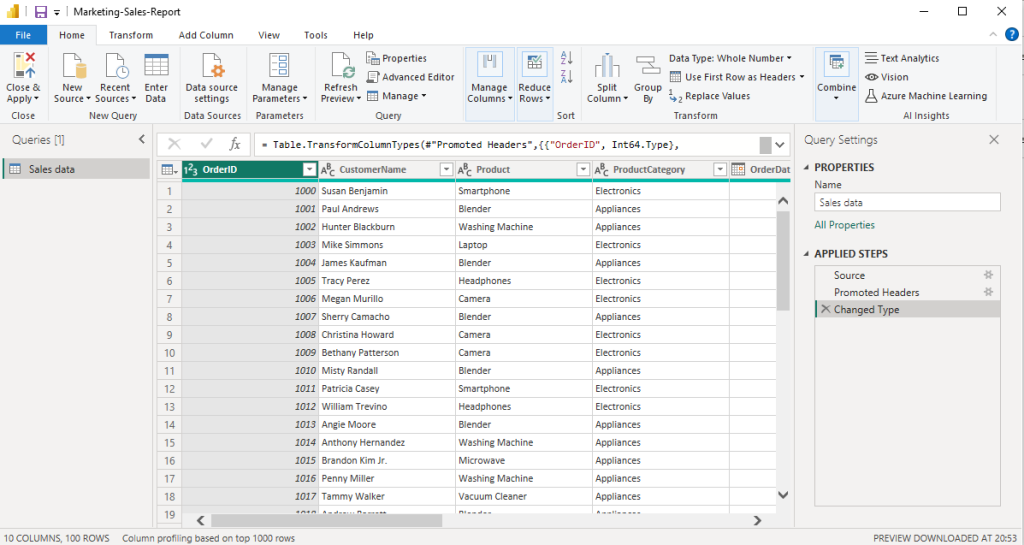
It will display a preview of data from the select query, along with various options to manage and transform the data in the ribbon. Each action you perform is recorded in the Applied Steps section on the right, where you can delete or edit a specific action.

You can also access this interface by selecting the Transform data option when connecting a new data source to Power BI.
Now, let’s see how to transform data in Power BI on a sample sales dataset.
Change table/dataset name
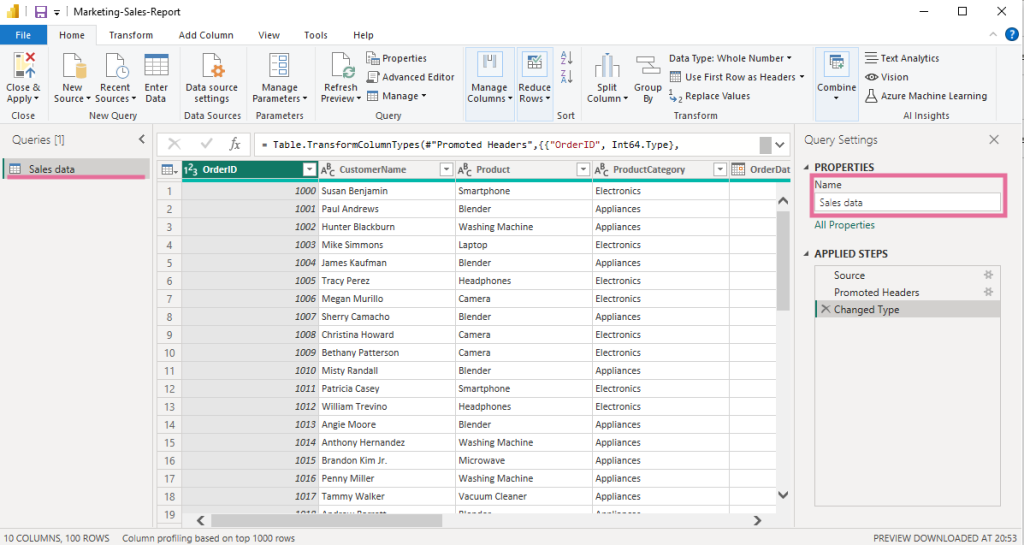
Let’s say the table name is not easy to understand, and you want to change it.
To rename the table, double-click the name in the left-side Queries section. You can also specify the new name in the Properties > Name field on the right side.
Rename columns
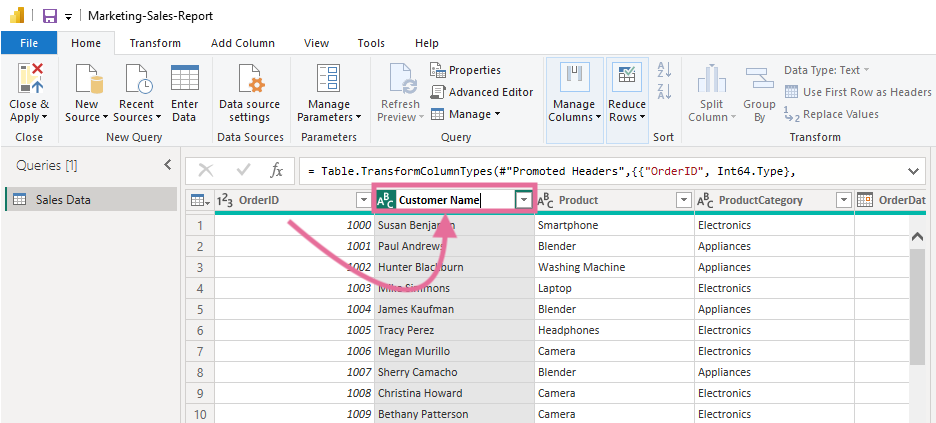
It’s very simple — double-click the column name and enter a new name. Press the Enter key or click anywhere else on the screen to save changes.

Remove columns
Often, the dataset contains unwanted columns, which could make the data panel messy. You can remove them from the Power Query editor interface.
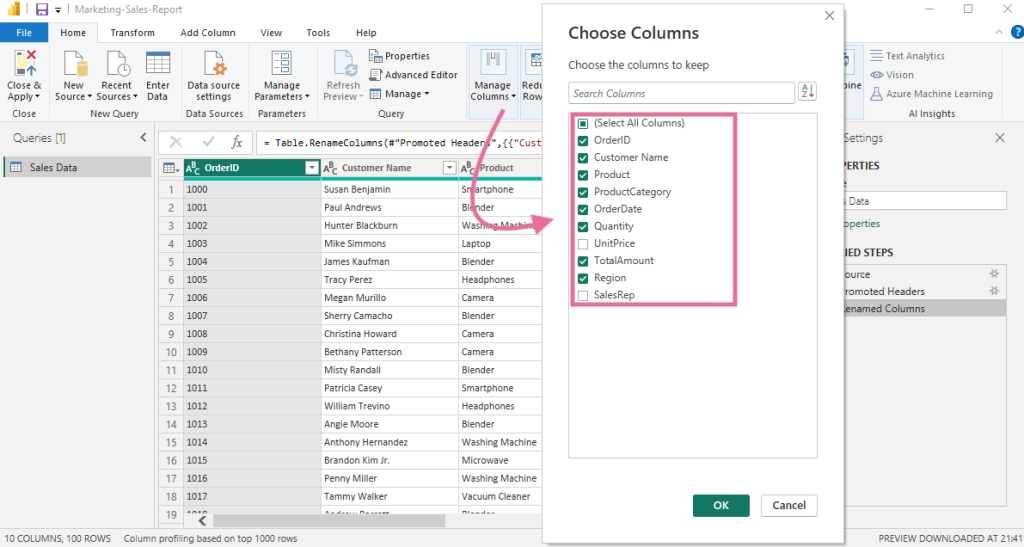
In the Home tab, select Manage Columns, and you’ll get two options:
- Choose columns – Select the columns to keep in the dataset
- Remove columns – Remove the select column or other columns from the dataset
For example, we’ve selected a few columns to keep in our dataset.

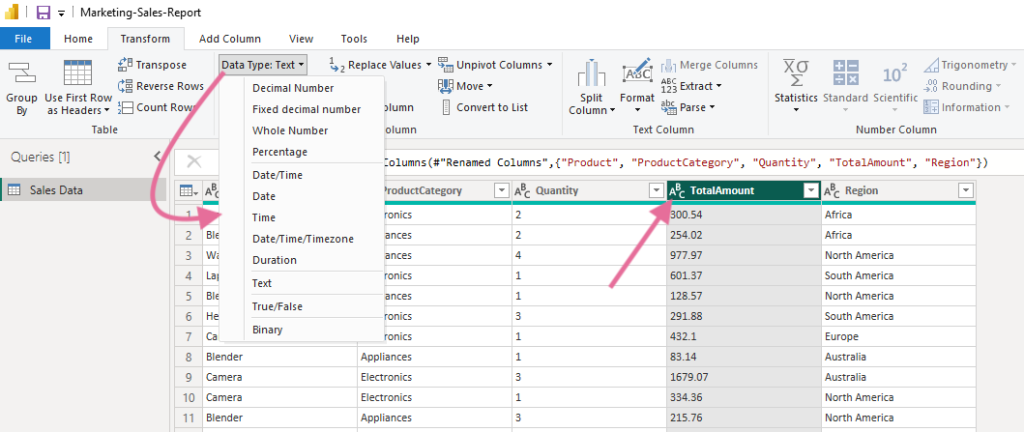
Change data type
Incorrect column formatting is common in Power BI while importing flat files like CSV. For example, the numerical values may get formatted as text by default, which does not allow you to perform calculations.
You can change the data type from the Transform tab in the ribbon. You can also click the data type icon on the left of the column name and choose the correct data type from the list.
In this example, we changed the data type of the Total Amount column from Text to Decimal.

Pivot columns
You can pivot columns to transform values into new columns and summarize data. First, select the column you want to pivot and click Pivot Column in the Transform tab. Then, select the column for the values to summarize and click OK.
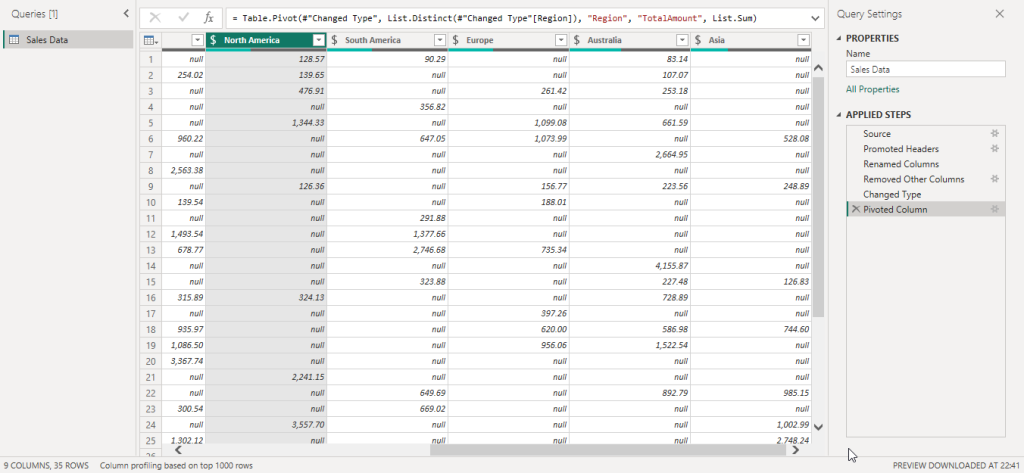
In this example, we pivoted the Region column to summarize the sales amount data.

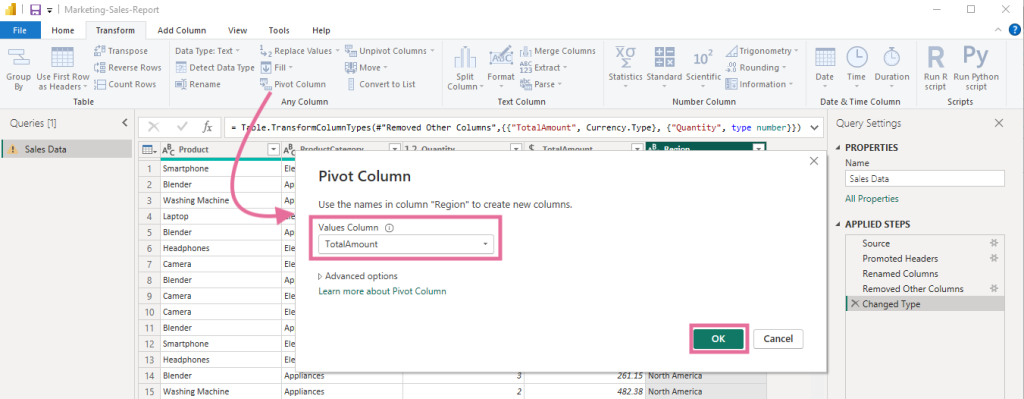
It will create new columns from the values of the pivoted column and summarize the data.

In the same way, you can use the Unpivot Columns option to translate columns into attribute-value pairs.
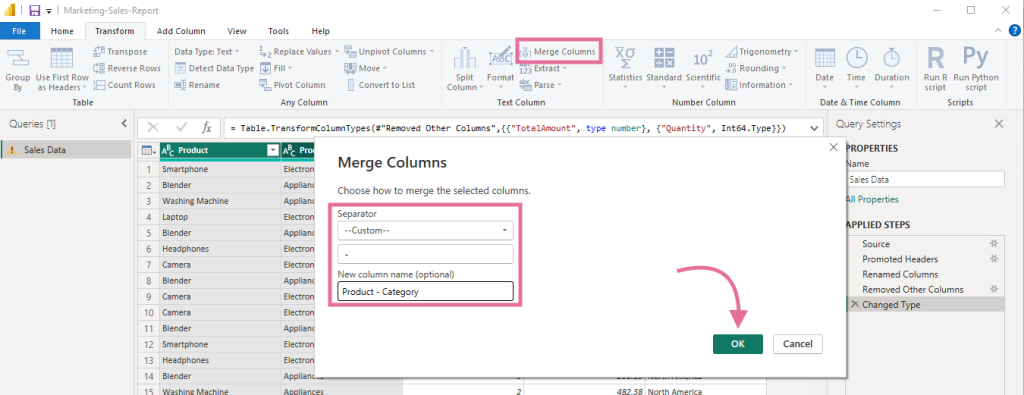
Merge columns
You may want to merge multiple columns to combine related data or simplify analysis.
To do this, select multiple columns you want to merge (by pressing CTRL), go to the Transform tab and click Merge Columns. Then, select the separator you want to use between the column values, enter a name for the merged column, and click OK.
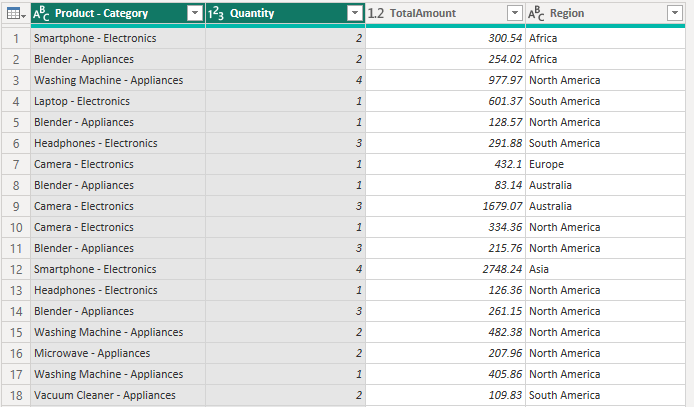
For example, we have merged the Product and Product Category columns here.

Here’s what the merged column looks like:

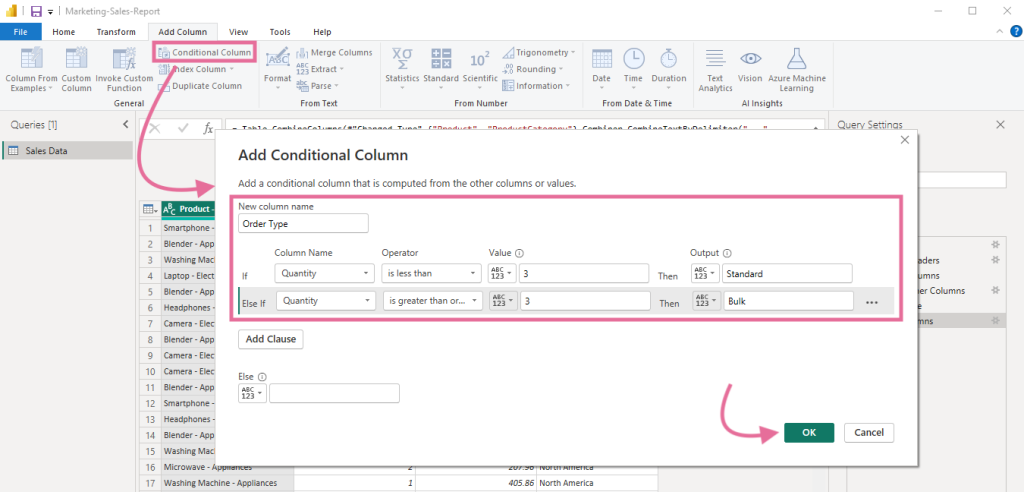
Create a new conditional column
You can do this from the Add Column tab in the Power Query interface.
Suppose you want to add a new “Order Type” column that differentiates standard orders from bulk orders based on the product quantity values. Click Add Column > Conditional Column, enter a name for the new conditional column, set conditions based on other columns and assign values.
Click OK to save.

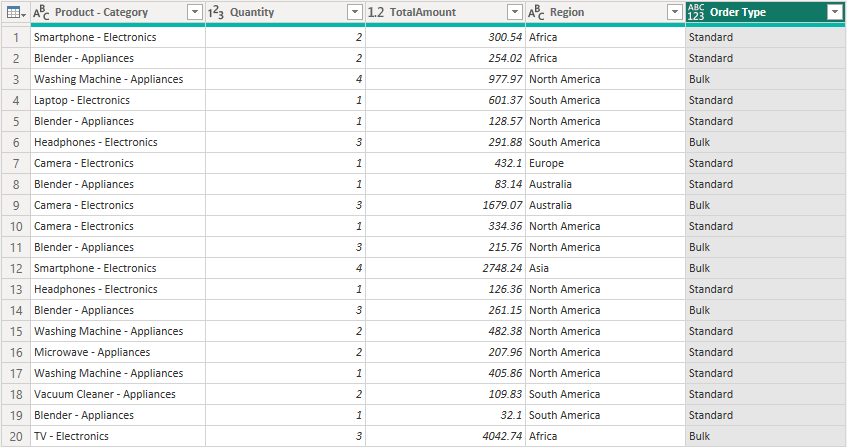
As shown below, a new column will be added based on the set conditions.

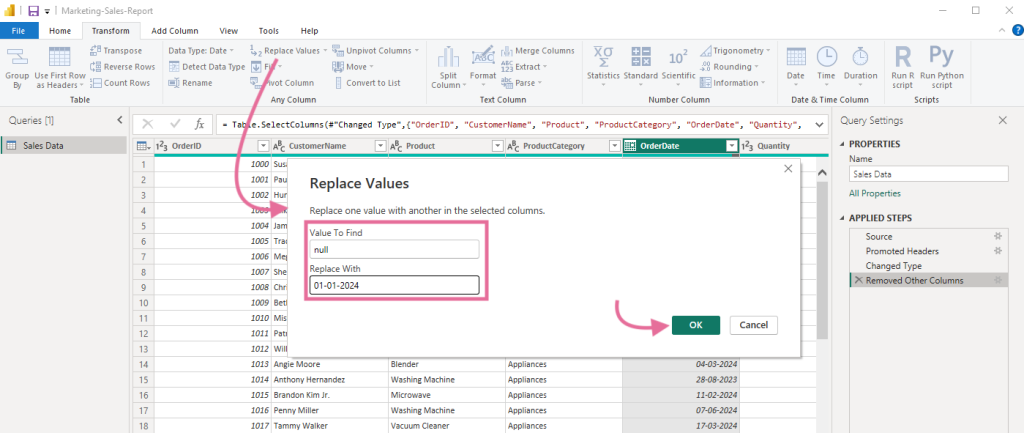
Replace “null” values
Let’s say the dataset contains “null” or empty values, which you want to replace with a default value. You can do this by using the Replace values option in the Transform tab for the selected column.
In the Value to Find field, enter “null” and enter the value to replace.
In this example, we replaced the missing order date (which is “null”) values with a default date.

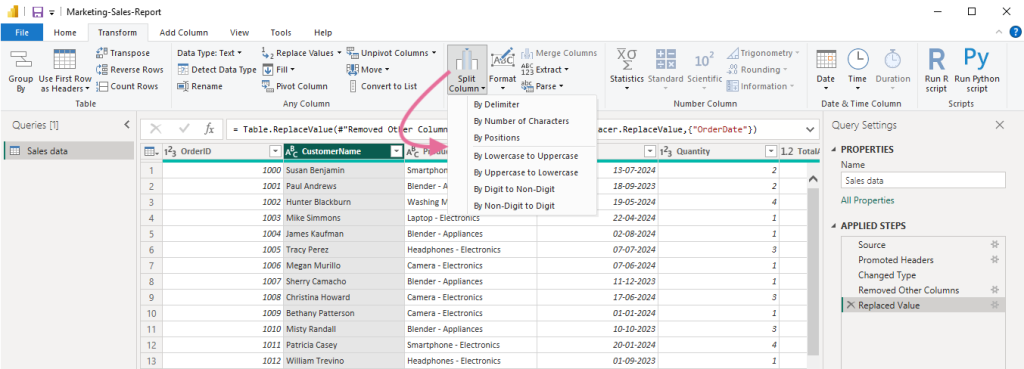
Split columns
Suppose the dataset has a column containing multiple combined values you want to split into multiple columns.
For example, here we have a single column for Customer Name that contains both first and last name. We can split this single column into two separate columns: First name and Last name.
To do this, go to the Transform tab, click Split Column, and select By delimiter. You can choose other options that meet your requirements.

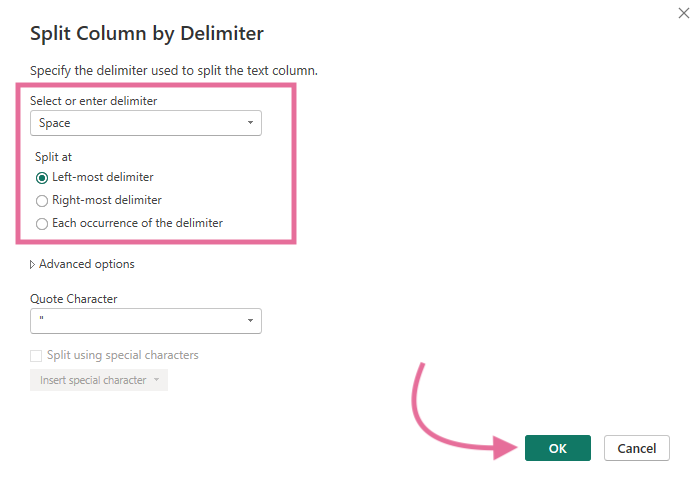
Select the delimiter to split the text. (It’s space in our example)
You can choose to split the column at the left-most, right-most, or at every occurrence of the delimiter.
Click OK to split the column.

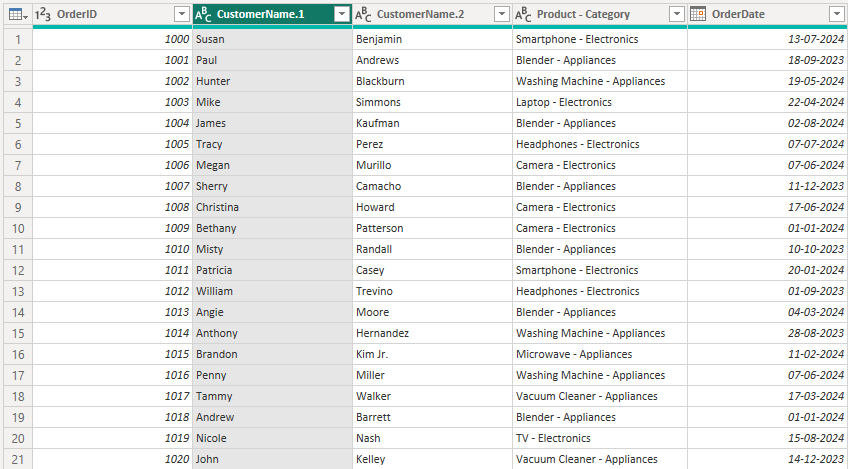
You can see the Customer Name column has split into multiple columns for the First Name and Last Name.

Filter rows
You can filter the data in Power BI to display only the rows that match specific conditions. To do this, click the drop-down icon next to the column name and choose Filters.
For example, let’s say we want to filter the sales dataset to include orders with an order total of over a certain value.
Click the drop-down icon next to the column name, and select Number Filters > Greater Than.

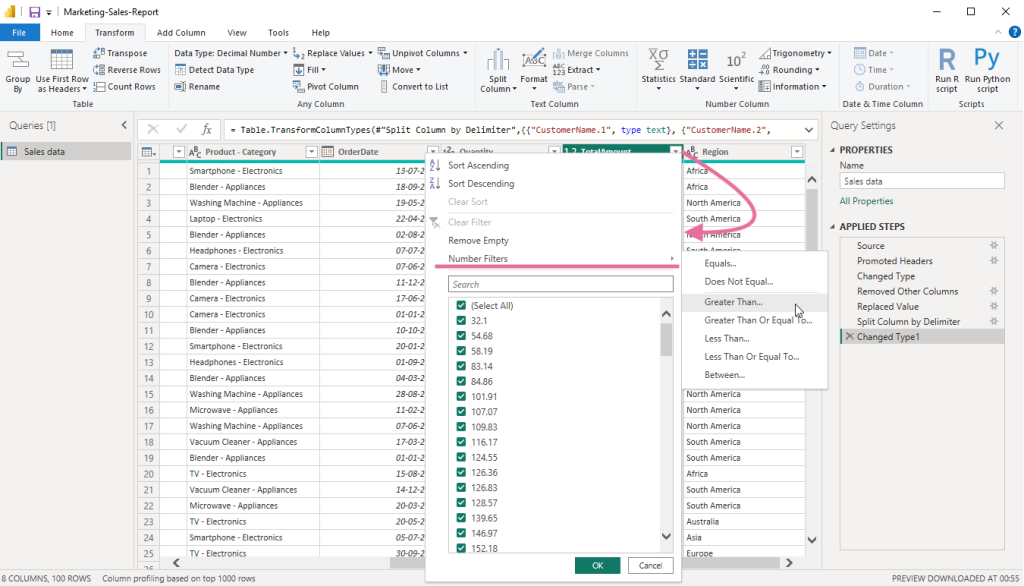
Define the conditions to filter the data, which is Greater than 100 in our case.
Click OK.

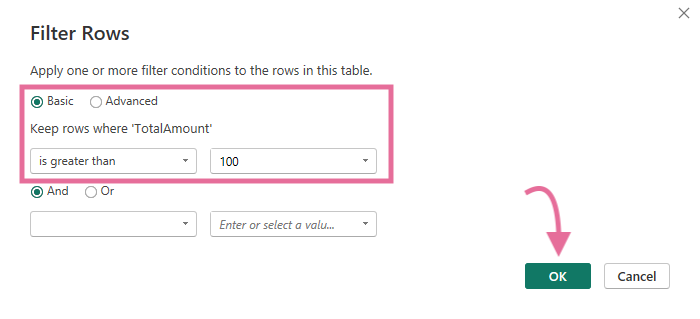
The dataset will now display only the rows matching the filter condition.
Data transformation using Power Query M
Every action in the Power Query editor is converted to M language, which is used to query data. You can view and modify this query through an advanced query editor to connect to a data source and transform data.
In the Power Query Home tab, click Advanced Editor.

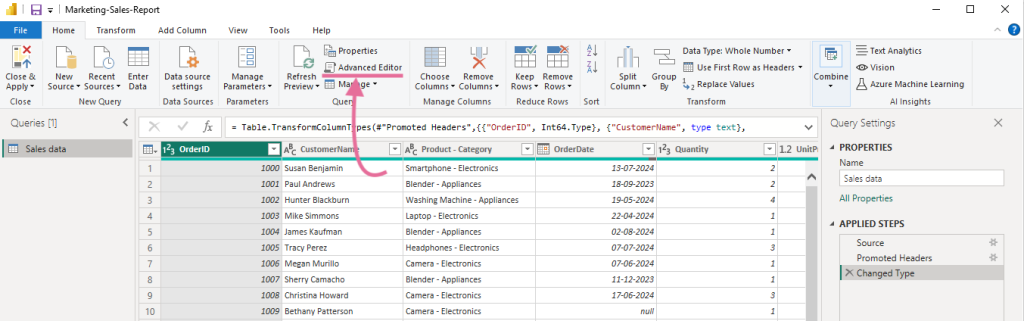
The query editor will display the code for the current dataset in M language.
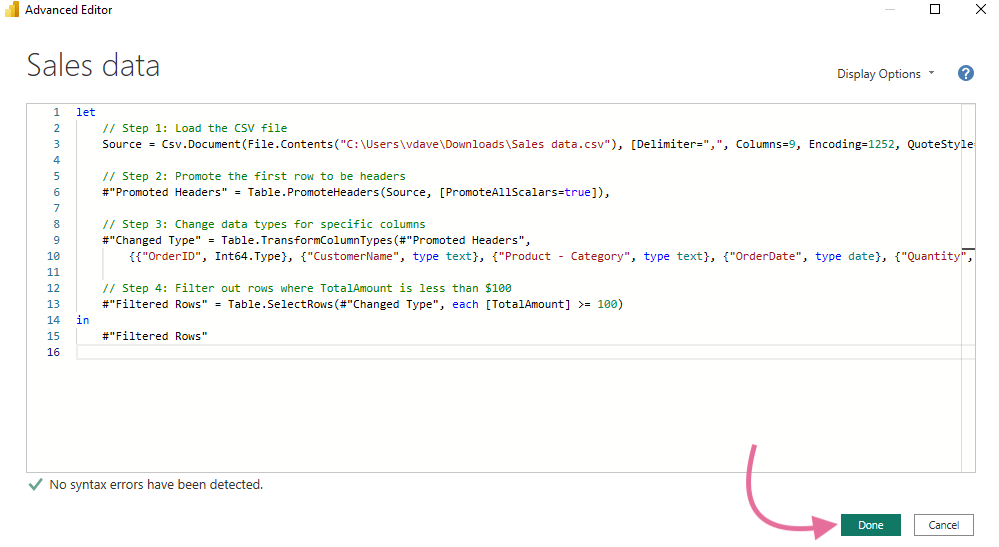
Modify the code to meet your Power BI data transformation needs.
For example, here’s a basic query code that loads the local CSV file, changes data types, and applies a filter:
let
// Step 1: Load the CSV file
Source = Csv.Document(File.Contents("Path to CSV file"), [Delimiter=",", Columns=9, Encoding=1252, QuoteStyle=QuoteStyle.None]),
// Step 2: Promote the first row to be headers
#"Promoted Headers" = Table.PromoteHeaders(Source, [PromoteAllScalars=true]),
// Step 3: Change data types for specific columns
#"Changed Type" = Table.TransformColumnTypes(#"Promoted Headers",
{{"OrderID", Int64.Type}, {"CustomerName", type text}, {"Product - Category", type text}, {"OrderDate", type date}, {"Quantity", Int64.Type}, {"UnitPrice", type number}, {"TotalAmount", type number}, {"Region", type text}, {"SalesRep", type text}}),
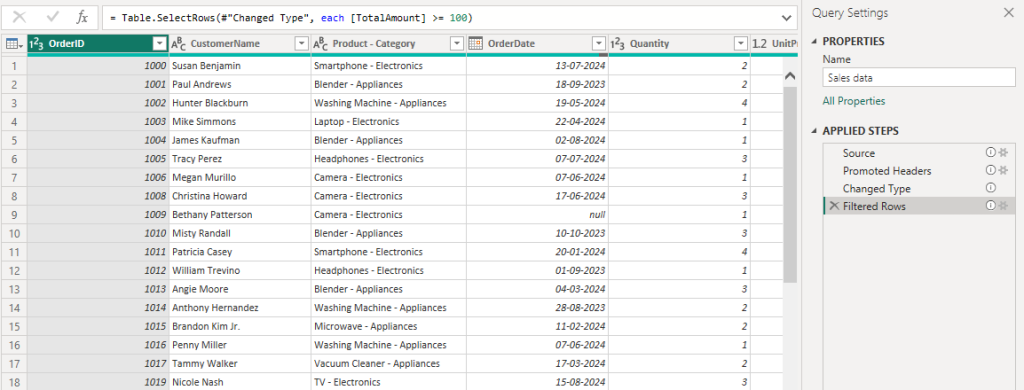
// Step 4: Filter out rows where TotalAmount is less than $100
#"Filtered Rows" = Table.SelectRows(#"Changed Type", each [TotalAmount] >= 100)
in
#"Filtered Rows"
Then, click Done to run the query.

On a successful run, the data transformation steps will be applied. You can verify the results through the data preview and the Applied Steps section on the right.

Data transformation using DAX
In Power BI, you can use DAX formulas to create new calculated columns or measures for existing data models by using various functions and logical operators.
You can perform a wide range of data transformations using DAX. Here are some common ones:
- Split text by a delimiter
- Apply conditional logic – f.e., use IF and SWITCH
- Use aggregations – SUM, AVERAGE, MAX, and MIN
- Leverage time intelligence, such as date extraction from DD-MM-YYY
- Handle missing data by replacing it with default values
…and more
Let’s look at a quick example to help understand this better.
Suppose you have a sales dataset with a “Product – Category” column containing both product and category names. In this scenario, you can use a custom DAX formula to create a new column and extract the product name.
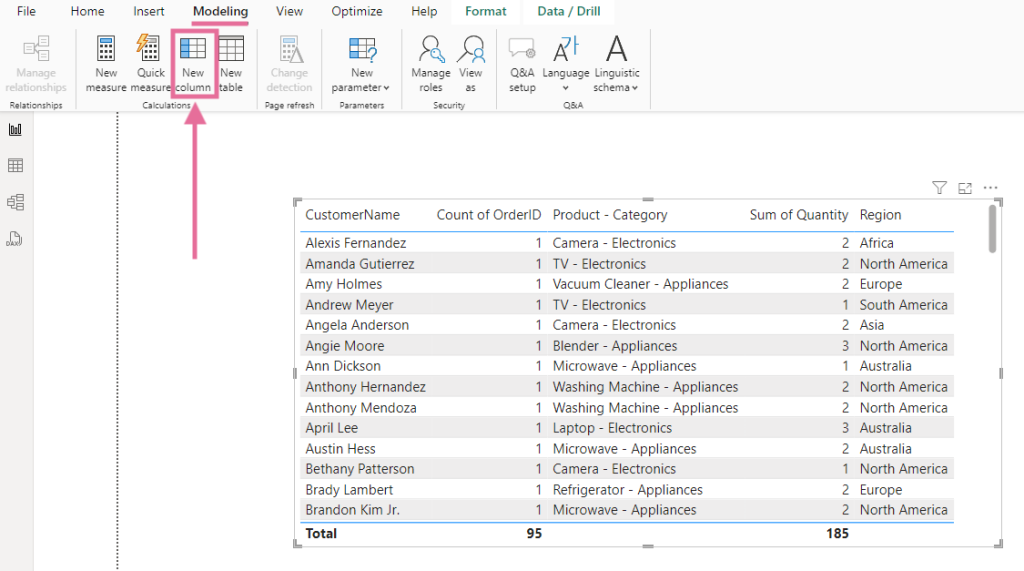
In the Power BI report editor, navigate to the Modeling tab and click the New column.

In the formula bar, enter the DAX formula for the new column. For example, here, we used the following to extract the product name in a new “ProductName” column:
ProductName = LEFT(‘Sales data’ [Product - Category], FIND(“ “, ‘Sales data’[Product - Category]) - 1)

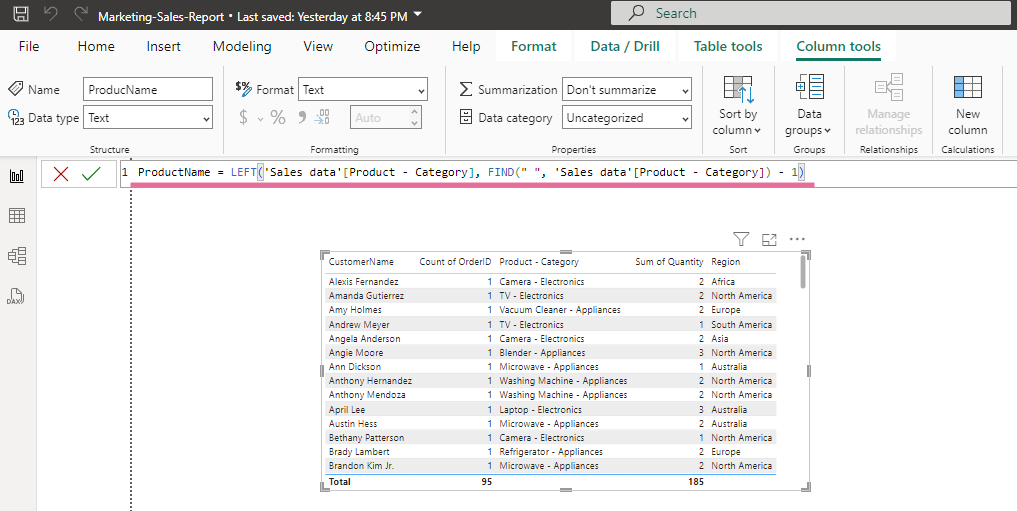
Press the Enter key to save the column. It will create a new column for the product name extracted from the existing column.

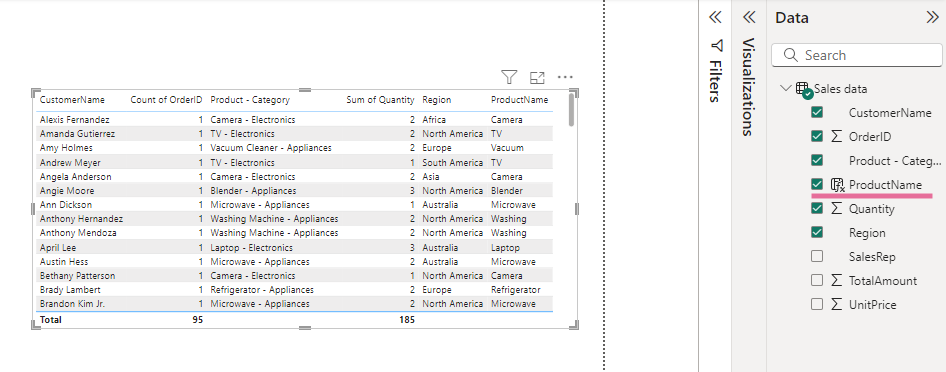
You can modify the formula to include functions and logic as per your data transformation needs.
When your dataset is ready, you can focus on building various visualizations. For inspiration, see our blog post with Power BI dashboard examples.
Performance issues using Power Query & DAX
Each data transformation feature in Power BI operates locally, meaning the data is first loaded into the memory, and then each action is performed. The process consumes the system’s resources on each data refresh, negatively affecting its performance.
These drawbacks are more noticeable when working with large datasets or performing complex transformations.
You may experience:
- Increased refresh time for the report
- High consumption of CPU and memory
- Overall, poor reporting experience
One better option is to deal with the transformations before loading the dataset into Power BI. This can help you manage large datasets and perform complex transformations without affecting the reporting performance.
Data should be transformed as far upstream as possible and as far downstream as necessary.
- Roche’s Maxim of Data Transformation
How to transform data before loading it in Power BI?
You can use Coupler.io, a reporting automation platform, to connect to popular apps and extract, transform, and load data into Power BI.
To start using it, select the data source in the form below and click Proceed.

Sign up for a Coupler.io account (no CC required) to set up the data importer. You can then follow the onscreen instructions to connect the data source or multiple sources.
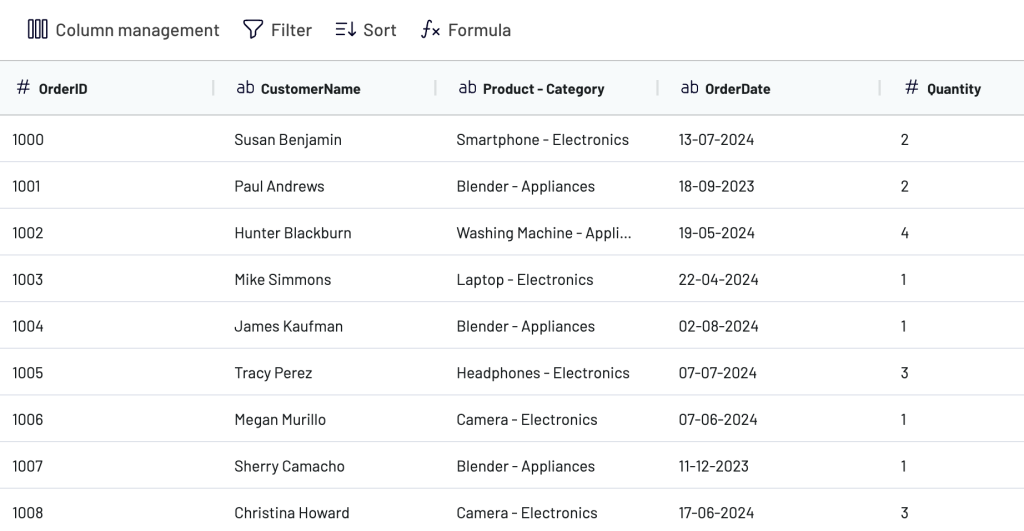
The importer allows you to preview data from each connected source. It also provides various options to transform and format data from a user-friendly interface (more on that later).

Once it looks good, generate an integration URL and use it at Get Data > From Web in Power BI Desktop to load the transformed data.
In addition to 60+ ready-to-use Power BI integrations, Coupler.io allows you to create custom ones. Learn how you can connect API to Power BI without coding.
You can also set up a schedule for the importer to refresh data automatically, as often as every 15 minutes. This helps you keep your Power BI dashboard always up to date, showing the latest data.
Data transformations available in Coupler.io
The platform provides you with all the necessary options to clean and organize data.
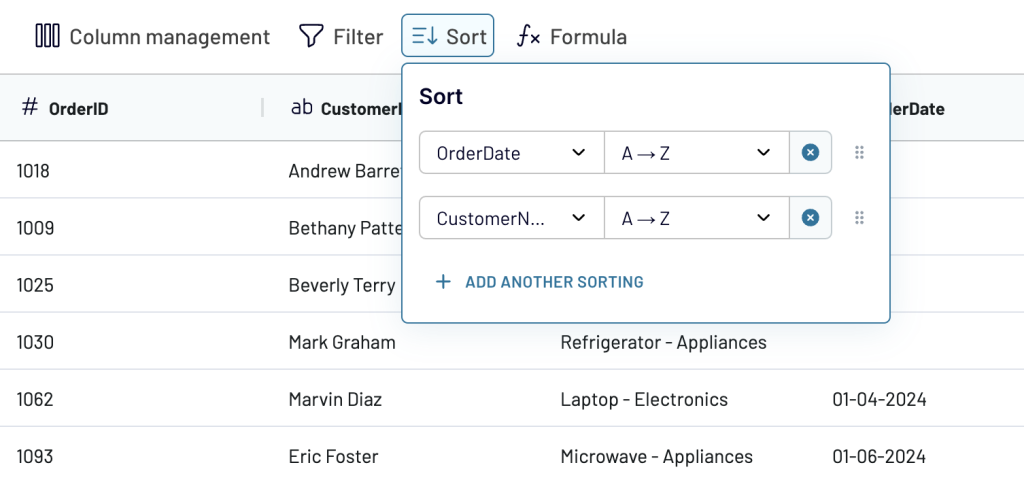
Sort data
You can select a column to sort data in ascending or descending order, as well as add multiple columns and arrange them to specify the sorting priority.
In this example, we sorted the sales data by order date in ascending order, followed by customer name.

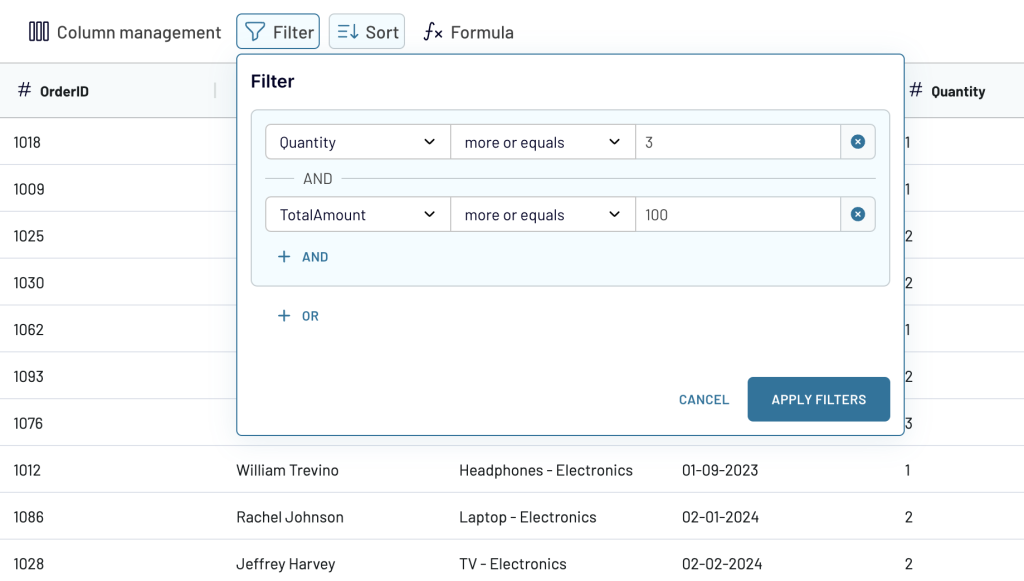
Filter data
Define conditional logic to filter the dataset to show matching rows. It also supports multiple conditions with AND/OR operators to filter metrics and dimensions.
Here, we used two filters with an AND operator between them, meaning only the rows matching both conditions will be displayed.

Manage columns
You can efficiently organize columns in various ways:
- reorder
- hide
- rename
- split
- merge
- add new columns
- change data type
Let’s say you want to change the position of a specific column in the dataset. Click and drag the column to the desired place by using the hamburger icon next to the column name.

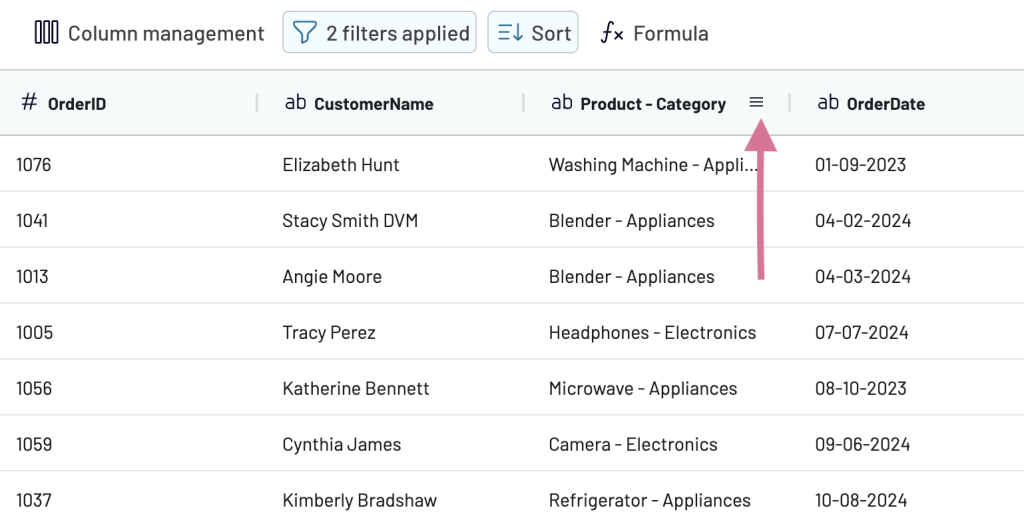
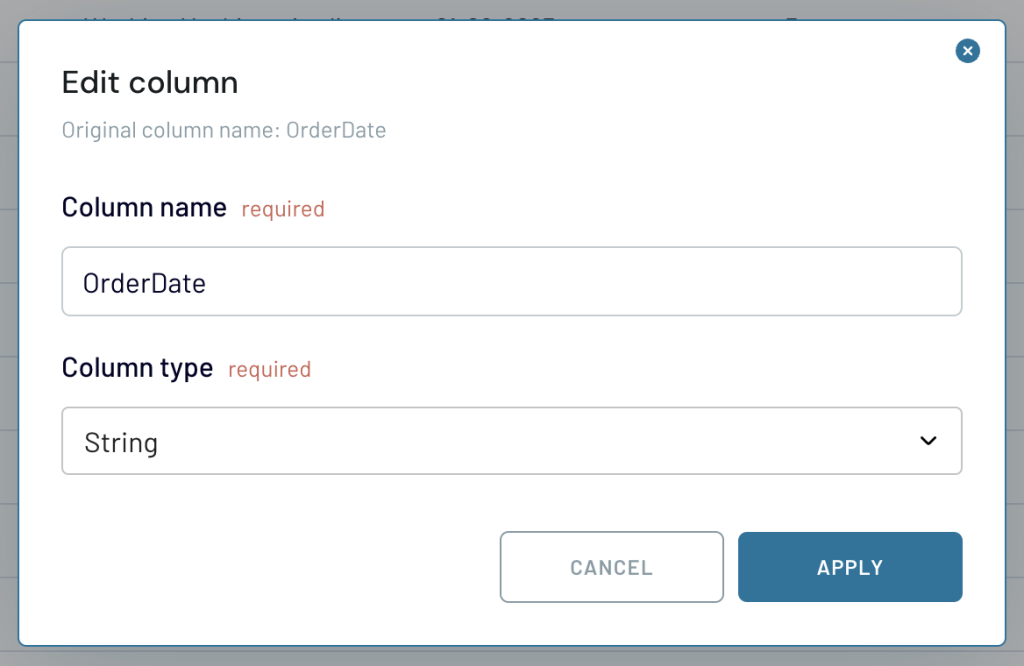
Click the hamburger icon to perform more actions, like hiding or editing the column. You can also find options to change the column name or data type in the Edit column.

The Column management option lists all the columns in the datasets with their visibility status, i.e., hidden or visible. You can also directly hide/show the columns from there.
Create new calculated columns
They can be added using formulas based on existing fields. The supported formulas include numerical, logical, date & time, and string functions and operators.
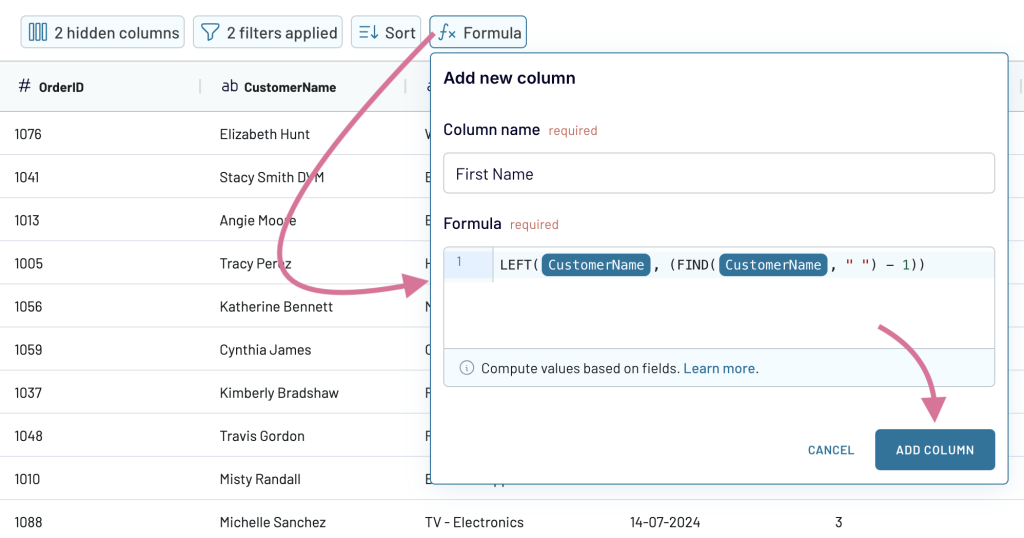
To create a new calculated column, click the Formula option and enter a name and formula. For example, here’s a custom formula that extracts the first name from a column containing the customer’s full name:
LEFT({CustomerName}, (FIND({CustomerName}, " ") - 1))

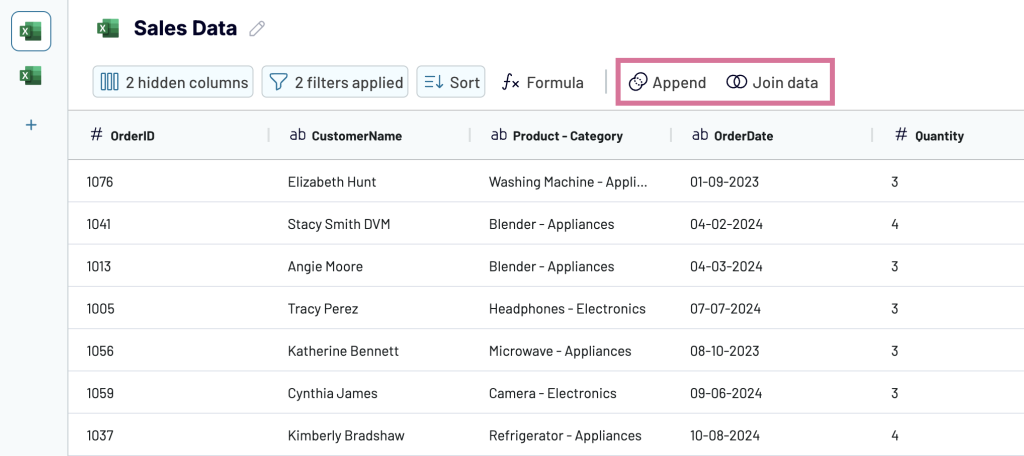
Combine data from multiple sources
The data merging options will be displayed when you connect two or more data sources to the importer:
- Append – It’s useful to merge data sources with similar structures but different records. It expands the dataset vertically, i.e., new records are added.
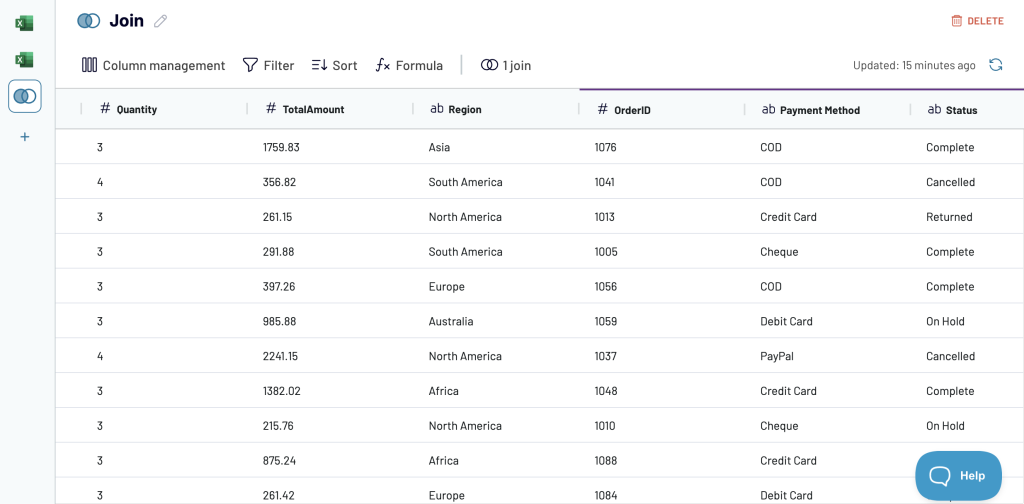
- Join data – It’s useful to merge data sources that share at least one column in common. It expands the dataset horizontally, i.e., new columns are added.

For example, we have two datasets: one containing order sales data and another with order status and payment method information. We can merge these datasets using a join operation based on the common field of OrderID.

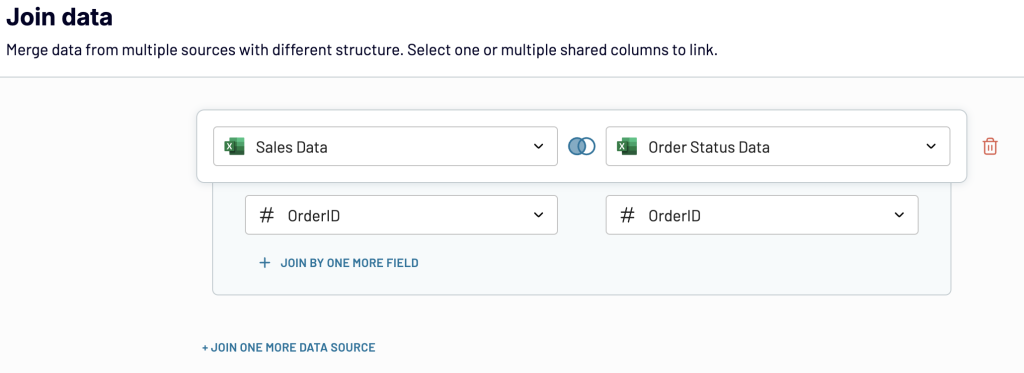
It will combine both datasets horizontally, matching the OrderID column between the datasets.

In the same way, you can link all your sources, combine data from them into one dataset, and carry out data transformations. This eliminates the need for multiple data sources, as you’ll only have to connect Coupler.io to Power BI. Consequently, the data you import is ready for analysis and updates automatically based on a schedule.
FAQs
What is the main data transformation feature in Power BI?
You can use Power Query in Power BI to clean, reformat, and shape data. It’s the main data transformation feature that allows you to edit queries before loading data in the model.
What is the difference between Power Query, M, and DAX?
Power Query is an ETL tool that helps you connect to data sources, transform data, and load it into the model. It offers a graphical interface to perform transformations, which modifies the queries sent to the data model.
On the other hand, Power Query M is the language that defines these transformations. You can use Power Query M to transform data directly by modifying the underlying query.
DAX (data analysis expressions) are formulas used to create calculated columns and measures in an existing data model.
All these options are useful for data analytics in Power BI.
Is M and Power Query the same thing?
Power Query refers to the graphical interface of the ETL tool, which is used to transform data. Meanwhile, M is the language used to define those transformation steps. Functionality-wise, both do the same job. However, one offers a graphical interface, and the other requires manual scripting.
Data transformation in Power BI: Summary
Power BI provides powerful features to transform data before building visual reports. You can perform operations like cleaning, filtering, or modifying dataset models. The Power BI DAX functions are also helpful for building calculations or aggregations on top of existing datasets.
However, these methods may not be suitable for larger datasets and complex transformations as they can increase the refresh time and slow down reporting.
You can use Coupler.io to handle data transformations outside the Power BI. In particular, this allows you to merge data from multiple data sources into one dataset and automatically refresh data. This helps you enhance reporting efficiency and performance as all the transformations occur outside of Power BI. Get started with a free account today.
Automate reporting with Coupler.io
Get started for free