Effective analytics can unlock valuable insights that drive your sales and revenue growth. Accurate data analysis enables businesses to seize opportunities to increase income, while poor analysis can result in missing these crucial chances.
In this article, we provide our insights into what HubSpot analytics has to offer and how you can elevate your reporting to the next level. You will also find white-label, free-to-use dashboard templates to help you automate your reporting.
Native solutions for HubSpot data analytics you should try
This suite of tools provided by HubSpot offers numerous solutions for businesses. Let’s take a look at the reporting options available in HubSpot analytics.
Reporting
First, we’ll start with the core of the platform. The Reporting feature gives you a clear overview of your marketing, sales, and customer service efforts and enables you to see what is performing and what is not. It includes pre-set reports and a custom report builder.
HubSpot Reporting Dashboards
The platform offers customizable dashboards where you can gather and visualize CRM data from different HubSpot tools in one place. To use this Analytics view, click Reporting and select Dashboards.
You have the flexibility to create your version of the dashboard by adding various reports from HubSpot’s reporting library as separate blocks. The position of these blocks, charts, and graphs can be easily rearranged. Add more metrics and use filters to segment data by time periods, teams, or campaigns. All this allows you to access the information most relevant to you and personalize the dashboard according to your specific requirements.
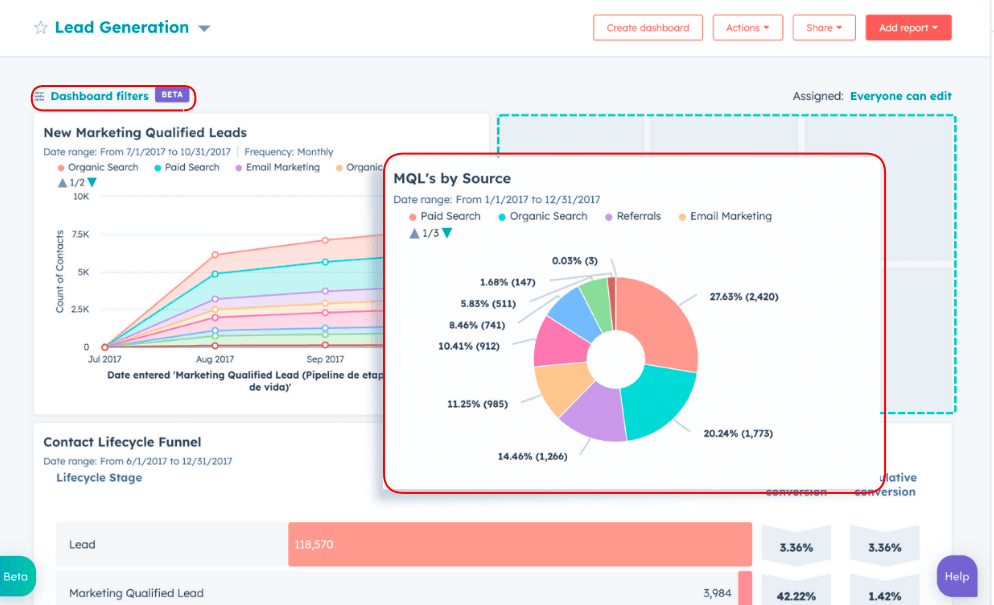
With these reports, you can:
- Have an overview of key performance indicators (KPIs) across numerous business functions (sales performance, campaign results, customer support metrics).
- Track metrics such as leads generated, sales deals closed, and customer satisfaction in near real-time.
- Gather this first-party data from multiple sources and present them in a unified view.
You easily can share these reports with other teams or stakeholders to align goals and progress. To do this, simply send them as a URL to other Hubspot users with access to the dashboard. For external users, you can send an email using the dashboard’s non-editable format.
You don’t have to limit yourself when it comes to the dashboards in HubSpot analytics. You can create different dashboards to track various metrics and switch between them. HubSpot offers various pre-set templates that can be customized to match your goals.
Custom Reporting
You also have the option to build reports from scratch and add everything you need from HubSpot. To create a custom report, click the Reporting icon and select Reports-> Create Report -> Custom Report Builder.

With custom reporting, you can:
- Gather actionable insights from detailed sales funnel performance to key customer service metrics.
- Track performance across custom dimensions such as customer segments, deal stages, or contact properties.
- Have better visibility into cross-functional activities.
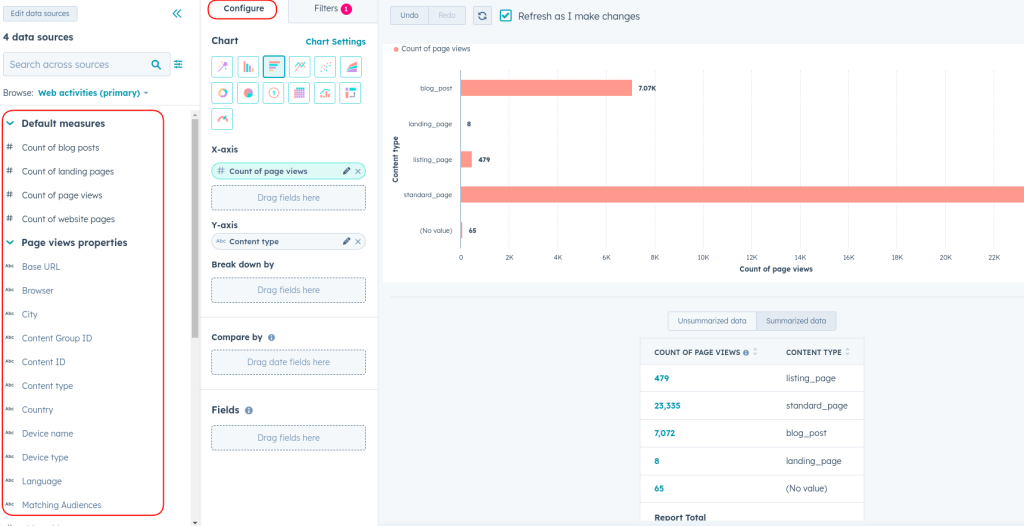
Use HubSpot’s drag-and-drop interface to select data fields, apply filters, and choose how to visualize the data (e.g., bar charts, tables). You can save these reports to a dashboard or export them for further analysis.
For more details on working with dashboards in HubSpot, please see our article How to Create and Customize Your HubSpot Dashboard.
Marketing and Campaign Analytics
Next, let’s explore how you can measure the performance of your marketing campaigns. HubSpot offers numerous solutions that will help you analyze the results of your marketing activities and identify areas of improvement.
Marketing Dashboard
This is a comprehensive tool for tracking all marketing activities within HubSpot, from email campaigns to social media posts. To access the Marketing Dashboard, navigate to Reporting, then select Dashboards, and choose Marketing Dashboard.
If you don’t have a dashboard yet, you can go to Reporting, select Dashboard, and click Create Dashboard in the upper right corner. Then, you can select a pre-made template or create your dashboard from scratch by clicking New Dashboard.
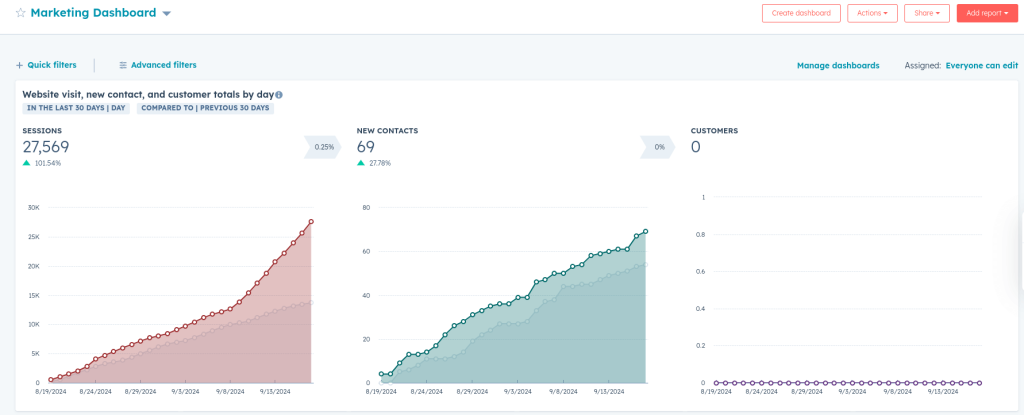
The main insights you can gather with the Marketing dashboard include:
- An overview of the performance of specific marketing assets, such as emails, landing pages, and ads.
- Conversion rates across your marketing funnel, from lead generation to sales.
- ROI of various marketing activities.
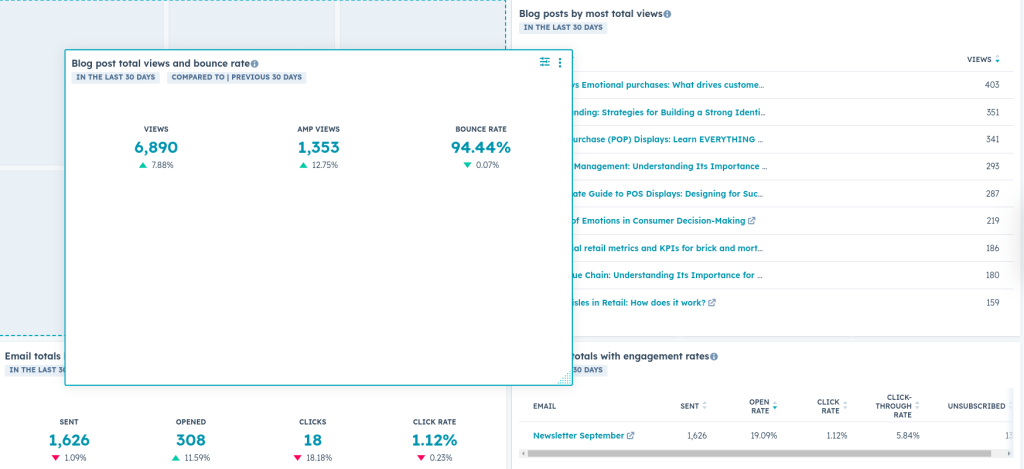
Navigate to Marketing Hub and view metrics for each marketing activity. Customize reports to show engagement rates, conversion metrics, and the impact of each channel on overall marketing goals.
Traffic Analytics
This allows you to track traffic volume, sources, and behavior of visitors coming to your website. To access this, you need to click Reporting, select Reports, and from the Analytics Suites, choose Traffic Analytics.
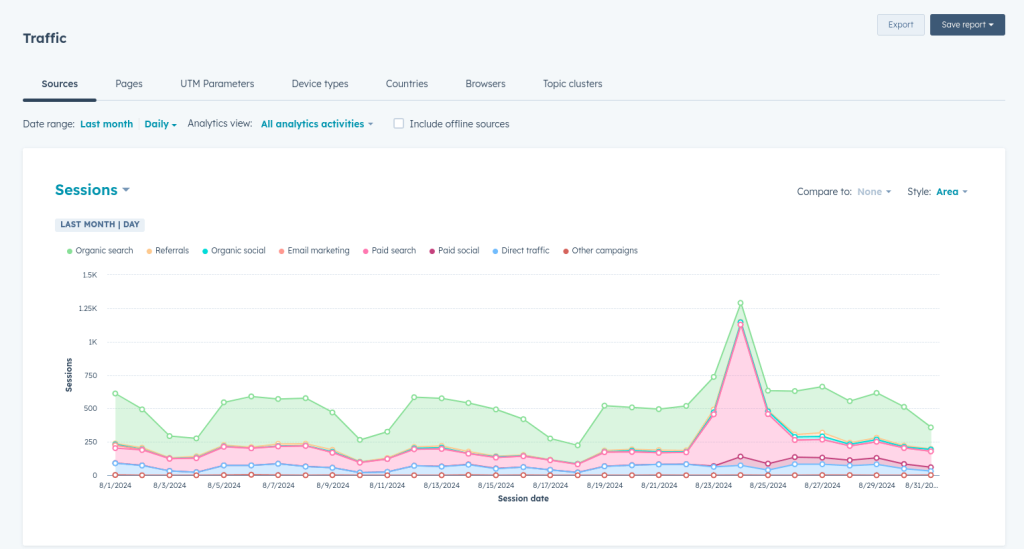
With the traffic analytics in HubSpot, you can:
- Have an overview of website traffic sources (organic search, paid ads, direct traffic).
- Track key engagement metrics such as page views, bounce rates, and session duration.
- Gather insights regarding top-performing pages and referral sources.
If you use HubSpot as your CSM, then you can analyze traffic without needing to connect your account to an analytics platform. However, to gain a more comprehensive view and deeper insights into your traffic, it’s advisable to integrate HubSpot with Google Analytics 4. In the section below, we’ll show you how to connect the two apps.
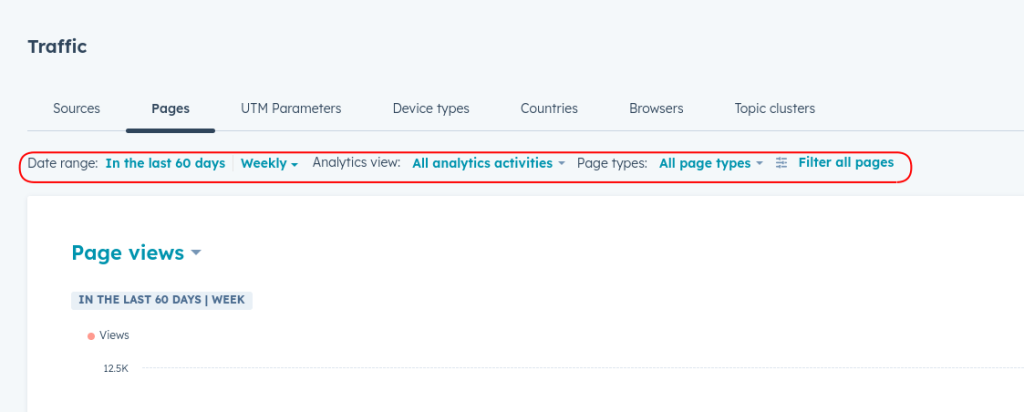
In the HubSpot Traffic Analytics tool, you can select time frames, compare traffic from different channels, and drill down into specific pages or campaigns to identify patterns and optimize website performance.
Campaign Analytics
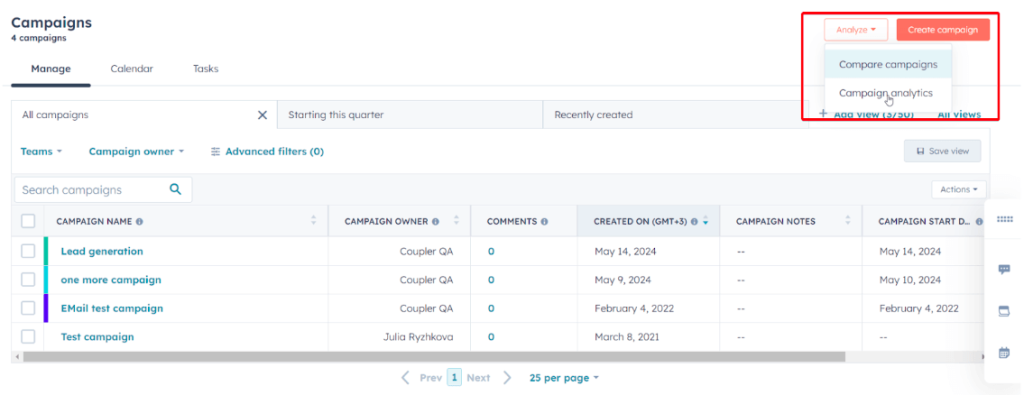
This feature allows you to check the overall performance of your marketing campaigns across channels like email, social media, and paid advertising. To access this section, you need to click Marketing and select Campaigns. Then, click Analyze and select Campaign Analytics.
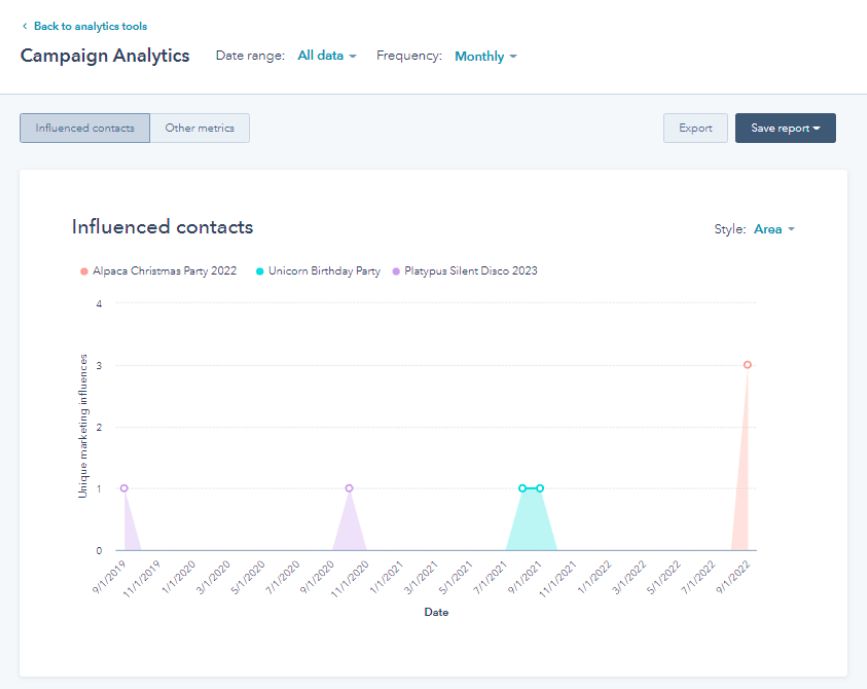
Campaign analytics allow you to:
- Have an overview of campaign engagement metrics like clicks, conversions, and ROI.
- Conduct a detailed analysis to determine which marketing assets (emails, landing pages, etc.) contribute the most to your campaign success.
- See how leads move through the funnel stages from awareness to conversion.
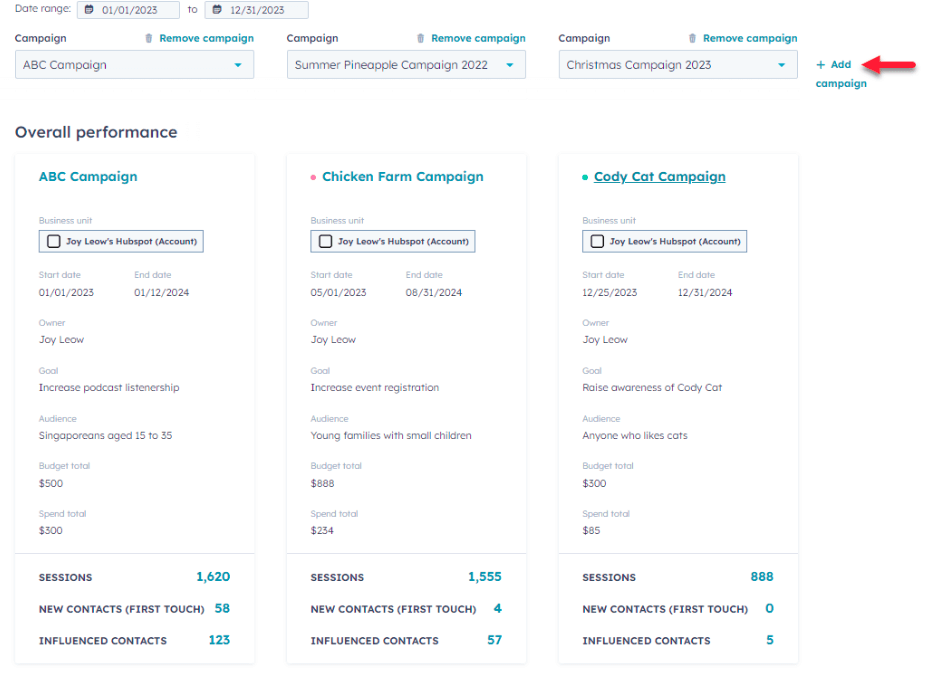
Set up a campaign in HubSpot by grouping assets (emails, social posts, landing pages) under one umbrella. Track performance by viewing key metrics such as conversion rates and engagement levels, and refine your strategies accordingly.
Attribution Reporting
This tool shows you which marketing and sales activities contribute to conversions, helping you identify which touchpoints are driving revenue. However, keep in mind that it is only available for Professional and Enterprise HubSpot clients that have access to Marketing Hub and Content Hub. To create an attribution report, navigate to Reporting, then select Reports, click Create report, and choose Attribution.
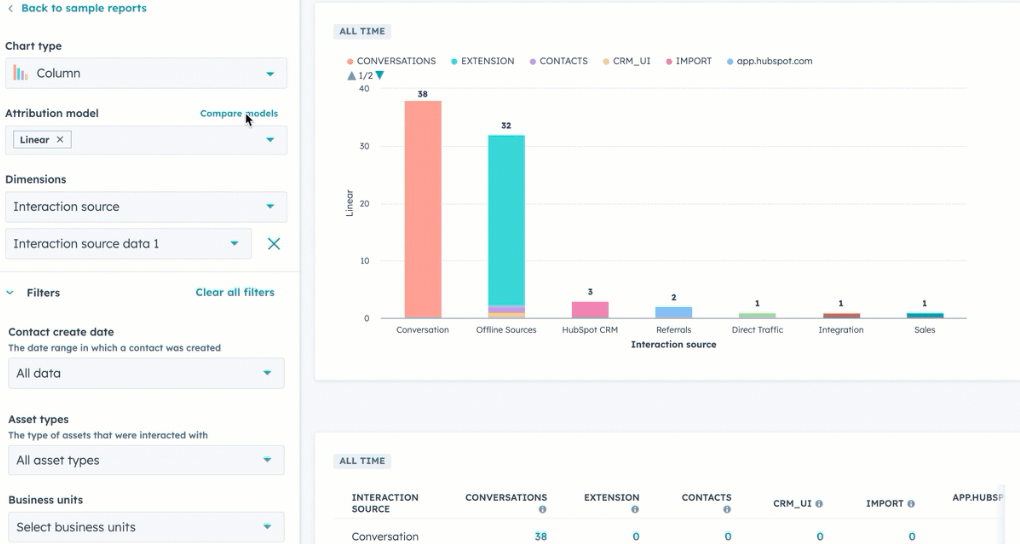
With the attribution reporting, you get:
- Multi-touch attribution insights that show the customer journey across different touchpoints.
- Attribution models like first-touch, last-touch, and linear model that help you understand which channels and interactions have the most impact.
- Data on which marketing assets and activities (emails, ads) are generating the most conversions and revenue.
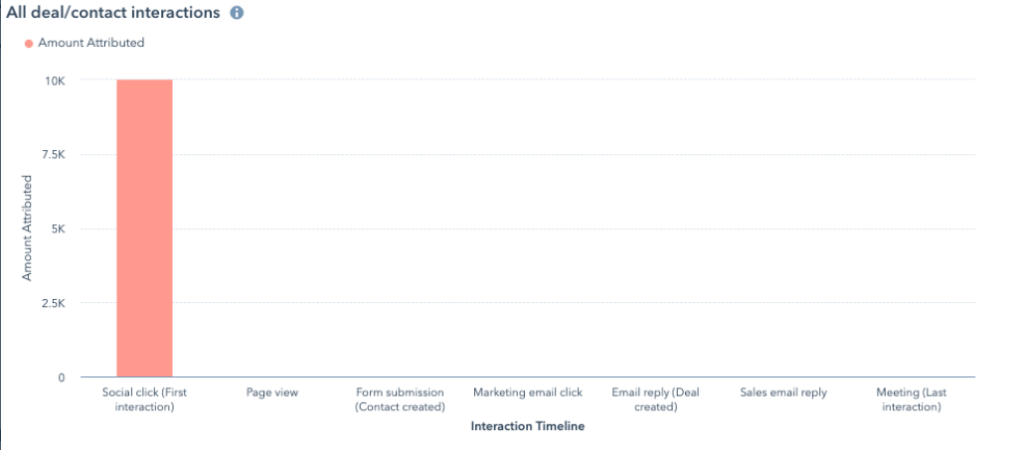
To use attribution reporting, simply choose an attribution model and customize it based on your goals. HubSpot will then pull data from all your marketing and sales activities and show you how each one contributed to lead conversions or closed deals. For more details, you can check HubSpot’s knowledge base.
Sales Analytics
Moving on to a different department: Sales. HubSpot offers plenty of useful tools that will help you gather insights on sales performance.
Sales Dashboard
The Sales Dashboard gives you a complete overview of all sales activities within HubSpot. To access the Sales Dashboard, navigate to Reporting, select Dashboards, then choose Sales Dashboard.
If you don’t have a dashboard yet, you can go to Reporting, select Dashboard, and click Create Dashboard in the upper right corner. Then you can select from a pre-made template or create your dashboard from scratch by clicking on New Dashboard.
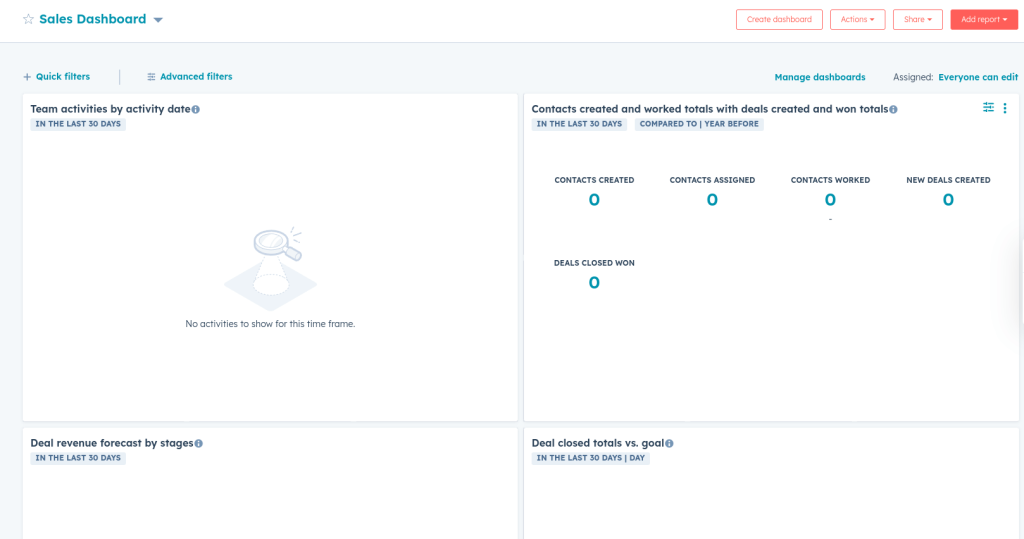
Here are the main insights you can gather with the Sales Dashboard:
- Obtain an overview of the sales activities
- Track key metrics such as deal stages and close rates
- Check the sales cycle length and the efficiency of moving prospects through the funnel.
Customize reports to track deal progression, team performance, and the impact of your sales efforts on revenue growth.
Sales Performance Reports
HubSpot also offers multiple sales report templates covering various aspects of the sales process. These performance reports track your sales team’s performance, pipeline health, and deal progression over time. To access this view, click on Reporting, and from the Reports, select Sales Analytics. In the Analytics suites section, you will find dozens of reports grouped under three main categories.
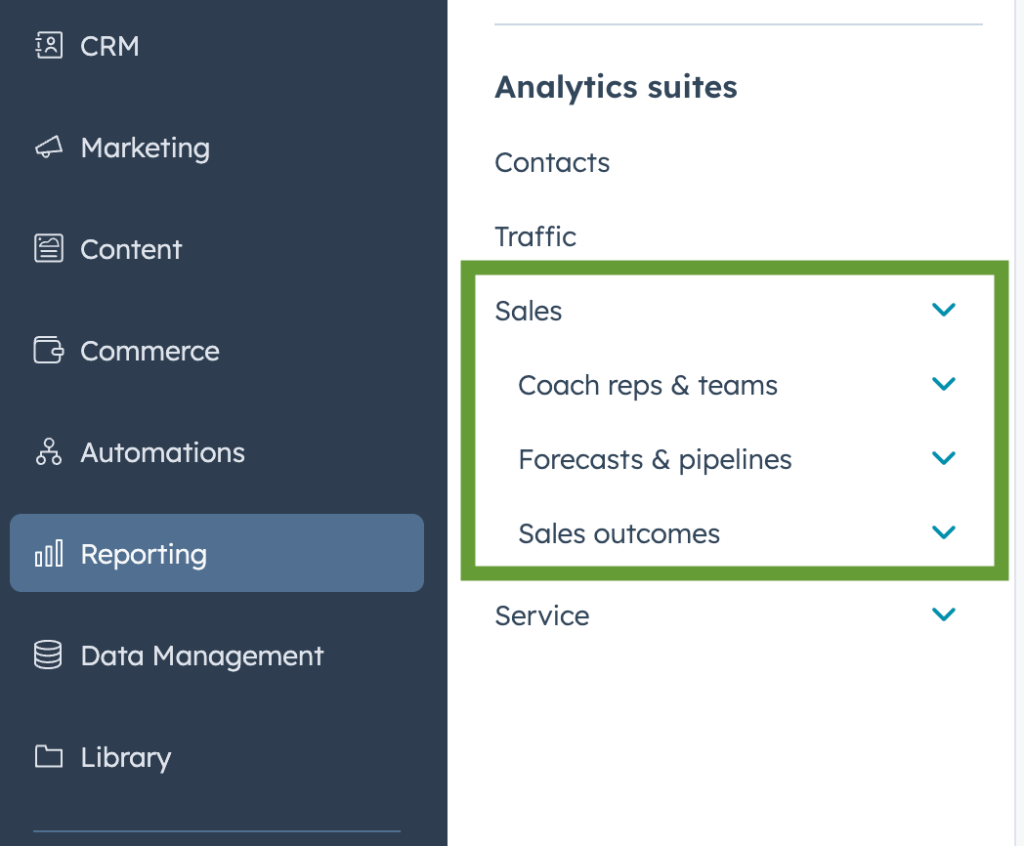
There are templates such as Deal funnel report, Team activity timeline, Deal funnel, Weighted pipeline forecast, Deal revenue by source, Deals won and lost, and many more.
Below, you can see an example, a Prospecting activities report.
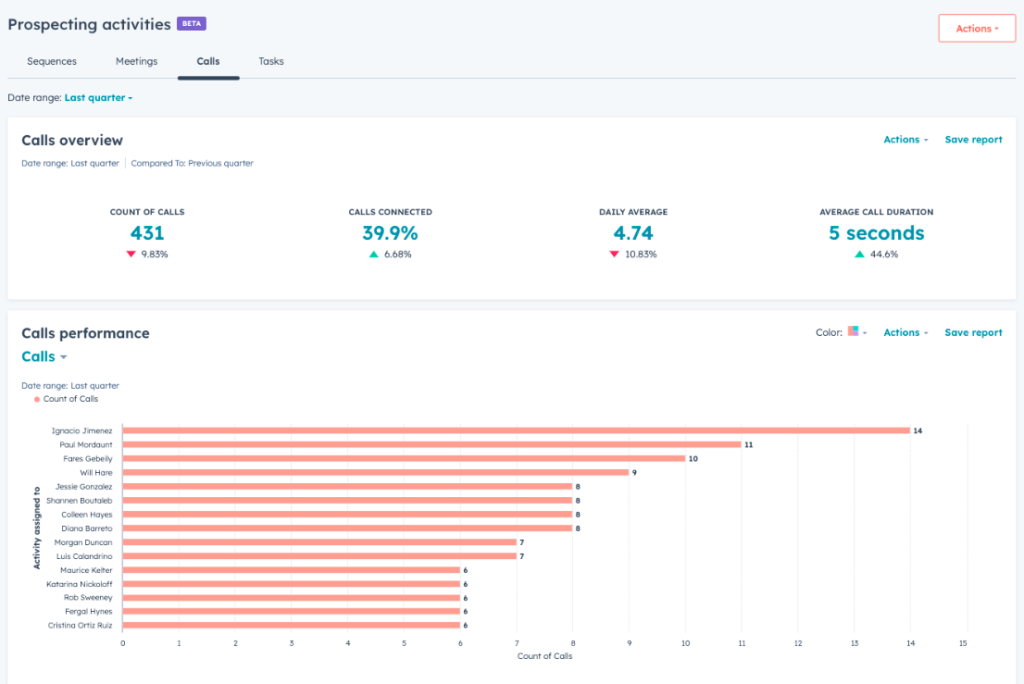
With sales analytics (the reports mentioned above and the sales dashboard), you can:
- Keep track of metrics like deal velocity, deal size, and win rates.
- Gather insights into sales team performance, such as activity levels, meeting outcomes, and quota attainment.
- Analytics trends in revenue forecasting and pipeline management.
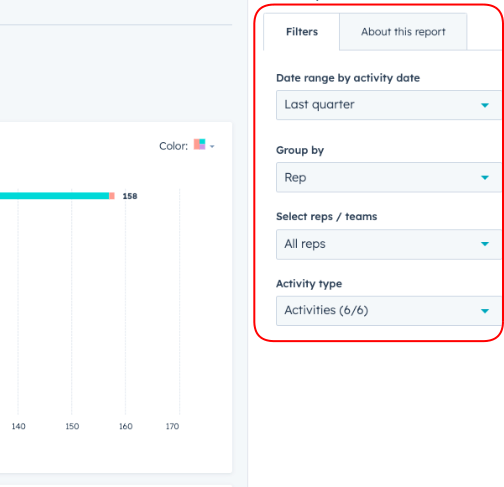
To perform analysis, go to the Sales Analytics dashboard, where you can track key metrics like closed deals, revenue generated, and the efficiency of your sales process. Filter reports by sales rep, deal stage, or timeframe to get specific insights.
Customer service analytics
Providing a great customer experience is a must, and you need to keep an eye on the performance of your customer service team. With HubSpot analytics, you can have an overview of customer service activities.
Service Dashboard
This dashboard helps you track and measure customer service performance, including ticket resolution times, customer satisfaction, and team productivity.
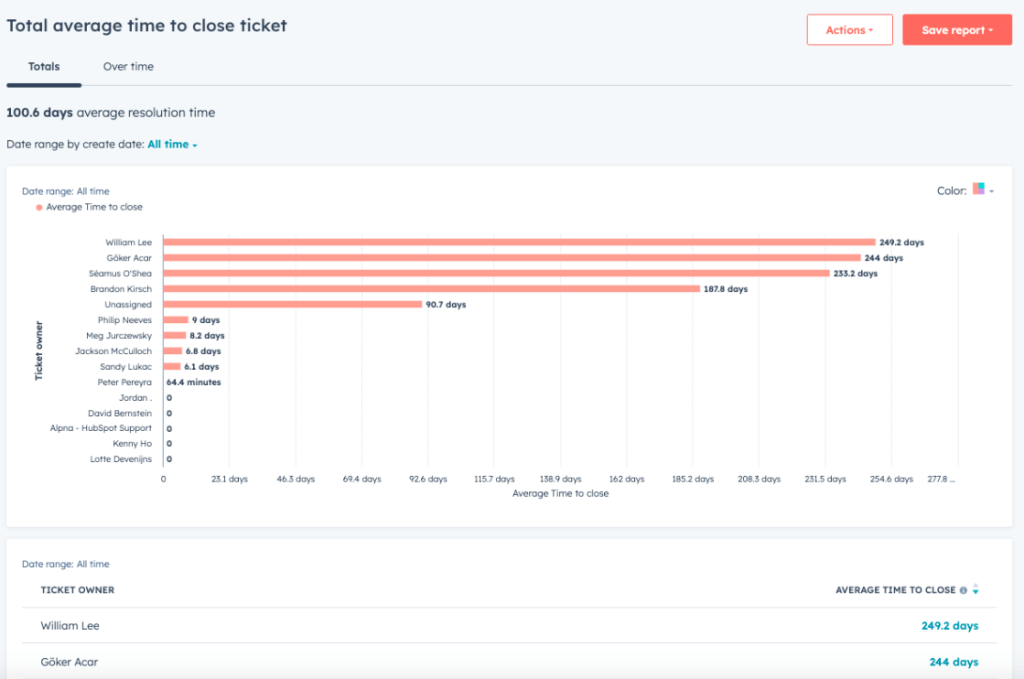
With Customer service analytics, you can:
- Analyze ticket metrics such as average response time, resolution time, and ticket volume.
- Check Customer satisfaction scores (CSAT) and Net Promoter Scores (NPS).
- Gather insights into how effectively your support team is managing customer queries.
Use the Service dashboard to track customer interactions, measure response and resolution times, and analyze customer feedback. You can create custom reports to monitor trends over time and identify areas for service improvement.
To access the Service Dashboard, navigate to Reporting, then select Dashboards, and choose Service Dashboard. If you don’t have a dashboard yet, go to Reporting, select Dashboard, and click Create Dashboard in the upper right corner. Then you can select from a pre-made template or create your dashboard from scratch by clicking New Dashboard.
Key features of native HubSpot analytics: from data tracking to customizable reports
HubSpot analytics is a highly regarded solution that comes with multiple useful features. Here, we’ve highlighted some of the most important ones:
All-around data tracking
HubSpot provides all the tools you need to monitor key data such as website traffic, the performance of your marketing campaigns, and what your sales and service teams are doing.
You can gather and analyze all your business insights in one place, eliminating the need to switch between multiple tools. This enables you to understand how your customers interact with your brand across different channels.
Tailored reports and dashboards
HubSpot analytics comes with customizable dashboards and reports that meet different business needs.
It enables you to build a custom dashboard that focuses on areas you choose to monitor, so you can easily track and analyze the metrics that matter to you and your team.
Pre-built HubSpot analytics dashboards
If you don’t have the time to create your own reports, you can use one of the ready-made dashboards provided by HubSpot analytics. You get insights into your performance without having to set up everything from scratch.
Multi-Touch attribution
HubSpot tracks all the ways in which your customers interact with your brand before making a purchase. It shows you how each touchpoint contributes to a sale.
It’s very convenient because it allows you to better understand which marketing efforts are driving results. You gain a clear picture of what’s working and what’s not and can introduce improvements into the user journey.
Revenue analytics
HubSpot enables you to track the revenue generated from your marketing and sales activities. You can see which deals are closing and how much revenue is being generated by them.
This helps you make a direct connection between the marketing and sales efforts and the actual revenue, which helps you prove ROI. Additionally,, it helps you you understand what activities are more profitable, enabling better planning for future growth.
A/B testing
This feature is available for Professional and Enterprise plan users. HubSpot’s marketing hub enables you to run A/B tests to compare different versions of a webpage to see which of them performs better.
In an A/B test, half of your website visitors will see version A, while the other half will see version B.
Once the test is complete, you can select the winning version based on how each option performed. Also, you can rerun a variation to collect more data.
Integration with Google Analytics 4
HubSpot analytics integrates with other tools that you can use for in-depth reporting. If you use Google Analytics 4, you don’t have to switch. You can integrate the two apps and gain a holistic view of your performance from all angles.
Integrating Google Analytics 4 with HubSpot enhances your ability to track the customer journey from initial website interaction to sales and beyond. This integration ensures smooth data sharing between platforms by combining GA4’s web traffic insights with HubSpot’s CRM and marketing analytics.
To integrate the two apps, you need to follow the next steps:
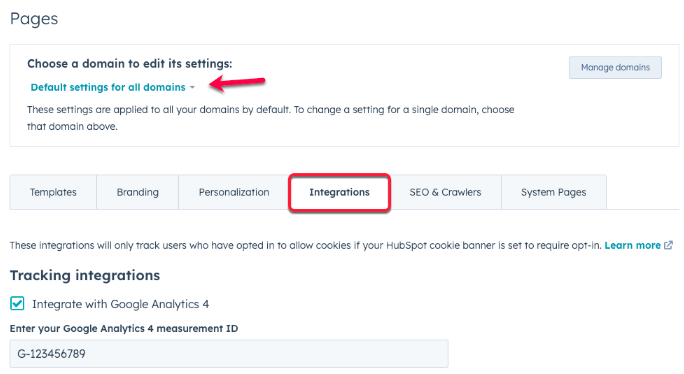
1. Add GA4 Tracking Code to HubSpot:
- In your GA4 account, go to Admin > Data Streams and copy your tracking code (Measurement ID).
- In HubSpot, go to Settings > Website > Pages and paste the GA4 tracking code into the Site Header HTML section.
2. Enable Cross-Tracking:
- Ensure both GA4 and HubSpot are set up to track the same events (like page views and conversions) by configuring similar event tracking on both platforms.
3. Use UTM Parameters:
- Add UTMs to your marketing campaigns to track traffic sources in both HubSpot and GA4 consistently.
4. Leverage HubSpot’s Analytics Integration:
- HubSpot automatically syncs with Google Analytics data, so use HubSpot’s Reports > Analytics Tools to compare data from both platforms.
This allows GA4 and HubSpot to track similar user behavior and align your reporting.
Here are a few things you can do with this integration:
- Analyze web traffic and behavior in GA4
You can utilize GA4 to analyze user flows on your website and identify key drop-off points and conversion paths. Additionally, it’s a good option to create custom analytics reports in GA4 to segment users based on actions and link these insights to HubSpot to evaluate lead generation or sales contributions.
- Use multi-touch attribution
The best part about GA4 is the multi-touch attribution, which helps you assess how different marketing channels contribute to conversions. Combine this data with HubSpot’s attribution insights to understand which touchpoints are most effective.
- Enhance retargeting campaigns
Create custom audience segments in GA4 based on user behavior, such as users who visited key pages but didn’t convert. Sync these audiences with HubSpot for retargeting campaigns, email marketing, or lead nurturing.
- Optimize user experience
Use GA4’s reports to analyze user engagement and optimize landing pages, forms, and calls-to-action in HubSpot campaigns for improved engagement and conversions.
Custom white-label HubSpot analytics dashboard templates
Next, we will showcase several templates that can help you streamline your HubSpot analysis and reporting. These Coupler.io dashboards are free to use, customizable, and fully automated. You simply need to plug in your HubSpot account and connect to Looker Studio. Once done, you will have a live dashboard with your data.
1. HubSpot customer acquisition dashboard
This ready-made template for Looker Studio allows you to track and analyze the entire customer acquisition funnel. It is easy to use and can be set up in just a few minutes. You can connect all of your ad platforms (LinkedIn Ads, Facebook Ads, Instagram Ads, etc), Google Analytics 4, and your HubSpot account to gain a full overview of the marketing funnel.
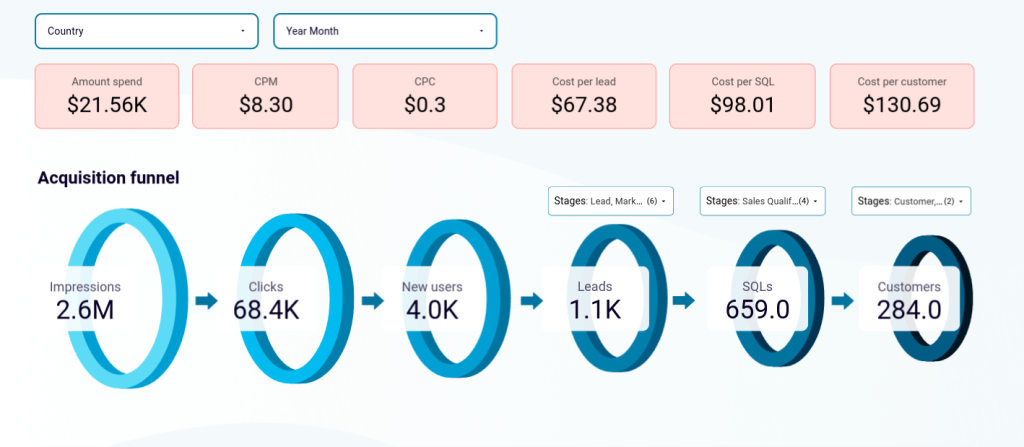
It enables you to analyze how your ads influenced each stage of the customer journey, all in one dashboard, from Impressions to Customers. With this report, you can manage ad spend by checking which ad channel is performing better and which one is making you overspend.

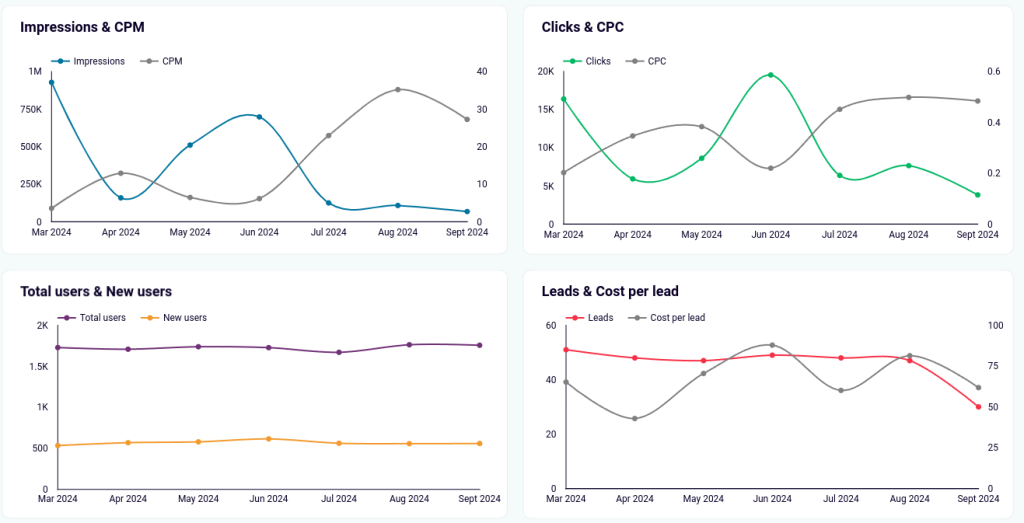
The report includes graphs comparing metrics such as Clicks and CPC. You can track the most crucial KPIs and monitor the performance of your campaigns. This will help you identify which efforts paid off and what action you need to take.
2. CRM dashboard for HubSpot
This HubSpot CRM template offers a sales performance and pipeline analytics overview. It is free-to-use and you can set it up in just 5 minutes. Designed for sales teams, the template highlights key metrics such as total sales, win rate, close rate, and pipeline value.
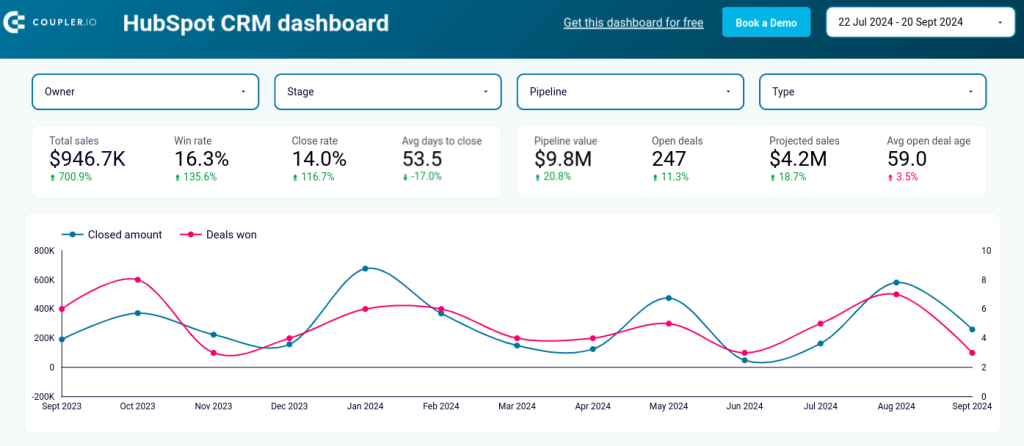
A dynamic line chart presents trends in closed amounts and deals won over time, while bar charts break down sales pipeline performance by agent and deal types. These help teams identify top performers and bottlenecks in the pipeline.

Additionally, the template comes with comparisons of deal amounts by source (organic, paid search, referrals). These reveal how different channels contribute to revenue. Agent performance data includes close rates and days to close.
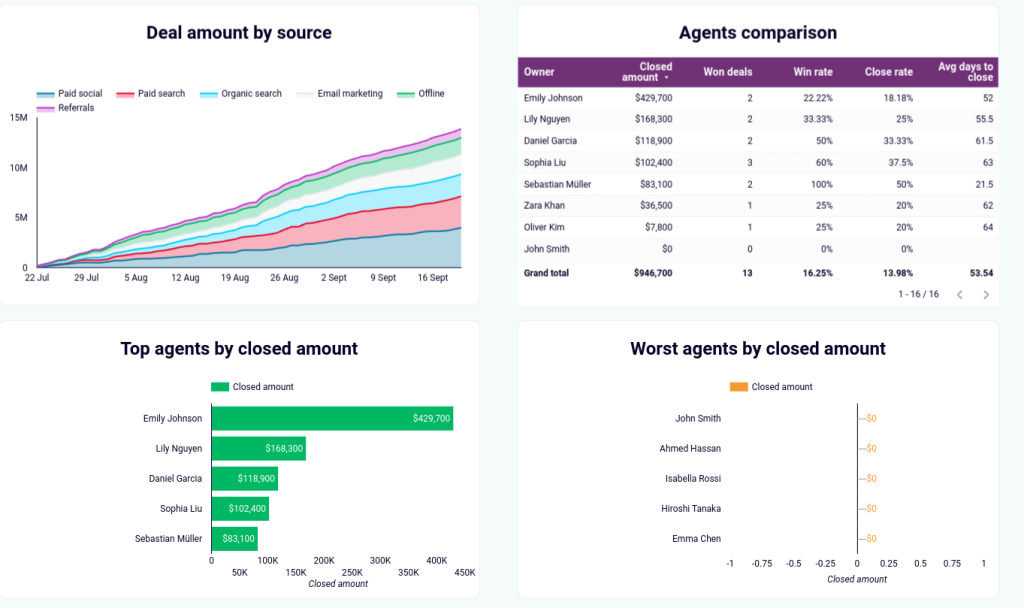
This allows managers to focus on improving individual contributions. You can also take a detailed look at open and won deals, along with probabilities and deal stages, which helps teams prioritize high-potential opportunities.
3. Sales KPI dashboard for HubSpot
This report is designed for sales managers who want to closely track and analyze the performance of closed and lost deals over time. The ready-made template offers a concise view of key metrics like closed amount, closed deals, average closed amount, and close rate.
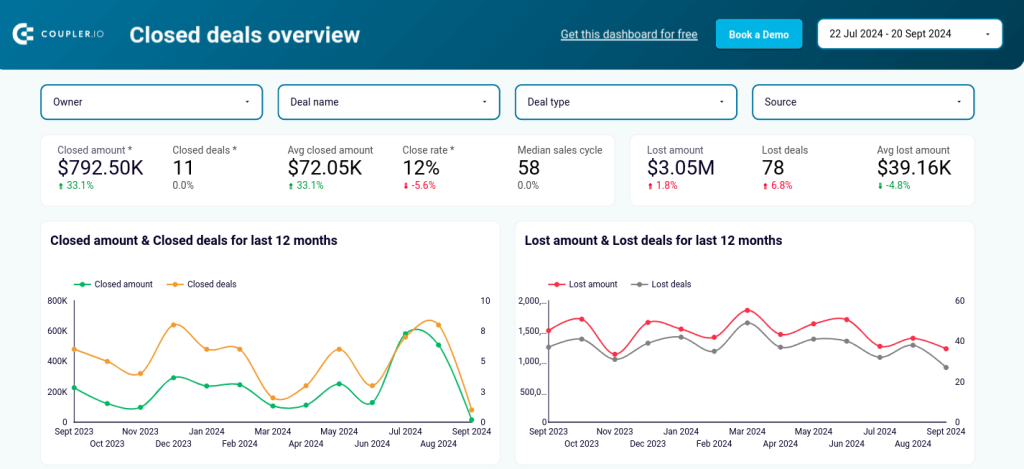
It also includes graphs that show monthly trends of closed amount and closed deals over the last 12 months. Additionally, the lost deals section highlights lost amount and lost deals trends to help sales managers focus on areas that need improvement.
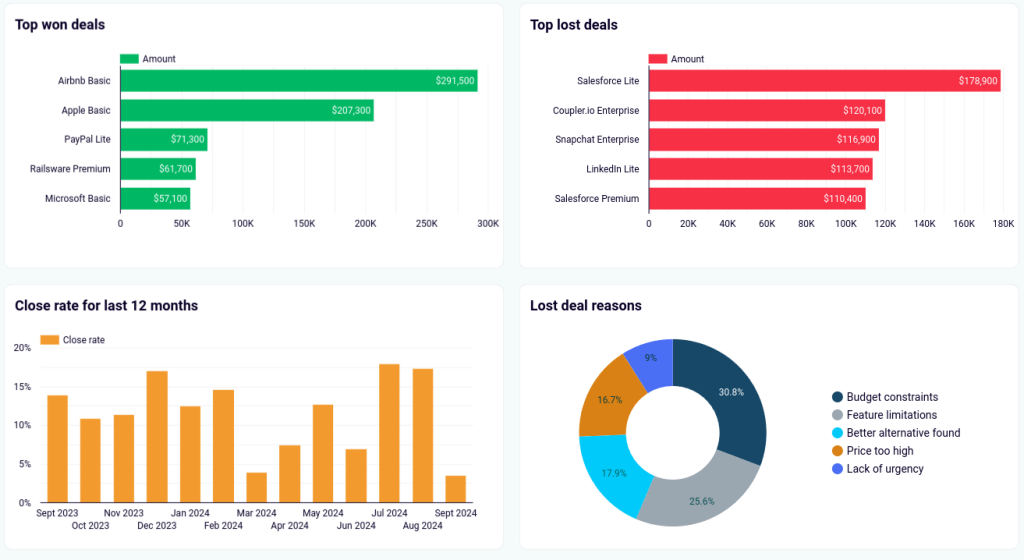
The bar charts display top won deals and top lost deals, making it easy to see where the largest wins and losses occurred. The dashboard also identifies reasons for lost deals in a pie chart, breaking them down by categories like budget constraints, feature limitations, or pricing issues.
How to create a custom report for HubSpot analytics from scratch
If you want to combine data from multiple sources or perform advanced calculations, then you should also consider creating a custom report in a BI tool or spreadsheet app. To automate this process, you can use Coupler.io to integrate HubSpot with your desired destination tool.
Here’s how to easily automate data exports from HubSpot in 3 steps:
Step 1: Extract HubSpot data
Select the destination app in the widget below and click Proceed to start transferring your data.
To use the platform, you will need to create a Coupler.io account for free (no card details are required). Then, follow the on-screen instructions to connect your HubSpot account and select the data you want to load into the destination.
Step 2: Preview and transform data
The Transform module in Coupler.io enables you to preview and edit data before exporting it to your preferred BI or data visualization platform. It allows you to manage columns, sort and filter data, apply formulas to new columns, and perform calculations. Apart from that, you can blend data from several data sources into one dataset.
This is very useful as it allows you to speed up your dashboard’s loading and response times since data transformations are performed outside of the BI tool.

Step 3: Load and schedule
Follow the onscreen instructions to connect your destination app. Depending on the selected destination, you will need to follow different steps to load your data for the report.
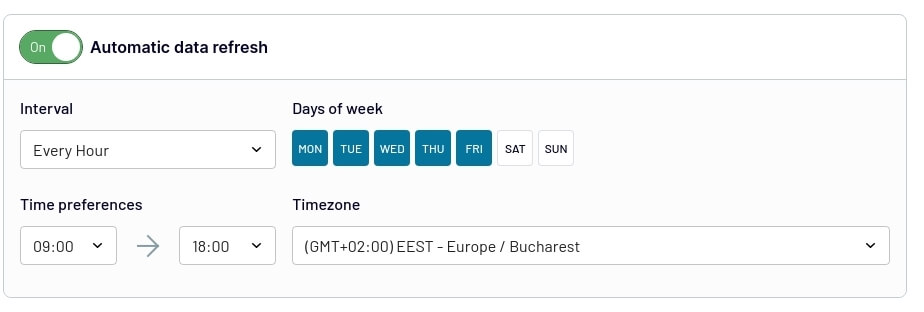
Then, set up your custom schedule for automated data refresh. Coupler.io can transfer fresh data from HubSpot to your destination app as often as every 15 minutes.
Now, you can build your own dashboard and include the data visualization elements you want. For more information on data visualization, see our tutorials:
Uncover actionable insights by analyzing data from your CRM
HubSpot analytics offers a comprehensive suite of tools to help you track, measure, and optimize your marketing, sales, and customer service activities. From customizable reports and pre-built dashboards to advanced attribution, HubSpot allows you to gain valuable insights into your business performance. However, depending on your reporting needs, there may be limitations, such as a lack of more advanced data analysis options, integration, and customization opportunities.
By integrating HubSpot with tools like Google Analytics 4 or using custom white-label templates and BI platforms, you can enhance your reporting capabilities and perform in-depth analyses. Whether you’re leveraging HubSpot’s native solutions or building custom reports from scratch, the key is to tailor your analytics approach to meet your business objectives and extract actionable insights that drive growth.
Automate reporting with Coupler.io
Get started for free


