HubSpot imposes limits on the number of dashboards and reports in use. This severely hinders businesses from gaining a holistic overview of their sales and marketing performance. Luckily, there are ready-to-use dashboard templates for converting raw data into meaningful reports.
This article explores the must-have HubSpot report templates for marketing and sales teams, executives, and business owners. We also provide tips on how to make these dashboards self-updating so they can provide real-time insights into your business.
Top 6 HubSpot report templates for efficient data analysis
1. HubSpot reporting template by Coupler.io
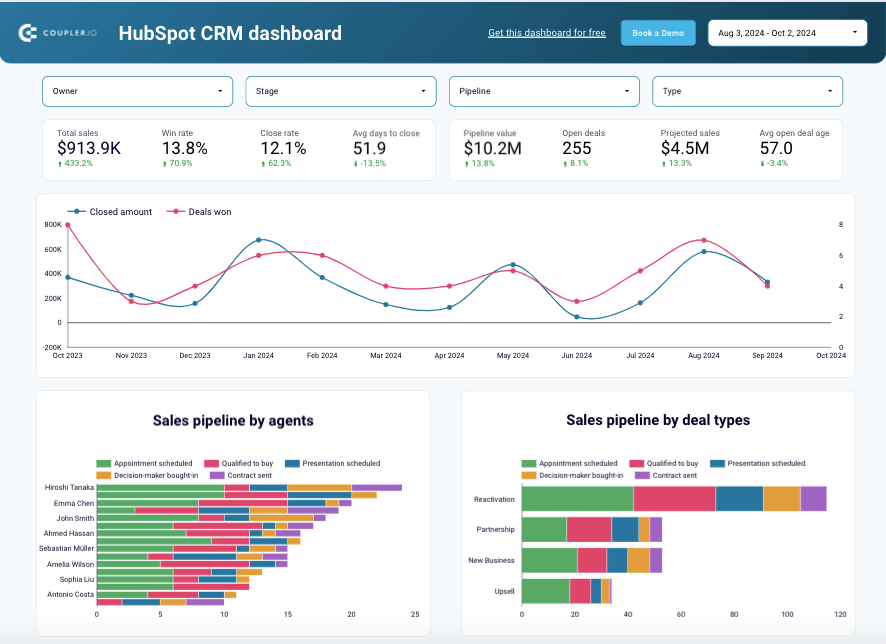
This CRM dashboard for HubSpot enables you to analyze the performance of sales representatives. It will be particularly useful for both sales managers and executive decision-makers.
Key insights available from the dashboard
- Explore the general sales KPIs: summary of sales, the percentage of closed and won deals, and the average deal cycle. This information provides a comprehensive overview of sales processes.
- View the current work in progress and productivity of every salesperson with sales pipelines and comparison tables for agents. Pay attention to closed deals, including won and lost ones, to detect the best-performing and lowest-performing agents.
- Observe how many deals are at each stage for new business, partnership, upsell, and reactivation types. Track and compare the number of won and lost deals for each month.
- Determine which source brings clients who make the biggest deals by analyzing the revenue generated from online and offline sources.
- Analyze unclosed deals by exploring the probability of sale, deal amount, and deal type. Identify common lost deal issues to proactively address them in the top currently open deals to boost revenue.
- Examine won deals to understand which types of companies generate revenue and which industries they operate in.
How to use this template
On the template page, go to the Readme tab and follow the instructions on how to copy and set it up. The built-in Coupler.io connector will load your HubSpot CRM data and create a report based on this template in Looker Studio.
2. Customer acquisition dashboard for HubSpot by Coupler.io
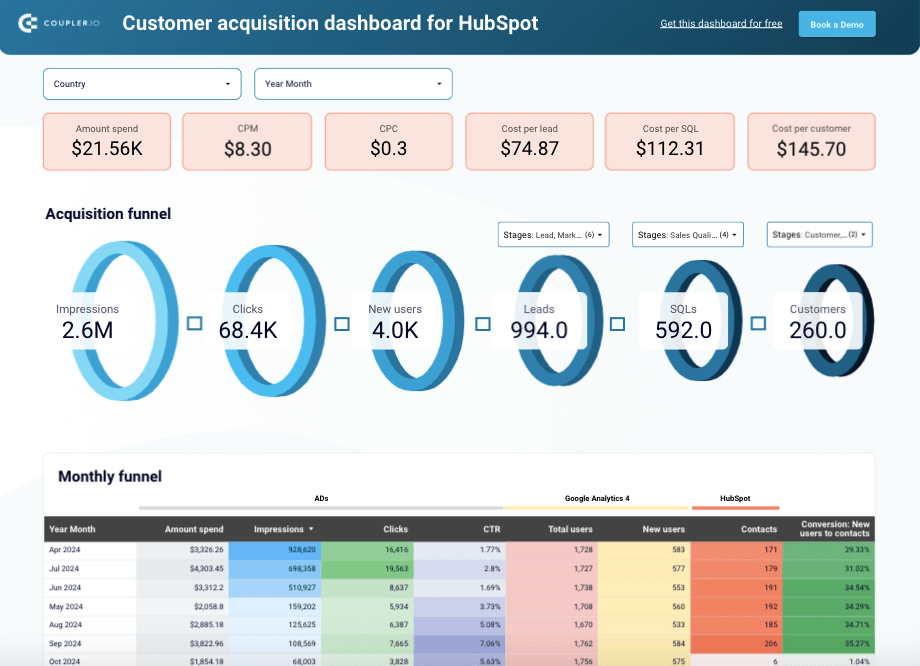
This HubSpot reporting template helps marketers and sales departments analyze the effectiveness of their promotional campaigns on customer acquisition rates. It combines data on ad spending and performance, user interactions from GA4, and contacts from HubSpot.
Key insights available from the dashboard
- Calculate conversion rates for each funnel stage and compare them to the industry benchmarks. If the rates are below average, identify the potential reasons for funnel leaks. Based on this information, create and test hypotheses aimed at improving conversions and driving more revenue for your business.
- Look at the conversion rates for each month to uncover any correlations between ad campaigns and lead generation activities. Determine the best-performing months and evaluate which marketing initiatives have driven good results. Adjust your currently running campaigns to ensure better conversion rates and sales performance.
- Look at the metrics at different funnel stages for multiple countries and determine which country represents the best return on investment. This information will help focus marketing activities on the best-performing countries.
- See how your ad spending correlates with principal KPIs, such as CPM, CPC, cost per lead, new users, and others. This information helps you decide which ad channels are worth investment and which are not.
How to use this template
Once you land on the HubSpot report template page, check out the instructions for its configuration in the Readme tab. Connect to your HubSpot account, ad platforms, and GA4 using the built-in Coupler.io connector and load data into the report with recurring updates included.
3. HubSpot sales report template by Coupler.io
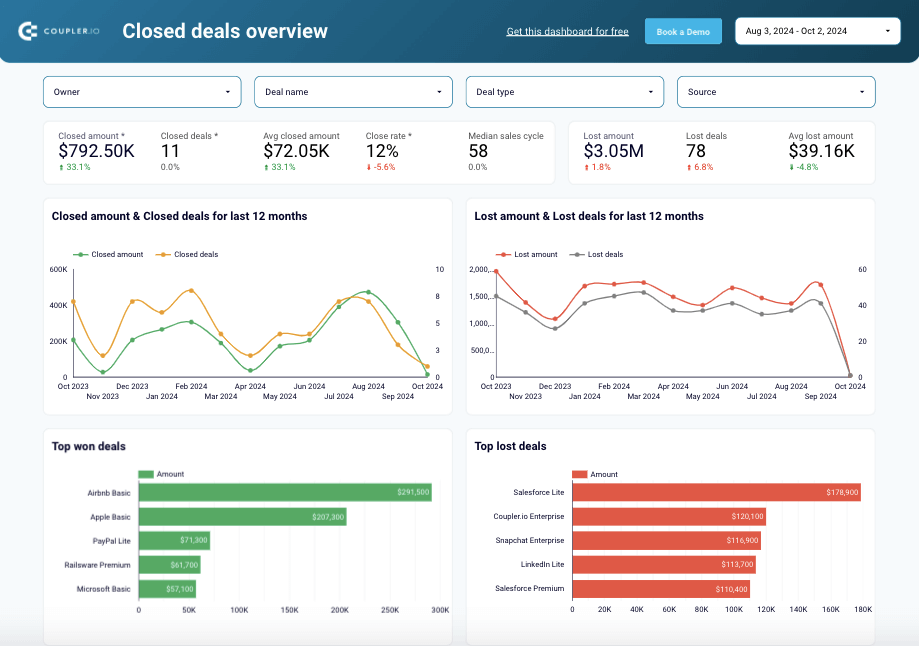
This HubSpot report template provides a detailed analysis of sales KPIs, focusing on closed deals (both won and lost), the sales pipeline, and team performance. These insights enable businesses to identify reasons for sales failures and come up with ideas about how this can be improved.
Key insights available from the dashboard
- Inspect the dynamics of closed deals over the last 12 months to identify seasonal patterns in sales and uncover any correlations of closed deals with other marketing activities, campaigns, and team augmentation.
- Review the details of lost deals over the last 12 months to identify the major reasons for them. Identify which sales reps have a high number of lost deals. With all this information at hand, develop a plan on how to increase conversion rates and sales.
- Look at each funnel stage in the Sales Pipelines tab and calculate the appropriate conversion rates. Review the forecast to discover the most promising open deals and focus on them.
- Explore the achievements of each salesperson and compare them. Communicate with each agent to reveal the reasons for high performance and low results. This information will help you design and implement best practices for the sales team and prevent ineffective approaches.
How to use this template
When you get to the template page, check the instructions on how to use it in the Readme tab. Connect to your HubSpot account with the built-in Coupler.io connector and load data into the report. Schedule recurring data updates to keep your report constantly updated with fresh data.
4. HubSpot marketing performance dashboard
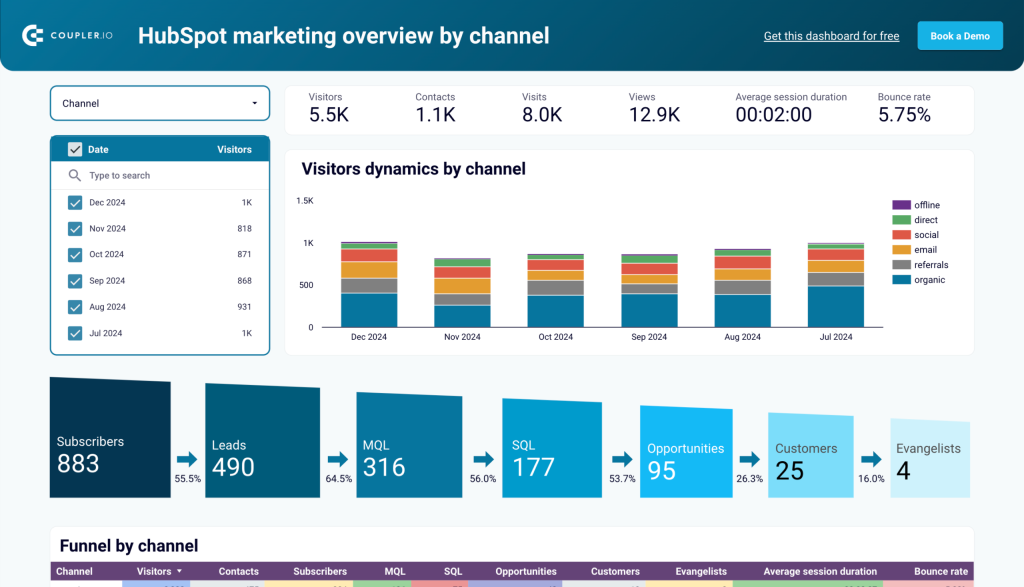
The HubSpot marketing performance dashboard provides an overview of your marketing campaigns and their impact on lead generation and conversions. It connects directly to your HubSpot Marketing Hub data to deliver actionable insights on email campaigns, content performance, social media engagement, and lead nurturing effectiveness.
Key insights available from the dashboard
- Track email campaign performance metrics including open rates, click-through rates, and conversion statistics across all your marketing emails. This allows you to identify your highest-performing email templates, subject lines, and sending times to optimize future campaigns for better engagement.
- Monitor landing page effectiveness with visitor-to-lead conversion rates and form submission analytics. Understand which landing pages drive the most conversions and which elements may be causing drop-offs, enabling you to make data-driven design and content improvements.
- Analyze blog and content performance by traffic sources, engagement metrics, and lead generation capability. Identify which topics and content types resonate most with your audience and contribute directly to your lead generation efforts, helping you refine your content strategy.
- Measure social media campaign reach and engagement across connected platforms. See which social channels drive the most qualified traffic to your website and which types of social content generate the highest engagement, allowing you to allocate resources to the most effective channels.
- Evaluate overall marketing ROI with pipeline attribution and deal creation metrics. Connect marketing activities directly to revenue generation by tracking how leads from different campaigns progress through your sales pipeline, helping you justify marketing investments and optimize budget allocation.
How to use this dashboard
Go to the Readme tab and follow the instructions on how to copy and set it up. The built-in Coupler.io connector will load your HubSpot Marketing data and create a report based on this template in Looker Studio.
The HubSpot report template by Databox allows marketers and business executives to analyze user interactions on social media platforms. It shows the number of sessions, new followers, and likes on social media channels for the selected time period. Sessions data is extracted from HubSpot, while followers and likes are taken from Instagram, Facebook, Twitter, and LinkedIn platforms.
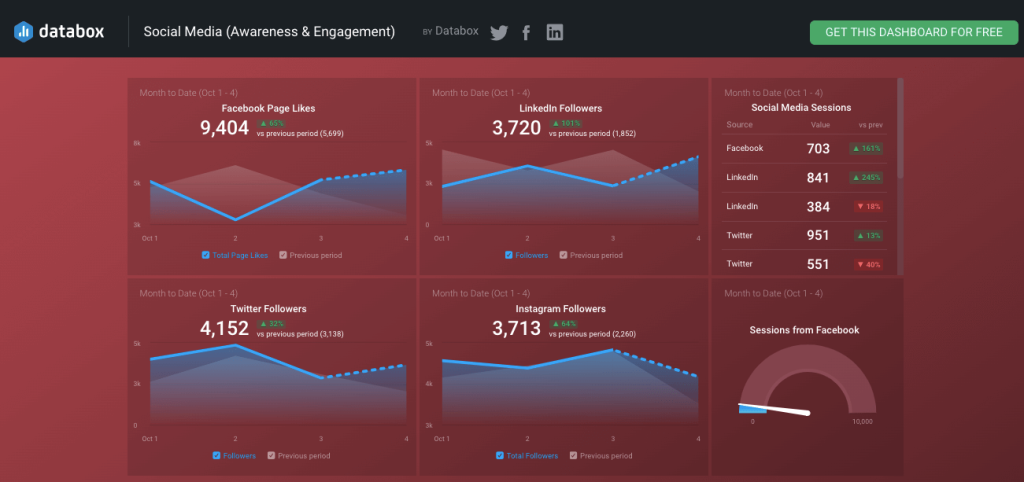
Key insights available from the dashboard
- Monitor the follower growth rate over time by observing the daily breakdown of followers for Facebook, LinkedIn, Instagram, and Twitter. This information helps you align your ad campaigns with user engagement. Concentrate your efforts on the social media channels where your target audience is active.
- Explore the number of Facebook, LinkedIn, Twitter, and Instagram sessions. See how the sessions in the current time period differ from those in the previous one. This information is useful for identifying social media channels that bring the most traffic to your website.
- Observe the correlation between the session and user interactions. This will help you decide how to distribute marketing efforts across marketing channels.
How to use this template
Follow the link below and click Get This Dashboard for Free. Before setting up this template, create a Databox account and configure data sources (HubSpot Marketing, Facebook Pages, Instagram Business, LinkedIn Company Pages, and X (Twitter)). The system will then automatically configure this dashboard for you.
6. SEO report template HubSpot
The SEO report template is designed by HubSpot to drive search insights into your content. It primarily focuses on topic clusters, content types, monthly search volume, and publication status. This report is useful for SEO specialists, marketers, and content creators.
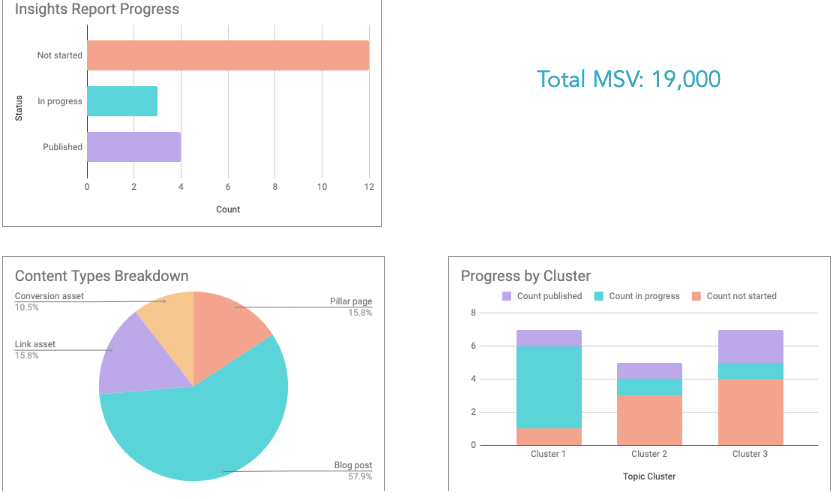
Key insights available from the dashboard
- The progress report shows the number of published, in progress, and non-started pieces of content within all topic clusters. This information is valuable for gaining a comprehensive overview of your content strategy implementation.
- Observe the distribution of content types along your strategy. Content breakdown provides an idea of where most of your efforts are invested.
- Keep track of content tasks in progress and those that are still in the backlog.
How to this template
Follow the link below to download this template from HubSpot. It comes in two versions: for Google Sheets and Excel. On the Home tab of this template, follow the step-by-step guidelines on how to use it.
What are the key metrics to use in a HubSpot report template?
When creating HubSpot reports from scratch or using pre-made templates, make sure you have these seven metrics at hand.
1. Conversion Rate (CR)
This KPI is simple yet powerful and is used to assess sales and marketing activities. CR shows the percentage of users who have made a desired action (for instance, shifted from one stage of the sales funnel to another).
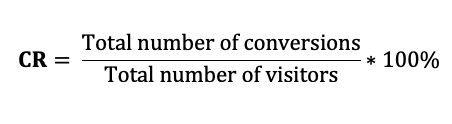
The CR formula above is a general example, but it can be easily adapted for calculating conversions in different circumstances. For instance, you can use it to determine the ratio of total impressions on ads to the number of gained customers. To do this, put the number of all impressions in the numerator and the total number of converted customers in the denominator.
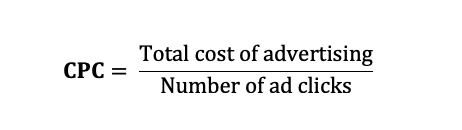
2. Cost per click (CPC)
CPC is a crucial KPI for measuring digital advertising performance. It shows the amount spent on each ad click on search engines or social media. CPC helps to assess the effectiveness of your ad campaigns.
3. Cost per lead (CPL)
The CPL metric shows the effectiveness of your marketing campaigns in terms of their lead generation power. In simple terms, it shows how much money you spend to bring a user to the state of being a lead with a high probability of becoming a client.
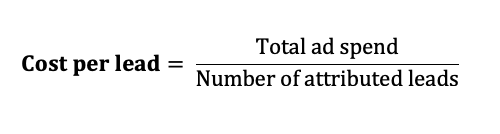
Calculate your CPL and compare it to the industry average. If it’s higher than the benchmark, you should reduce spending on acquiring leads.
Note that CPL must always be lower than the cost of sales for businesses to remain profitable. Exceptions may occur for startups that have just entered the market.
4. Customer Acquisition Cost (CAC)
This metric is similar to CPL, though it shows the total amount spent on each acquired customer. It allows businesses to evaluate the efficiency of current marketing and sales strategies.
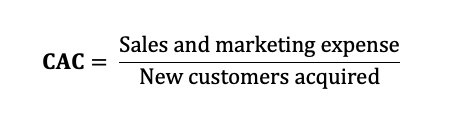
Sales and marketing expenses include advertising costs, team members’ salaries, and other associated spending.
Low CAC means that you acquire customers with little spending, which may potentially result in higher profitability.
5. Marketing ROI
The ROI metric is a fundamental indicator for assessing any business area, including marketing. It demonstrates the ratio of revenue generated by the campaign to the total costs invested in it.
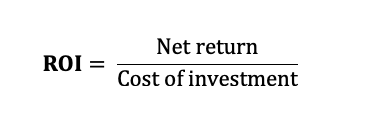
Marketing ROI considers the number of leads and customers generated by each campaign. It also focuses on new revenue obtained as a return on the implemented marketing activities.
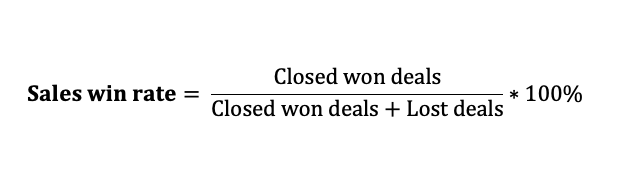
6. Sales Win Rate
This is a simple yet highly effective KPI for measuring the entire sales department’s performance as well as for each individual agent. Sales win rate shows the ratio of won deals, where a lead was converted to a customer, to the total number of closed deals, both successful and lost ones.
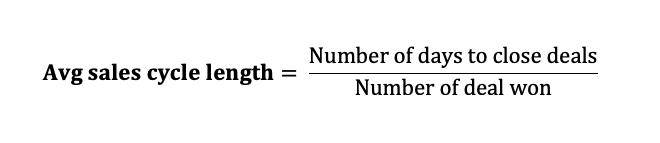
7. Average Sales Cycle Length
This metric shows the average duration of a sales deal, from the first touchpoint to closed status. Understanding the sales cycle through this metric will help you optimize sales activities.
You can evaluate the performance of sales agents by considering how long it takes each agent to close a deal. See how individual cycle length impacts customer churn and retention rates further. For instance, if a short sales cycle results in a high customer churn rate, then it makes sense not to rush and dedicate more time to guiding a lead through the sales funnel.
How to build and automate custom reports on your own?
Creating a dashboard from scratch is certainly more demanding than utilizing ready-to-use HubSpot report templates. Thankfully, with the Coupler.io platform, you can easily collect HubSpot data and transform it into meaningful marketing reports in the destination app of your choice. You have the option to use spreadsheet apps, data warehouses, and BI tools like Looker Studio, Power BI, Tableau, and Qlik.
It only takes a couple of minutes to create HubSpot reports with Coupler.io.
Step 1. Collect HubSpot data
To start, select HubSpot from the source list and pick the preferred destination from the drop-down list. Click Proceed and sign up for a Coupler.io account for free, with no credit card required.
If you already have a Coupler.io account, simply sign in and continue.
Connect to your HubSpot account and provide all the required settings. This includes data entities for import, filtering settings, reporting period, and others.
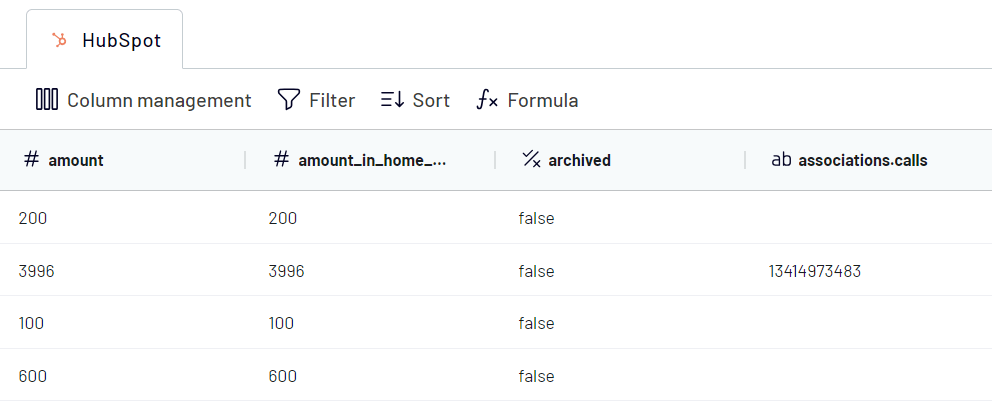
Step 2. Transform and organize data
At this stage, review the extracted data and elaborate on it if needed. Couper.io offers multiple options for transforming and organizing data:
- Rearranging, hiding, and adding columns.
- Changing column names.
- Filtering and sorting data.
- Applying custom formulas for creating new metrics.
- Blending data from several HubSpot accounts or other sources.
Once the data looks good, proceed to the Destination tab.
Step 3. Load data and schedule refresh
Depending on the selected destination app, follow the on-screen instructions to connect it and load HubSpot data there. Everything is accomplished via a visual interface, with no coding needed.
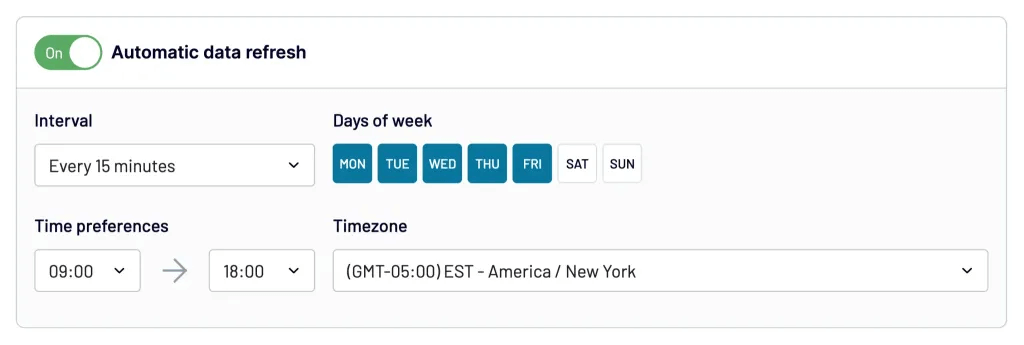
Coupler.io offers automatic data refresh, which enables you to send HubSpot data to your report on a regular basis. If you are interested in self-updating reports, you can return to the importer and enable the Automatic data refresh option. Then, select the time interval for updates, which range from 15 minutes to every month.
Once you run the importer, your report will be populated with data In your destination app. Configure the report by adding graphs, charts, and other visuals to your choice.
Track marketing and sales performance with HubSpot reporting templates
Marketing and sales activities are not just about revenue but also about investing in acquiring leads and customers. HubSpot report templates allow you to evaluate whether your marketing activities are on the right track. Thanks to Coupler.io, even creating self-made reports becomes low-hanging fruit thanks to its no-code interface and pre-configured connectors, including those for HubSpot and analytics tools.
One great aspect of ready-to-use HubSpot reporting templates is that they come pre-loaded with metrics and can gather data from HubSpot, GA4, and ad platforms with just one click. This combination of data from different marketing and ad platforms helps you determine whether your current campaign investment is yielding sufficient returns.
Automate HubSpot reporting with Coupler.io
Get started for free