While Meta Ad Manager provides statistics about your ads on Instagram, it doesn’t allow you to visualize data, which hinders your ability to promptly derive insights. To evaluate your marketing ad campaigns effectively, you’re going to need another solution.
Consider exporting Instagram Ads data to Google Sheets to improve your reporting and data analysis. Thanks to the cloud-native options of Google Sheets, you can collaborate on reports with your team members and share important findings with stakeholders.
Key methods for Instagram Ads data export and their comparison
There are several methods for loading Instagram Ads data into Google Sheets. Some of them facilitate the entire data movement process, while others ensure a high degree of customizability.
| Method | Description | Benefits |
|---|---|---|
| Coupler.io | This is a reporting automation and analytics platform. It provides connectors to load data from Instagram Ads to Google Sheets for automated reporting. | – Graphical UI simplifies the integration process. – Extraction and blending of ads data from other marketing channels. – Powerful data transformation and organization features. |
| Manual data export | This procedure requires you to download a CSV file and upload it to Google Sheets. | – Selection of the desired reporting dates. – CSV file is compatible with many reporting solutions. |
| Google Sheets add-ons | There are multiple add-ons available directly in Google Sheets. Some of the popular add-ons for extracting Instagram Ads data are Coupler.io, Uniquery, Adzviser, and many others. | – Extracting Instagram Ads data directly in the spreadsheet environment. – Possibility to blend ad data from Instagram with that from other ad channels. |
| Custom integration with Instagram API | This method requires extensive technical expertise and coding skills. You will need to create a developer app on Facebook and write scripts to fetch Instagram Ads data. Consider the built-in Apps Scripts extension within Google Sheets, which is a good option for creating custom API integrations. | – High level of customization for data integration. – Flexibility in adapting to business integration needs. |
Export data from Instagram Ads to Google Sheets using Coupler.io
Coupler.io is a reporting automation and analytics platform that ensures quick zero-code setup. It enables you to export data from Instagram Ads to Google Sheets in three simple steps and automate it with scheduling options. Click Proceed on the form below to set up the Google Sheets connector for Instagram Ads right away.
Starting with Coupler.io is free, so you can fully test its capabilities. No credit card is required for account registration.
Step 1. Connect Instagram Ads
First of all, select your Instagram account. Follow the in-app instructions to establish a connection with it and provide authorized access to ad data.
Then, pick up the needed report type that matches your ad evaluation objectives. You can select the list of ads, ad sets, or campaigns from the drop-down list.

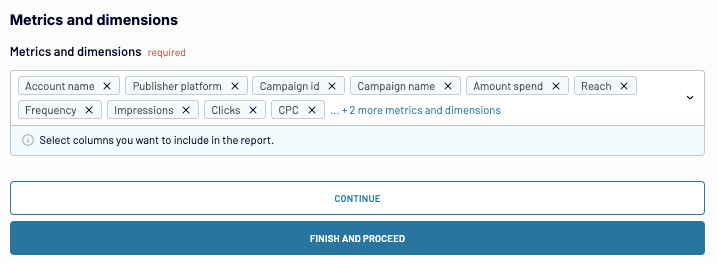
Specify the reporting period in the appropriate section and select the required metrics. Decide whether you are OK with the preselected metrics. Remove some of them or add other ones to meet your reporting objectives.
Step 2. Transform data
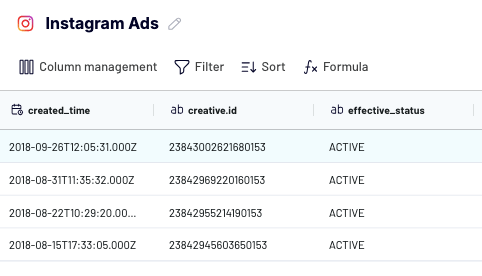
At this stage, Coupler.io generates a preview of the previously selected data from Instagram Ads. Review it and consider what modifications you would like to apply. Coupler.io offers a range of options for data transformation, management, and organization:
- Sort and filter data based on specific criteria. These features allow you to arrange data for the report to meet organizational standards.
- Hide columns to eliminate unnecessary information from the report.
- Add new columns with custom metrics calculation using mathematical formulas.
- Rename and rearrange columns for better visibility and focus on key aspects of ads.
You can also merge data from multiple accounts or even different advertising platforms with Coupler.io. To do this, you need to connect more than one data source during step 1
Once your dataset looks organized to your liking, move on to the destination setup step.
Step 3. Load data to Google Sheets and schedule updates
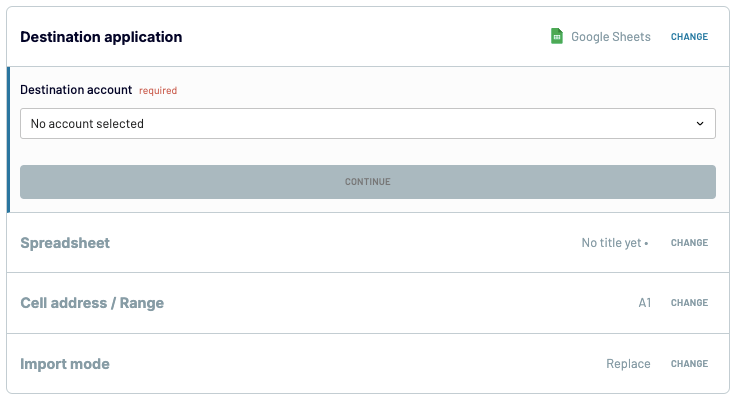
Connect Google Sheets by specifying your Google account and selecting the destination spreadsheet. Make sure to pay attention to the cell address, range, and import node settings before loading data from Instagram Ads to Google Sheets.
Coupler.io also allows you to connect Instagram Ads to Looker Studio, Power BI, and other destination apps.
Afterward, you will see an option for automatic data refresh. If you keep it disabled, the integration will run only once. If you activate it, set the interval for data refreshes and specify days and time ranges to complete the setup. That way, the integration will run according to the selected update options selected.

There you go! Check your Google Sheets document and see how it gets populated with data.
Load data from Instagram Ads to Google Sheets manually
It’s also possible to collect ad performance data manually and then upload it to Google Sheets. While this process is simple, it is not an optimal solution for reporting and analytics.
Step 1. Extract Instagram Ads data
- Open Meta Ads Manager on your computer browser.
- Select the Ads Reporting tab on the left menu panel.
- Verify the reporting period. Note that Meta Ads Manager only allows users to export ad data that is less than 37 months old.
- Click on the Export button and select the CSV option for download.

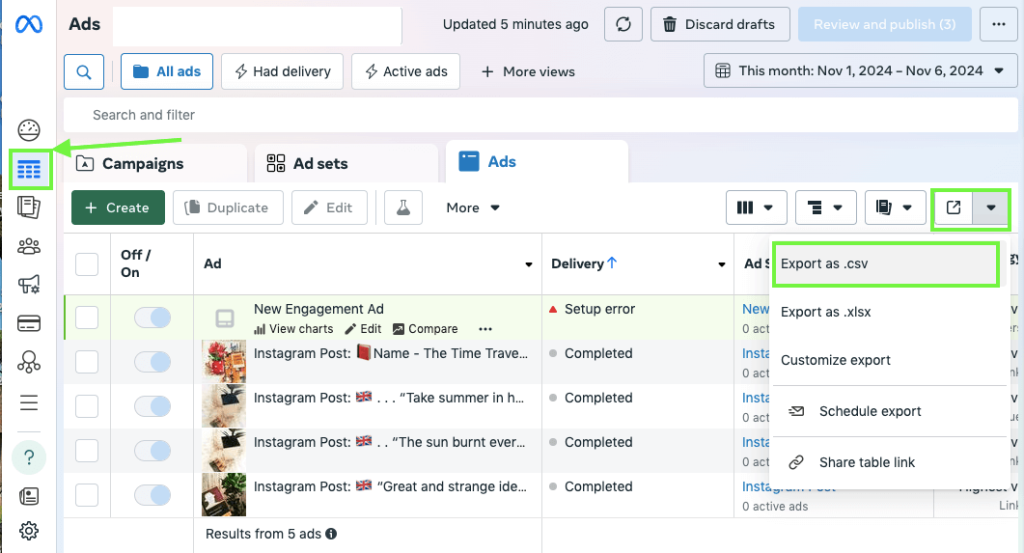
Another way to export Instagram Ads data from Meta Ads Manager consists of the following steps:
- Select the Campaigns tab on the left menu panel.
- Go to the Ads tab or another preferred tab.
- Verify the reporting dates.
- Click on the Export icon and select the Export as .csv option.
Step 2. Load data from Instagram Ads to Google Sheets
- Open a Google Sheets document.
- Go to File -> Import in the upper menu and select the .csv file with Instagram Ads data.
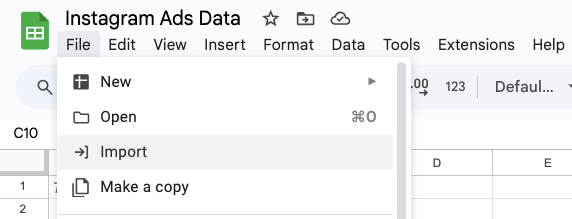
- Select the import location option: append to the current spreadsheets, create a new one, or other options.
- Select the separator type if needed. The automatic detection option is set by default.
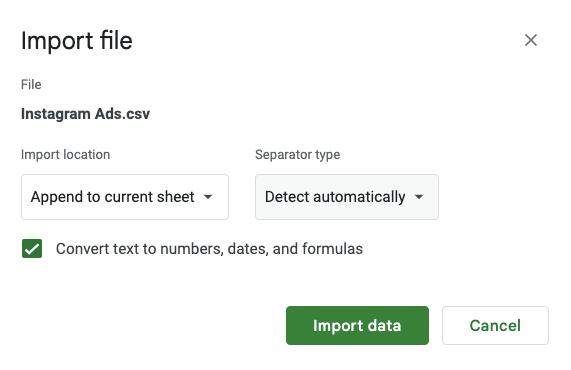
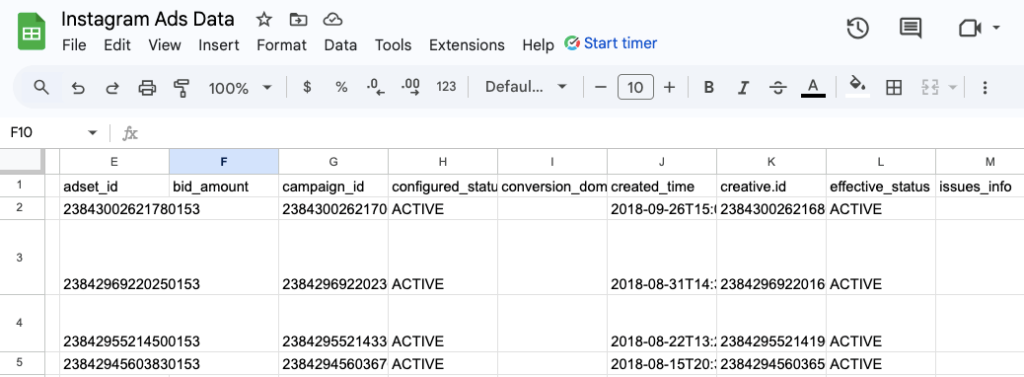
- Click Import data and see how your spreadsheets get populated with data.
Use Google Sheets add-ons to get Instagram Ads data
Another method for automated Instagram Ads to Google Sheets integration involves add-ons directly available on Google Sheets. They allow you to connect Instagram Ads and other data sources in a few clicks directly within a spreadsheet.
One useful Google Sheets add-on for Instagram Ads analytics is offered by Coupler.io. It allows you to connect Facebook Ads, LinkedIn Ads, etc., and load data from these sources to the same spreadsheet where Instagram Ads data already resides. This is particularly useful for cross-channel ad analysis.
To start using the add-on, follow these three simple steps:
Step 1. Install add-on
Open a Google Sheets document and navigate to Extensions -> Add-ons -> Get add-ons from the top menu. Start typing Coupler.io in the search bar and click the appropriate extension once it appears in the search results. Follow the on-screen instructions to install and configure it.
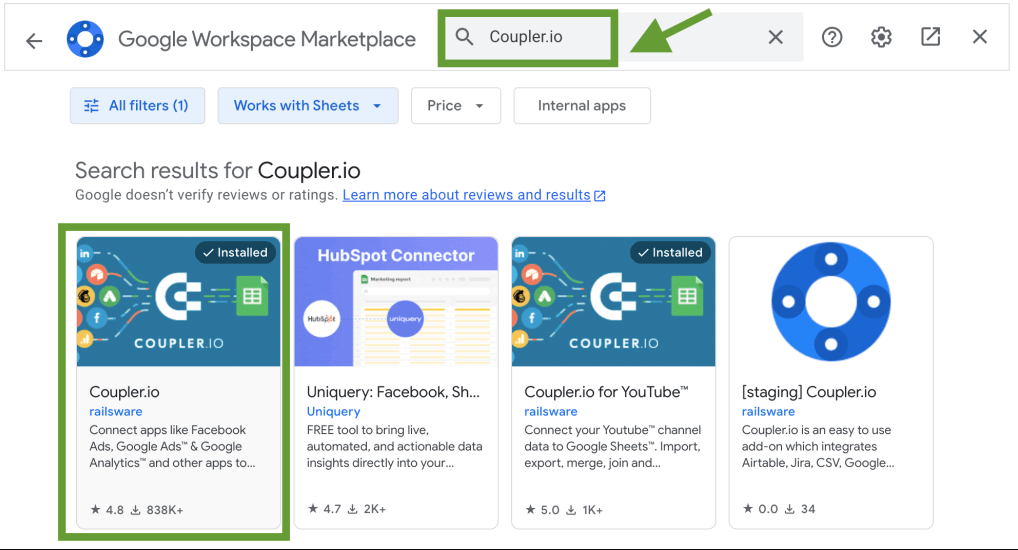
Or you can simply install it from the Google Workspace Marketplace.
Step 2. Launch add-on
Go to the Extension tab and find the Coupler.io add-on on the list. Launch it and sign into your account or create a new one.
Step 3. Create a new importer
Now, you can add a new importer right within the spreadsheet document. The steps for the creation of the Instagram Ads to Google Sheets integration are the same as for the web version described above.
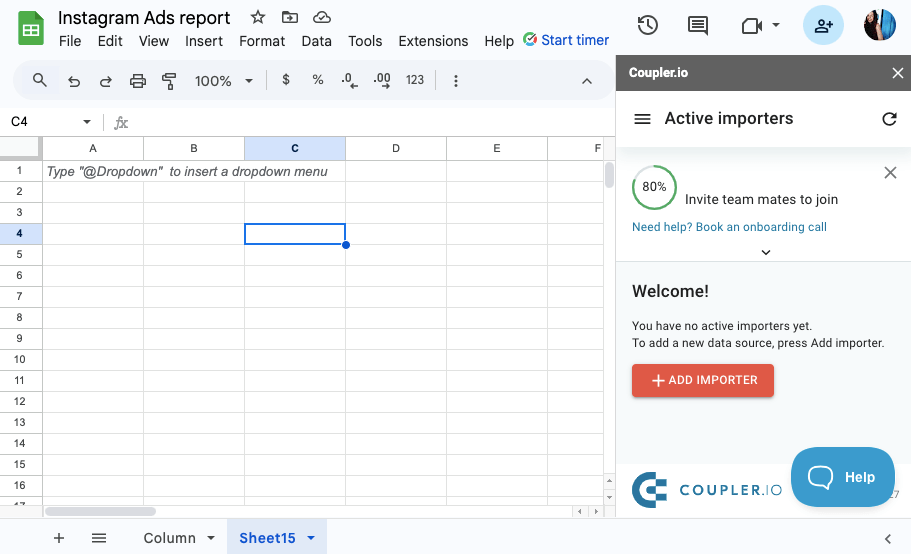
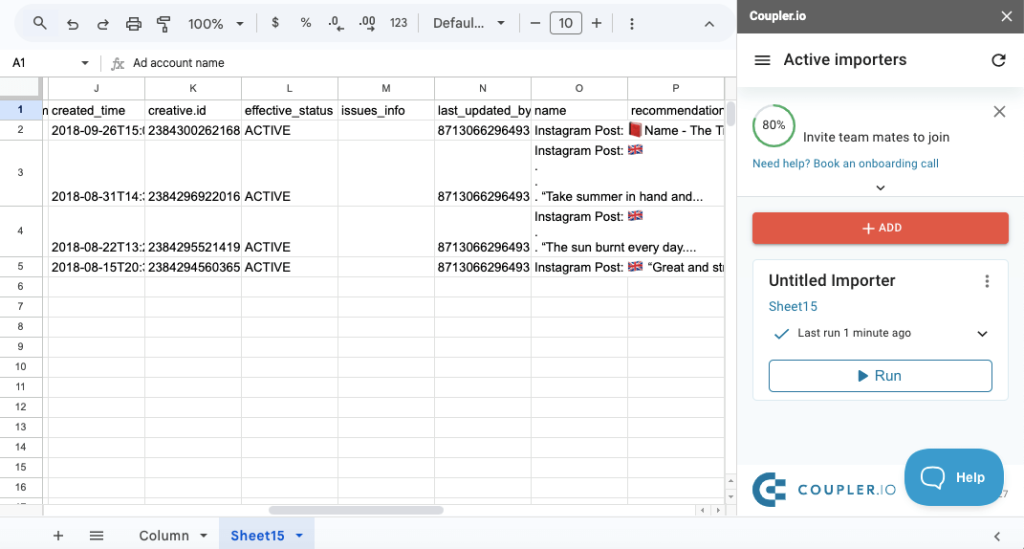
You simply need to create a new importer, select the data source and specify all the requested parameters for reporting, decide whether to apply any data transformations, select the current spreadsheet, and specify the scheduling options.
And that’s it! Your spreadsheet will be automatically populated with fresh data at your specified intervals.
What do you need to create a custom integration with Instagram API?
If you have a strong technical background and programming skills, you can use APIs to integrate Instagram Ads to Google Sheets. You will need to explore the Marketing API first to learn how to retrieve data on ad performance from Instagram and load it to the selected spreadsheet.
Step 1. Create and Configure a Facebook developer account
Since Instagram is a part of Meta corporation, go to Meta for developers. Create an account if you don’t have one yet or log in to your existing account. Then, follow the step-by-step instructions.
- Go to My Apps -> Create an App -> Next -> Other -> Business.
- Create a Facebook app to retrieve your ad data.
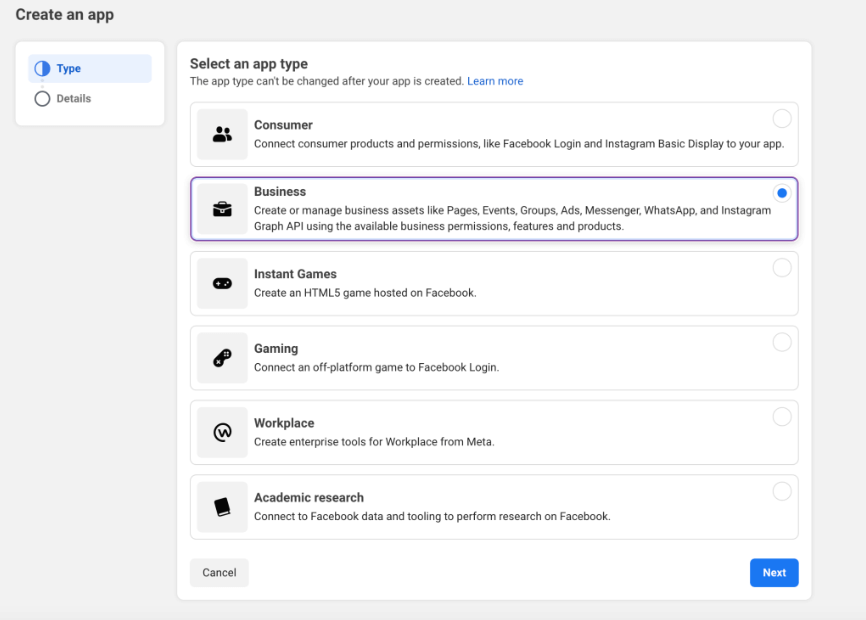
- Fill out the required fields by following the on-screen instructions and complete the security check.
- Generate an access token.
- Go to Tools -> Graph API Explorer and select the previously created app.
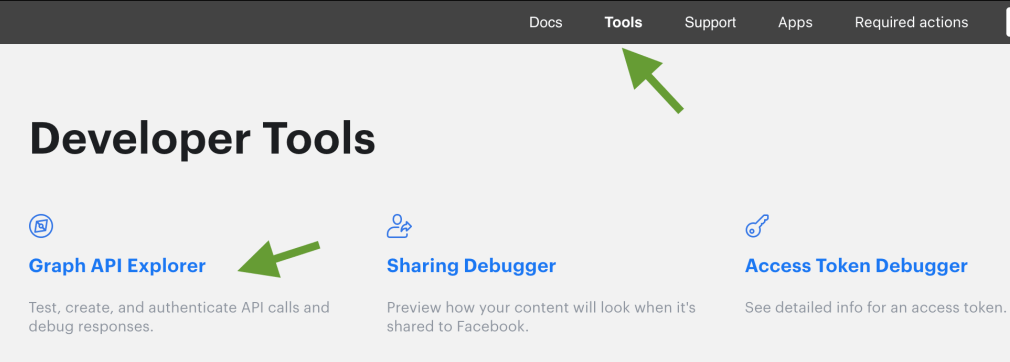
- In the User or Page field, select User Token. Add the ads_read permission and other necessary permissions.
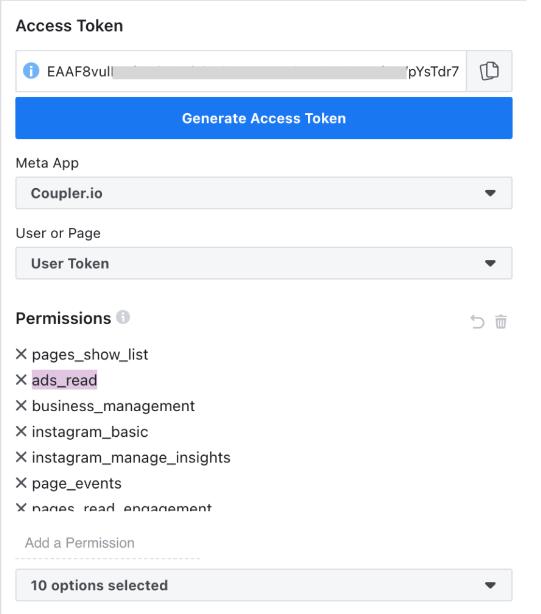
- Click Generate Access Token to link your app to Facebook.
With the access token available, you can fetch data from the API using the Apps Script extension directly in Google Sheets. In this case, you won’t need to interact with Google Sheets API.
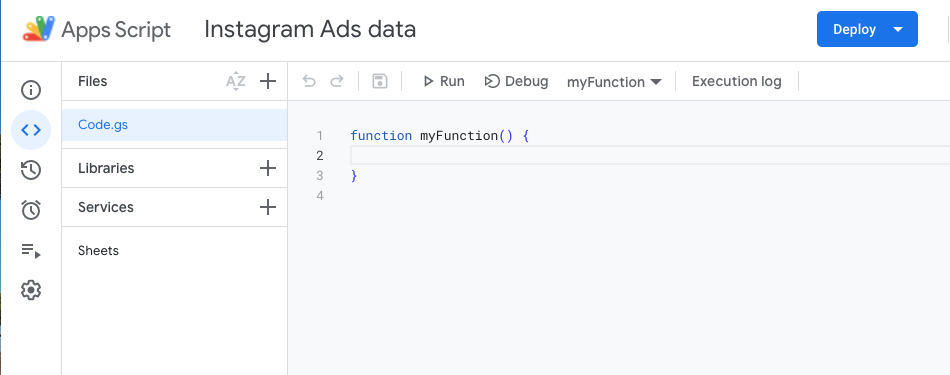
You can also create a custom Python script instead, but this requires interaction with both Instagram API and Google Sheets API, making the integration process more time-consuming.
Ready-made dashboard templates for Instagram
Building reports from scratch is tedious, but using pre-made Instagram report templates makes the process much easier. Coupler.io offers several ready-to-use, auto-updating templates for Instagram ad performance and user engagement overview.
These dashboards are designed for Looker Studio since this tool ensures more powerful reporting capabilities than Google Sheets. You can set up a template in less than five minutes by following the instructions in the Readme tab.
Meta Ads creatives dashboard
This dashboard allows you to track the performance of your ads in the Meta-owned social media, Facebook and Instagram. Using it, you can quickly access your most important stats like clicks, ad cost, CPC, or CTR. This, in turn, lets you spot key insights and trends for quicker and better decision-making.
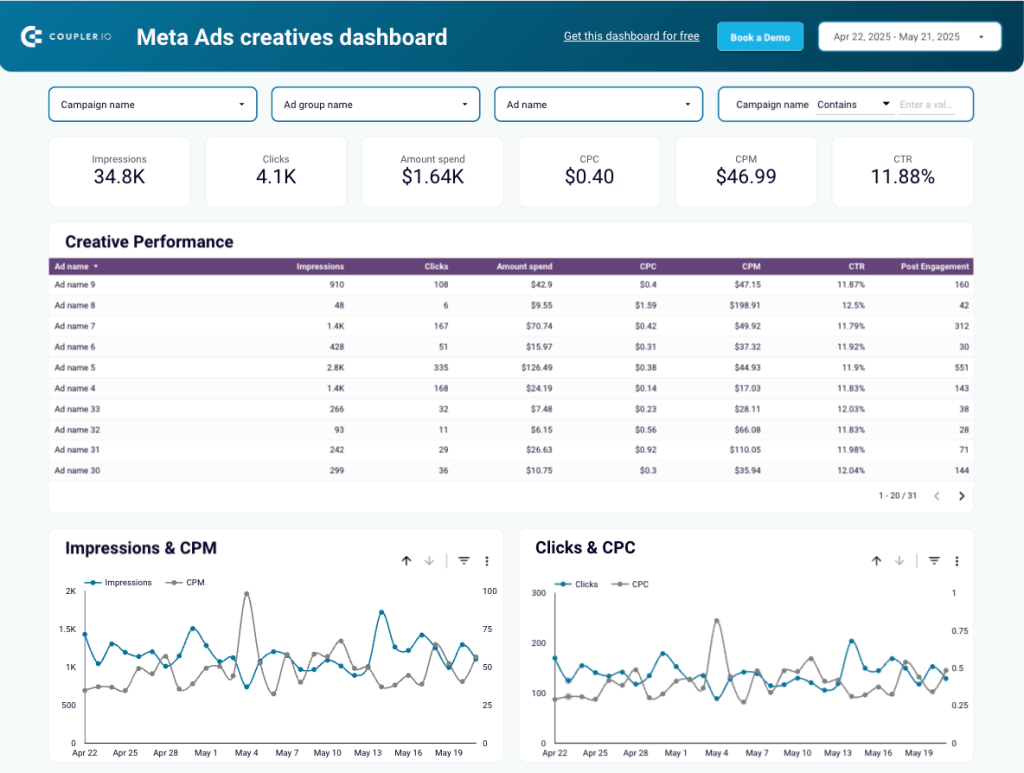
What insights does it provide? Apart from tracking the performance of your creatives on Facebook and Instagram, you can use this dashboard to measure your audience engagement through impressions and clicks on a timeline. The dashboard also lets you have a closer look at your ad budget utilization to plan ad spend for the future.
How to use it? To use the dashboard, click the link below. Next, go to the Readme tab for simple how-to setup instructions. Once you’ve connected your Facebook Ads and Instagram Ads accounts, you’ll see the dashboard populated with data in Looker Studio.
This dashboard connects to both Instagram and Facebook accounts and provides a consolidated view of the performance of Meta channels. Therefore, it might be useful for those who run their marketing campaigns on both social media platforms.
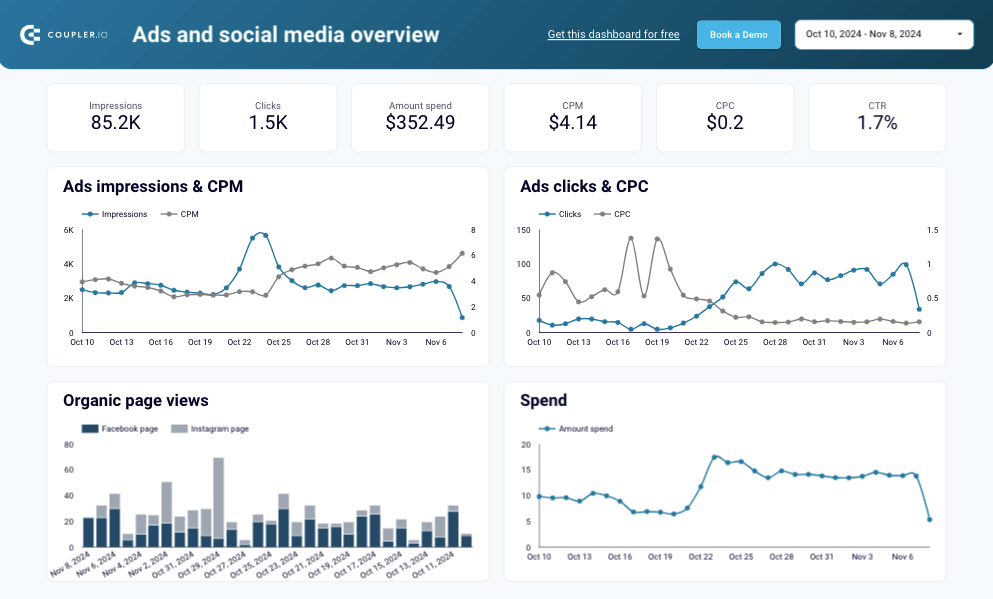
What insights does it provide? This dashboard provides multiple metrics, including impressions, clicks, CPM, CPC, ad spend, and many more. It will help you measure the performance and experience of your ad campaigns on Instagram and Facebook. The map visuals will help you uncover insights about your target audience’s behaviors.
How to use it? Click on the link below to open this template and go to the Readme tab for setup instructions. In brief, you will need to connect to your Instagram Ads account (and other platforms, if required), and your spreadsheet will get populated with ad data.
PPC multi-channel dashboard
This comprehensive cross-channel report lets you track your ads performance across 8 popular ad services in one single place. It brings your superb convenience and greatly speeds up your analytic work. No more switching between browser tabs to grasp all the data sources and get the entire picture!
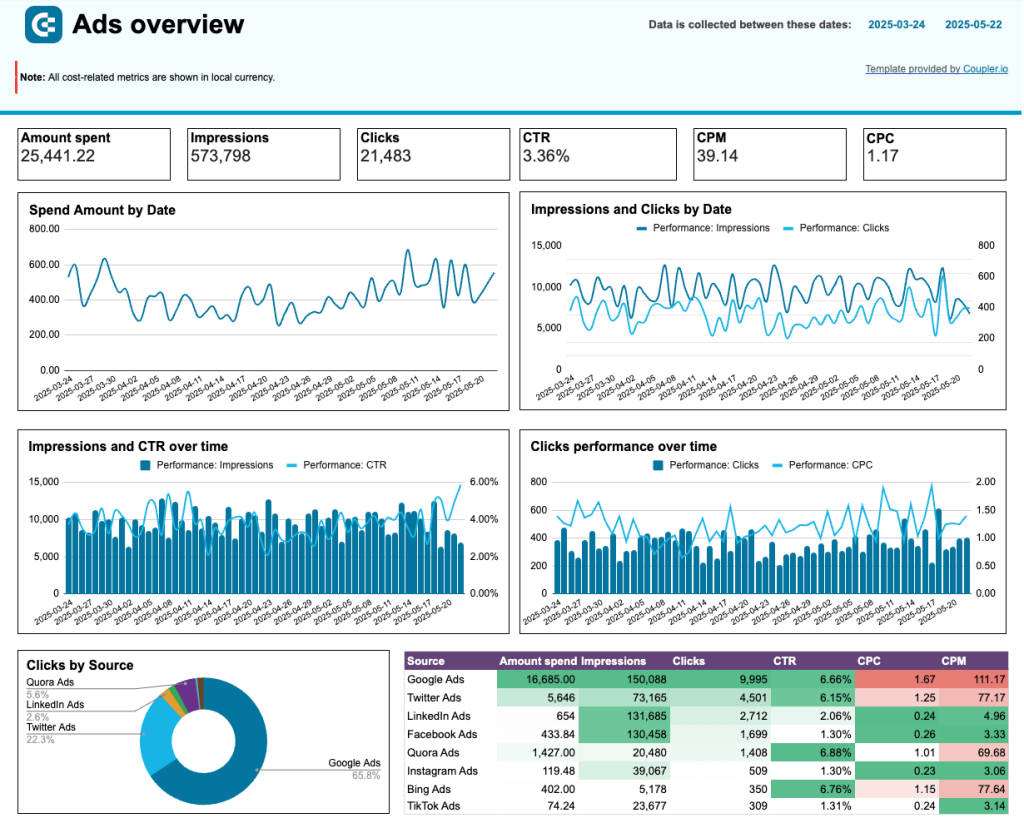
What insights does it provide? Apart from monitoring the overall performance, you can display stats for each and every ad service (e.g. LinkedIn Ads or Instagram Ads) with a few clicks. The dashboard gives you even more flexibility allowing you to combine campaigns from different channels to compare cost and impact. With a number of timeline charts, you can observe trends in time to plan your ad spend and campaigns in a better and more informed way.
How to use it? First, choose which data visualization tool you’d like to use the dashboard in by clicking a button below. When you connect your ad services, Coupler.io connector will do the behind-the-scenes magic to bring all the data into the dashboard.
All-in-one marketing analytics dashboard
This is a comprehensive marketing dashboard that connects not only to Instagram but also to Facebook, LinkedIn, YouTube, GA4, and other social media channels. It also connects to Mailchimp for email campaign performance evaluation. That way, you obtain a consolidated view of all your digital marketing efforts.
What insights does it provide? This dashboard allows you to observe how Instagram drives traffic to your website and detect its share in the overall traffic. It’s also possible to track the dynamics of user and revenue growth month-by-month. The same can be done for Instagram, LinkedIn, Facebook, and YouTube channels.
How to use it? The dashboard is available in Coupler.io and as a template in Looker Studio. To use the latter, go to the Readme tab for setup instructions. In brief, you will need to connect to your Instagram Ads account (and other platforms if required), and your spreadsheet will get populated with ad data.
Is Google Sheets enough for a comprehensive reporting workflow?
Google Sheets is a decent reporting solution since it allows users to organize marketing data in an efficient way and build visuals. Its powerful sharing capabilities enable multiple team members to work on the same spreadsheet. Despite all these benefits, Google Sheets might be insufficient for 360-degree reporting since it can’t handle large datasets and has limited analytical functions.
Many businesses use spreadsheets along with BI tools, such as Looker Studio, Power BI, and Tableau, for advanced analytics and reporting. These services help build comprehensive dashboards that can be shared with stakeholders. Thanks to Coupler.io, which supports Google Sheets, Looker Studio, Power BI, and Tableau, you can set up automatic reporting with regular data updates at a near real-time pace.
Automate PPC reporting with Coupler.io
Get started for free


