Instagram marketing is a fast-paced niche, so consistently analyzing your data is vital. This helps you understand what content performs better, who your followers are, and how they interact with your posts. An all-in-one Instagram dashboard makes it much easier to keep track of and interpret the key metrics.
After reading this article, you will know how to visualize your Instagram analytics data and build a live dashboard like the one above. We explain what metrics and graphs to include in your visualized report and how to make it using the Instagram Insights connector by Coupler.io.
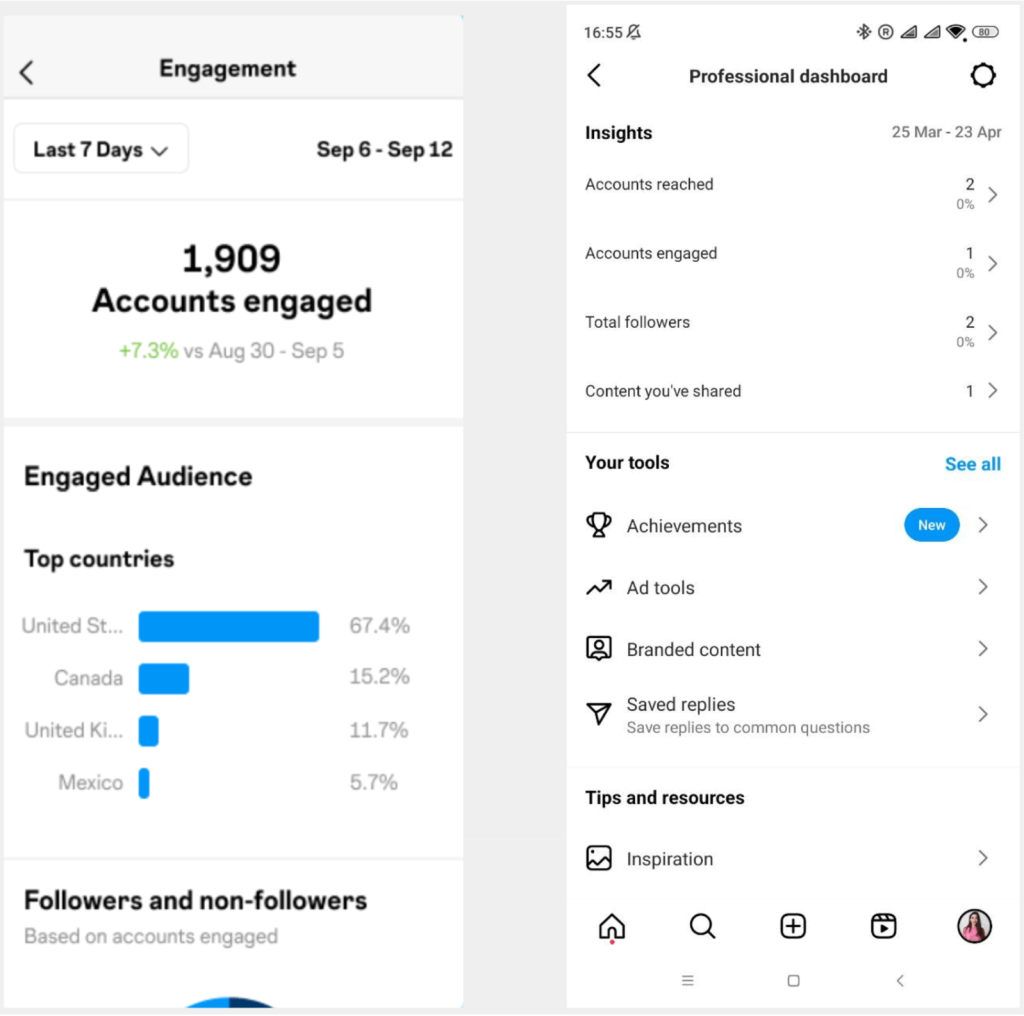
Wait, doesn’t Instagram have a native dashboard?
The answer is – yes, it does, but the native option has significant limitations:
- For some metrics, Insights data is only available for the last 30 days, which makes it difficult to conduct long-term trend analysis.
- Some demographic insights are unavailable if you have fewer than 100 followers.
- Instagram Insights analytics and the Instagram Professional dashboard can only be accessed from the mobile app.
- Most importantly, Instagram’s native dashboard can’t be customized, so you can only work with what you have out of the box and view insights as is.
Luckily, creating a custom dashboard outside of Instagram lets you overcome most of these issues.
You can easily export your Instagram Insights data and turn it into a vivid visual report on your own terms. Then, you will be able to analyze the results yielded by your content strategy, assess the efficiency of your marketing campaigns, and streamline the data analytics process.
What metrics to include in an Instagram analytics dashboard?
Obviously, a lot depends on your specific goals and focus, but here are the most important KPIs to track in your dashboard.
- Follower count – the number of people who follow you on Instagram. You need to monitor it closely to ensure follower growth.
- Follower reach rate – the percentage of your followers that were reached within a certain period of time. This is one of the most important Instagram metrics as it shows how active your followers are.
- Reach – how many unique users, in total, were reached during a specific period.
- Reach by content type – the breakdown of how different types of content performed in terms of reach.
- Views – how many times your content was seen by the audience within a selected timeframe. One person can have multiple views.
- Engagement metrics – these are KPIs that show how your audience interacts with your content. This includes Likes, Shares, Comments, and Saves.
- Clicks – this is when a user clicks links on your contact details or messages: Website clicks, Get directions clicks, Phone call and Text message clicks.
- Follower demographics – how many people of a certain age and gender were reached by your content. This metric is important as it helps you understand your Instagram audience better.
- CTR (Click-Through rate) – the percentage of the reached people who clicked one of your links. The formula is: (Clicks / Impressions)*100%.
- Engagement rate – the percentage of your followers who interact with your content. The formula is: (Total interactions / Total followers)*100%.
- Top-performing posts – your Instagram posts that got the most engagement or the biggest reach.
Now, let’s see how to create an Instagram dashboard.
Create a live dashboard from scratch in a BI tool or spreadsheet
If using an Instagram dashboard template is not for you, starting with a clean slate is also an option. It’s especially convenient when you are already proficient with some data viz tools (Looker Studio, Power BI, Tableau, Qlik). If not, you can easily create social media dashboards in Google Sheets or Excel. Let’s see how to do this, step by step.
Collect your Instagram analytics data
To start building your auto-updating dashboard, select the destination app from the form below and click Proceed.
Create a Coupler.io account if you don’t have one – it’s free and only requires a few clicks.
Then, connect your Instagram business account and select the report type you need. There are three groups of reports: Post insights, Story insights, and Profile insights.
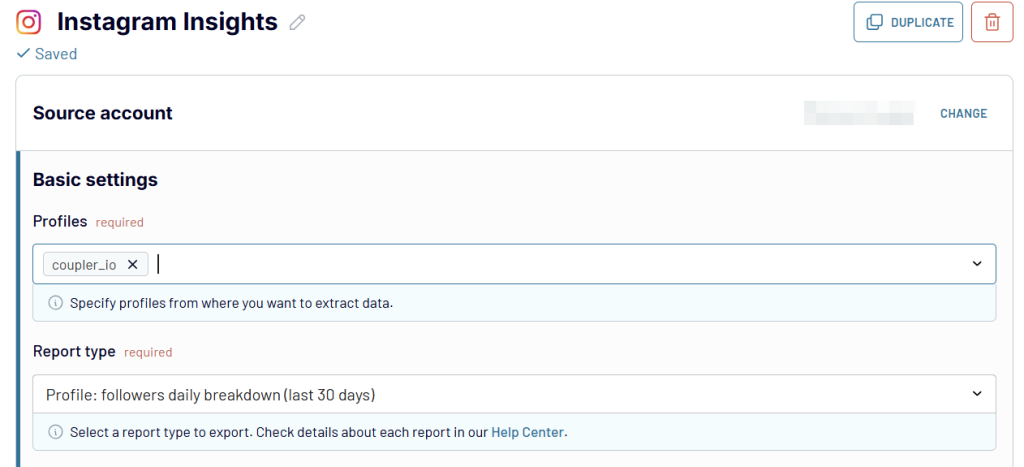
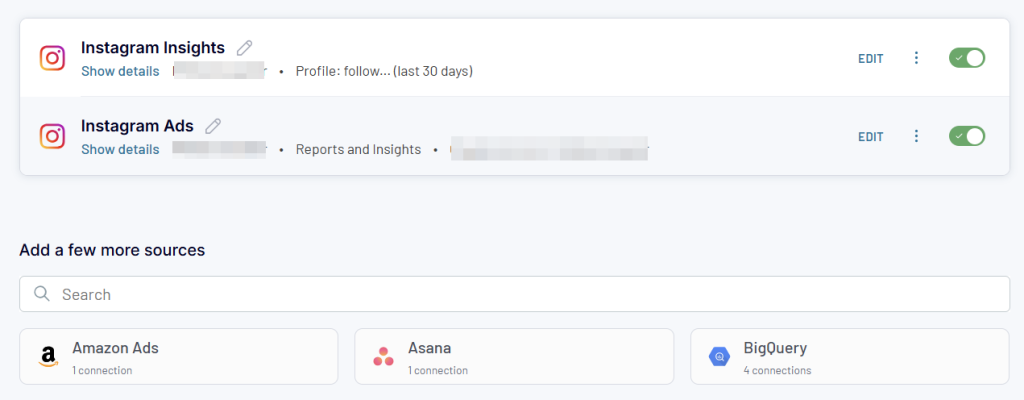
Before moving to the next step, you have an option to add one more source to combine your Instagram Insights data with other information. This could be multiple reports in one view, a combination of Instagram Insights and Ads, and so on. Just select the needed source and configure it accordingly.
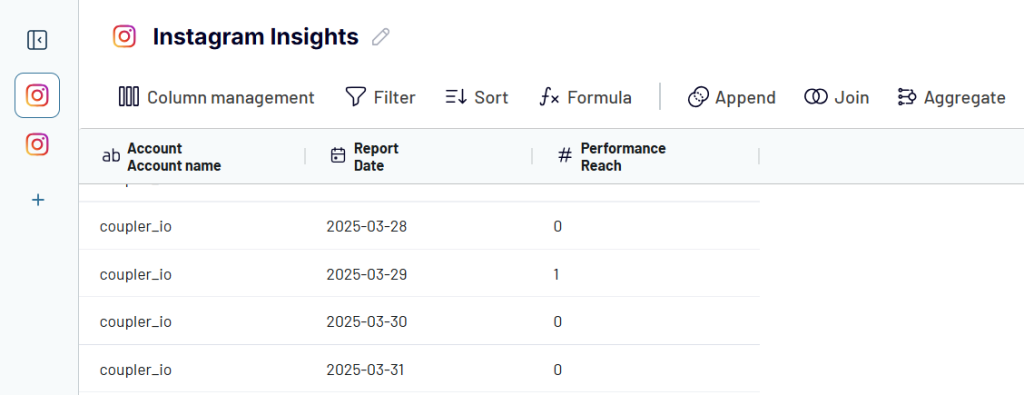
Organize and transform data
In the next step, you can preview and edit your dataset to make it analysis-ready. In particular, you can:
- Hide unnecessary columns – they won’t be imported
- Rename, rearrange, split and merge columns
- Use formulas to calculate custom metrics in new columns
- Sort and filter data by multiple parameters
- Aggregate data to by perform operations like sum, average, count, min, or max
- Merge and join data from different accounts or sources into one dataset.
Load data and schedule updates
Then, follow the wizard instructions to connect your destination app – a data viz tool or a spreadsheet app. The exact steps depend on the tool you choose.
Specify your preferences for the automatic updates to make your report evergreen. Coupler.io can regularly send your Instagram data to the destination app at intervals ranging from every month to every 15 minutes.
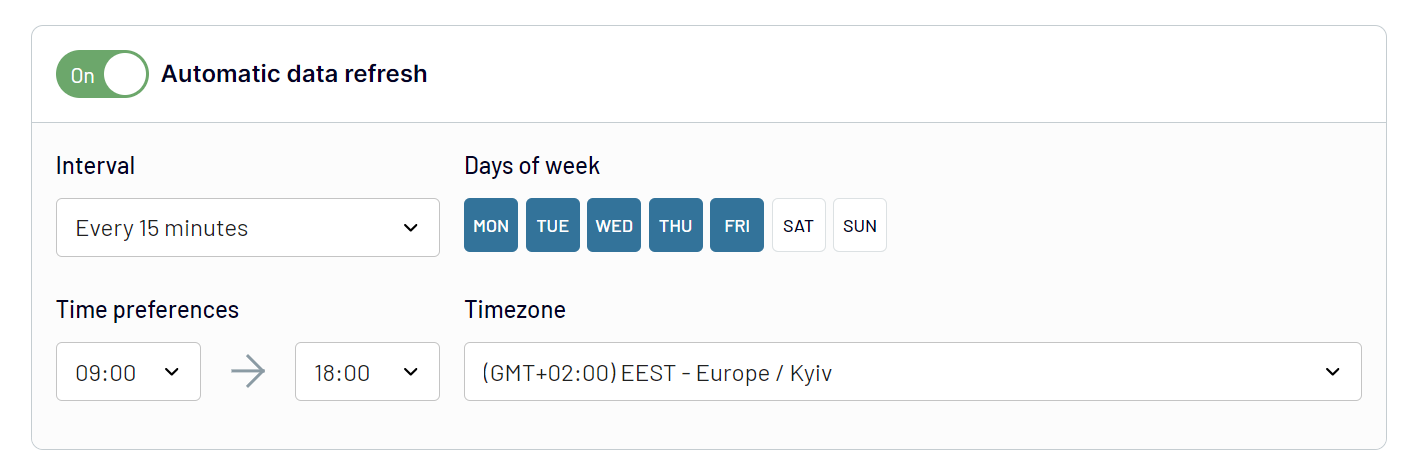
Once this is ready, save and run the dataflow. Coupler.io will refresh the dataset in your destination according to the set schedule. This will make your report live
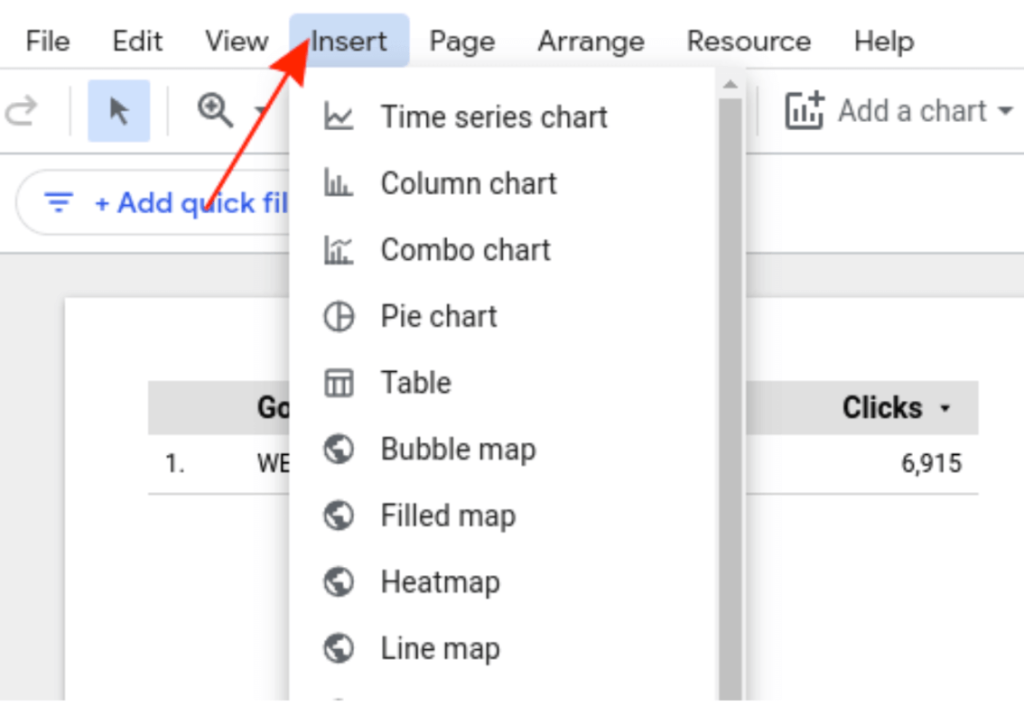
Visualize your data
Now, you can start adding various graphs and charts. The exact steps depend on the tool you use to build your Instagram reporting dashboard. In the selected app, navigate to the chart selection menu and pick the graph type you need.
Check out influencer marketing dashboards you should use in 2025.
If you are going to build your dashboard in Looker Studio, you can check our video tutorial to help you navigate this:
What insights your Instagram analytics dashboard should provide
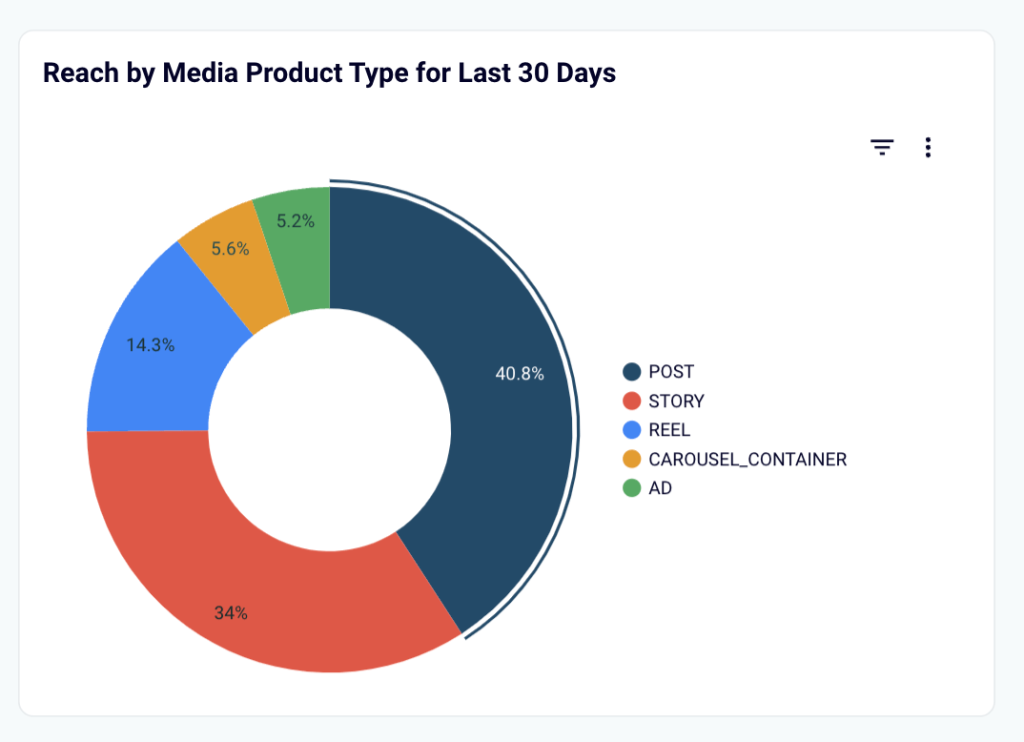
- Check performance by content type
See how different content types perform in terms of reach. For instance, in the pie chart below, we can see that regular posts and Instagram stories reached the most users over the last 30 days. Reels also show promising results, accounting for over 14% percent of reach. You can use this information to update your marketing strategy in favor of the top-performing formats.
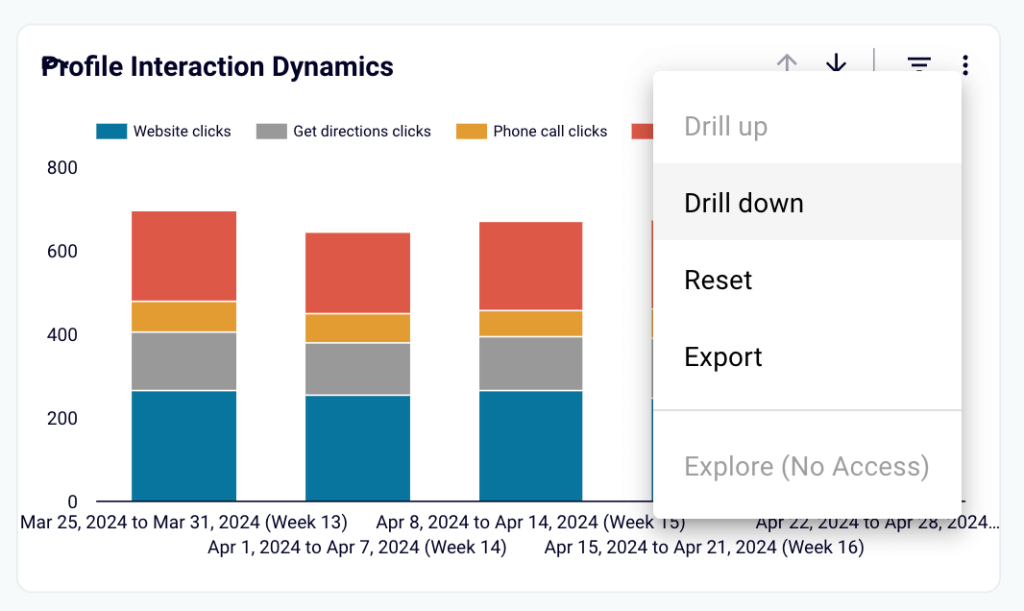
- Analyze profile interaction dynamics
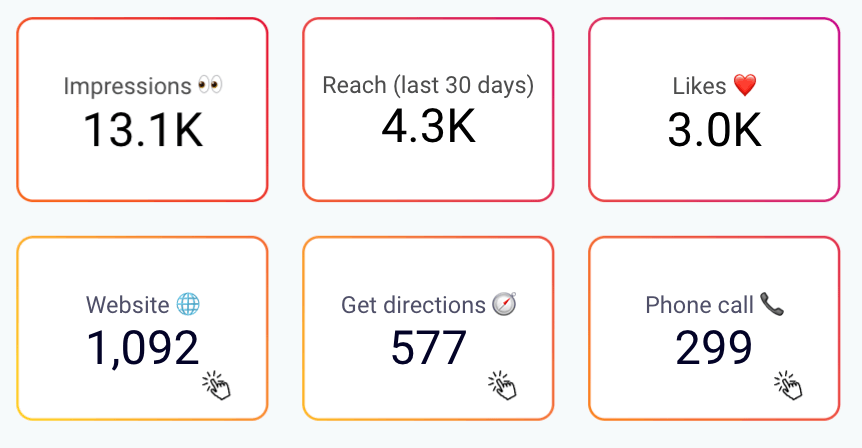
Compare how the results change week-to-week and analyze what brings you clicks. For instance, the graph below suggests that the audience is more interested in visiting the company’s website than calling by phone. This information can be used to make adjustments to the user journey.
In addition, the dashboard allows you to explore your data from different angles. You can drill up for a more high-level view or drill down for more granular details.
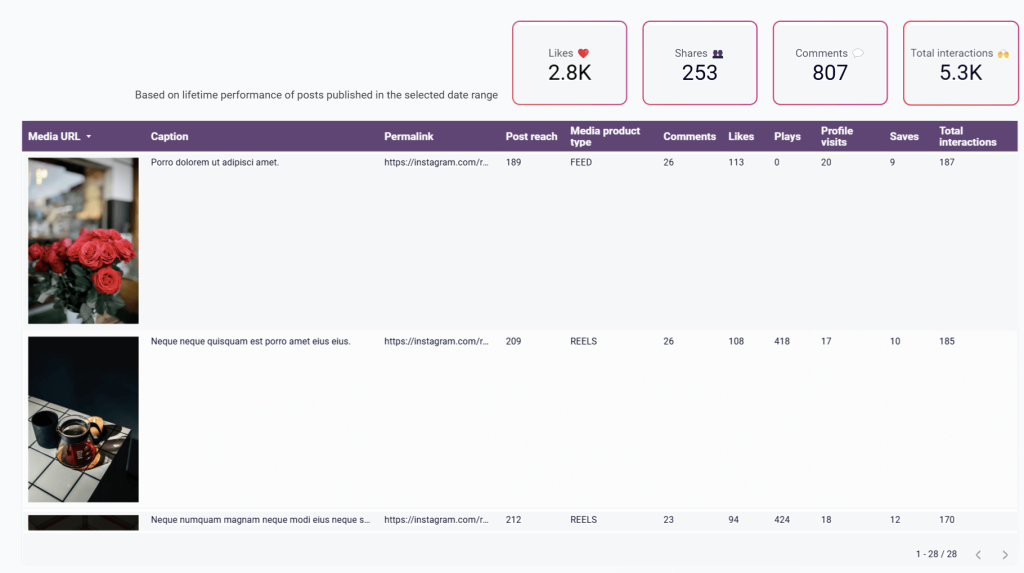
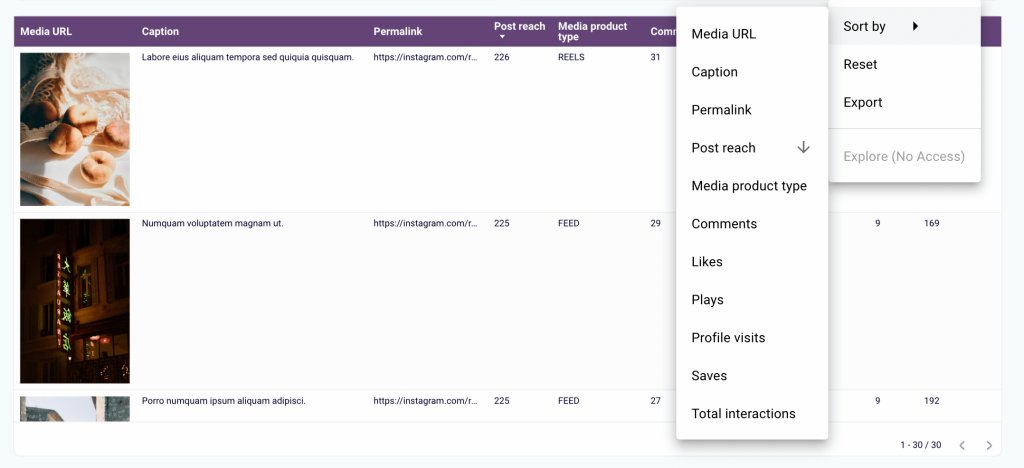
- Explore post performance
While the other graphs show aggregated data, this data table allows you to look “under the hood” and see how each of your posts performed. You can sort this data by different parameters and see which posts were saved the most, got the most interactions, and so on. This lets you determine the most engaging topics and media types to make your Instagram strategy more powerful.
In this example, data is sorted by reach.
What graph types to use for an Instagram reporting dashboard?
- Pie chart. It’s a good choice for comparing different categories. For example, you can use it to visualize Instagram performance by content type – then you will see at a glance which formats drive results and what to focus on.
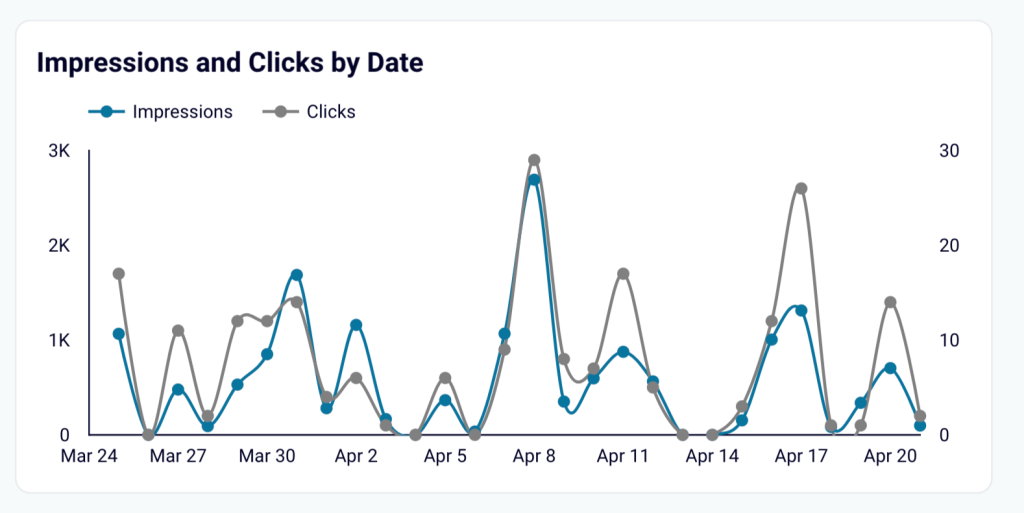
- Line graph. This visual type is perfect for tracking the key performance indicators. It allows you to see how various trends change over time. For example, you can check how clicks and impressions correlate with each change depending on the season.
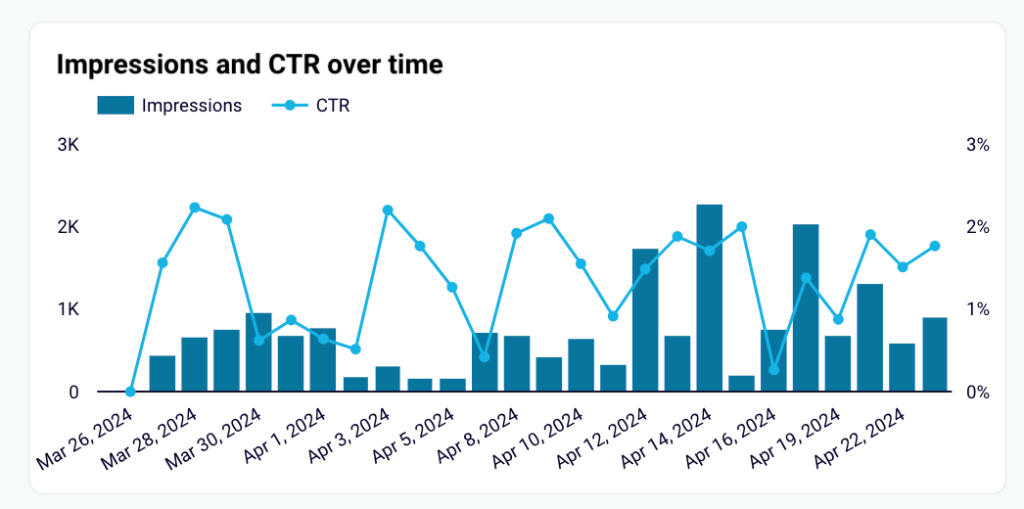
- Bar graph. Just like line charts, bar graphs are useful for monitoring dynamic processes and tracking seasonal changes. You can use bars of several colors or even add a line to compare different categories and analyze correlations.
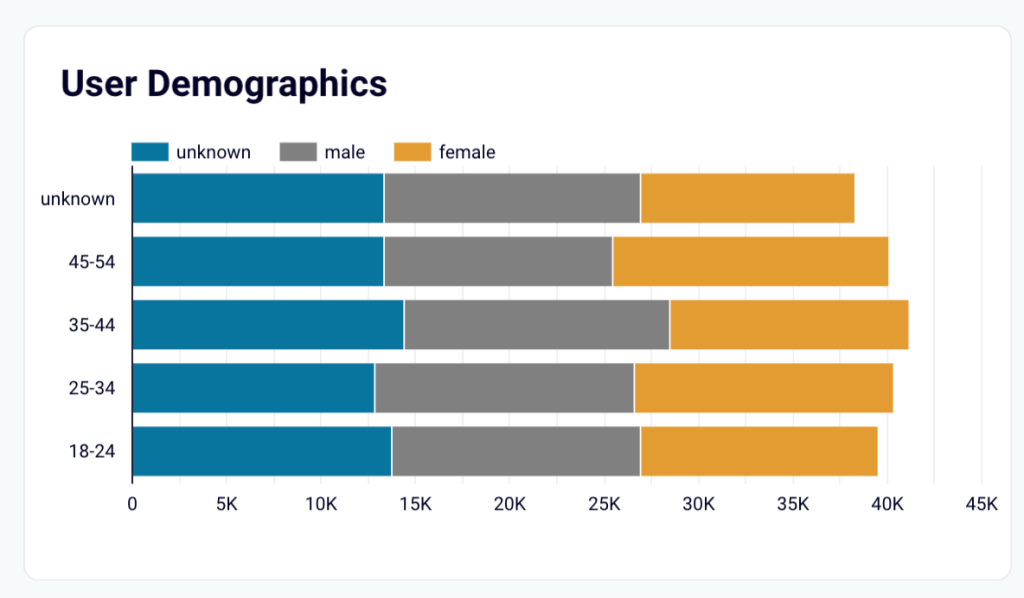
- Stacked bar chart. Use this graph when you have different subcategories within a category. Each subcategory should be presented with a different color. For example, in the graph below, we have age range categories with different gender subcategories.
- Scorecard. You can use them to represent the key metrics. This makes it easy to keep everything under control and see changes at a glance.
- Gauge chart. This one is helpful when you need to track progress or see how much of a planned result was achieved. For example, you can use it to track the actual number of followers versus the planned number.
- Data table. Using a table is recommended for organizing the data on individual post performance. This format allows you to easily filter and sort the results and drill down into the Instagram content performance.
For more details, you can check our article on the 20 Types of Graphs for Marketers.
An alternative: exporting your data manually
It’s also possible to build an Instagram analytics dashboard without using any automation tools. You can export your data manually and then upload it to the selected app where you plan to visualize it. However, in this case, your dashboard won’t be live and won’t update automatically. Therefore, we don’t recommend this method because it will inevitably lead to delays, and you may not have an up-to-date picture on time.
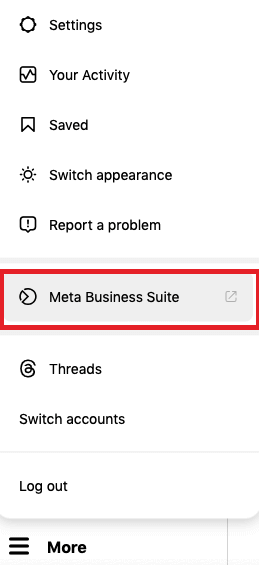
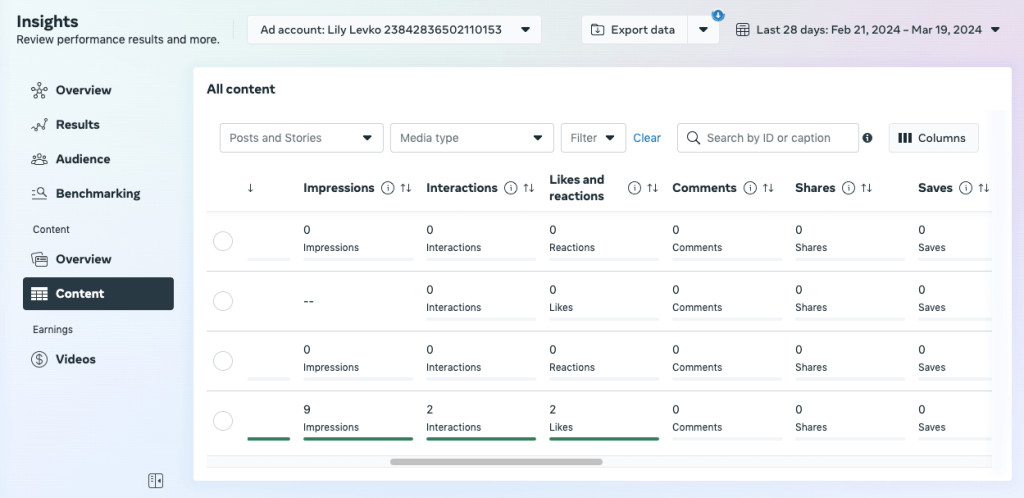
To extract your data manually, go to your business account. Select More -> Meta Business Suite. There, in the menu on the left, click Insights -> Content.
In the Content tab, click Export Data in the upper right corner. Then, go to the Instagram tab, select your preferences for the report to extract, and click Generate.
The report generation may take some time. Once it’s ready, you can download it as a CSV file. This format is supported by many apps, so you should have no trouble importing it to the destination of your choice.
If you also run ads on Instagram, you can use this free template to get a dashboard with an analytical overview.
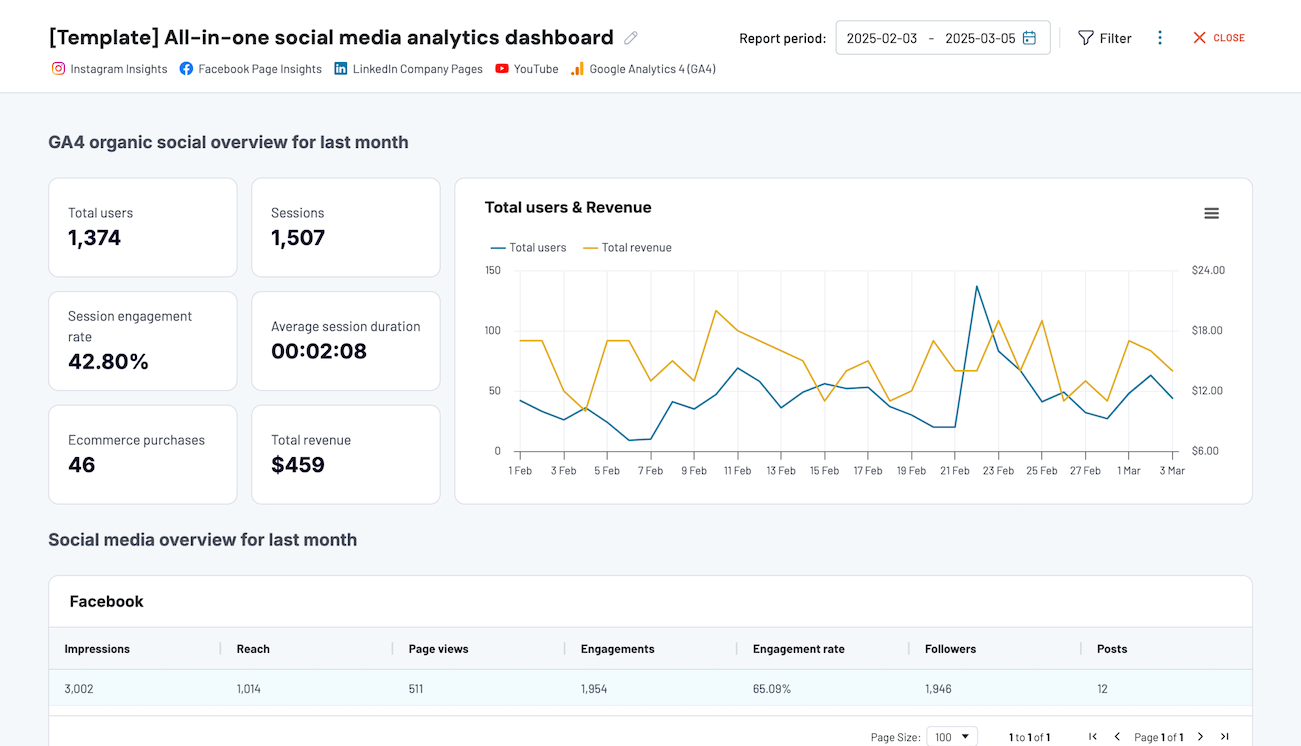
This template supports various social media platforms, including Instagram, Facebook, LinkedIn, and YouTube. In addition to this data, the dashboard also collects information from Google Analytics to present in one convenient overview. This way, you can easily check the key performance metrics and conduct cross-channel analysis in one place.
All-in-one social media analytics dashboard
 Preview dashboard
All-in-one social media analytics dashboard
Preview dashboardThe dashboard is available in the Coupler.io interface and as a Looker Studio template. Choose the version you prefer and try it right away for free!
Check out our other free templates for marketers in our Dashboard Gallery.


