Having all your data in one place makes creating comprehensive business reports a breeze. But when you look at data scattered across different apps, spreadsheets, and more, it can feel overwhelming. However, the good news is, in most cases, there are relationships between these tables. So, by leveraging these relationships, you can join tables in Power BI to create a unified view.
How, you may be asking?
First, you need to prepare your data, understand different relationships, and choose the right join type. This article will guide you through each step. Let’s dive in!
Types of joins
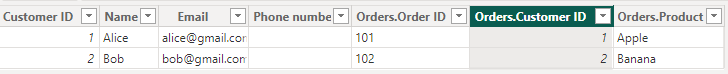
To understand how each join works, we’ll use two example datasets, ‘Customers’ and ‘Orders.’
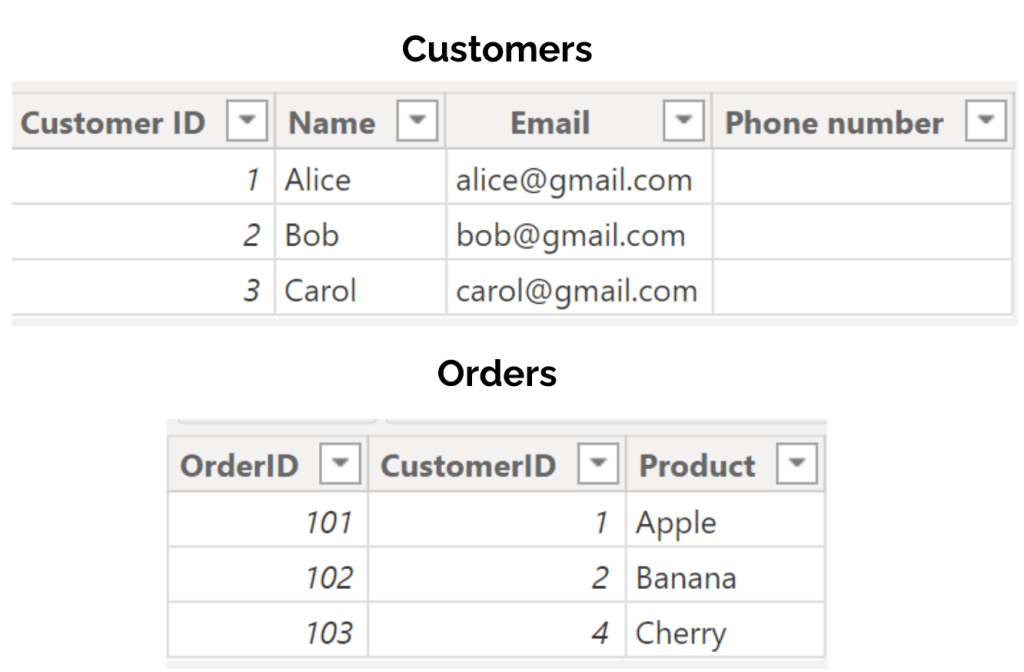
Before we discuss the join kinds, it’s important to understand the unique identifier column. This column has unique values for each row and must be in both tables to create a relationship and join them. In our example, the unique identifier column is Customer ID.
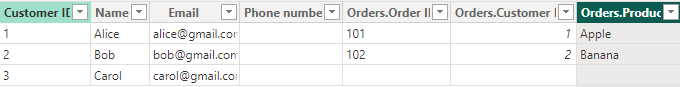
Left outer join: This join combines all rows from the left table (Customers) with rows from the right table (Orders) where the unique identifier column (CustomerID) matches in both tables. If there’s no matching row in the right table, the result will show NULL for the right table’s columns. This join type is used to identify customers with zero recent purchases.
Example: Joining on CustomerID to see all customers and their orders if they have any.
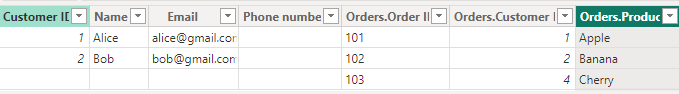
Right outer join: This join merges all rows from the right table (Orders) with rows from the left table (Customers) based on a matching unique identifier column (CustomerID). If a matching row does not exist in the left table, the result will show NULL in the columns from the left table. This join is helpful for finding any orders that do not have proper customer information.
Example: This shows all orders, attaching customer names where available.
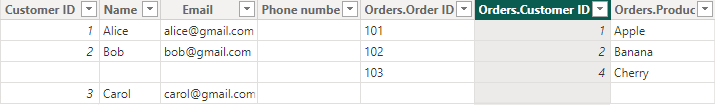
Full outer join: This join includes all rows from both the left table (Customers) and the right table (Orders) by matching rows with the unique identifier (CustomerID). Where there is no match, the result displays NULL in the missing side’s columns. This join gives an overview of all records in both tables, highlighting unmatched records on either side.
Example: Shows all orders and all customers, matching them where possible.
Inner join: This join returns only the rows where there is a match in both the left table (Customers) and the right table (Orders) based on the unique identifier column (CustomerID). It is useful for analyzing data present in both datasets, like order data and customer details.
Example: Shows customers and their corresponding orders, excluding any unmatched records.
Left anti join: All records from the left table (Customers) that do not have a matching record in the right table (Orders). It can be used to identify customers without orders and target them with special offers.
Example: Useful for identifying customers who have not placed any orders.

Right anti join: Shows all records from the right table (Orders) that do not have a corresponding record in the left table (Customers). You can detect and clean up data errors like orders placed under invalid or deleted customer accounts with this join.
Example: Identifies orders that are not linked to any customer in the database.

Different ways to join tables in Power BI
Power Query Editor: This is an in-built feature within Power BI that is used to transform data. To join tables in Power BI, you can simply select the Merge Queries option, specify the columns to join on, and select the join type. It is very helpful in data transformation with various other features like append queries, pivots, data cleansing, data profiling, and more. While joining tables is easy with Power Query Editor, the data in the joined columns remains static and must be updated manually.
Learn more about how to merge queries in Power BI.
Coupler.io: If you need to import and join data from different sources to Power BI, then Coupler.io is a good option. It is a reporting automation platform that supports 60+ cloud sources like Facebook Ads, Google Ads, and LinkedIn Ads and lets you join data on the go. Coupler.io also organizes and transforms your data with features like column management, filtering, sorting, and custom columns. Not just Power BI, you can export your data to multiple destinations like Looker Studio, Tableau, Google Sheets, and Excel.
DAX: Data Analysis Expression is a formula language in Power BI to perform dynamic and complex data operations. To merge tables using DAX, you must create calculated columns and establish relationships referencing data from multiple tables. It recalculates columns dynamically as data updates and keeps your reports up-to-date without manual intervention. However, DAX is more complex and has a steeper learning curve than simple solutions like Coupler.io and Power Query Editor.
How to join tables in Power BI with Coupler.io
The process is simple and includes only 3 steps. We’ll be joining data from two sources – Google Search Console and Google Analytics to understand the SEO performance of the website.
Step 1: Collect data
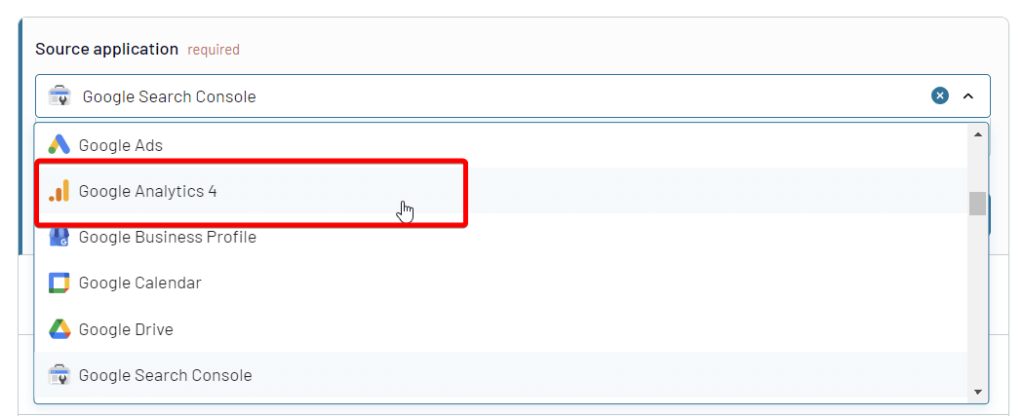
We selected Google Search Console as the source and Power BI as the destination. You can choose your source app from the dropdown and click Proceed in the form below.
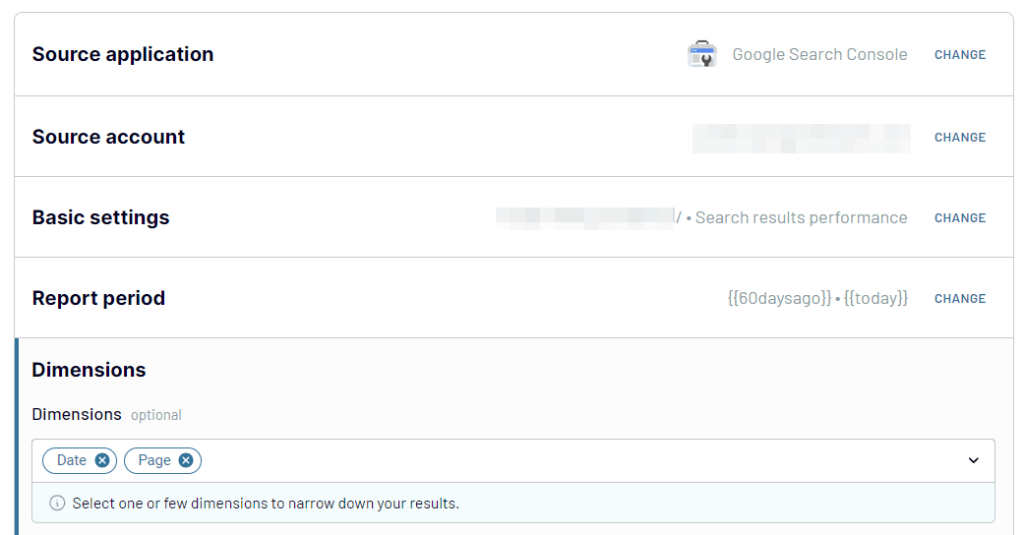
Continue by signing up for a free Coupler.io account. Configure the source settings by connecting your Google Search Console account. Select sites for analysis, report type – Search results performance.
Specify the report period (start and end dates), and optionally you can modify dimensions. We selected Date and Page.
Now let’s add the second source – Google Analytics 4.
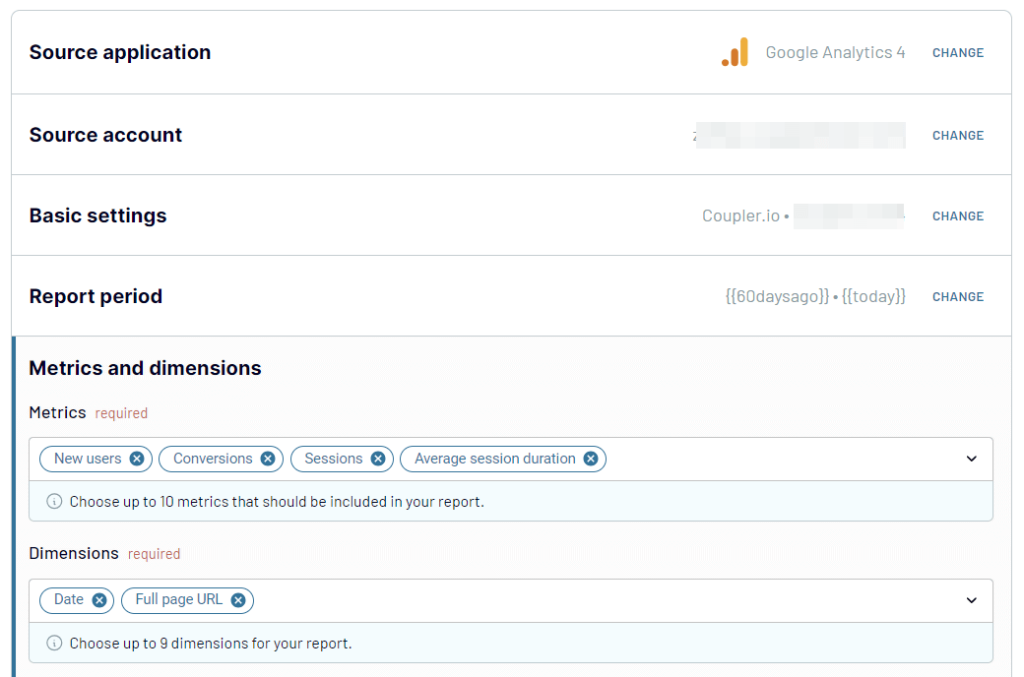
Link your GA4 account, select the property and report time period. Choose the required metrics: New Users, Conversions, Sessions, and Average Session Duration.
Make sure that the dimensions you select in GSC match those in GA4. For our case, we chose Date and Full Page URL.
Now click on Transform data.
Step 2: Transform data
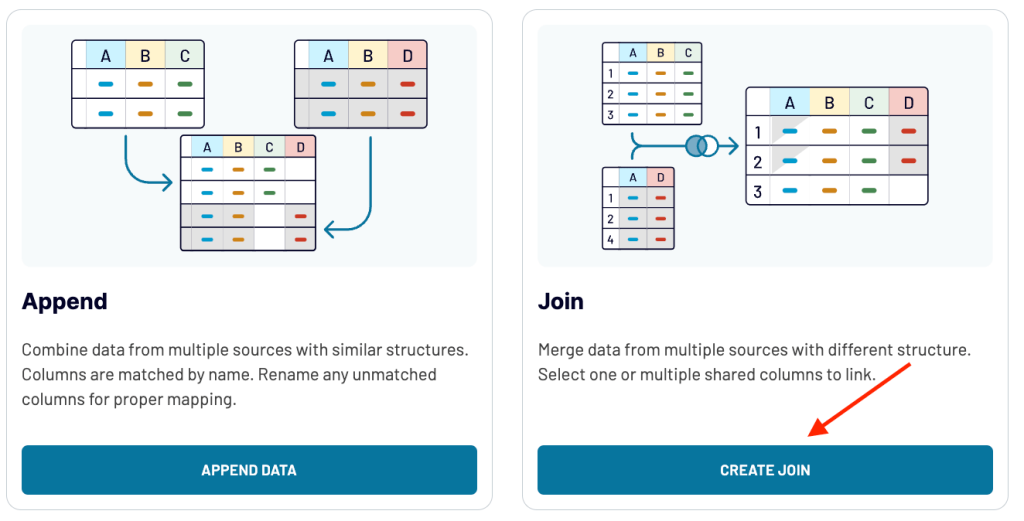
Once all the data sources are added, the next step is to join the data. You’ll see two options here – Append and Join.
- Append – You can combine data from different sources with similar structures to get an overall view of all the data. In this option, columns are matched by name.
- Join – You can merge data from multiple sources with different structures with Join. You need to select one or more unique identifier columns to link the data.
Click on Create Join option.
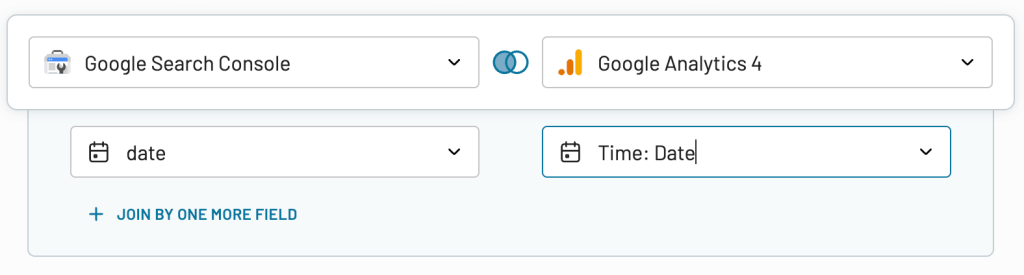
Let’s select the unique identifier column from each source to join two tables in Power BI. We are selecting ‘Date’ from GSC and ‘Time: Date’ from Google Analytics 4.
Click on Join Data.
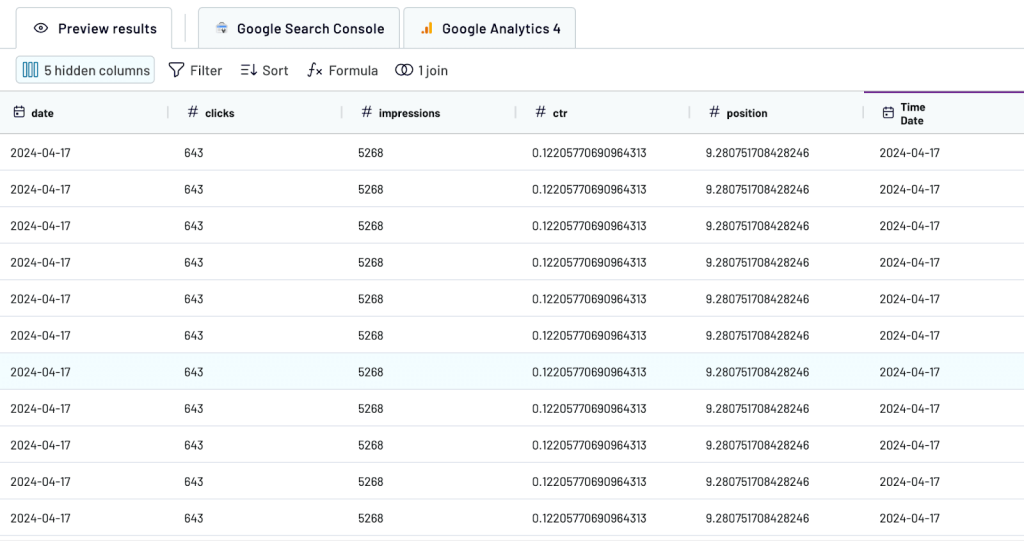
You’ll see a preview of the joined data. You can also prepare and organize this combined data for export using Coupler.io’s data transformation features.
- Column management: Hide unnecessary columns, rename columns, and reorder the needed ones.
- Filter: Use filters to focus on important data, like pages with more than 1000 unique clicks.
- Sort: Arrange your data based on a high to low number of impressions.
- Custom Formulas: Create calculated fields to get more insights.
Step 3: Load data and schedule refresh
When the data is ready to export, go to destination settings. Copy the integration URL and run the importer.
Go to Power BI Desktop. Click on Get data and select the Web option. Paste the integration URL in Power BI.
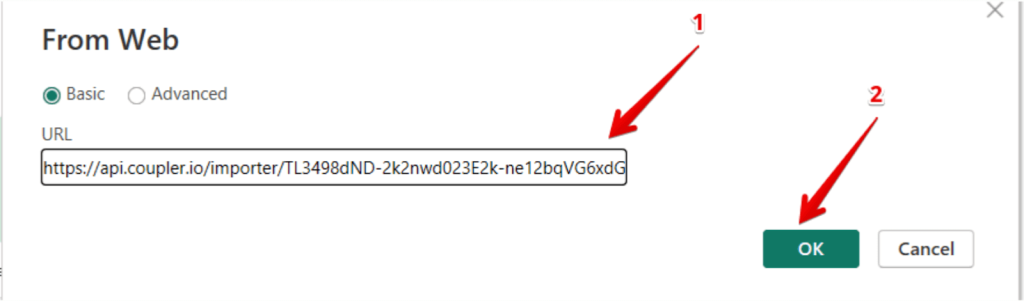
After establishing the connection, you’ll see a preview of the joined data. Click on Load data.
Go back to Coupler.io and set up an automatic data refresh schedule. You can choose the frequency of the updates, from every 15 minutes to once a month.
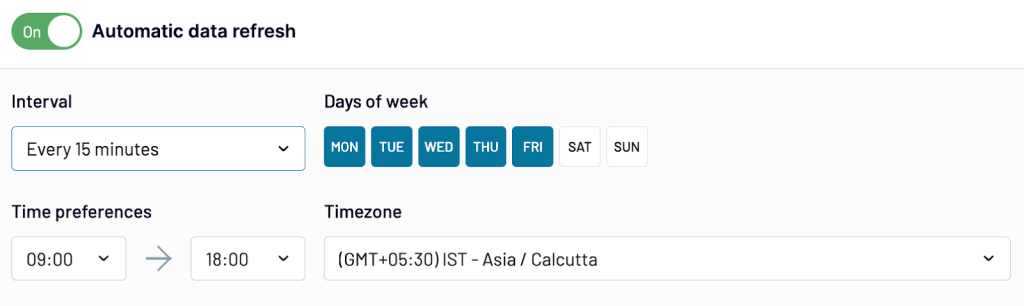
Now, you have near real-time data joined from different sources in Power BI. You can also use this data to build an SEO performance report and make data-driven decisions.
How to join tables in Power BI using Power Query Editor
In this section, we’ll merge two tables in Power BI, ‘Sales transaction data’ and ‘Employee data’, using Power Query Editor to understand the sales performance of each employee.
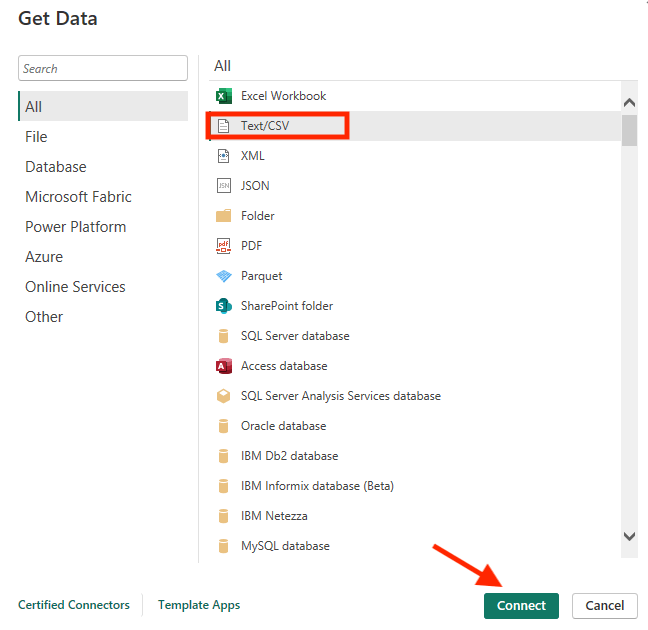
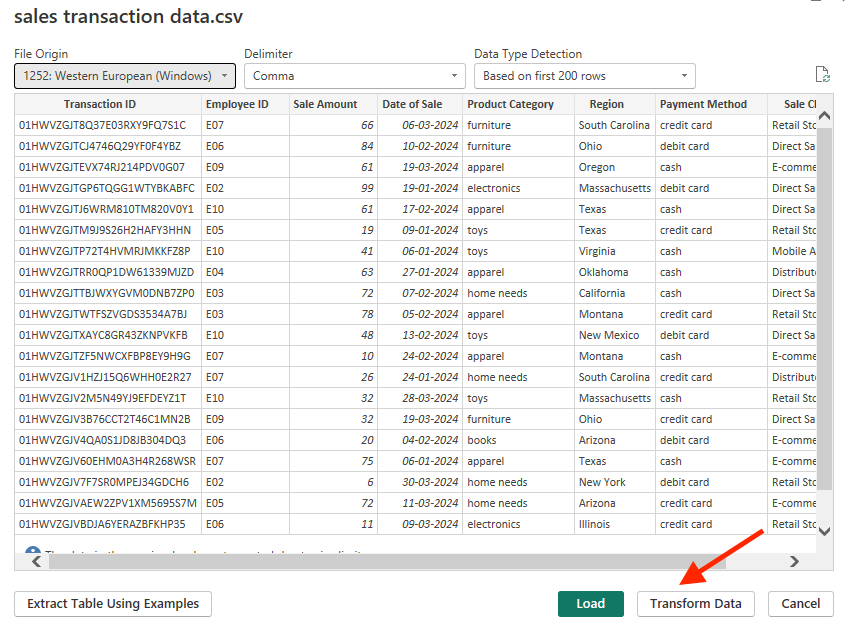
To get started, launch Power BI Desktop and select Get Data from the ‘Home’ tab. Now, choose the data source as ‘Text/ CSV’ and click Connect to import the sales transaction data into Power BI.
Click Transform Data to open the Power Query Editor.
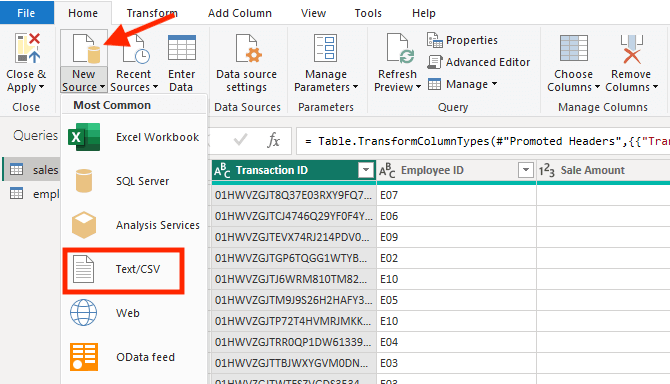
To add the second sources, click on New Source, select ‘Text/ CSV’ and load the employee data into Power Query Editor.
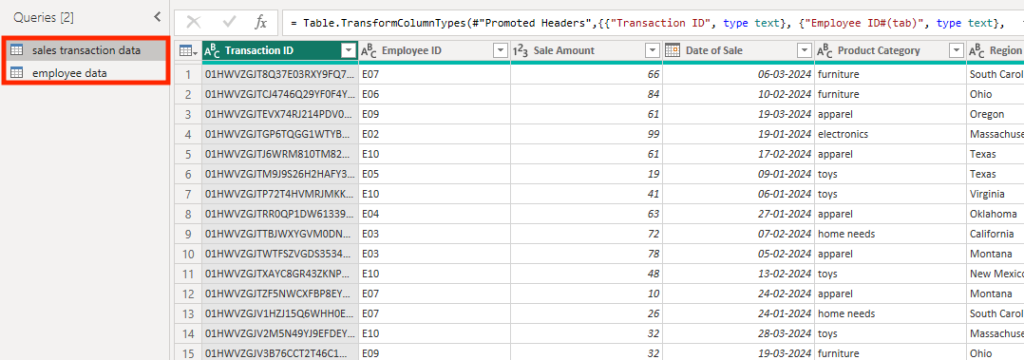
You can see the list of imported tables on the left side of the Power Query Editor.
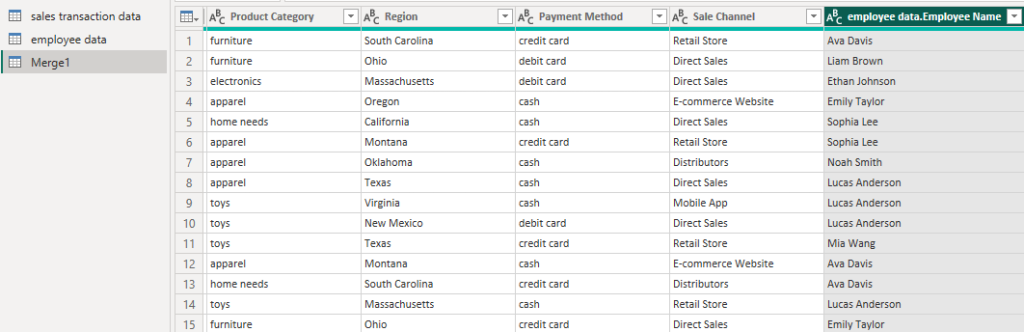
Now click on Merge Queries, and select the option ‘Merge Queries as New’ to have the joined data in a new table.

A merge window will appear. Choose the secondary table and specify the unique identifier columns in both tables (Employee ID). As we want to understand the sales performance by employee, we’ll select the inner join type.
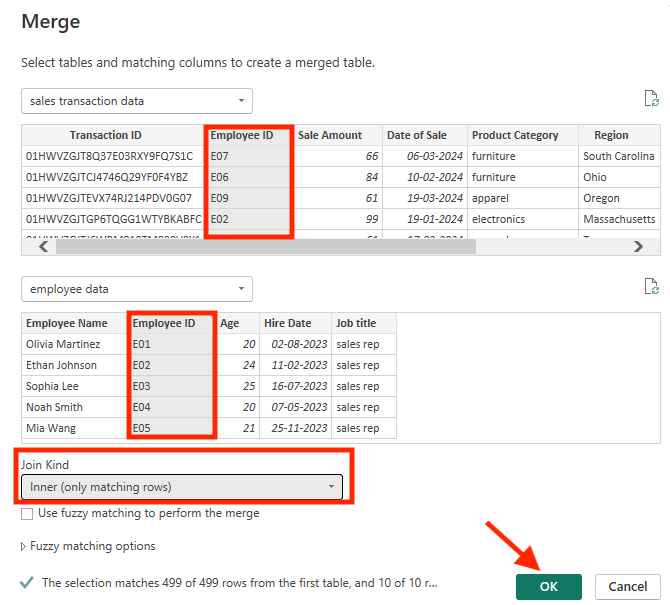
Confirm the settings and click OK.
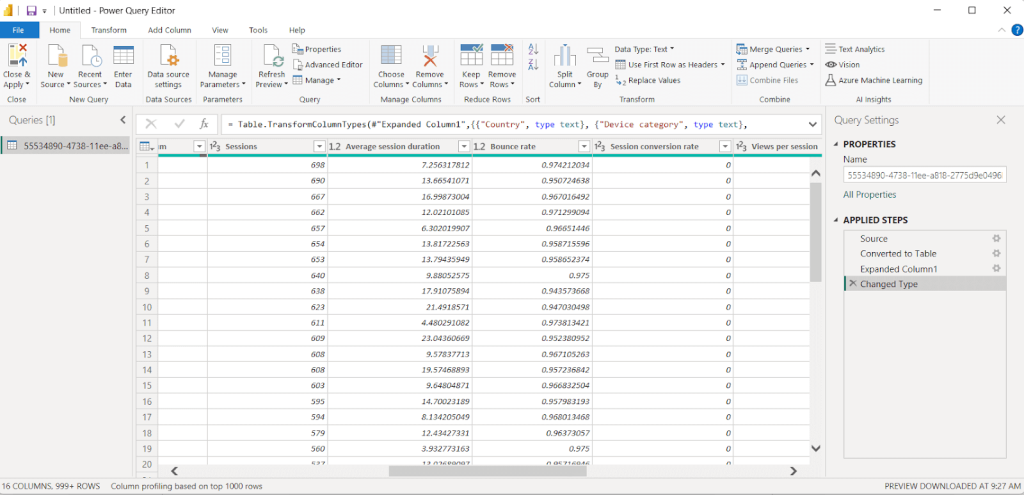
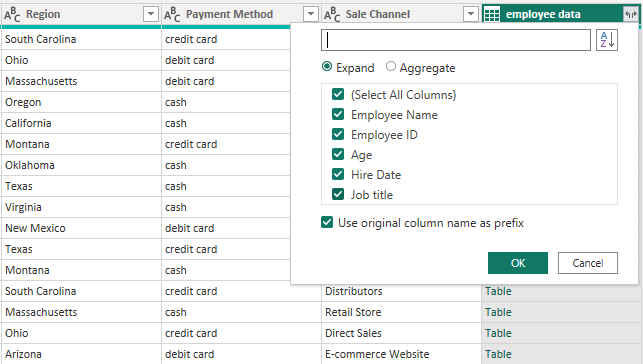
This new joined table will now have a link column representing the joined data. Click the expand button on top of the new column to select which columns from the secondary table to include in your final dataset.
Hit Close & Apply at the top left of the Power Query Editor to apply your changes and close the editor.
You’ll now see the joined table in the Power BI interface.
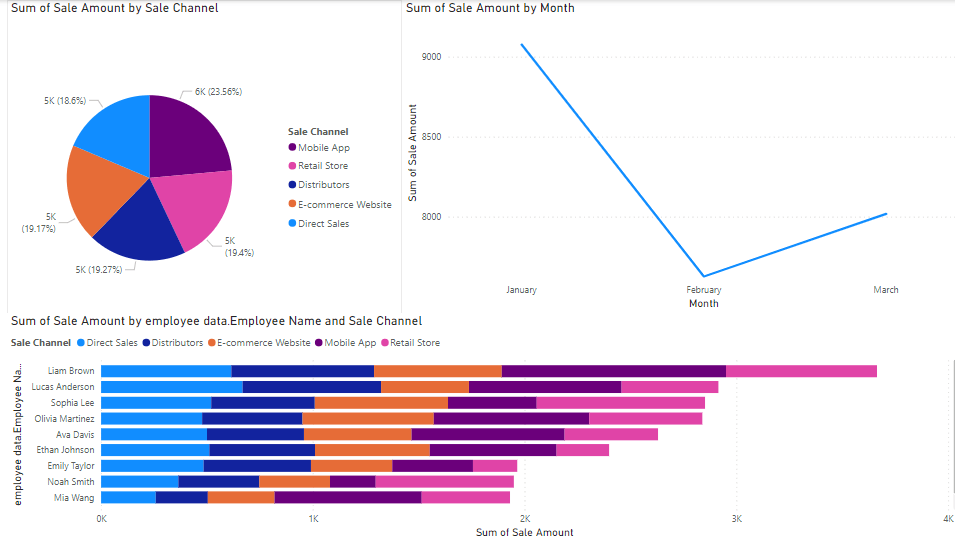
You can create a sales performance report with this joined data to get insights like best-performing sales channels, sales trends over the months, and more. The visualization options are easy to use with their drag-and-drop feature.
How to join two tables in Power BI using DAX
In DAX, the join between tables is implicit and automatic. When using other functions in DAX, it automatically establishes relationships when it detects a unique identifier. However, you can also use explicit join functions like NATURALLEFTOUTERJOIN and NATURALINNERJOIN.
Let’s consider two example tables ‘Product’ and ‘Subcategories’ to join tables using DAX. Start by importing your datasets to Power BI by clicking on Get Data.
To understand the relationship between these tables, go to model view. You’ll see that the ‘Product’ table has a many-to-one relationship with the ‘Subcategories’ table.
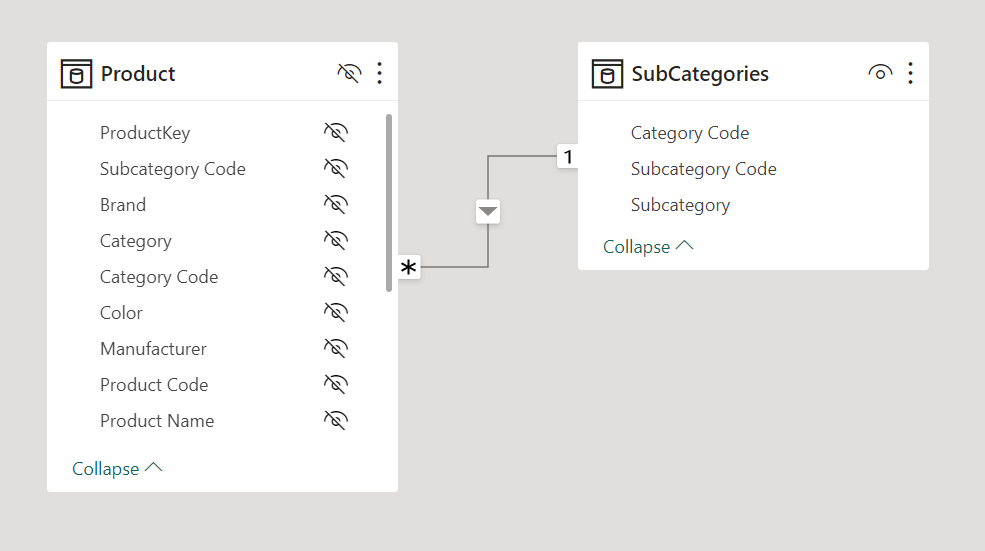
The common column for both tables is ‘subcategory code.’
Now, create a table where every product name has the corresponding subcategory name using NATURALLEFTOUTERJOIN.
Go to DAX Query View, and use the following formula.
EVALUATE
NATURALLEFTOUTERJOIN ( 'Product', SubCategories )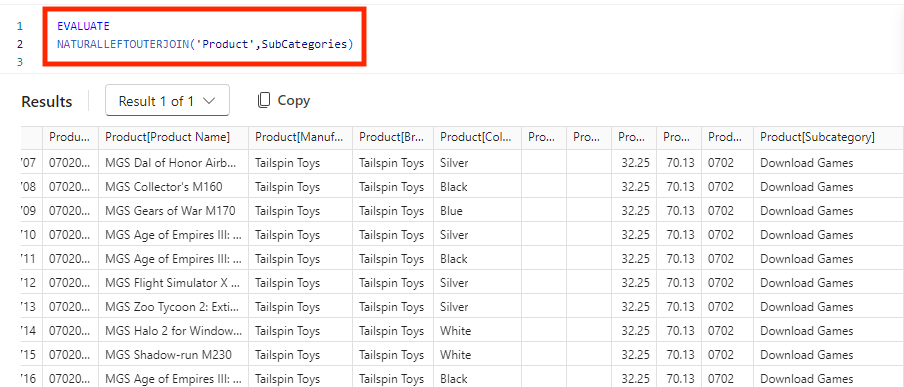
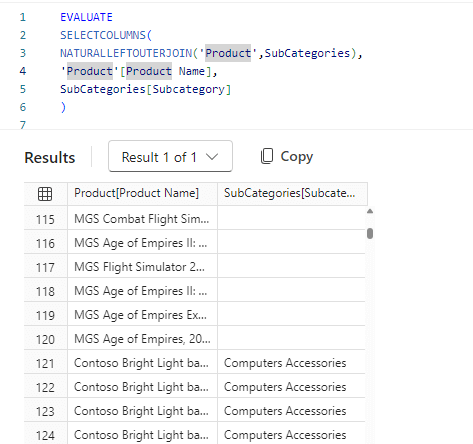
The result only includes subcategories that have at least one product. If a product does not have a matching subcategory, the SubCategories columns will be empty. To make the output clearer, we can limit it to just two columns.
EVALUATE
SELECTCOLUMNS(
NATURALLEFTOUTERJOIN ('Product', SubCategories),
'Product'[Product Name],
SubCategories[Subcategory]
)
To create a table that lists products with a corresponding subcategory only, we’ll use NATURALINNERJOIN in the DAX view.
EVALUATE
NATURALINNERJOIN ('Product', SubCategories)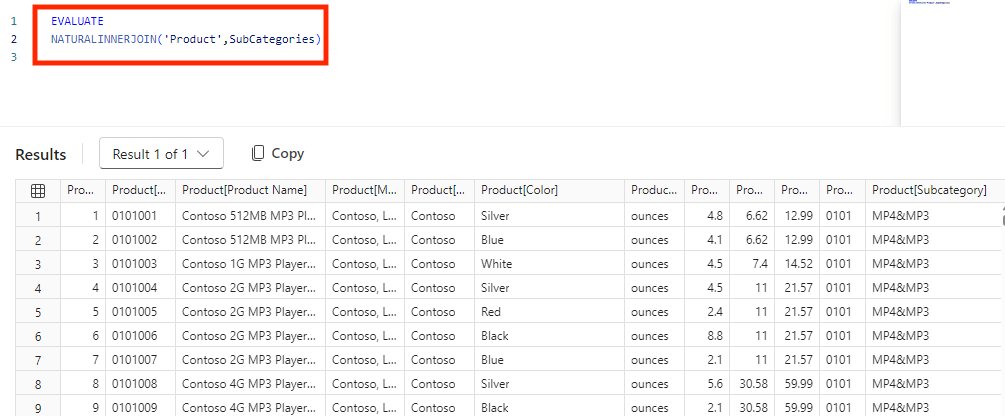
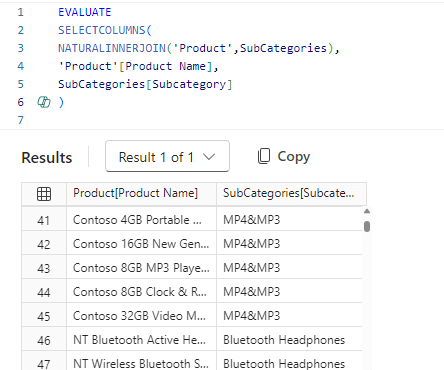
To view the results clearly, you can choose to view only specific columns with the formula below.
EVALUATE
SELECTCOLUMNS(
NATURALINNERJOIN ( 'Product', SubCategories ),
'Product'[Product Name],
SubCategories[Subcategory]
)
While joining tables using DAX is possible, it’s not the most efficient method. It can lead to performance issues, complexity, and maintenance difficulties. One way to address performance issues is by optimizing the DAX queries.
Otherwise, you can opt for a solution like Coupler.io to automatically join tables in Power BI on a schedule of your choosing.
How data join can be used in Power BI
After joining data from different tables, you can use this data to visualize in Power BI with tables, charts, and graphs. When these visualizations are put together meaningfully, you’ll have a report or dashboard.
But, building a report from scratch is challenging and time-consuming. To make it easy, use Coupler.io templates to create a dashboard in minutes. Now, you can easily analyze and understand your joined data.
The multi-channel PPC report template helps you join and visualize data from platforms like Facebook Ads, Google Ads, LinkedIn Ads, and more in Power BI.
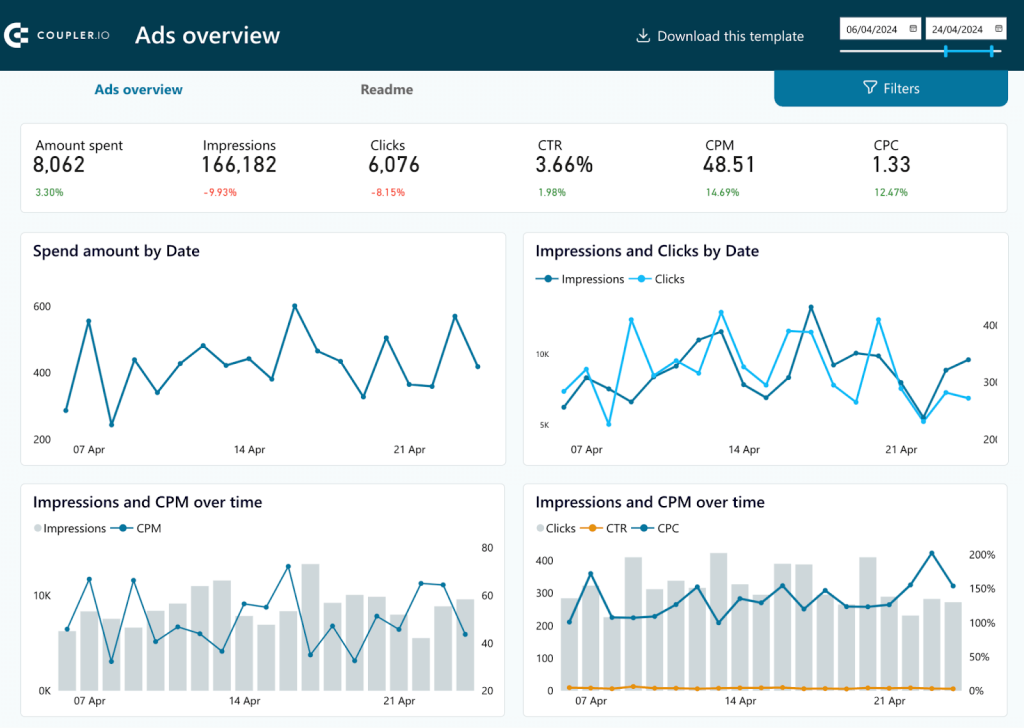
To do the same with your data, follow the instructions in the Readme. You’ll have your joined data in the Power BI report within minutes.
Now, you can track and easily understand the best and worst-performing platforms for you based on metrics like Clicks, CPC, conversions, etc. You can also dig deep to know which channel is effective for different touchpoints in the customer journey to allocate the budgets accordingly. You’ll also identify trends based on seasonal variations and demographics for each platform.
Moreover, when you join data and visualize in this report, you’ll always have near real-time data as per the data refresh schedule. Overall, you can join data from different platforms and conduct an in-depth analysis of your advertising efforts easily with Coupler.io.
What is the best way to join tables in Power BI?
The best way depends on your specific needs and requirements. Power Query Editor is a good option if it is a one-time task. While joining tables using the Power Query Editor is quite simple and free, you’ll have to update the data manually every time. For automatic updates, you can switch to using the DAX language in Power BI. But again, it can be challenging and complicated for beginners.
You can always use Coupler.io as a no-code data automation solution. You’ll join the tables within Coupler.io before exporting the data to Power BI. Additionally, you can also organize your data using data transformation features. Lastly, when you connect your joined tables with Power BI, you can set up a data refresh schedule for near real-time data updates.
Join tables from cloud sources in Power BI
Get started for free


