Connecting over 1 billion professionals from 200 countries, LinkedIn is one of the pillars of any PPC strategy. However, the abundant opportunities it creates also bring intense competition between brands. This emphasizes the importance of data analytics. By consistently analyzing your LinkedIn Ads metrics and using the insights to guide your next steps, you can make faster, more informed decisions.
This guide will help you set up efficient LinkedIn Ads analytics. It provides an overview of the key metrics with benchmarks, templates for instant data visualization, a checklist on how to conduct analysis, and much more.
How to set up LinkedIn Ads analytics: options you have
Before you start analyzing ad metrics in search of insights, it’s important to decide how you want to organize this process. While you can simply open the default report in LinkedIn Ads Manager from time to time, for ongoing in-depth analysis, you need a better option. Here are the main choices:
- Pre-made dashboard templates
These are ready-made solutions for data analysis that let you visualize your LinkedIn Ads data in minutes without much effort. Many of these templates can automatically pull ad data from your account, giving you a live LinkedIn Ads reporting dashboard to monitor your metrics in real time.
- Custom reports created from scratch
If you have a good understanding of what you need, you can build your report from the ground up. This might be a dashboard created with a BI tool, a report in spreadsheets, an auto-updating dataset in a data warehouse, and so on.
- Native dashboards and reports
What LinkedIn offers out of the box can be an option too. Native reports include key performance indicators and let you track progress. However, they lack customization and don’t give you the freedom to manipulate your data.
Let’s explore how you can organize your LinkedIn Ads analytics using dashboard templates or by building a report on your own. Then, we will discuss the key ad metrics and explain how to analyze them.
Ready-made templates for LinkedIn Ads analytics by Coupler.io
We’ve prepared several free LinkedIn Ads templates that will help you organize and analyze your data. These templates come with an integrated Coupler.io connector, which allows you to channel data to the report automatically and keep it live.
Here’s why we recommend that you try them out:
- Ready-to-use dashboards – the set of key metrics and informative charts are already pre-configured
- Automatic data refresh – you get a live dashboard as data is updated automatically up to every 15 minutes
- White-label templates – these dashboards can be customized in a BI tool or spreadsheet app of your choice
- Easily shareable – you can send this report to the stakeholders without providing access to your ad account
- Free of charge – all these templates are available at no cost
- Fast and simple setup – it takes less than 5 minutes to visualize your data
1. LinkedIn Ads analytics dashboard
This template allows you to monitor your metrics live and analyze performance more conveniently compared to a native report. If you need to tailor it to your specific project, it’s easy to customize the dashboard.
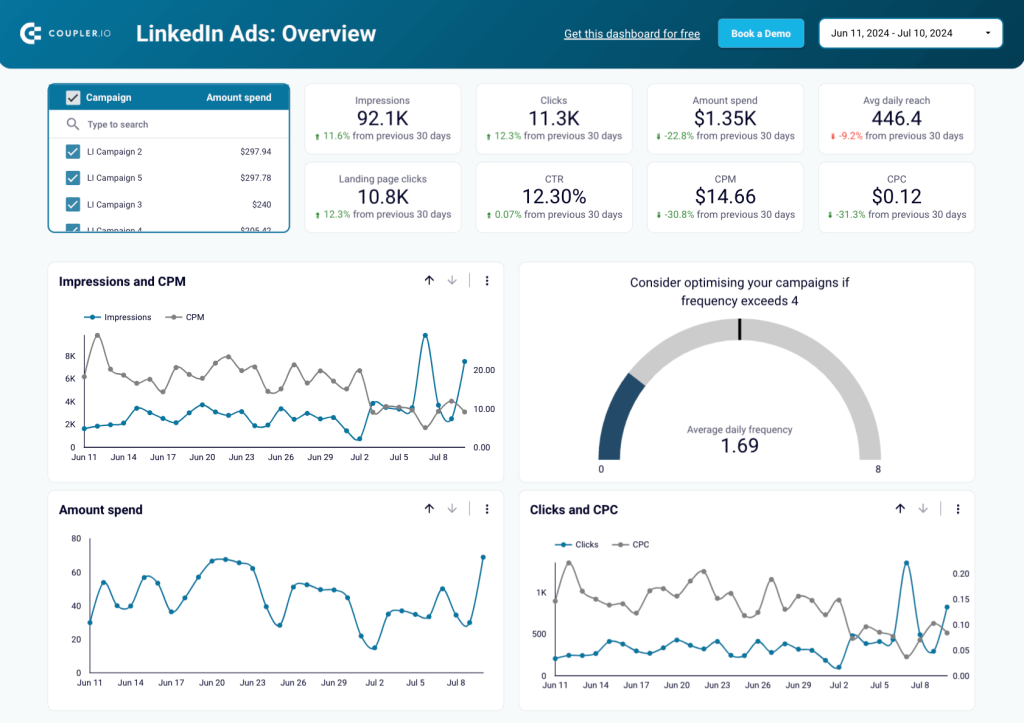
- Overview of the key metrics
The LinkedIn Ads dashboard includes the most crucial metrics, showing how they correlate with each other and change over time. In particular, you can track impressions and clicks, CPM and CPC, and engagement.
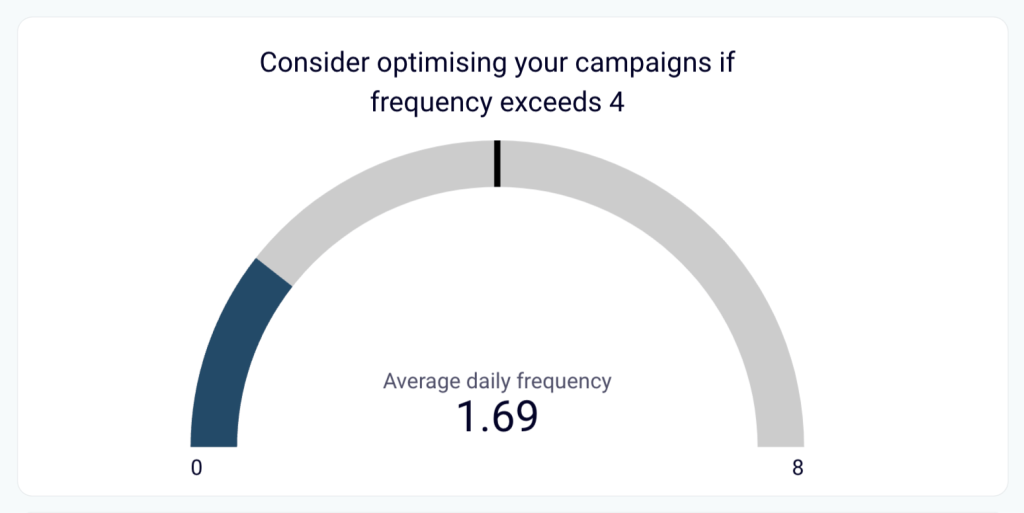
- Frequency meter
This gauge chart lets you keep ad frequency in check and prevent ad fatigue. If the frequency is 3 views per user or higher, you may need to make adjustments.
- Dynamics over the selected period
Use filters to display data for a specific time frame in the line charts. This enables you to identify trends and patterns, understand progress, and make projections for the future.
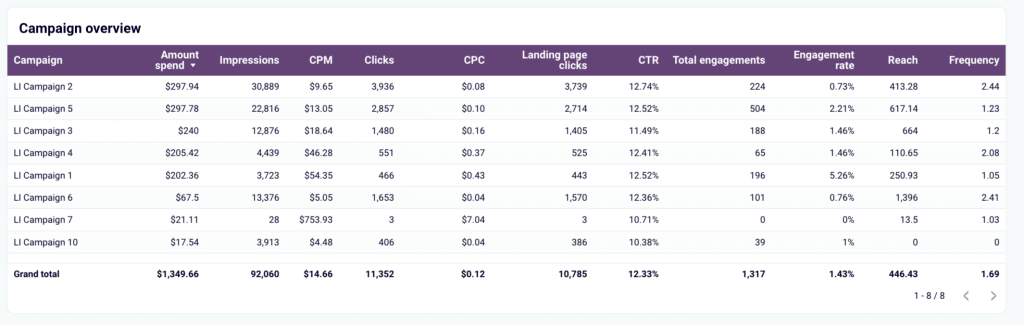
- Campaign performance breakdown
The dashboard enables you to filter data by campaign and analyze the performance breakdown for all campaigns. By comparing their key metrics and outcomes, you can determine what performs best.
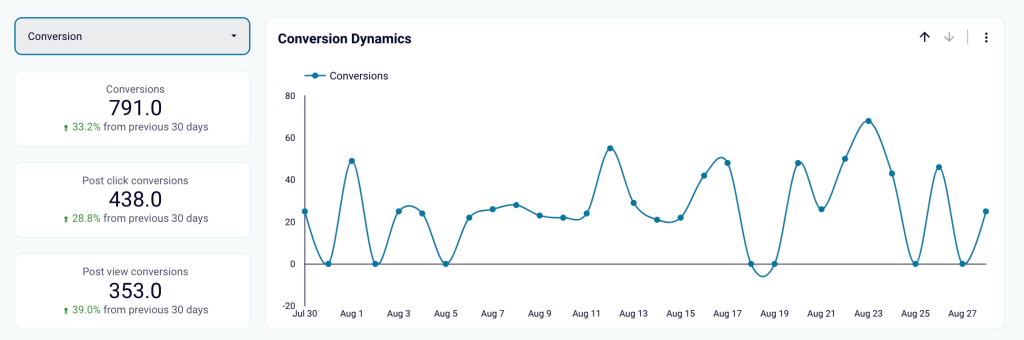
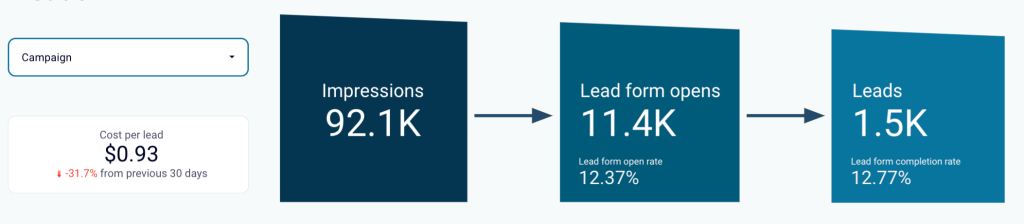
- Conversions and Leads funnel
There is a separate tab for analyzing conversion dynamics and leads funnel. See how impressions translate into lead gen form opens and ultimately result in leads. You can use the drop-down filter to select different types of conversions and view the outcomes from different angles.
Dashboard metrics
- Impressions
- Clicks
- Amount spent
- Reach
- Frequency
- CTR
- CPC
- CPM
- Engagement rate
- Conversion rate
How to set up
To collect and visualize data for this dashboard, follow the instructions in the Readme tab of the template in Looker Studio or Google Sheets. You will need to create a Coupler.io account to proceed, but it’s free and no credit card details are required. Your data will be visualized automatically, and you will get a live dashboard in just a few minutes.
2. LinkedIn Ads creatives dashboard
This template provides a detailed view of your ad creatives’ performance. With this dashboard, you can make data-driven decisions to boost engagement, control costs, and maximize ROI. It visualizes key metrics like impressions, clicks, CPC, CPM, and other conversion metrics, making it easier to analyze which creatives are working best.
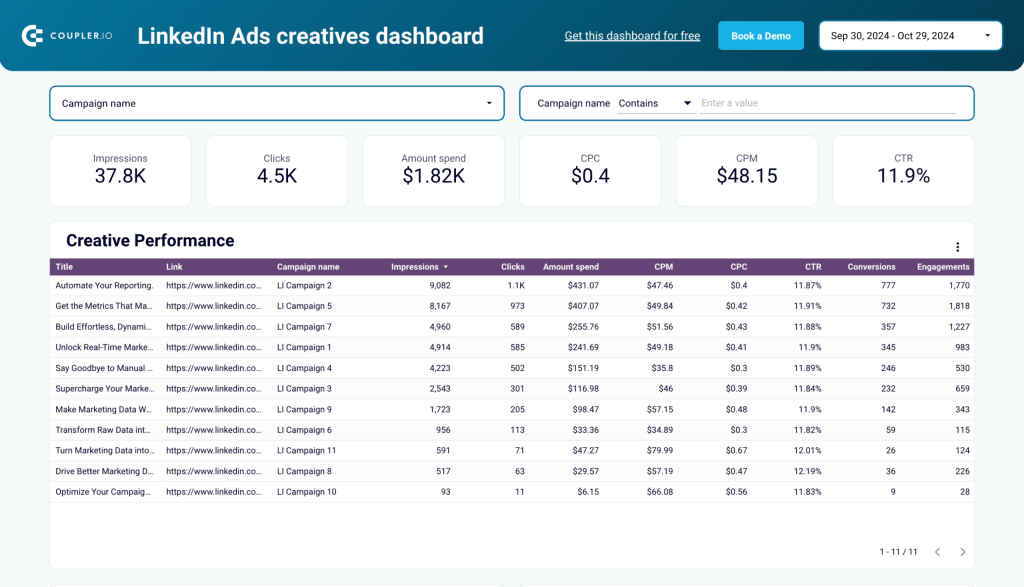
Overview of creative performance
You can track the effectiveness of individual creatives and compare their performance side-by-side. This breakdown enables you to prioritize high-performing creatives and optimize future campaigns.
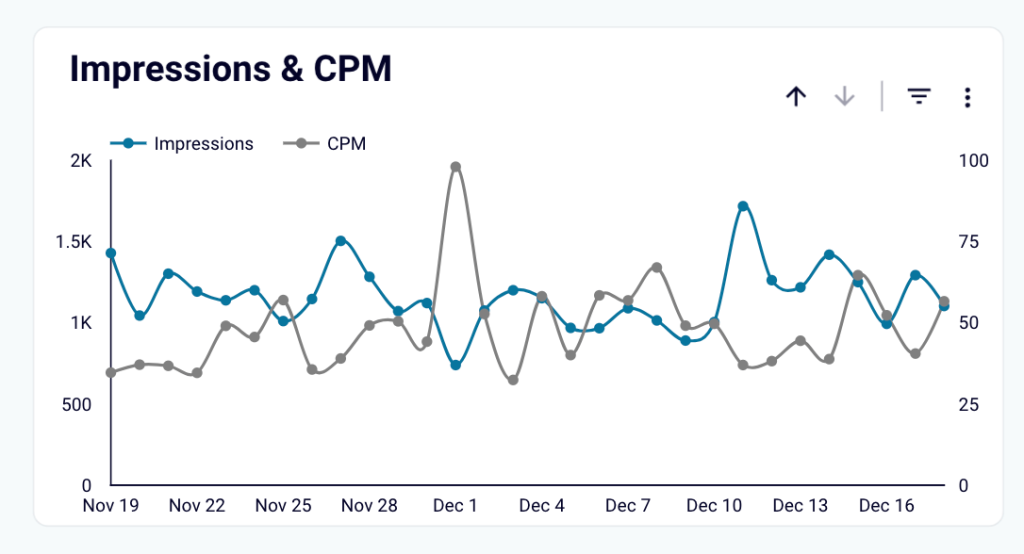
Impressions & CPM dynamics
This chart visualizes the total number of impressions alongside the associated cost per thousand impressions (CPM). It provides insights into the reach of your campaigns and how efficiently your budget is being utilized.
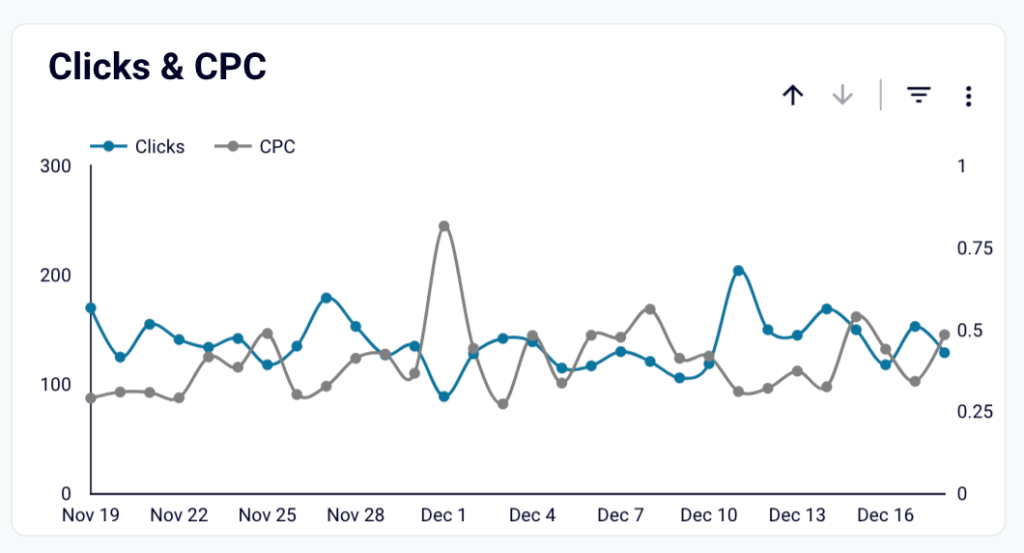
Clicks & CPC dynamics
With this chart, you can track audience engagement by monitoring clicks and click-through rates (CTR) while keeping an eye on the cost per click (CPC). By spotting anomalies or dips, you can make adjustments to maintain strong audience interaction.
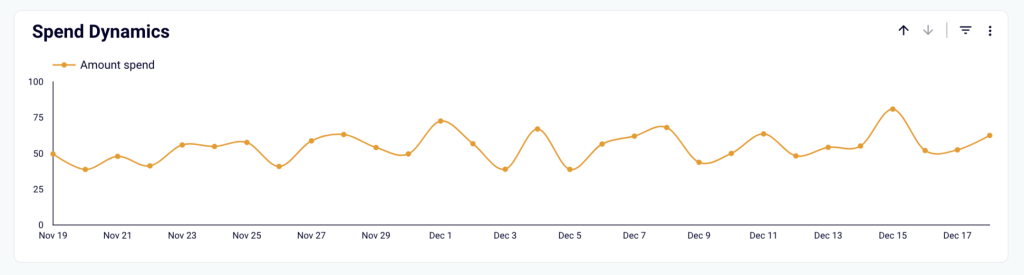
Spend dynamics
The spend dynamics chart tracks how much you’re spending on creatives over a selected period. It’s a great way to ensure budget alignment with campaign goals and track your total spend changes over time.
Dashboard metrics:
- Impressions
- Clicks
- Amount spent
- CPM
- CPC
- CTR
- Conversions
- Engagements
How to set up
To get a visualized ad creative analysis of your LinkedIn Ads, follow the instructions in the Readme tab. The template is built in Looker Studio, and you can set up a schedule to update your data in the dashboard automatically.
3. LinkedIn page and ads analytics dashboard
This dashboard combines insights from LinkedIn Ads and LinkedIn Company Pages, offering a unified view of your organic and paid performance. You can track impressions, clicks, and cost data for ad campaigns while also monitoring page views, likes, and comments from your organic posts.
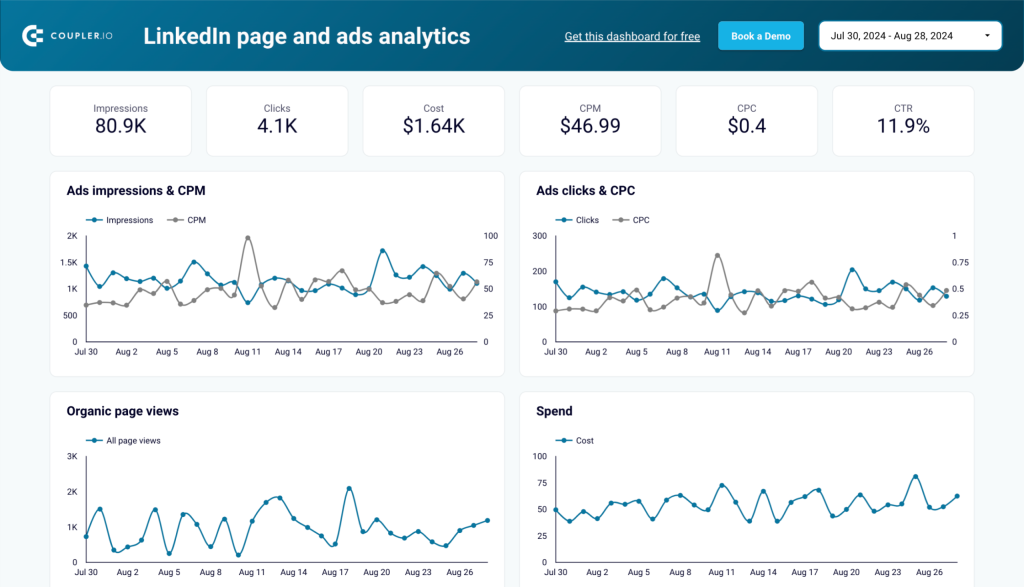
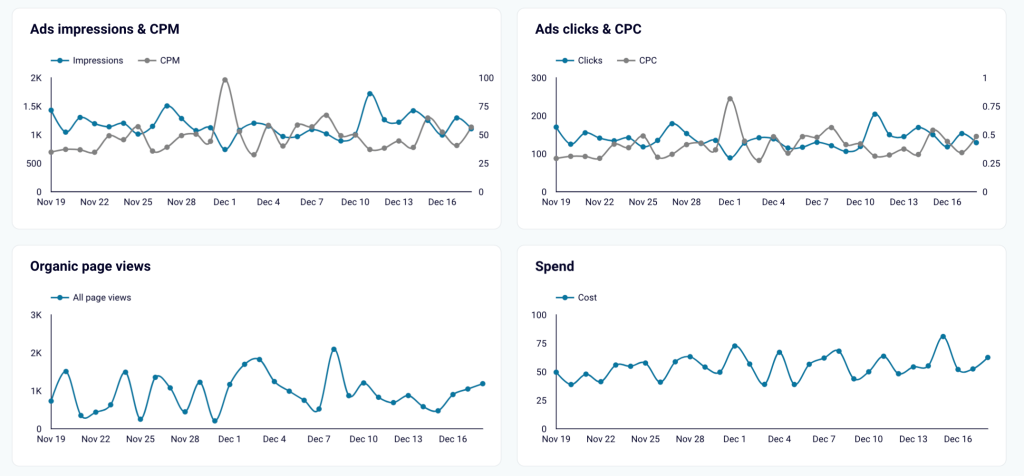
Dynamics of key performance metrics
The dashboard visualizes trends for critical metrics using line charts. These charts allow you to track impressions, clicks, and CPC for LinkedIn ads and page views for your LinkedIn Company Page. This enables you to identify patterns and understand shifts in campaign performance.
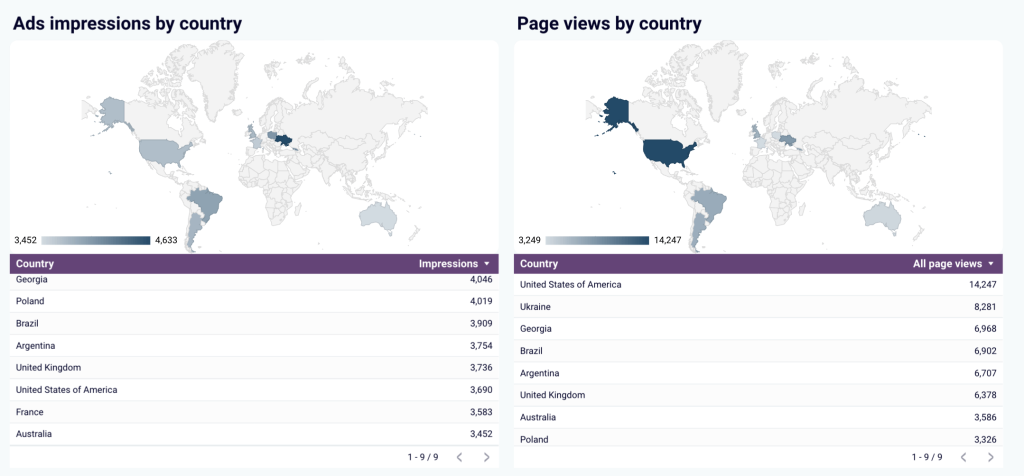
Geographic performance insights
This section allows you to see ad impressions and page views by country. The map view highlights where your brand is most visible, helping you target regions with the highest engagement.
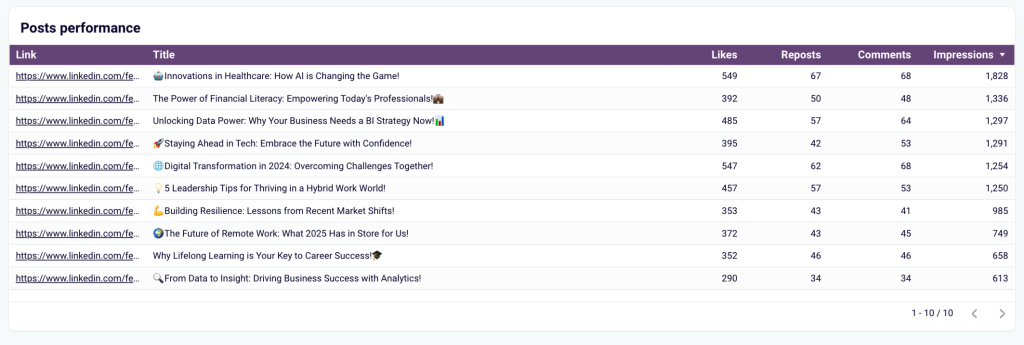
Post performance breakdown
This table displays the performance of individual posts, showing metrics like impressions, likes, reposts, and comments. With this information, you can identify which types of content generate the most engagement and refine your content strategy accordingly.
Dashboard metrics:
- Impressions
- Clicks
- Cost
- CPM
- CPC
- CTR
- Frequency
- Page views
- Likes
- Comments
- Reposts
How to set up:
Follow the instructions in the Readme tab to get started with the LinkedIn page and ads analytics dashboard. It is built in Looker Studio, and you can set up a schedule to automatically update your data.
4. LinkedIn Ads companies reach dashboard
LinkedIn’s native reports only show the first 50 companies that saw your ads, making it difficult to analyze your full reach. The LinkedIn Ads companies reach dashboard removes that limitation by pulling data directly from LinkedIn’s API and gives you a complete view of all the companies that interacted with your ads. You can track engagement levels, identify high-value prospects, and refine your ad targeting for better results.
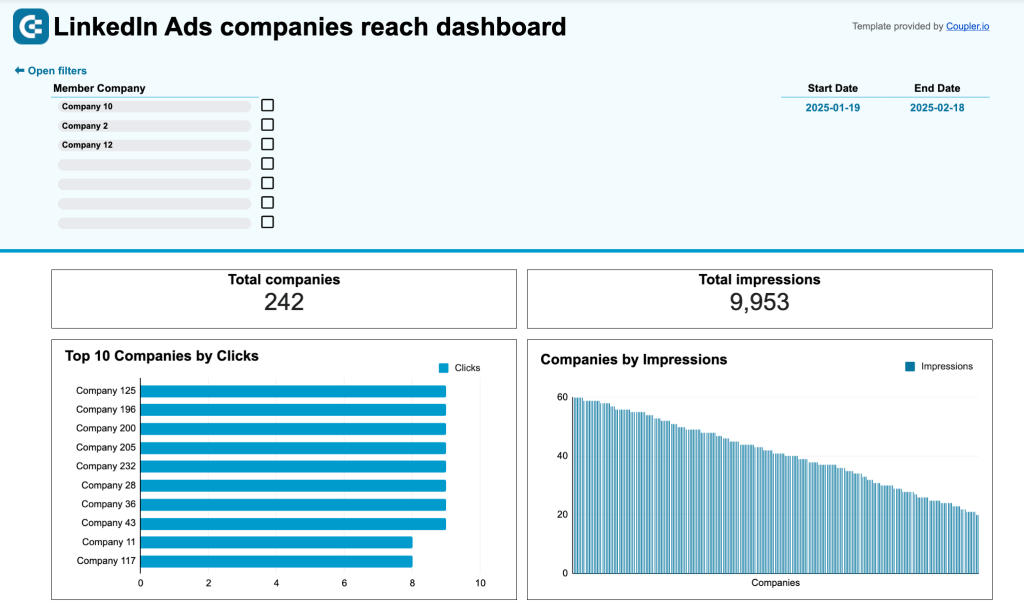
Track every company that sees your ads
Unlike LinkedIn’s built-in reports, this dashboard provides a full list of companies that saw your ads. You can filter and sort data to focus on specific industries, company sizes, or high-engagement prospects.
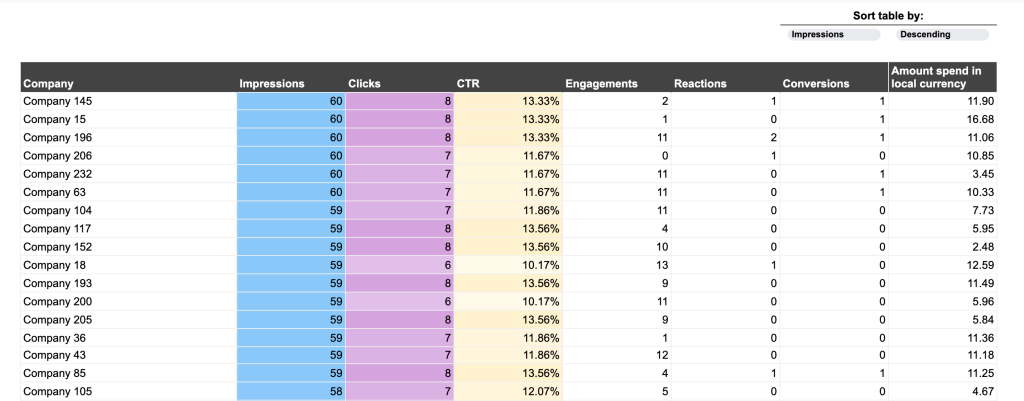
Identify high-interest companies
Not every company engages with your ads the same way. Some only see your ads, while others click, react, or visit your profile. This dashboard helps you track these actions so you can prioritize follow-ups and sales outreach to companies that show strong interest.
Analyze impressions vs. engagement
If a company sees your ads frequently but doesn’t engage, you might need to adjust your messaging or retarget them with different creatives. This dashboard highlights companies with high impressions but low clicks, helping you optimize campaigns for better performance.
Optimize your ad spend
You can compare engagement levels with ad spend per company to see where your budget delivers the best results. If a company has a high CTR but a low budget allocation, increasing bids can bring in more impressions and clicks from the right audience.
Dashboard metrics:
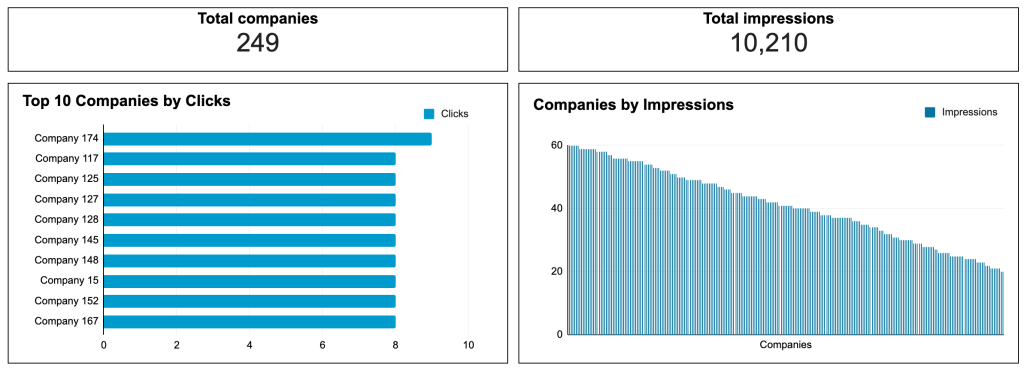
- Total Companies Reached
- Total Impressions
- Clicks
- CTR (Click-Through Rate)
- Engagements
- Conversions
- Ad Spend per Company
How to set up:
This dashboard is designed in Google Sheets. It connects to LinkedIn Ads via Coupler.io and automatically updates your data. There’s no need to manually export reports—once set up, the dashboard refreshes on a schedule. To use it with your LinkedIn Ads data, follow the instructions in the Readme tab.
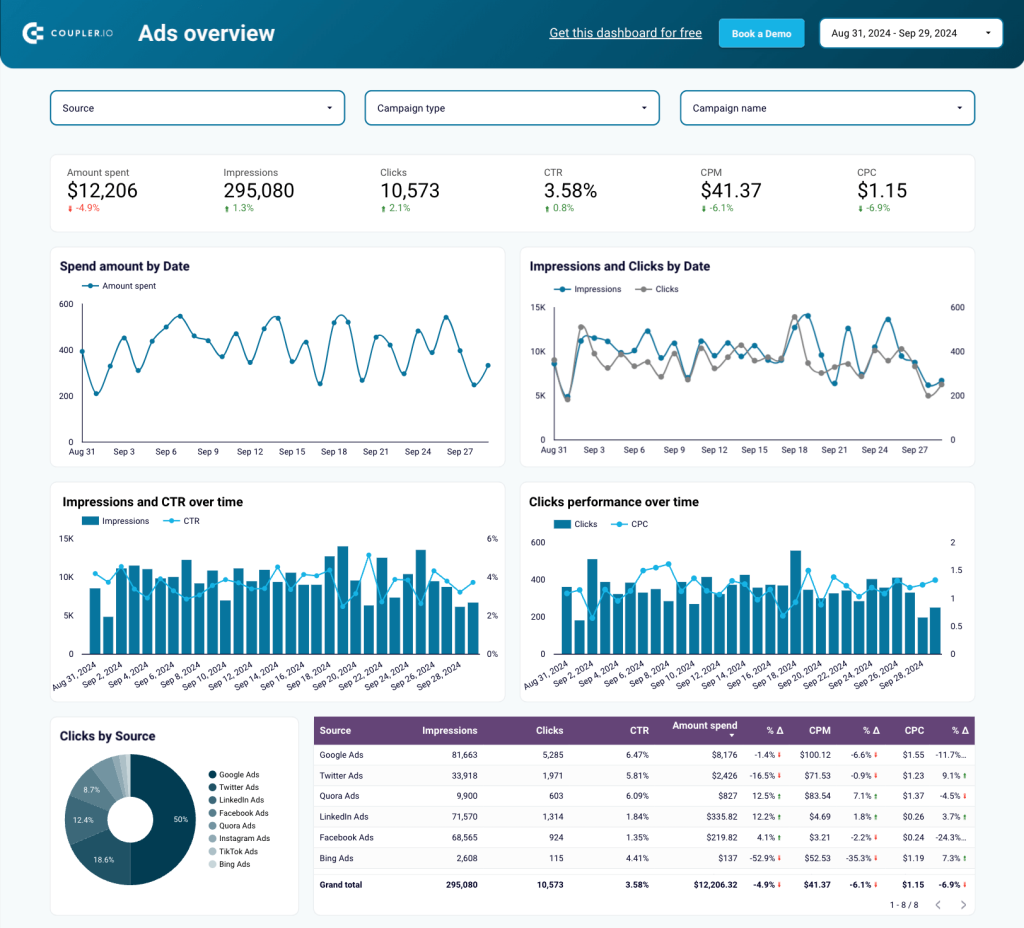
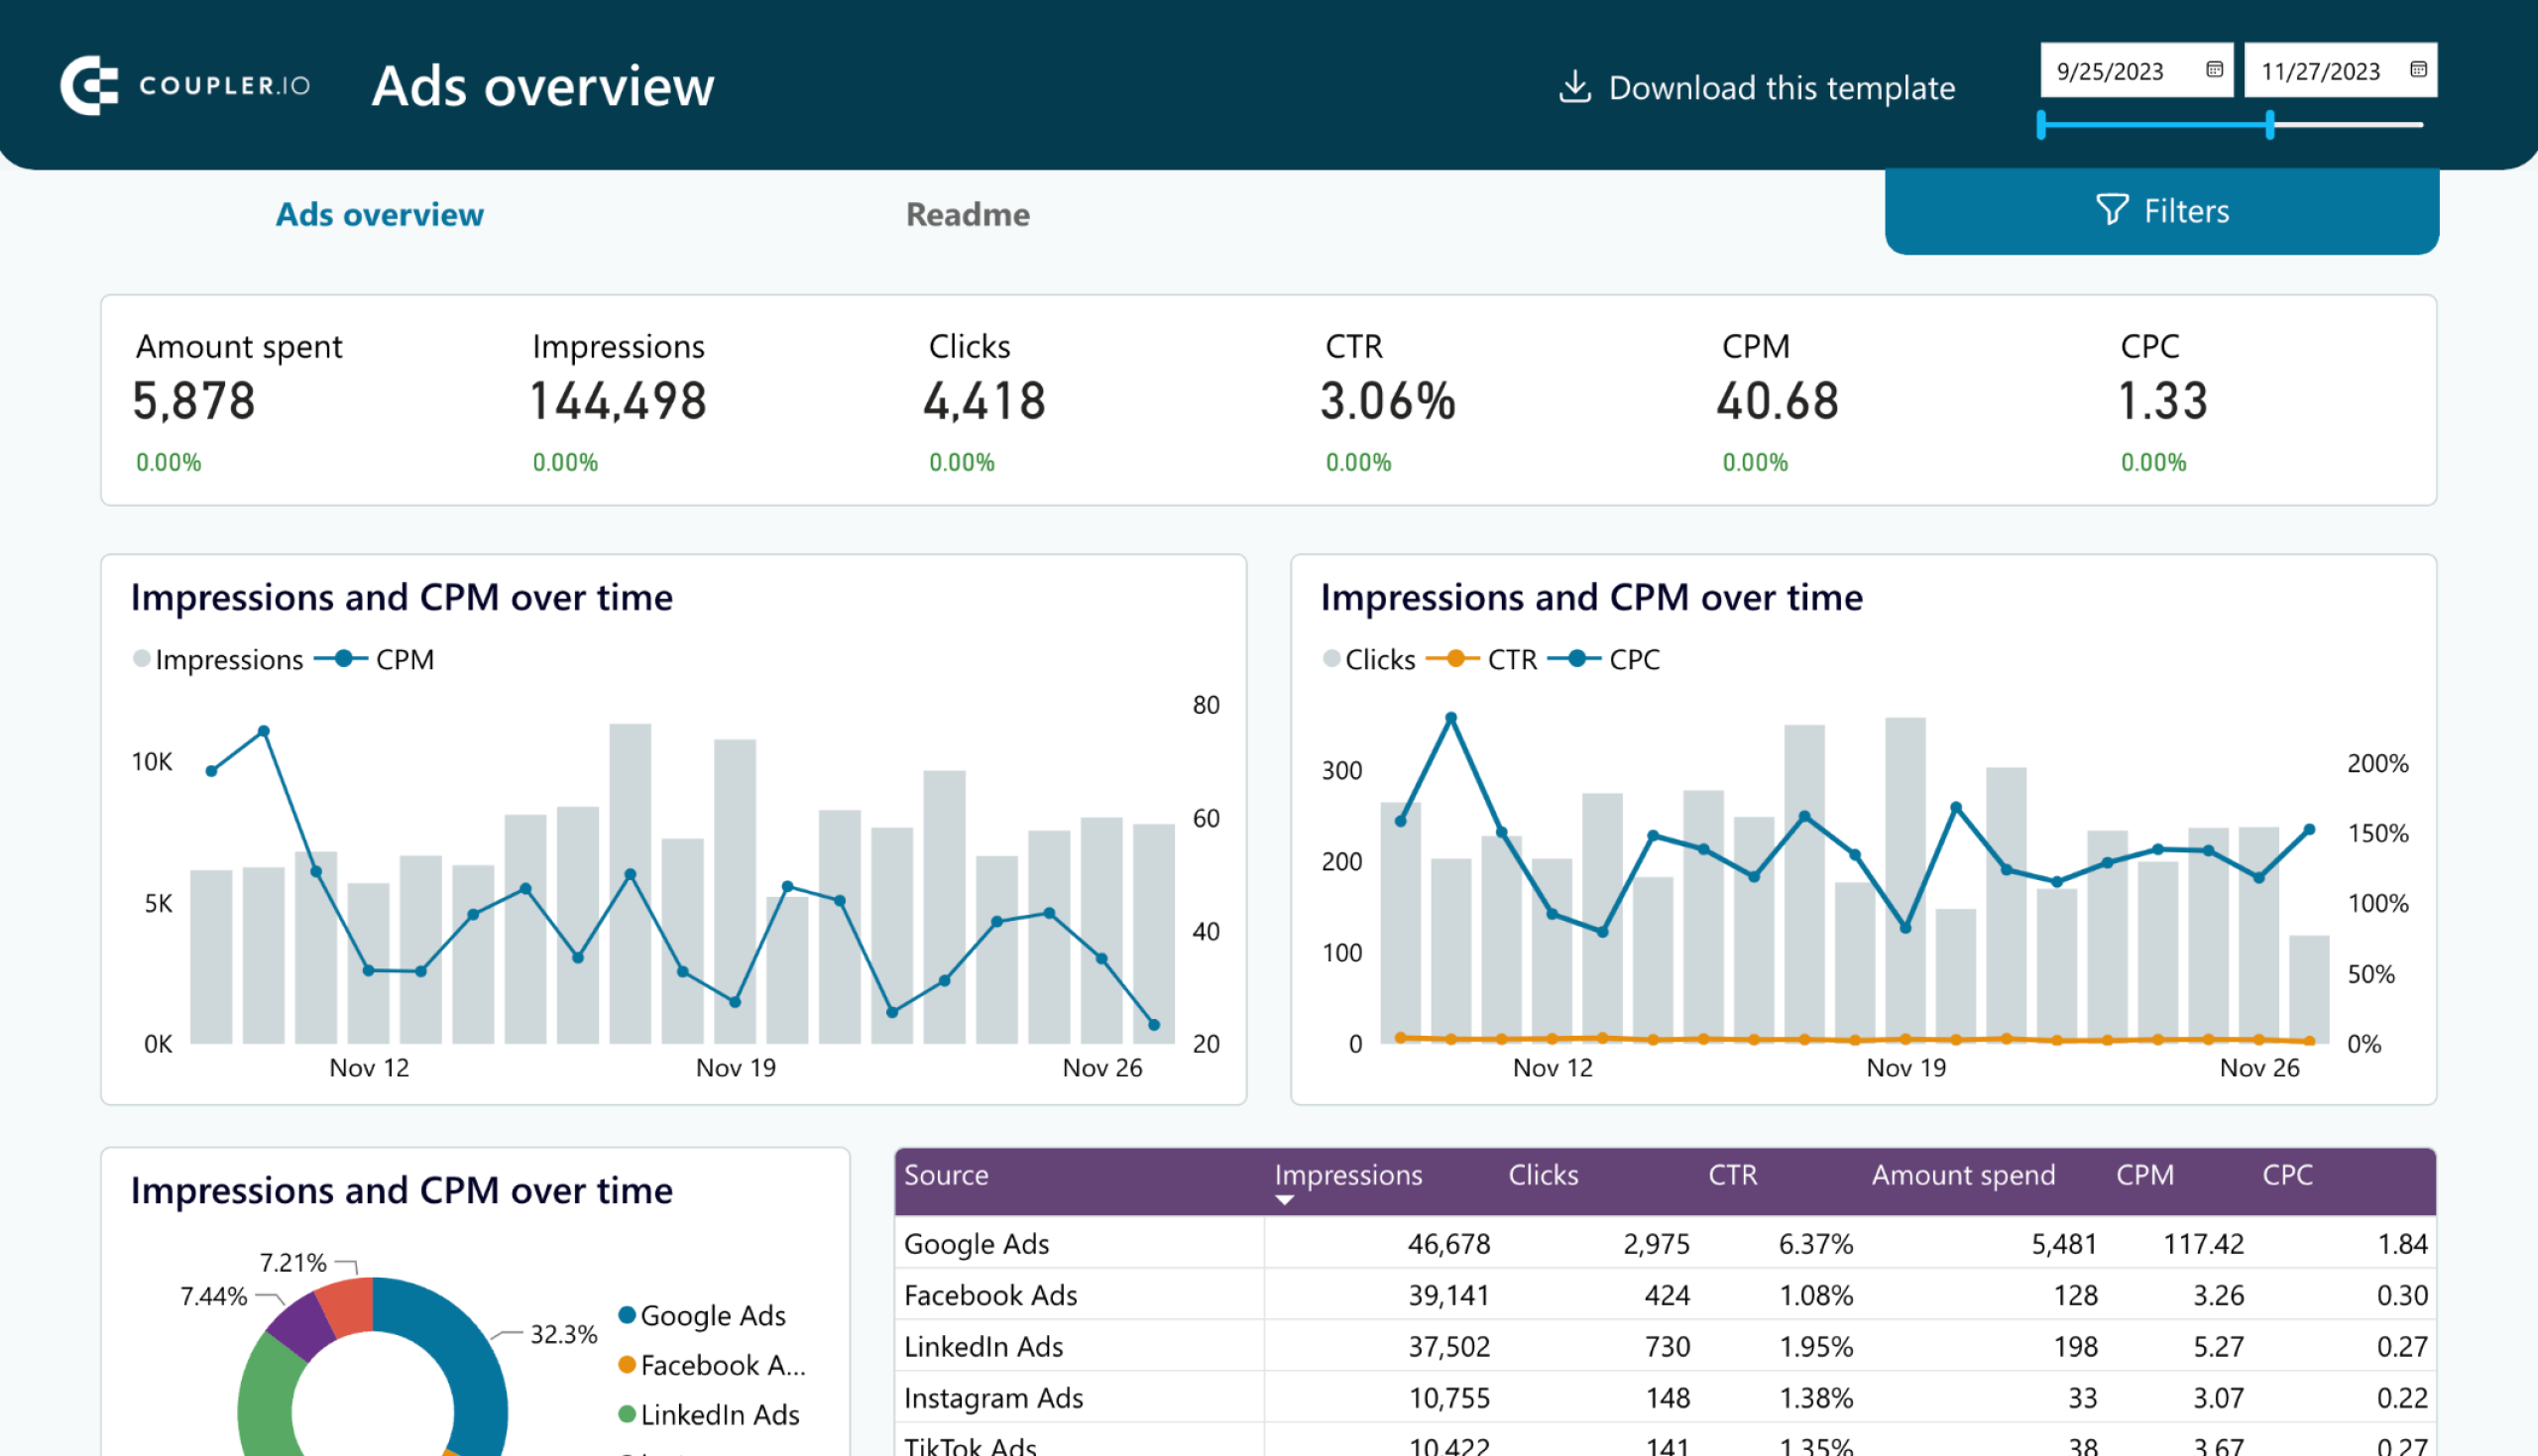
5. PPC dashboard for LinkedIn Ads + 7 other ad platforms
When you work with multiple PPC platforms (which is almost always the case), it’s important to conduct cross-channel analysis in addition to reviewing metrics from individual channels.
This multi-channel PPC dashboard is a one-page report that automatically pulls fresh data from LinkedIn Ads and other PPC sources and displays changes in near-real time. Although you can choose to use it for LinkedIn Ads only, its main value is in its cross-platform connectivity.
- Aggregated data from LinkedIn Ads and more
The dashboard lets you check campaign performance across all your PPC platforms in one place. It enables you to stay in control of multiple channels while eliminating the need to check metrics on each platform separately, jumping between multiple tabs. Check out our digital advertising guide to learn more about other ad types and best practices.
- Supported PPC sources
- Google Ads
- Twitter Ads
- LinkedIn Ads
- Facebook Ads
- Quora Ads
- Instagram Ads
- Bing Ads
- TikTok Ads
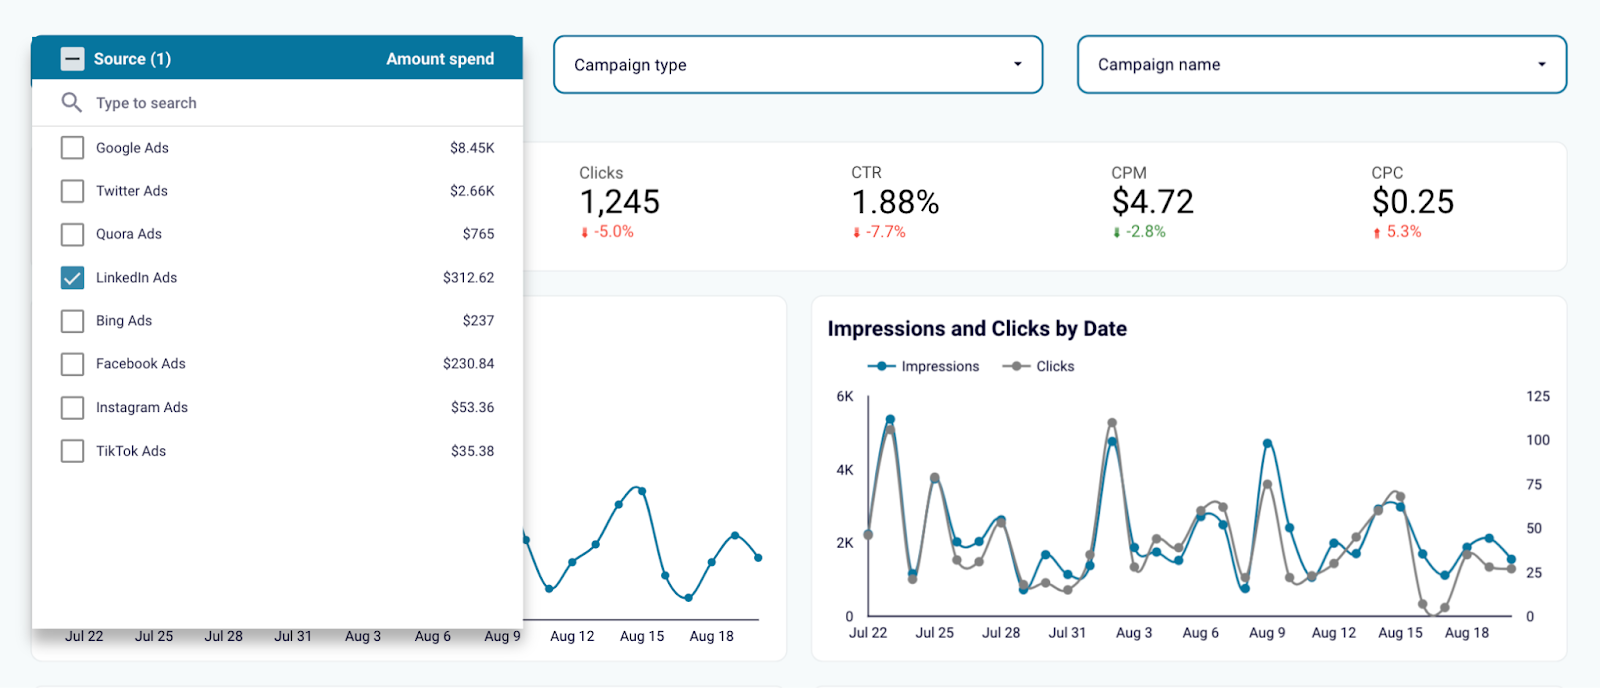
You don’t have to connect all the available sources to use the template: it will work with even one source.
- Filters for individual channels
You can select specific platforms to explore their metrics separately. This is very convenient as it allows you to analyze data from different channels within one interface.
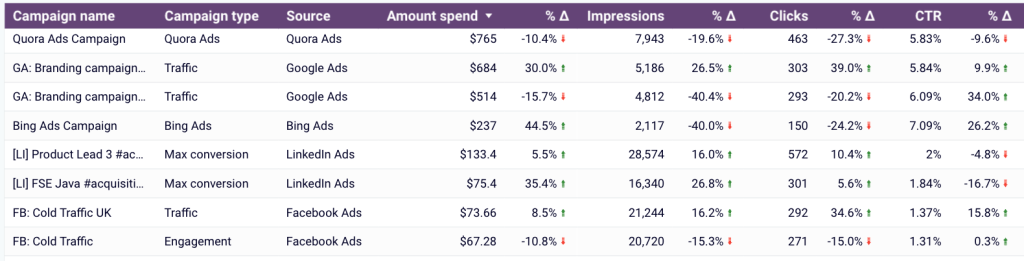
- Comparison table for campaigns
The dashboard provides a detailed overview of campaign results across different channels. This allows you to quickly identify top performers and spot red flags. If you run the same campaign on different platforms, you can check where it produces the best results and redistribute your ad budget accordingly.
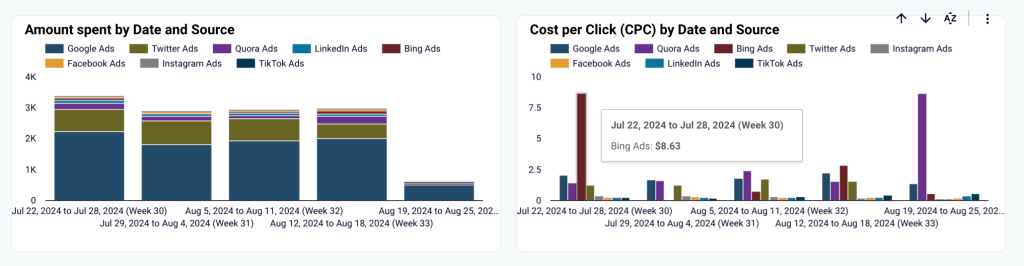
- Financial KPIs overview
The template includes a section with graphs presenting financial data, such as amount spent dynamics by date and channel, CPC, and CPM.
Dashboard metrics
- Clicks
- Clicks by source
- CPC
- CPC by source
- Amount spent
- CTR
- CPM
- Other performance metrics
How to set up
Select the dashboard version from the widget below. This template is available for Google Sheets, Looker Studio, PowerBI, and Tableau. Then, navigate to the Readme / Setup guide tab of the selected template and follow the instructions to connect your LinkedIn Ads account and other platforms, if needed.

PPC multichannel dashboard in Google Sheets
Use a PPC dashboard designed for Google Sheets to track the performance of your campaigns across multiple advertising platforms.


PPC multichannel dashboard in Looker Studio
Get a comprehensive PPC reporting tool to track the performance of your campaigns launched at multiple advertising platforms.

PPC multichannel dashboard in Power BI
Use a Power BI PPC dashboard for tracking and analyzing your advertising campaigns across multiple platforms.


PPC multichannel dashboard in Tableau
Track and analyze the performance of your advertising campaigns across various platforms using a one-stop PPC dashboard in Tableau

6. Monthly ad budget overview for LinkedIn Ads + 7 other ad platforms
When running campaigns on multiple platforms simultaneously, it’s often challenging to track how much you are spending on each platform and whether you are staying within your budget. This report solves this issue and is useful for controlling your budget and ad spend.
You can connect your LinkedIn Ads account and other ad platforms you use to this Monthly ad budget dashboard, and it will automatically collect data on your spend. The dashboard works with the same sources as the previous template.
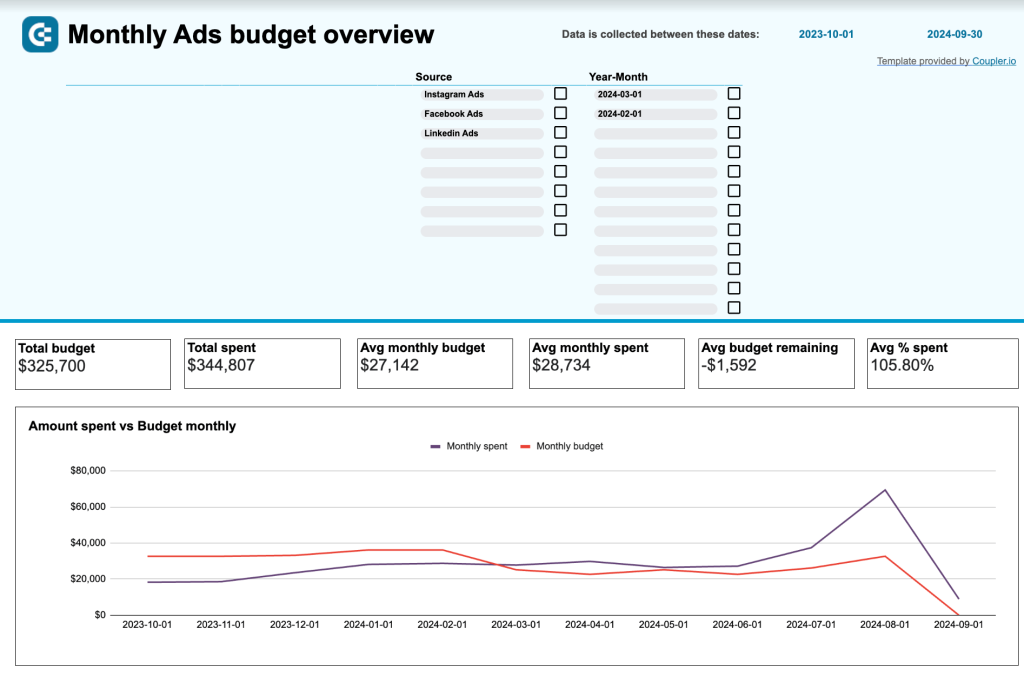
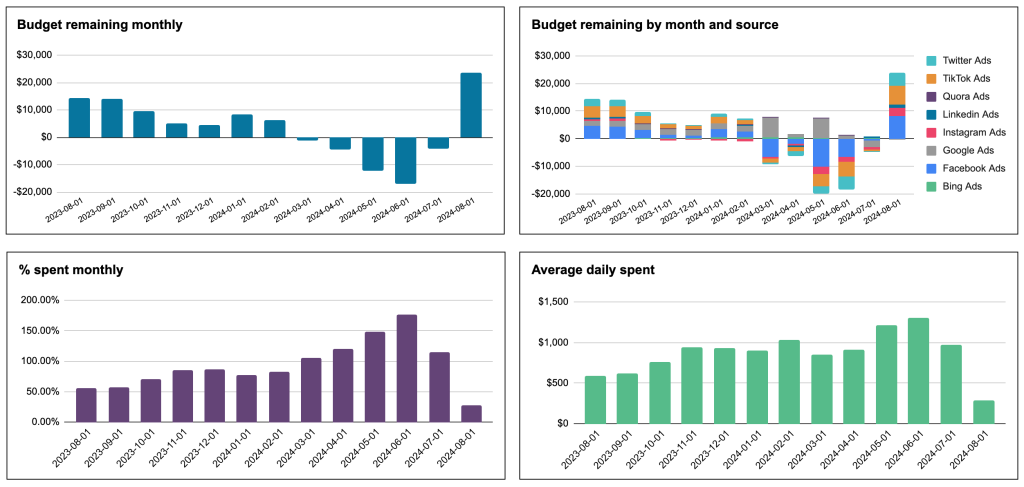
- Spend dynamics and average daily spend
The template includes a set of charts for tracking budget usage over the year. You can easily visualize when you went over or under the planned budget; this data is split by month and by ad channel. There’s a separate bar chart for monitoring average daily spend.
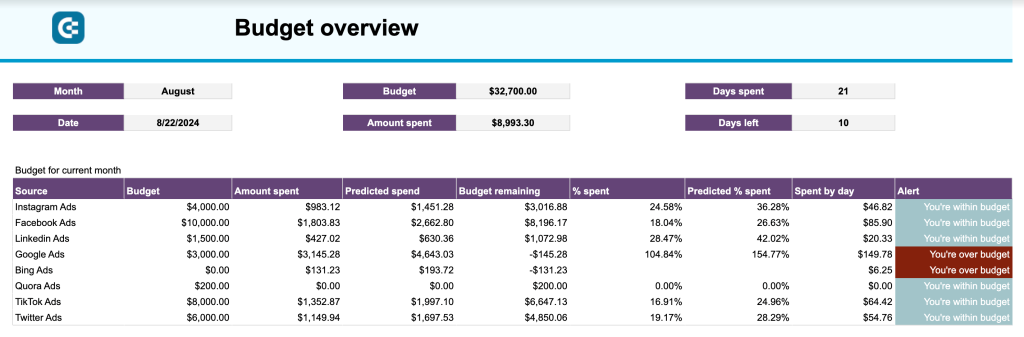
- Alerts on overspending
On the Budget overview tab, you’ll find a table summarizing budget usage during the current month. You only need to enter the numbers of your planned ad budget as the rest is calculated automatically. The report will show projections for your future ad spend based on your budget usage pace. When the allocated sum is being spent too fast or gets close to overspending, you’ll see an alert. This enables you to take action in time and stay in control of your PPC budget for LinkedIn Ads and other platforms.
Dashboard metrics
- Total budget
- Total spend
- Predicted spend
- Avg monthly budget
- Avg budget remaining
- Avg daily spend
How to set up
Open the Monthly ad budget dashboard and press the Use template button in the upper right corner to make a copy of the worksheet. Then, navigate to the Readme tab for detailed setup instructions. You will need to install the Coupler.io add-on and connect your LinkedIn Ads account and other platforms, if necessary. In the end, clear the sample data and input your planned budget amounts on the Manual input tab.
Building a custom LinkedIn Ads report from scratch
For many professionals, starting out with a ready template and then customizing it is a good option. However, if you can’t find a suitable template and already have experience at working with BI tools, you can build a LinkedIn Ads analytics report yourself.
Whatever your preference is, it’s better to make your LinkedIn Ads dasboard or report live and auto-updating. You can easily do this with the help of Coupler.io in three simple steps.
1. Extract data
Select the destination for your report in the form below and click Proceed. You can send data to various BI tools, spreadsheet apps, or data warehouses.
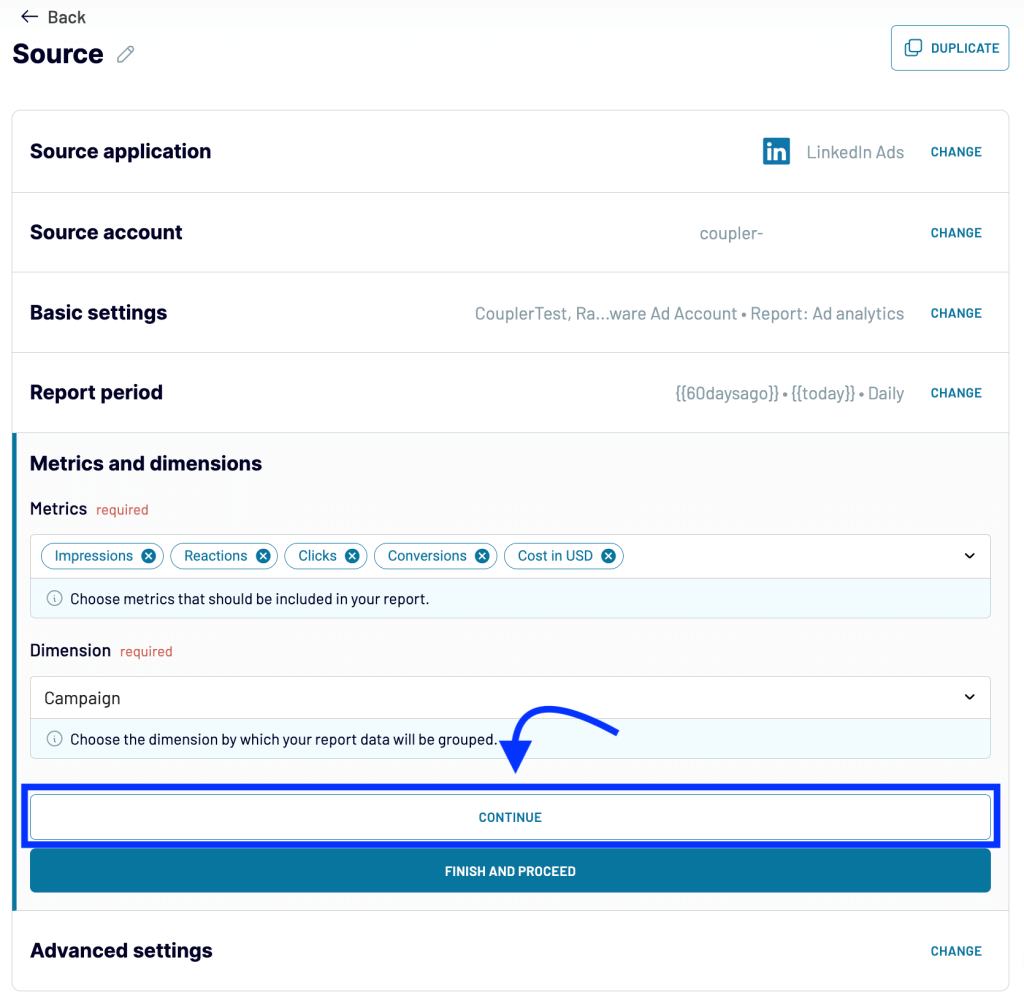
Create a Coupler.io account to use the platform – it’s free and no card details are required. Then, connect your LinkedIn account and select report type: Ad analytics, Ad account users, Campaign groups, Campaigns, Creatives, or Video ads.
In the settings, you can select report period, metrics, and dimensions to include in the exported dataset.
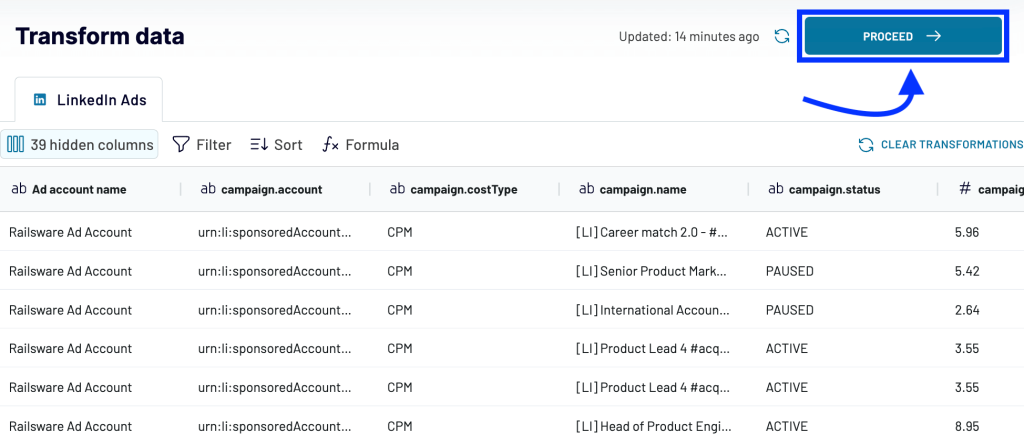
2. Transform data
In the next stage, you can preview data and perform various transformations if needed, such as:
- Hide unnecessary columns or add new ones
- Rename, rearrange, or split columns
- Use formulas and perform calculations
- Sort and filter data
- Blend data from multiple data sources or accounts
The latter is useful if you want to combine data on one campaign running on several platforms, for example.
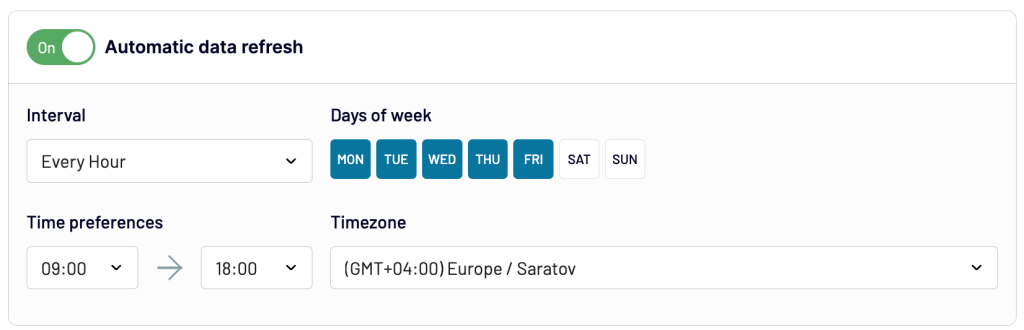
3. Load data and schedule updates
Follow the onscreen instructions to connect your destination app. The exact steps depend on what you chose. In most cases, you will need to connect your destination account and specify where to load your data.
After this, toggle on Automatic data refresh and set up your custom schedule for the updates. Coupler.io can refresh your LinkedIn Ads data in the destination app as often as every 15 minutes. This lets you build live dashboards and ever-green reports, maintain a backup copy of your data, and more.
Save and run the importer. Now, you can start working with your data in the destination app: query data and perform deep analysis in a data warehouse, create dashboards in BI tools, or perform calculations in spreadsheets.
If you are planning to visualize your data, see our article 20 Types of Graphs for Marketers for hands-on tips.
Native reporting options for LinkedIn Ads campaign analysis
You may wonder why we put the default solution for LinkedIn analytics at the very end. The answer is simple. Now that you you’ve already seen the alternative options and third-party analytics dashboards – you can judge for yourself whether the native report allows you to work with your data properly.
LinkedIn Campaign Manager provides a basic overview of campaign metrics, with very few customization options, almost no visualization, and limited shareability. The Campaign Performance tab allows you to switch between campaign groups, campaigns, and ads to explore data at different levels.
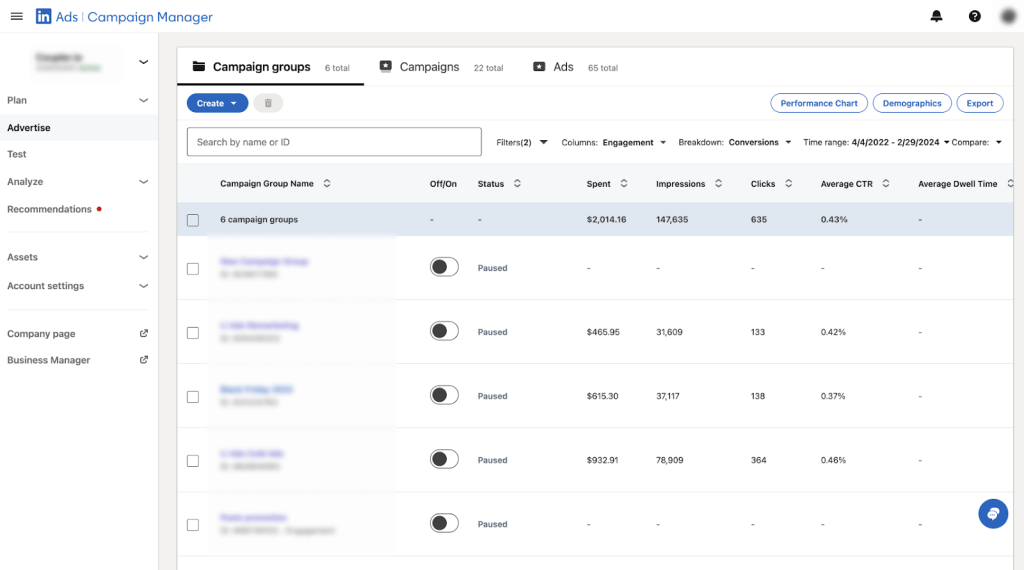
For each of these levels, you can select a custom set of columns and change their order. It’s also possible to add up to 10 custom views. To see how this works, click Columns and scroll down to Customize columns.
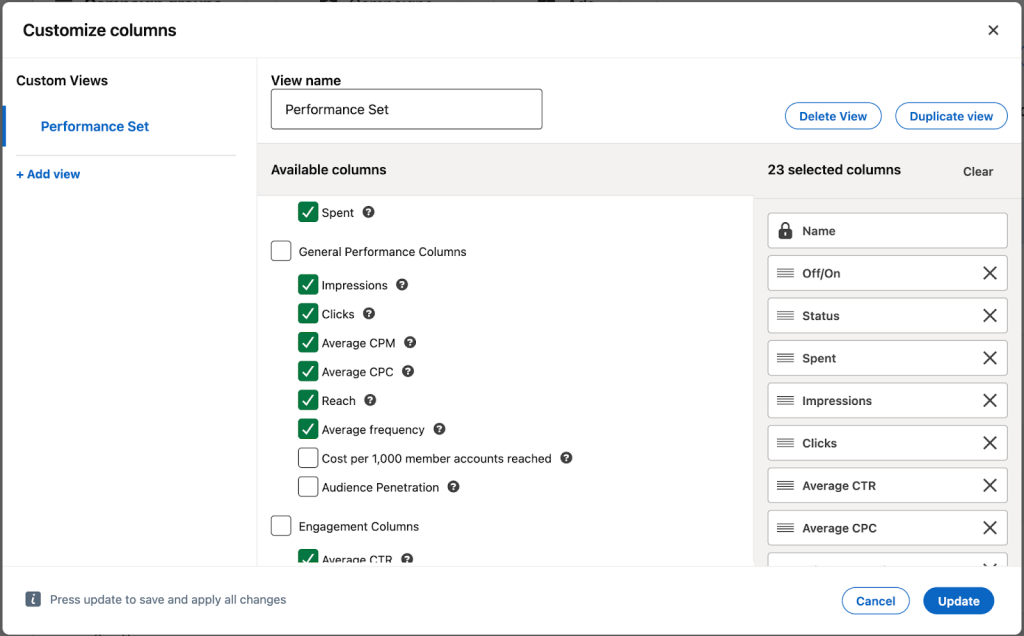
This lets you create a custom report using the available elements. However, you won’t be able to share it with your colleagues who also work with this account – custom views are only visible to the user who created them.
Apart from this basic Campaign Performance report, there are a couple of extra features: Performance Chart and Demographics. The first of them is a simple line graph showing one metric at a time for a selected period. Click Display to choose what metric to display. If you selected several campaigns, you can turn off aggregation. Then, you will be able to compare the results of up to 8 campaigns in the same chart.
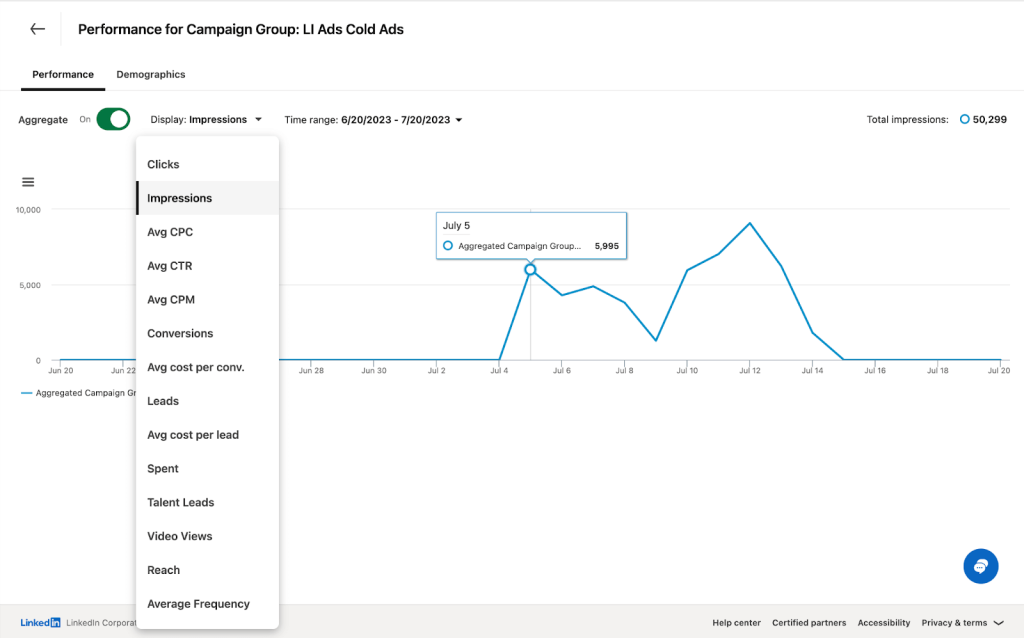
A single chart representing a single metric at a time is hardly a proper tool for serious analysis. In such a graph, it’s not even possible to check how one metric correlates with another.
The Demographics section doesn’t offer much flexibility either. It displays the key metrics split by demographic characteristics as bar graphs. It allows you to filter data by period and by a specific parameter, such as job function or company size.
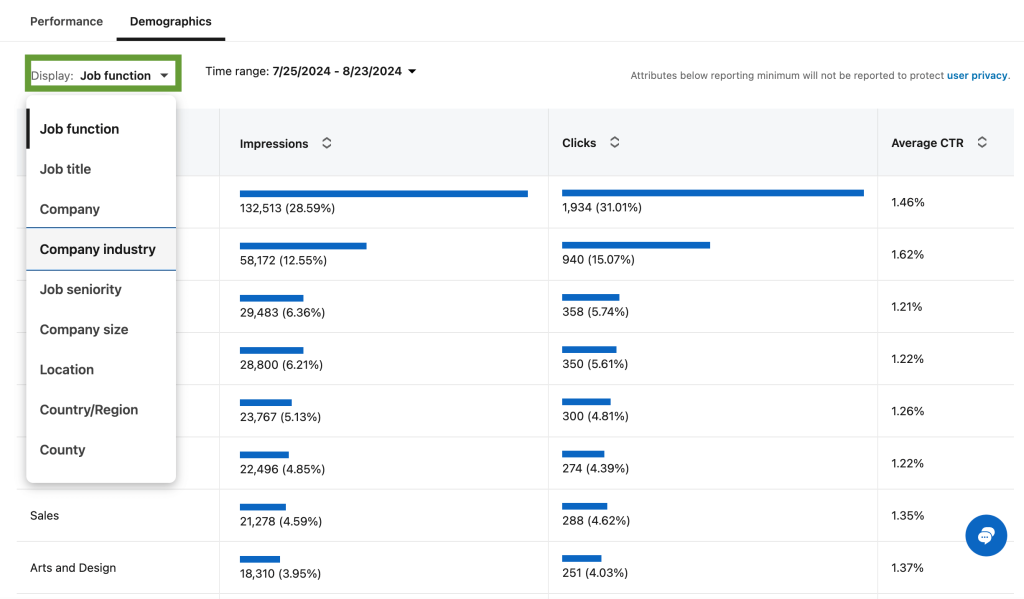
As you can see, the native tool for LinkedIn Ads analytics comes with many limitations. You can’t perform calculations, work with your data in a visual format, or freely share your report with the stakeholders.
Exporting your data from LinkedIn Ads and working with it in a BI tool, spreadsheet app, or data warehouse is a far better option. Ad data can be manually downloaded from the Campaign Manager as a CSV file. However, for ongoing analysis, it’s better to consider automation. You can use Coupler.io to channel your LinkedIn Ads data to the application of your choice or build a report with a free template. For more details, see our guide on how to export LinkedIn Ads data.
Key LinkedIn Ads metrics to measure performance
If you are building a custom report from scratch, you will need to include the most important metrics. Here’s an overview of the ones we recommend paying attention to. We’ve also included benchmark values for reference which can be helpful in analyzing your KPIs or setting goals.
| Metric | Meaning | Formula | Benchmark value |
| Impressions | How many times your ad was seen by the audience during a specific period. One person can have multiple impressions if they view your ad several times. | – | – |
| Clicks | The total number of times users clicked links in your ad or interacted with it. Which clicks count as chargeable depends on the selected campaign objective. For the website visit objective, you only pay for clicks to your landing page. For the engagement objective, you are also changed for likes, comments, shares, clicks to landing page, etc. | – | – |
| Click-through rate (CTR) | The percentage of users who saw your ad and then clicked the link or button in that ad. | CTR = (Clicks / Impressions)*100 | The median value for CTR is 1.49%, varying across industries from 2.06% to 0.73%. |
| Cost per click (CPC) | This metric indicates how much you pay for a click, on average. It’s calculated by dividing your total campaign budget by the number of clicks. | CPC = Total cost / Clicks. | The median value for CPC is $0.40. It can be different depending on the business segment, from $0.18 to $0.85. |
| Cost Per Mille (CPM) | CPM shows how much you pay, on average, for 1,000 impressions. This metric helps you understand the cost-effectiveness of your ad campaigns. | CPM = (Total amount spent / Total impressions)*1,000 | The median CPM value across industries is approximately $5.61, ranging from $2.6 to $9.98. |
| Conversion rate | The conversion rate shows the percentage of clicks that turn into conversions. | Conversion Rate = (Conversions / Clicks) * 100 | |
| Conversions | The number of times users performed a target action. Depending on your goals, you can consider different user actions a conversion – for example, lead form open or purchase. | – | – |
| Amount spent | This metric shows how much ad budget you spent on a specific campaign, ad group, or channel within a selected timeframe. | – | – |
| Frequency | Frequency is a metric that allows you to estimate how many times, on average, a user saw your ad. | Frequency = Impressions / Reach (unique users) | Typically, frequency is within 1-3 ad views per user. |
| Leads | A number of potential customers who performed a target action and expressed interest in your offer after seeing your ad. | – | – |
There are, of course, a lot of other PPC metrics you may need to keep an eye on, and the exact set depends on your goals. In some cases, you may even need to calculate custom metrics. However, this set of metrics can serve as a useful basis to build upon.
Learn more about performance marketing for B2B SaaS.
How to analyze LinkedIn Ads metrics: a hands-on checklist and expert comments
Before starting, it’s important to clearly define your objectives. Decide on the type of insight you are seeking – the decisions you need to make and the problems you want to solve. For example: which types of campaigns generate the most leads, which ads and messages yield the highest impressions and widest reach, or how to optimize our ad budget without sacrificing conversions. Once you have identified your focus areas, you can begin the process of conducting a LinkedIn Ads campaign analysis.
1. Prepare your data
Collect the information you need for analysis. For the best result, it’s better to gather data automatically on an ongoing basis. Prepare your report or dashboard to work with and make sure to include elements that let you easily analyze data – interactive filters, slicers, drill-downs, as well as informative graphs and charts that are easy to read.
2. Evaluate overall ad performance
Compare your ad results to the KPIs that were set as a goal. See if your campaigns brought you enough impressions, clicks, conversions, and leads for the budget spent. Estimate the efficiency of your ad efforts and define the value they generated for the business. For reference, you can also check how your ad results compare to industry averages in this guide to PPC statistics and benchmarks.
Depending on the campaign objective, you may need to focus on different KPIs. For example, for a brand awareness campaign, impressions are a relevant success metric but for other types of campaigns, it may be better to concentrate on business metrics, such as purchases and ROAS. It’s also important to make sure that data you analyze is precise and the conversions are attributed correctly.
An expert tip from Maximilian Herczeg, Founder at Kamrat:
“I’m a big fan of self-attribution (=ask people where they saw you) as lots cannot be tracked. Then there’s also good attribution software, such as Dreamdata. LinkedIn now also offers the Conversion API, which utilises the Google Tag Manager, Zapier, etc.”
3. Identify patterns and trends
Analyze how the key metrics were changing during the campaign periods and look for correlations. For example, you may notice that you get more conversions on business days than on weekdays, or that results improved when you changed messaging or audience settings. However, remember that correlation does not always mean causation. Use your findings to draw up a list of hypotheses and test them.
4. Perform time-over-time analysis
Use historical data to evaluate overall trends and see progress on a big scale. This will help you identify seasonal changes, persisting issues, and best practices. Before launching a new campaign, it’s useful to check data on a past campaign that had similar objectives. This lets you take into account past challenges and provides some benchmark KPIs. Your findings will help you understand what works best and enhance your future campaigns.
5. Find your top performers
Identify which campaigns, ad formats, and landing pages are generating the most conversions and revenue. This analysis should also extend to audiences, locations, devices, and other parameters. Check what performs best and analyze the factors behind these results so that you can replicate the previous success for your other campaigns. Apart from this, it makes sense to prioritize the top performers and allocate more budget to these ads or campaigns, design additional ad creatives, and so on.
Here’s a recommendation on this from Roman Krs, a Founder & Performance Marketer at Grouts Online:
“The approach is to allocate budgets to tactics that bring more for the same investment. We run the campaign for a certain period of 2-4 weeks and then reallocate the budget to campaigns that perform better.
We recommend building a dashboard to monitor trends across different metrics to see when it’s time to switch the budgets, refresh ads or content, or pause the campaigns.”
6. Compare clicks and conversions
If your campaign generates a lot of clicks, that’s usually a good sign as it indicates the audience is interested in your product. However, if it’s a PPC campaign, each click costs you money. That’s why it’s important to analyze clicks together with conversions. If you have high clicks, but low conversions, you will need to investigate what keeps users from converting and address these issues. For example, you may need to update your landing page to better align messaging or improve navigation.
7. Analyze impressions in conjunction with clicks
Ensure that your campaign is generating enough impressions to engage your target audience. If impressions are low, you may need to adjust your audience settings or review your ad budget. Check how this metric correlates with clicks and CTR. If the latter is low, in conjunction with high impressions, this means your ads fail to engage potential customers. This can mean your message is uninteresting or confusing, the CTA is not clear enough, or the design is not appealing.
8. Check if lead forms bring you quality leads
When a user fills out a lead form on LinkedIn, it typically counts as a conversion. However, to analyze this result, it makes sense to request feedback from Sales and find out whether those conversions brought quality leads. For example, if the campaign audience settings are off, you may have a lot of lead form opens, but those forms can be filled out by the wrong people – for instance, small businesses that indeed need your services but can’t afford them.
Expert insights on this from Tom Casano, LinkedIn Ads Strategist & Founder at Tamarind Agency:
“For a lead generation campaign, I am looking at the cost per lead and the quality of the leads generated. I am also looking for feedback from the sales team to help inform us if they are able to book sales calls with leads and how those sales meetings go.
For lead generation, for a campaign that is performing decently well, I look for a lead form conversion rate of at least 20% or 25%. The CTR I might expect is >0.50% or so. The cost per lead for a cold audience downloading a lead magnet would be in the neighborhood of $50-$150 per lead, depending on the industry and target audience.”
9. Pay attention to business metrics
When conducting analysis, it’s best to avoid focusing on “vanity metrics” – numbers that look good on paper but bring little value to the business. For example, a campaign can generate a lot of impressions and even clicks, but, eventually, bring few conversions and no purchases. Despite good awareness metrics, such a campaign cannot be called a success. The ultimate metric that shows the end value of your advertising efforts is ROAS. Therefore, it’s important to calculate it for every campaign and focus on growing it.
A comment from one of our domain experts, Alex Gavril, who is the CEO of ?promocrat:
“Ideally, any advertising channel would have an associated ROAS (Return on Ad Spend), but depending on the business model, this can be easy or complex to calculate. For example, for single-purchase products or services, ROAS can be simply calculated by dividing Total Revenue Generated by Total Ad Spend.
In the case of a subscription business, it can be a bit more complicated, as you would need to define CLTV (Customer Lifetime Value), which, in turn, requires historical or predicted data on Average Lifespan.”
10. Calculate custom metrics
To use your ad data to the fullest, you shouldn’t always rely on the pre-set metrics, as some cases may require an individual approach. Calculating custom metrics for your campaigns will give you more precise information on ad performance and costs.
A practical example from AJ Wilcox, the Host of the LinkedIn Ads Show Podcast and the CEO of B2Linked:
“LinkedIn Ads does a pretty decent job of providing advertisers with metrics that allow us to measure our performance. But I’ve found that I get more powerful insights by creating metrics that the platform doesn’t calculate for me.
For instance, with any sort of video campaign, we get view rate and cost per view, but these metrics are mostly meaningless since a “view” is calculated as anyone who’s had the video playing on their screen for 2 seconds. To access a more insightful measurement of the effectiveness of my video creative, I calculate the metric “Cost per 50% View” (total cost / # of 50% views).
I find the majority of video ads to land between $2-4 per 50% view, while some of the highest performing creative I’ve seen has been as low as $0.25!”
11. Conduct A/B testing
During analysis, you will draw conclusions. However convincing these conclusions may seem, it is always better to test your hypothesis. This is one of the things A/B testing can help you with. It can also help refine your strategy and improve your ad results further. You can A/B test different messages, designs, targeting settings, and more. This will give you the information to make your best-performing campaigns even more powerful.
To make your hard work on LinkedIn Ads analytics count, share your findings with the team and decide how you can put them into action.
For more tips, see our article How to optimize LinkedIn Ads in 10 steps.
Uncovering insights with live dashboards and reports
LinkedIn is one of the most effective social media platforms for advertising. By working with your data regularly and streamlining LinkedIn Ads reporting, you can greatly enhance your ad strategy. In particular, LinkedIn Ads campaign analysis can help you with budget optimization, increasing lead generation, and boosting conversions.
Consider incorporating first-party data into your analysis to get the full picture of ad performance.
The most effective way to organize the analysis process is by building a live dashboard or report that automatically pulls data from LinkedIn Ads and refreshes your metrics on a schedule. You can use ready-made dashboard templates to automatically visualize your data within minutes. Alternatively, you may opt for creating a LinkedIn marketing report on your own, from the ground up. In either case, Coupler.io can help you automate your report or dashboard, bringing you live updates for timely analysis.
Automate reporting with Coupler.io
Get started for free