Do you prefer creating ad reports in spreadsheets, BI tools, or work management platforms? Unfortunately, LinkedIn doesn’t provide native connectors or automation options. Luckily, alternative solutions are available that do.
In this article, we explain how you can automate LinkedIn Ads reporting without the need for coding. This option doesn’t require any technical skills or prior experience. But for those who are comfortable with writing scripts, we also cover the main steps for building an automated connection via the API.
Free templates for auto-updating LinkedIn Ads reports
You can create LinkedIn Ads reports from scratch, but there’s a more convenient way – using ready-made dashboard templates. In this case, your LinkedIn Ads data will be visualized automatically in a few minutes. Then, use the native functionality of the selected BI tool or spreadsheet app to customize the reporting dashboard.
Here are some free dashboard templates offered by Coupler.io, a reporting automation platform. They allow you to create auto-updating customizable reports in just a few clicks.
1. KPI dashboard for live LinkedIn Ads reporting
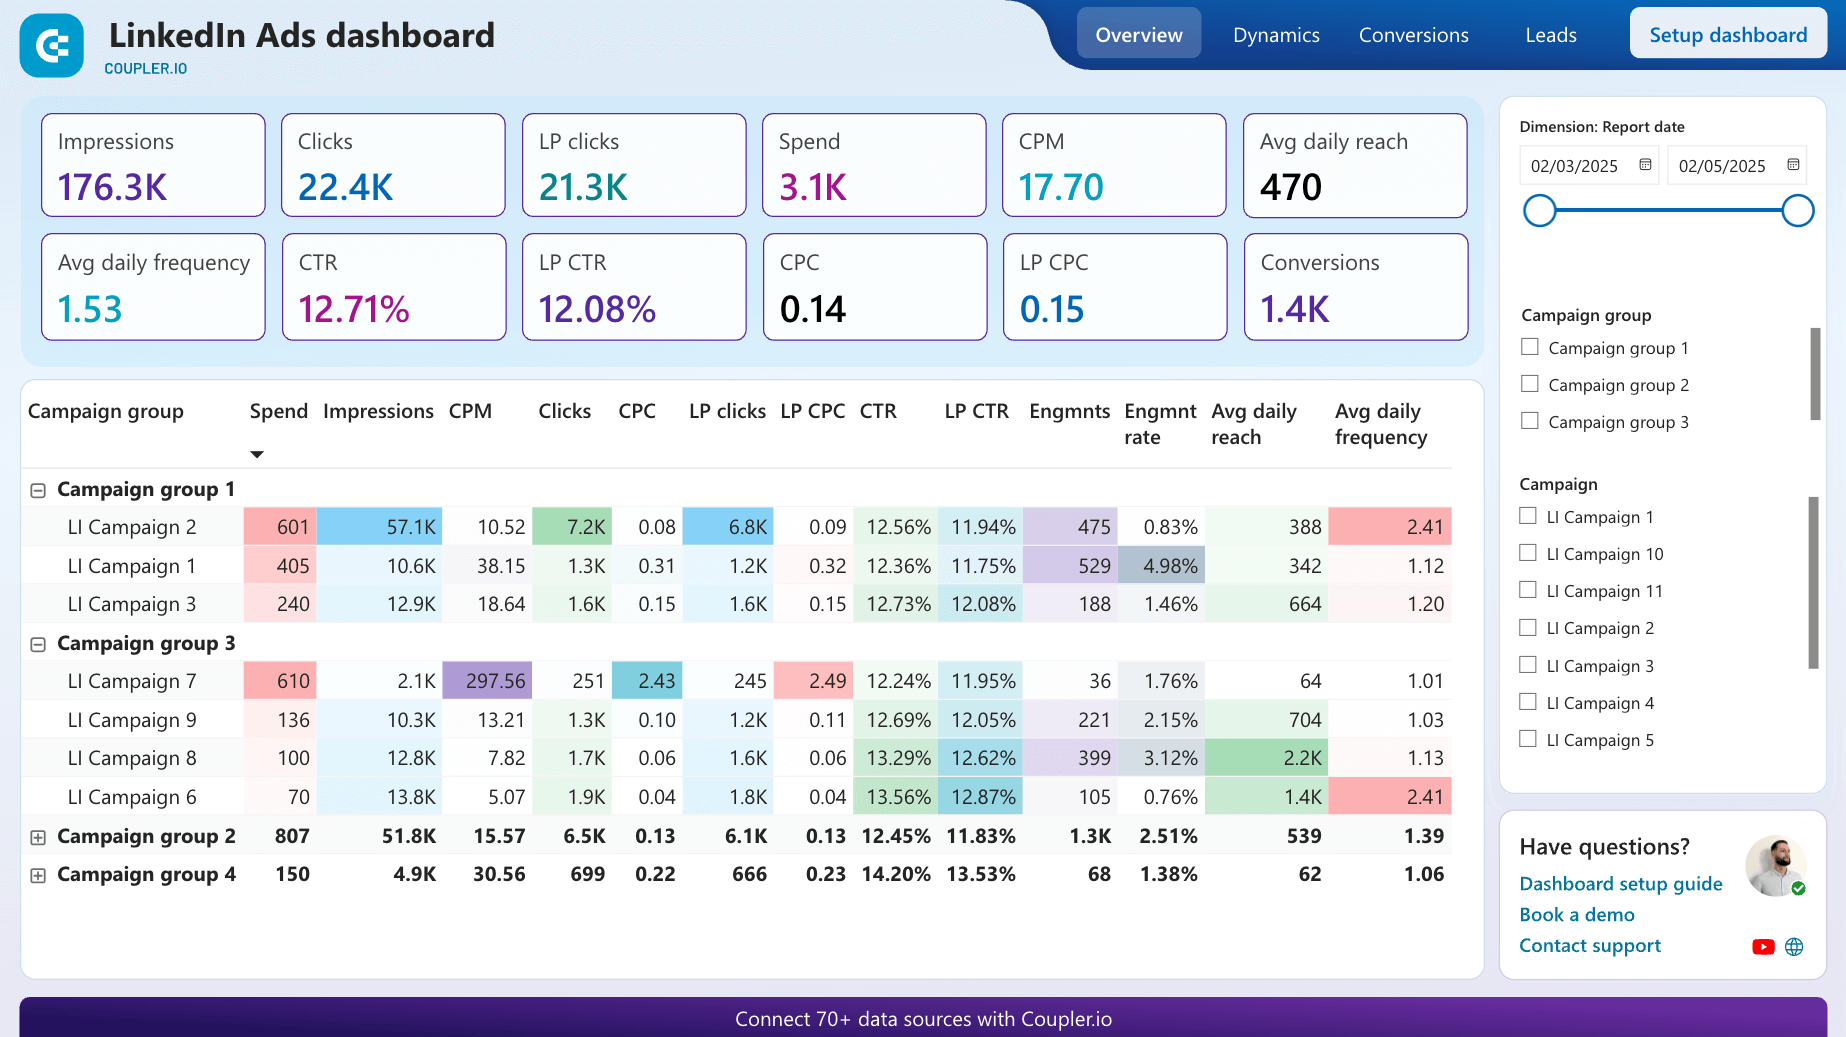
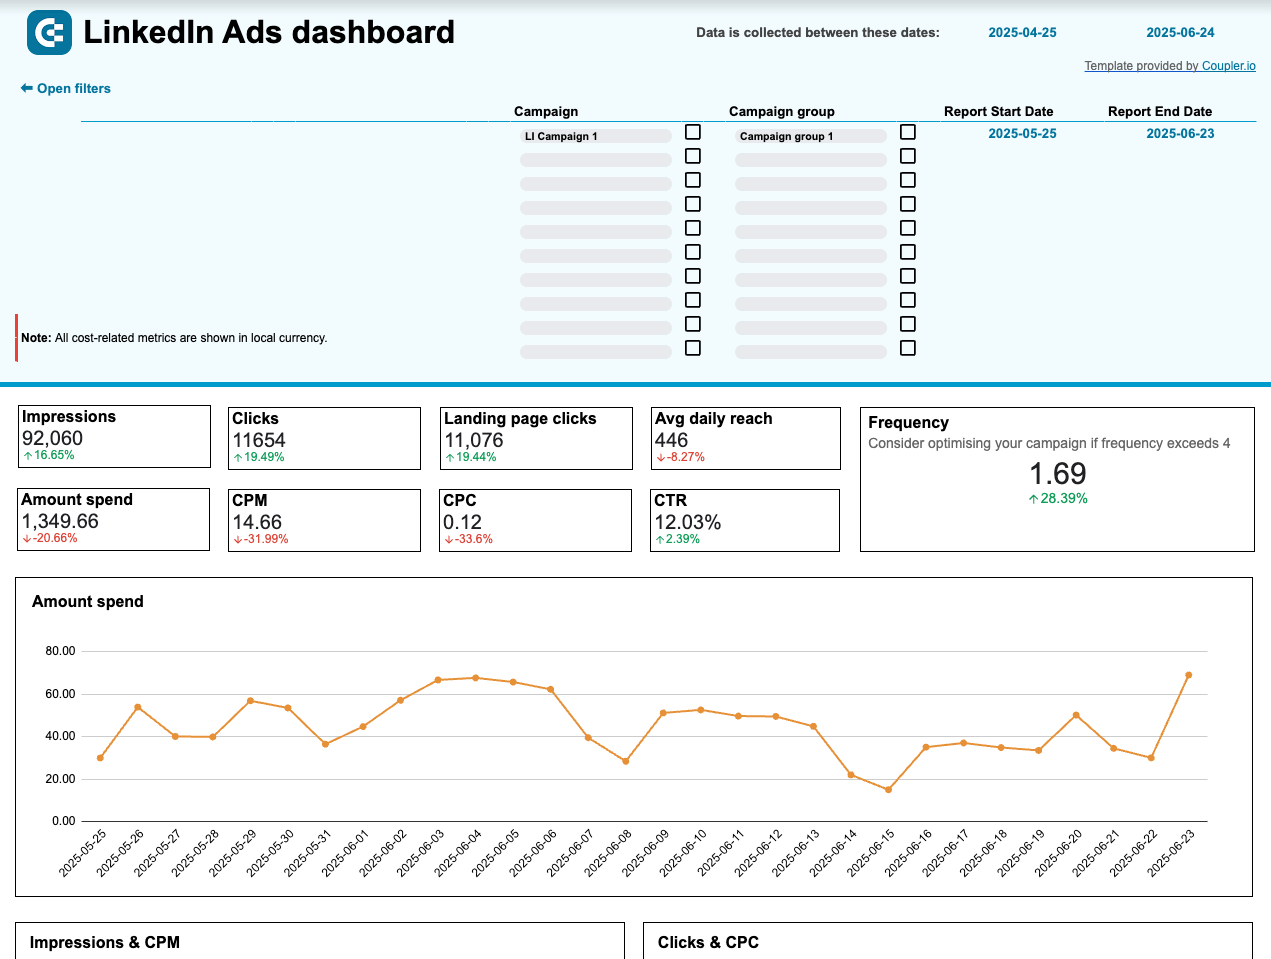
This free LinkedIn Ads Dashboard template provides an overview of the main metrics and allows you to analyze campaign performance and conversions. It displays Reach and Frequency by campaign, Click and Impression dynamics over time, and a detailed summary of campaign results. The dashboard also includes a Frequency Meter, which is useful for preventing ad fatigue among your audience. If the frequency goes above 2-3, you may need to consider adjusting ad settings so that the same people don’t see your ads too often.
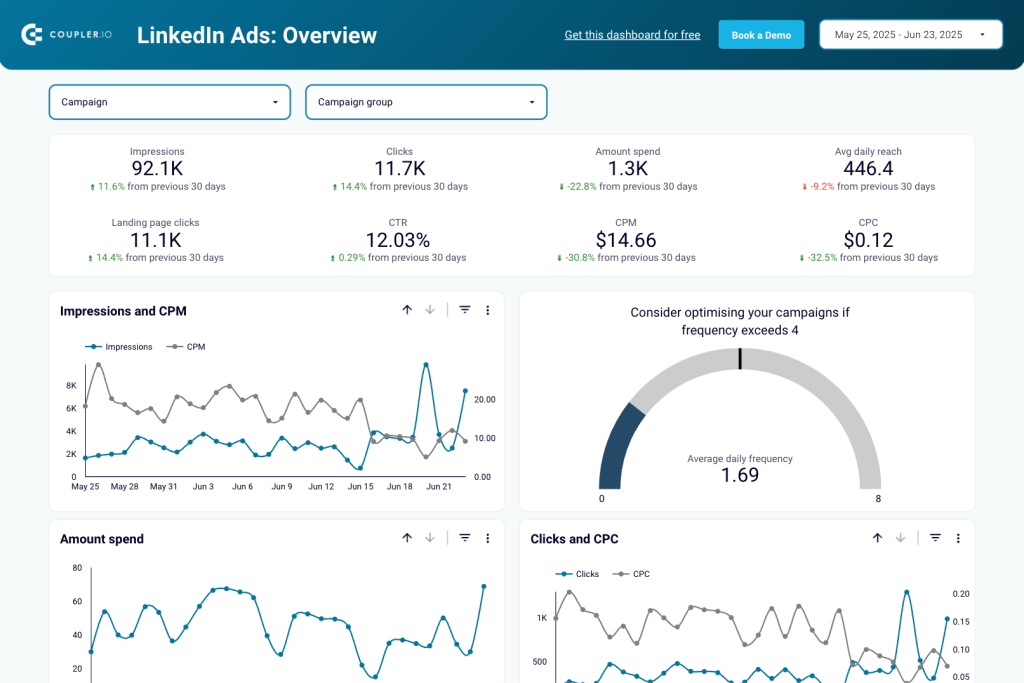
The second tab of this LinkedIn Ads KPI dashboard focuses on Conversions and Leads. Here, you can select different conversion types, conduct time-over-time analysis, and work with your funnel. Data can be filtered by campaign, enabling you to examine conversions for different campaigns separately. Overall, this interactive LinkedIn Ads report is an essential tool for tracking conversions and making data-driven decisions.
Dashboard metrics:
- Impressions
- Clicks
- Amount spent
- Reach
- Frequency
- CTR
- CPC
- CPM
- Engagement rate
- Conversion rate
How to set up:
To access the pre-set importer for this dashboard, go to the Readme tab and follow the instructions to set it up. You will need to create a Coupler.io account to proceed, but it’s free and no credit card is required. By default, the dashboard will be updated every 24 hours. If needed, you can change the schedule settings to have it refreshed at a shorter interval, up to every 15 minutes. The template is available in Looker Studio, Power BI, and Google Sheets, so choose your preferred version and try it for free!


2. LinkedIn Ads creatives dashboard
The LinkedIn Ads creatives dashboard offers an overall view of your ad creatives’ performance and helps you optimize engagement and spending. It includes a breakdown of key metrics like impressions, clicks, cost, CPM, and conversions.
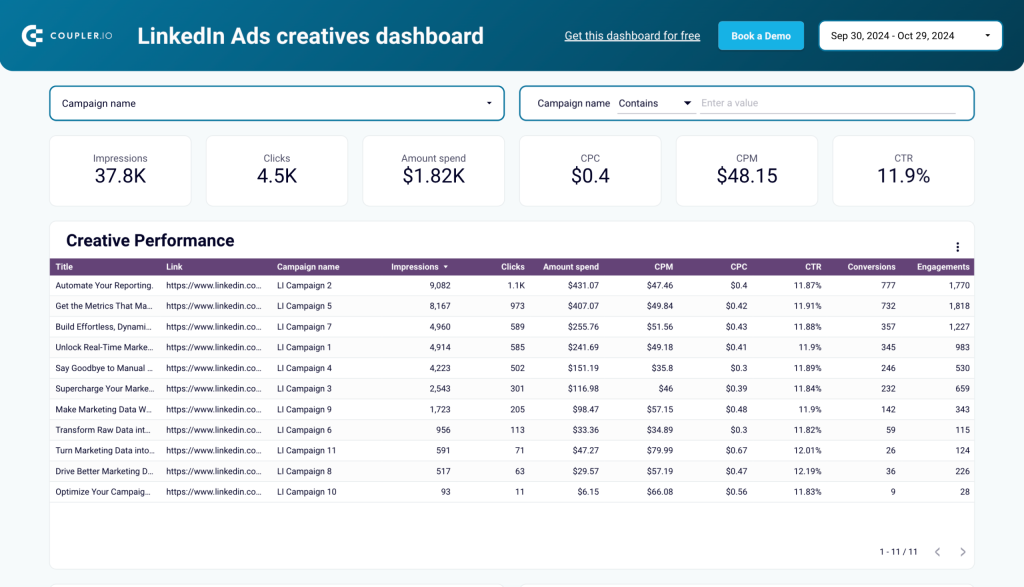
The dashboard’s intuitive structure includes visualizations for Impressions vs. CPM, Clicks vs. CPC, and Spend Dynamics. These features allow you to track campaign reach, engagement trends, and spending patterns over time. Additionally, the creative performance table provides a detailed comparison of creatives, so that you can prioritize the most effective ones for future campaigns.
Dashboard metrics:
- Impressions
- Clicks
- Amount spent
- CPM
- CPC
- CTR
- Conversions
- Engagements
How to set up:
To use this Looker Studio dashboard, go to the Readme tab and follow the instructions. You can also set up a schedule to update the data in the dashboard automatically.
3. LinkedIn page and ads analytics dashboard
The LinkedIn page and ads analytics dashboard provides a unified view of both organic content and ad campaigns, It is a go-to dashboard for businesses looking to maximize their LinkedIn presence.
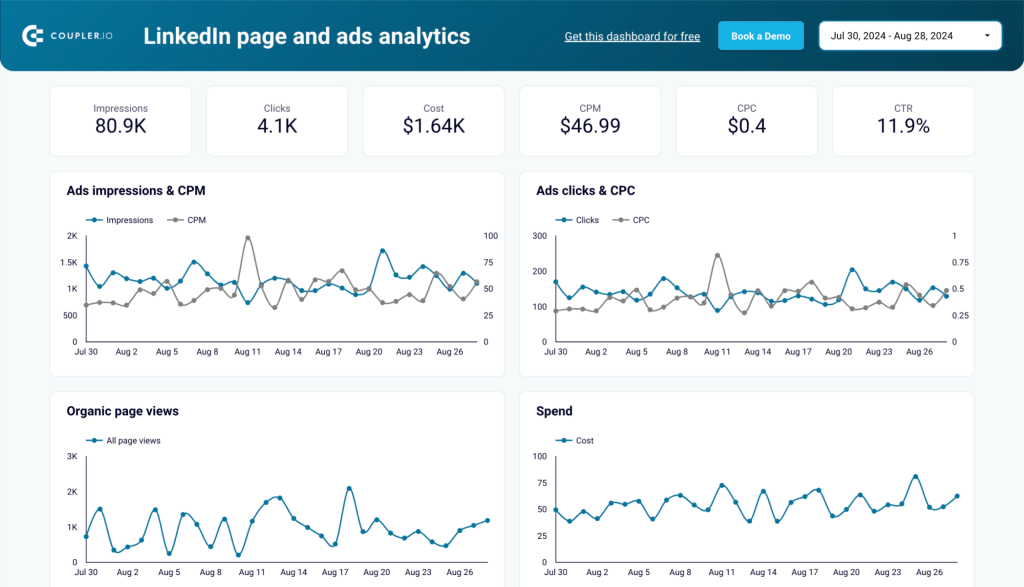
It visualizes metrics like impressions, clicks, CPC, and CTR for your ad campaigns alongside organic metrics like page views, likes, and comments. The dashboard includes a post performance table to analyze individual posts and a geographic insights map to track impressions and page views by region. These visualizations make it easy to fine-tune both organic and paid strategies for better results.
Dashboard metrics:
- Impressions
- Clicks
- Cost
- CPM
- CPC
- CTR
- Frequency
- Page Views
- Likes
- Comments
- Reposts
How to set up:
To get this Looker Studio dashboard with your data, go to the Readme tab and follow the instructions. You can also automate data updates based on a schedule.
4. LinkedIn Ads companies reach dashboard
This dashboard helps you track all the companies that have seen your LinkedIn Ads—not just the first 50 displayed in LinkedIn’s native reports. By pulling data directly from LinkedIn’s API, it provides a complete company reach overview, allowing you to analyze engagement at a granular level.
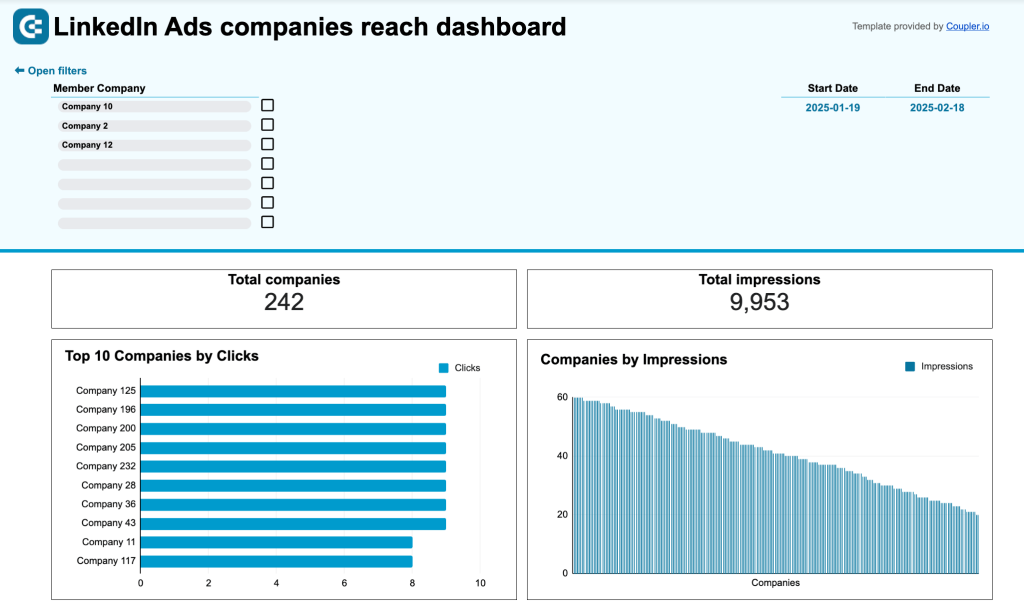
The LinkedIn Ads companies reach dashboard includes a company reach table with impressions, clicks, CTR, engagements, and conversions for each company. You can sort and filter this data to identify high-engagement companies. Additionally, it features a ranked list of the top 10 companies by clicks and a comparison table for ad spend vs. engagement, to make data-driven budget decisions.
Dashboard metrics:
- Total companies reached
- Total Impressions
- Clicks
- CTR (Click-Through Rate)
- Engagements
- Conversions
- Ad spend per company
How to set up:
This dashboard is powered by Coupler.io and available in Google Sheets. Instead of manually exporting reports, set up the integration once, and your data will refresh on a schedule. To use it with your LinkedIn Ads data, go to the Readme tab and follow the setup instructions.
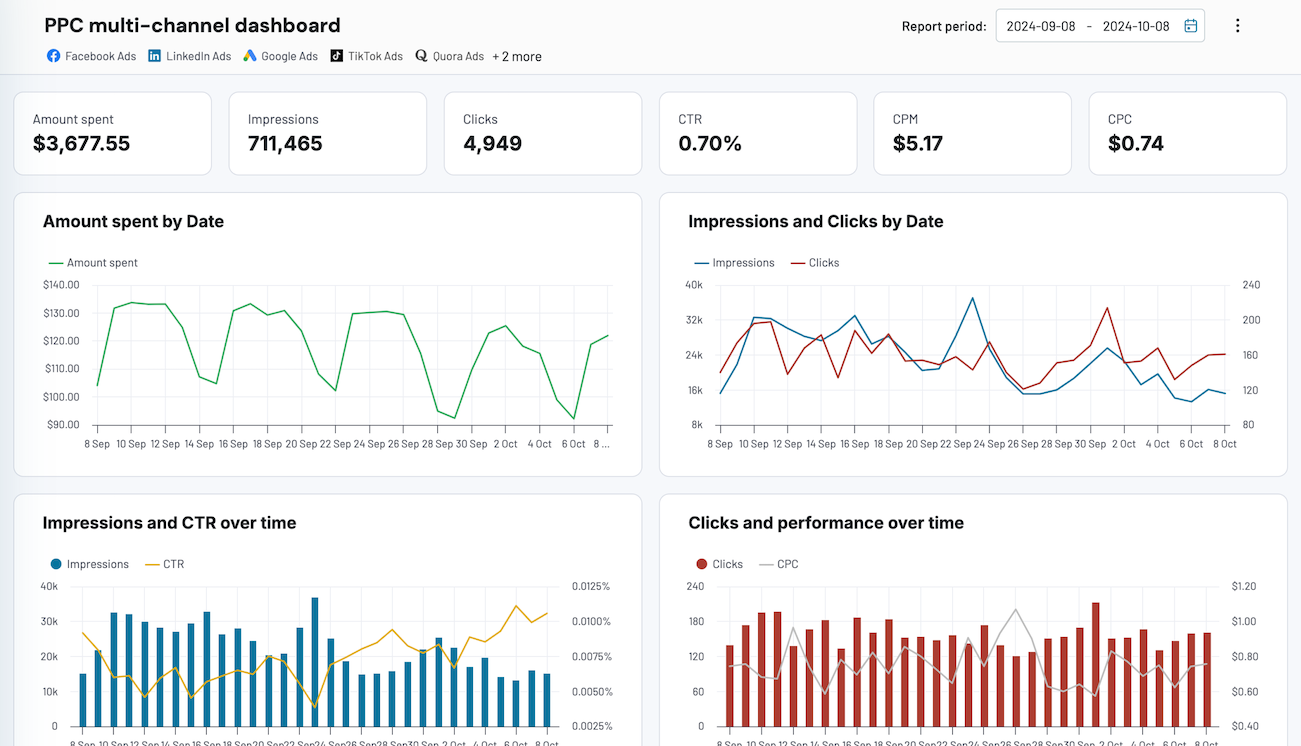
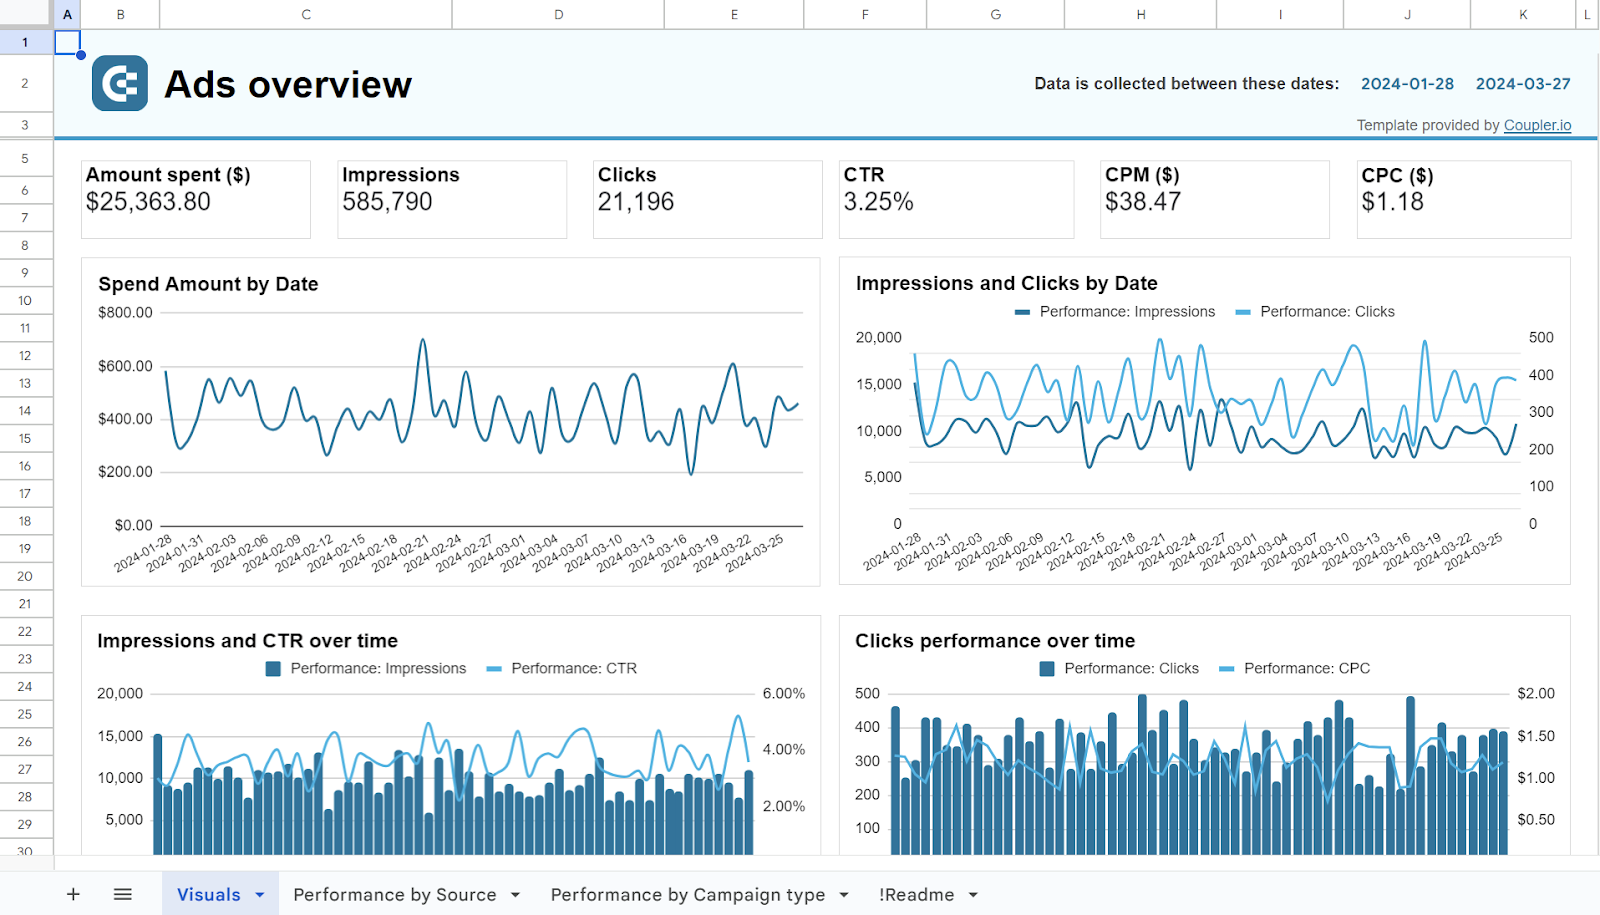
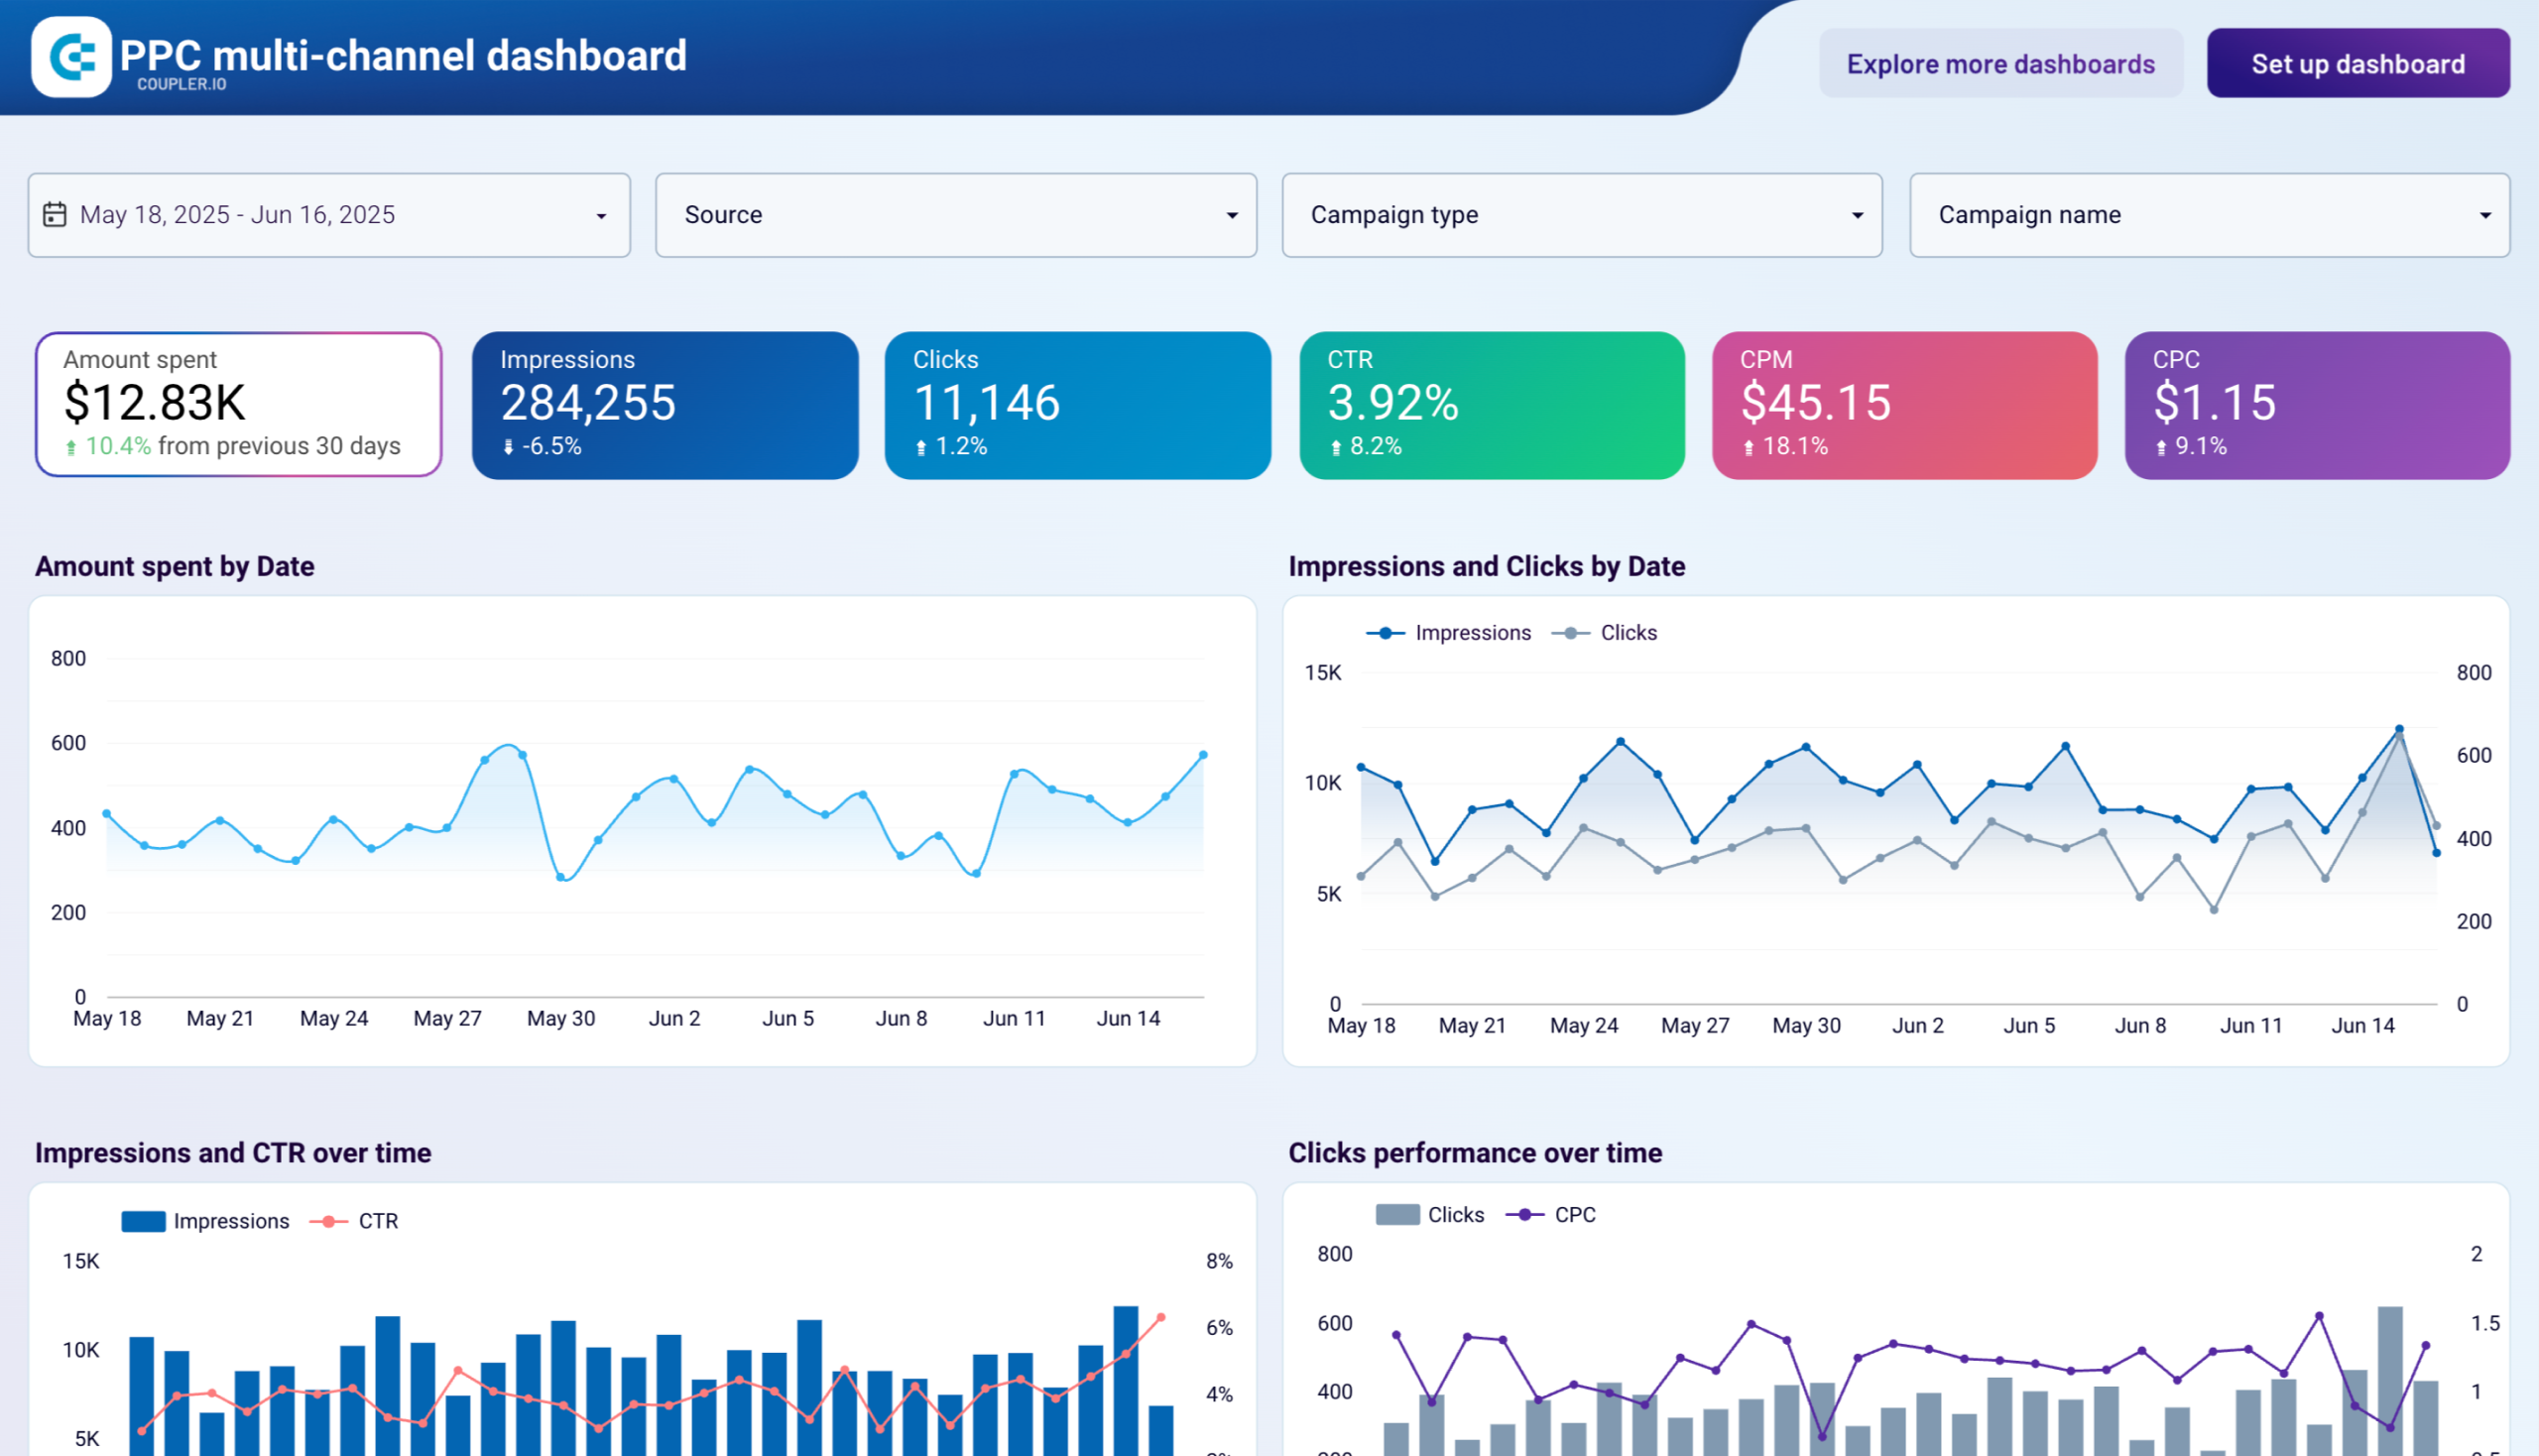
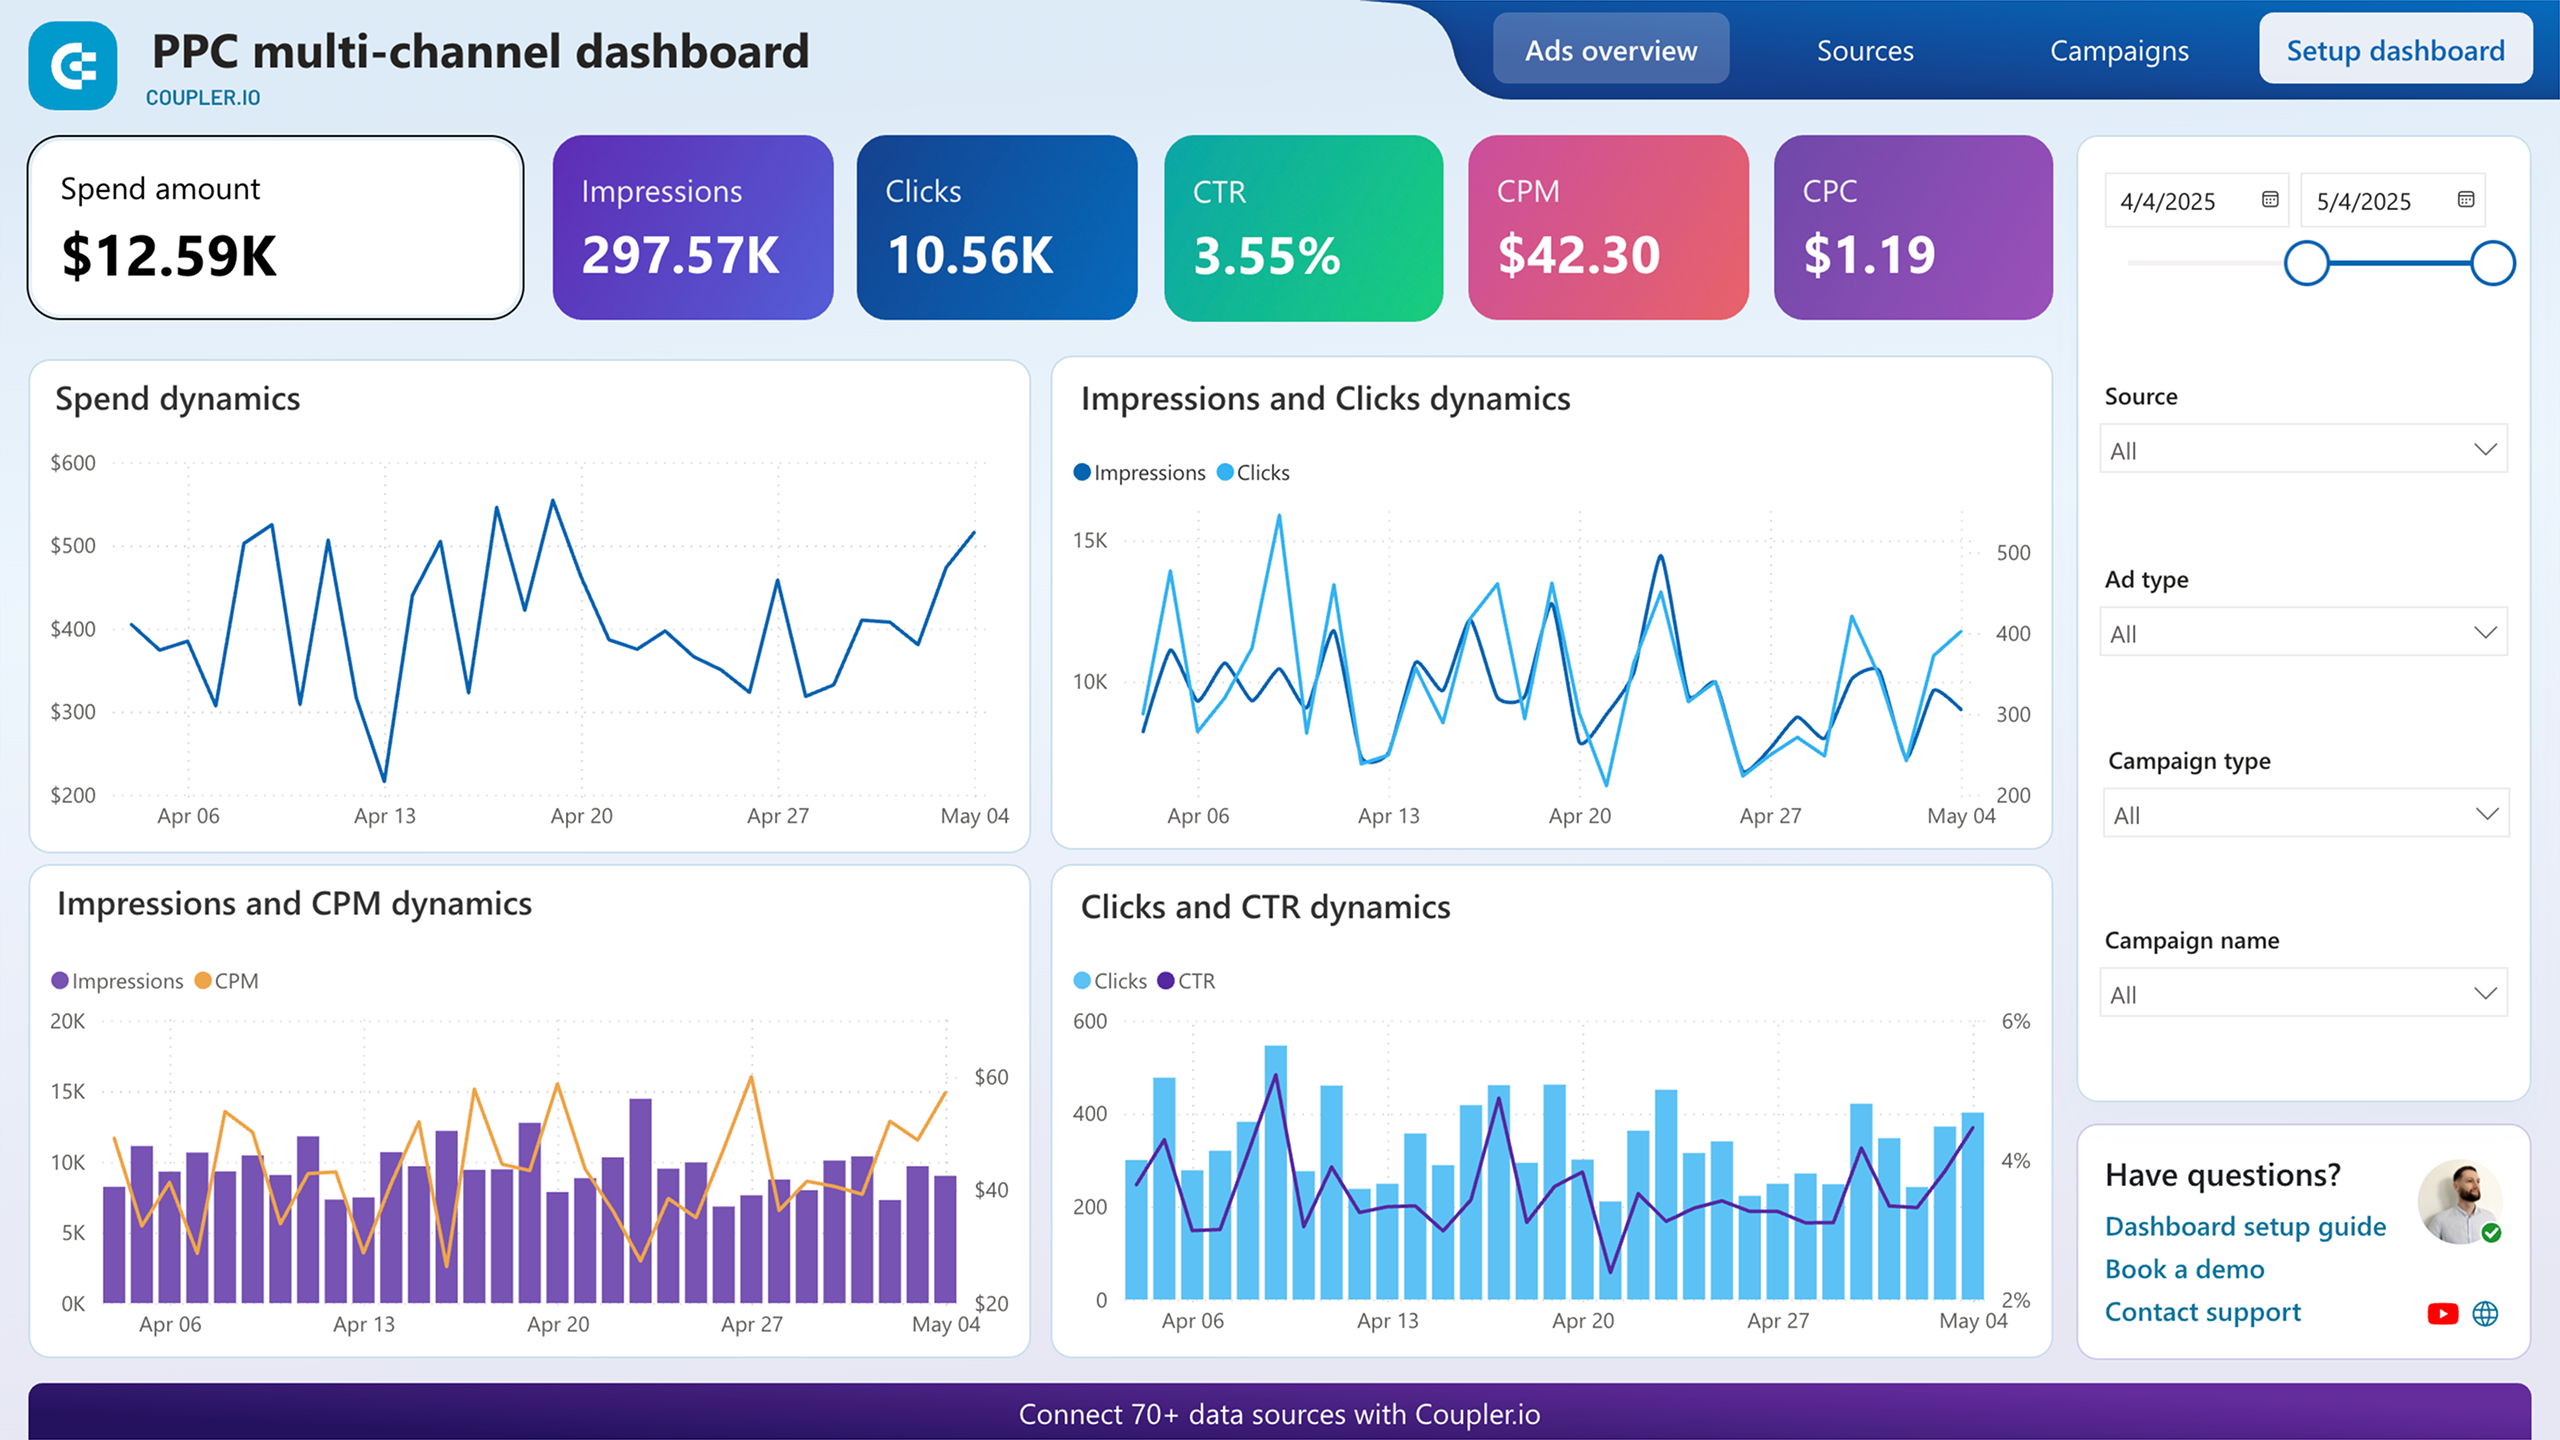
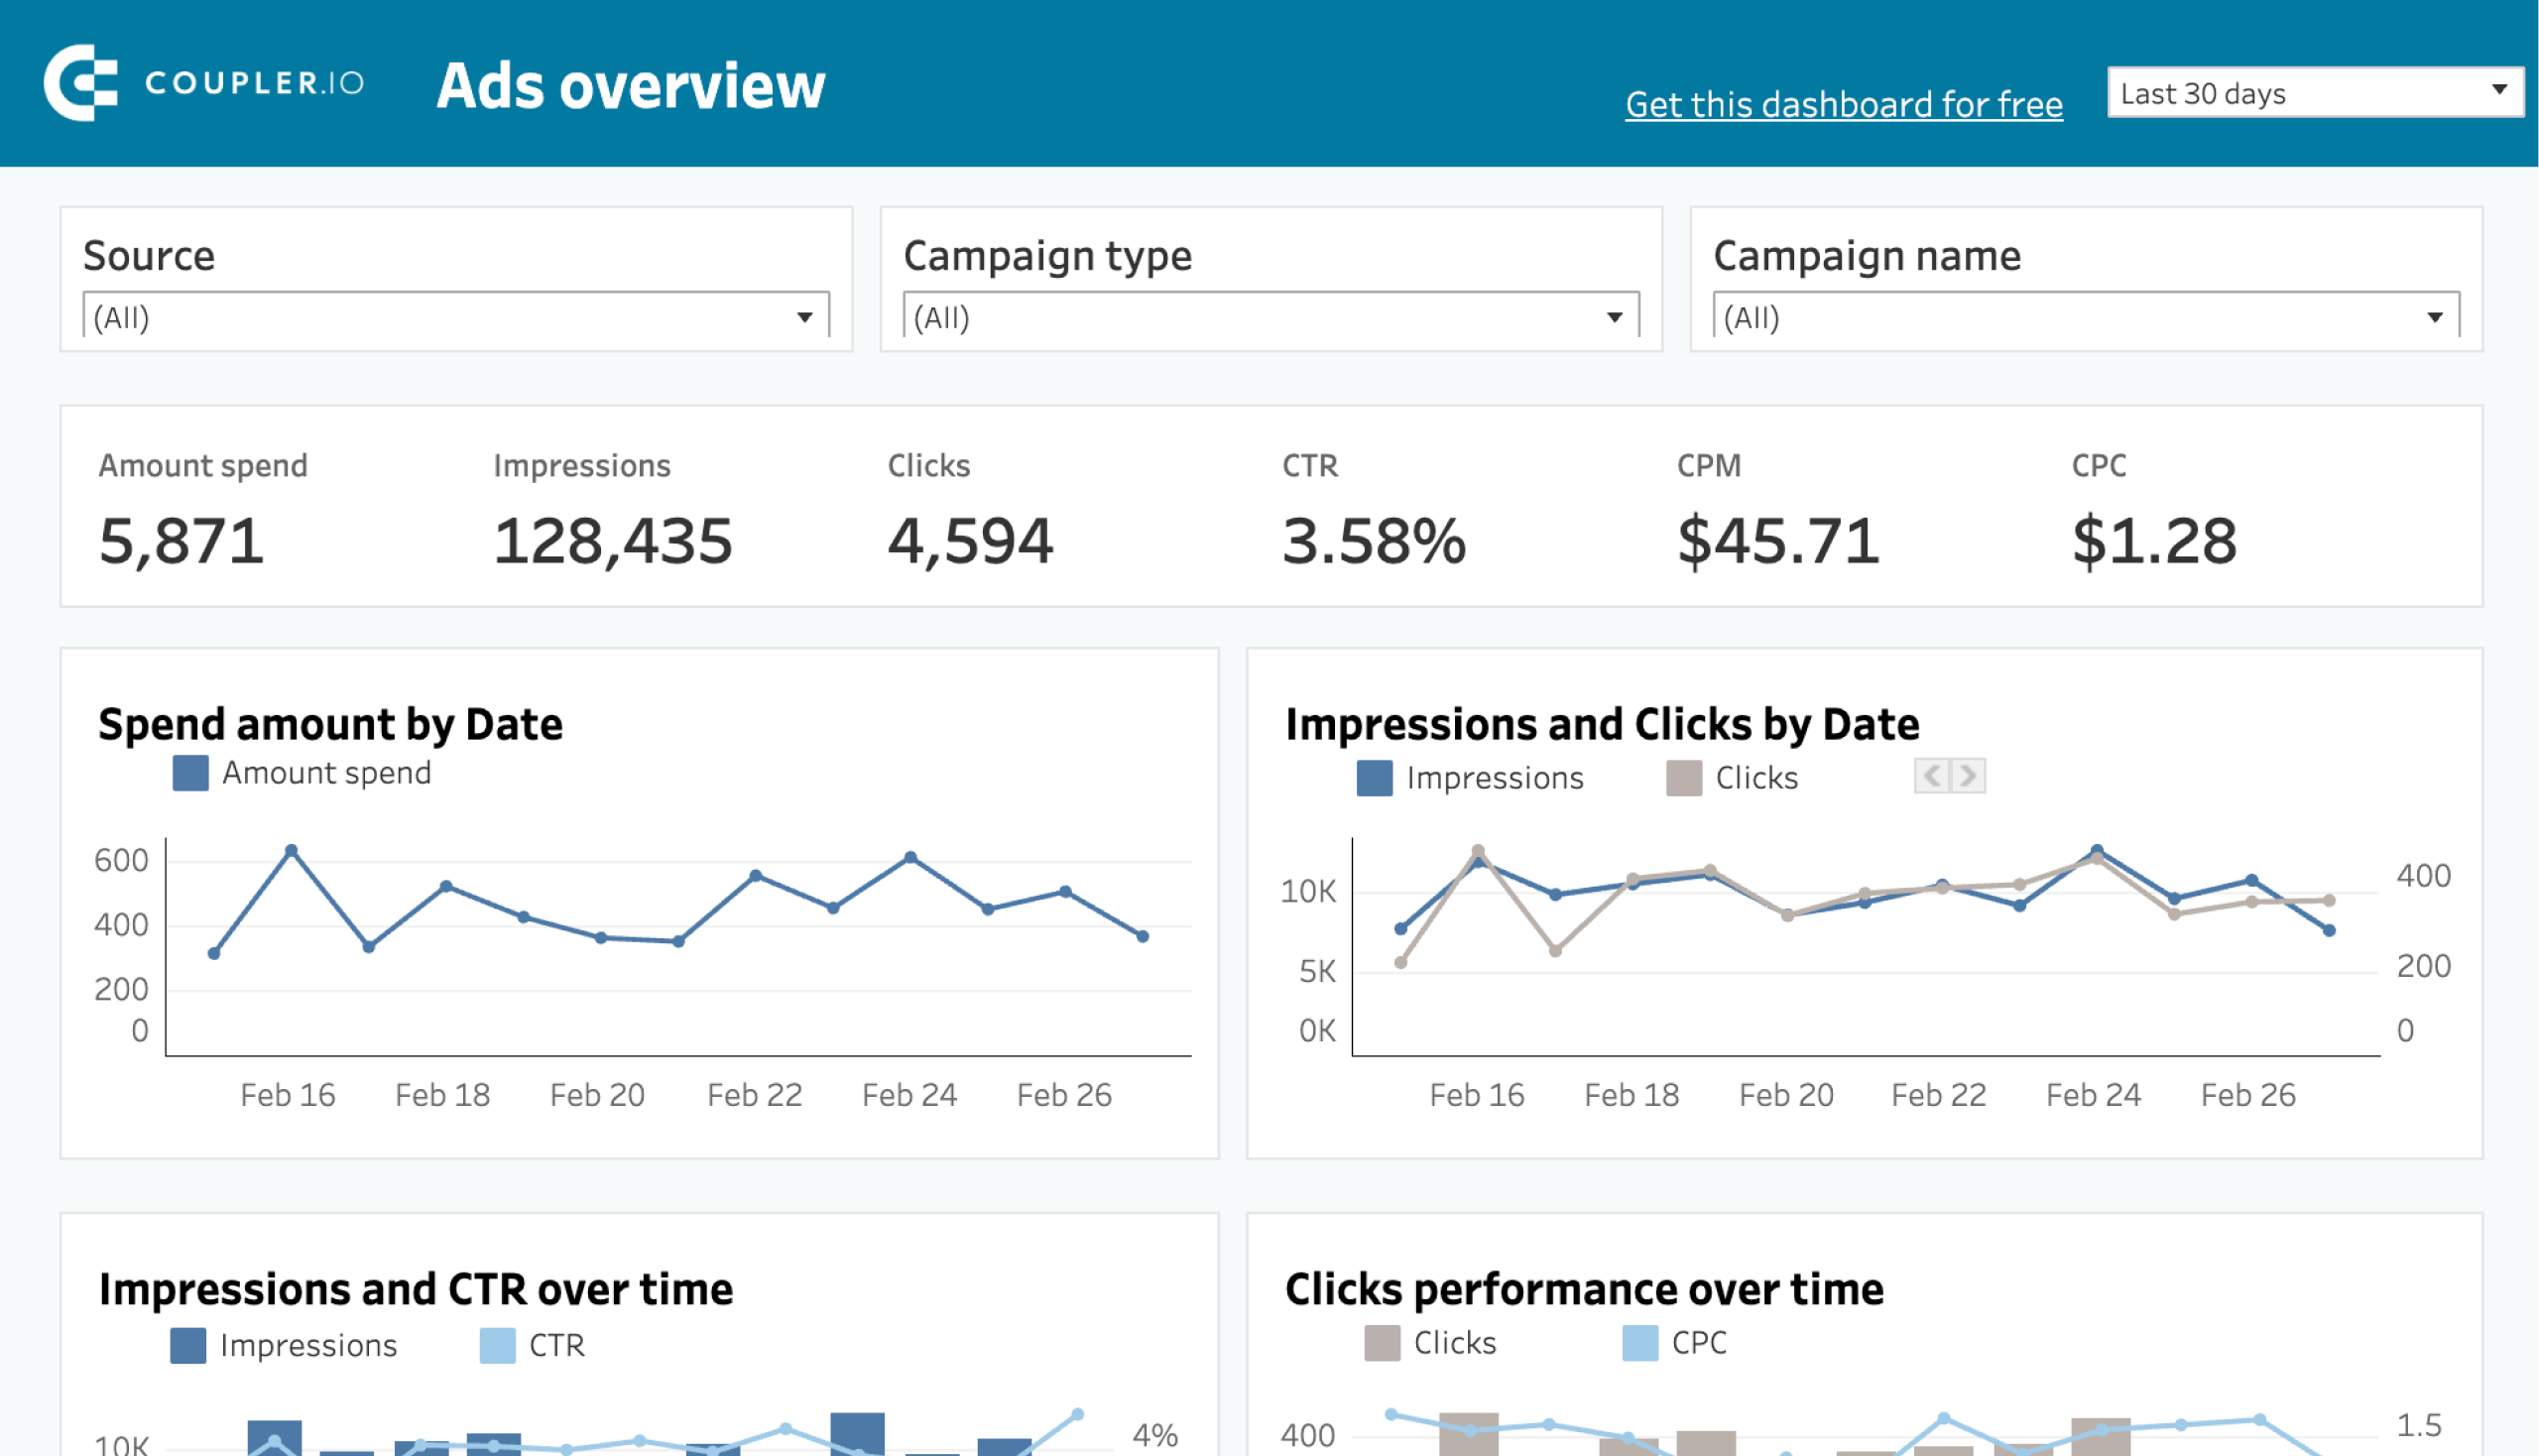
5. PPC dashboard for LinkedIn Ads + 7 other ad platforms
Here’s another useful template that lets you track the most important LinkedIn Ads metrics and explore ad performance trends – LinkedIn Ads Dashboard with cross-channel connectivity. The unique feature of this dashboard is that it can be integrated with several other ad apps, allowing for cross-channel analysis.
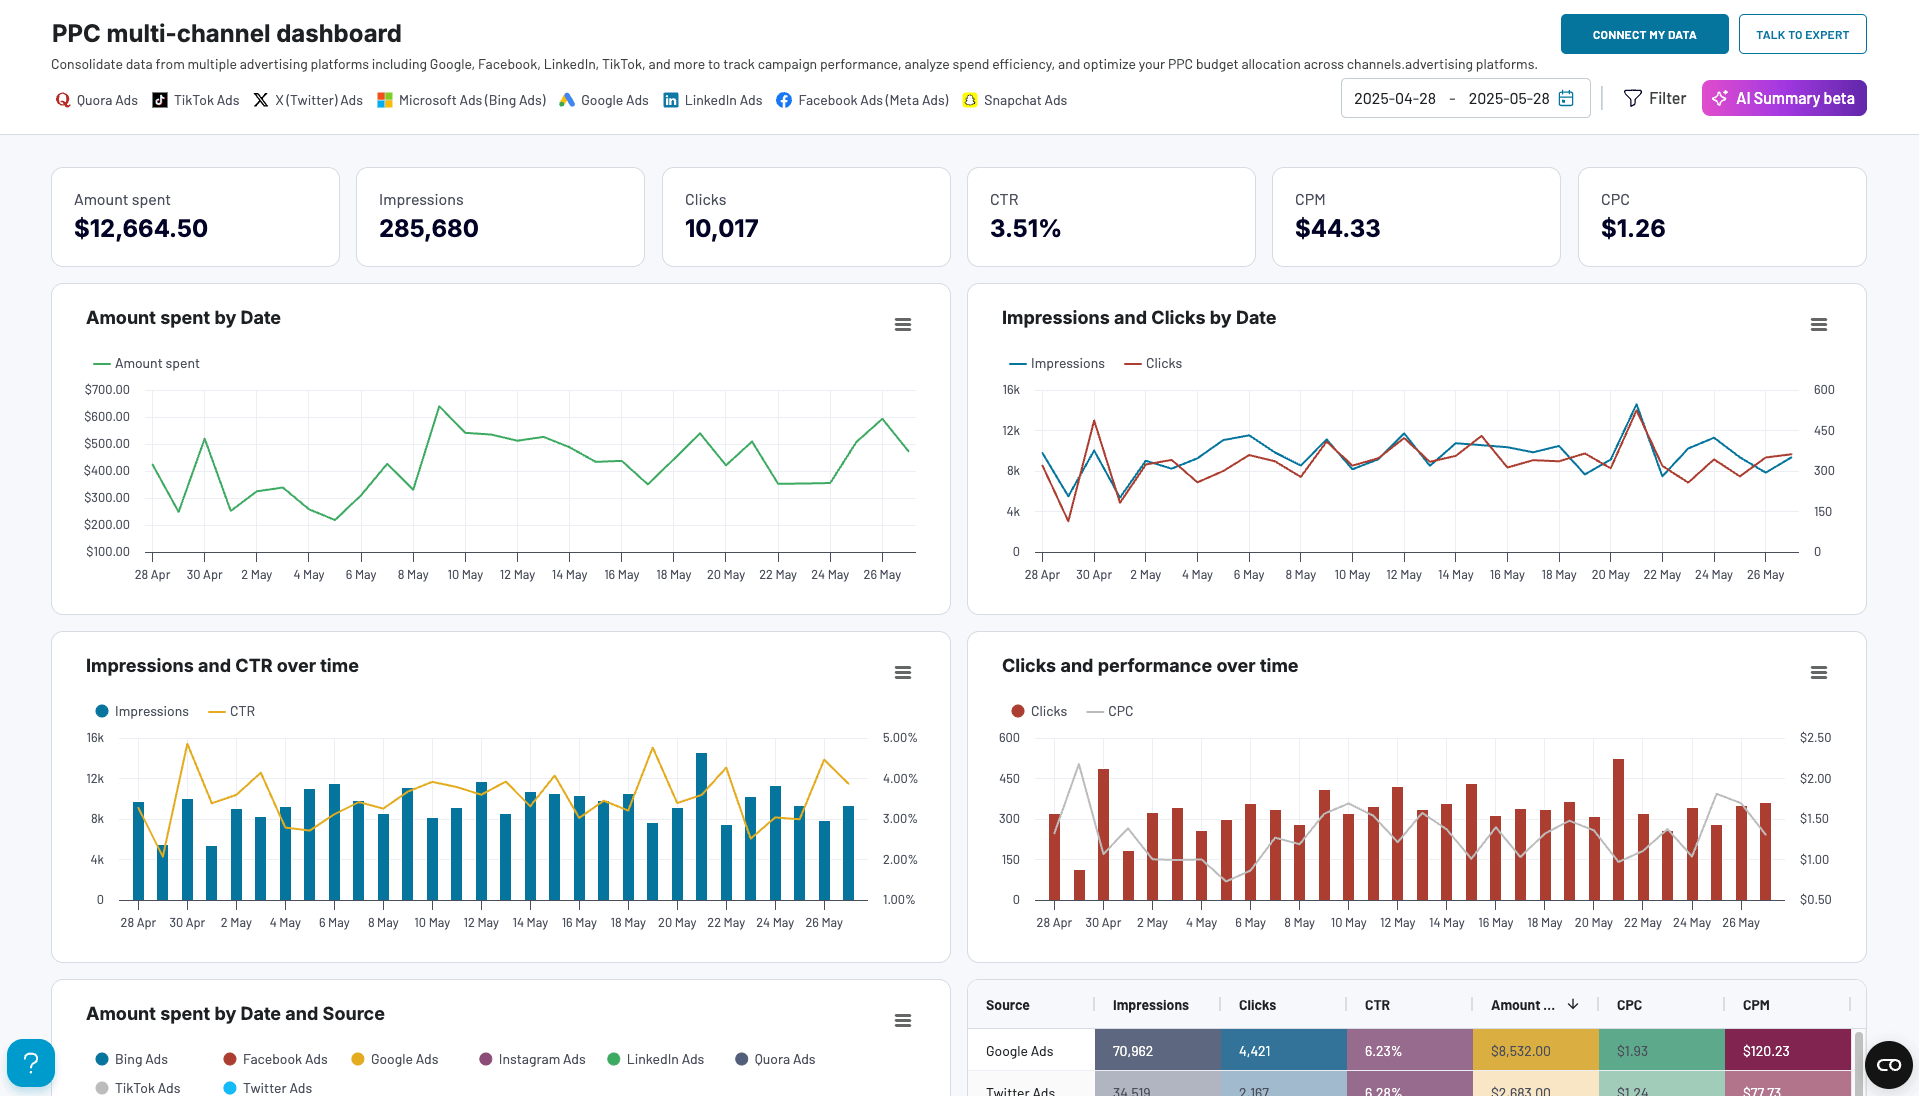
You can zoom into a campaign’s performance across different PPC platforms and see which of them produces the best results. These insights can be used to adjust your PPC strategy and redistribute your ad budget to maximize conversions.
Apart from LinkedIn Ads, the template supports: Facebook Ads, Google Ads, Instagram Ads, TikTok Ads, Twitter Ads, Quora Ads, and Bing Ads. Connectivity to more platforms can be added in the future. However, you don’t have to link all the available ad apps. The template can also be utilized with LinkedIn Ads as the sole platform.
Dashboard metrics:
- Clicks
- Clicks by source
- CPC
- CPC by source
- Amount spent
- CTR
- CPM
- Other performance metrics
How to set up:
Select the dashboard version from the widget below. This dashboard is available in Coupler.io and as a template for Google Sheets, Looker Studio, PowerBI, and Tableau. Navigate to the Readme / Setup guide tab and follow the instructions to connect your LinkedIn Ads account to the template.


6. Monthly ad budget overview for LinkedIn Ads + 7 other ad platforms
Our next dashboard is one of the top choices for marketers as it allows you to manage your PPC budget across different platforms, including LinkedIn Ads. It’s very helpful, especially if you are an ad professional who works with dozens of projects and you have agreed on specific budgeting with your client. In this case, controlling all these expenses can be challenging but this Monthly Ad Budget Dashboard makes it simpler thanks to automation.
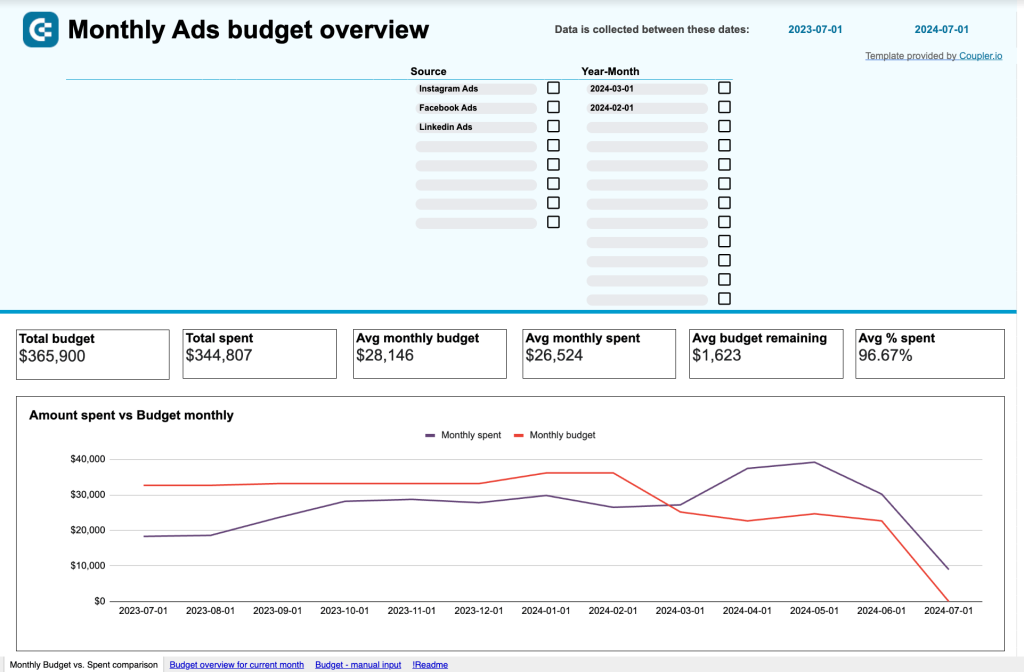
First of all, it automatically collects all expenses from all your ad apps, and the data in your report is refreshed on a schedule. This means you won’t have to waste time switching between ad accounts and manually copying and pasting the latest data.
Secondly, you only need to enter your planned budget numbers. The dashboard will alert you if one of the channels is using up the planned amount too fast, allowing you to take action and prevent overspending. Moreover, the dashboard gives you projections of further expenses based on the current budget usage pace. All this is useful for ad spend management and budget optimization.
Dashboard metrics:
- Total budget
- Total spend
- Predicted spend
- Avg monthly budget
- Avg budget remaining
- Avg daily spend
How to set up:
Navigate to the Readme tab for detailed setup instructions. Install the Coupler.io add-on (it’s just a couple of clicks). Then, connect LinkedIn Ads and other platforms, if needed.
Clear the sample data and input your planned budget amounts on the Manual input tab. After this, your budget overview will be prepared automatically.
How to automate LinkedIn Ads reporting in a user-friendly way with Coupler.io
If you want to create a custom dashboard or report from scratch, it’s better to make it automated as well. Even if you’ve never automated anything, you can easily achieve this with Coupler.io. You won’t need any special knowledge for this, and the whole process takes just a few minutes. Coupler.io transfers your dataset and keeps updating your report on a schedule. Let’s go through this step-by-step.
1. Extract data
In the widget below, choose where you want to send your data. Depending on your goals, it can be a spreadsheet app, BI tool, warehouse, or another destination. Then, click Proceed.
You will need to create a Coupler.io account – it’s free, no credit card required.
Then, follow the onscreen instructions to connect your LinkedIn account. Select report type – for example, Ad analytics, Campaign groups, Video Ads, or Ad Creatives. Then, specify the date range, metrics, and dimensions for your ad dataset.
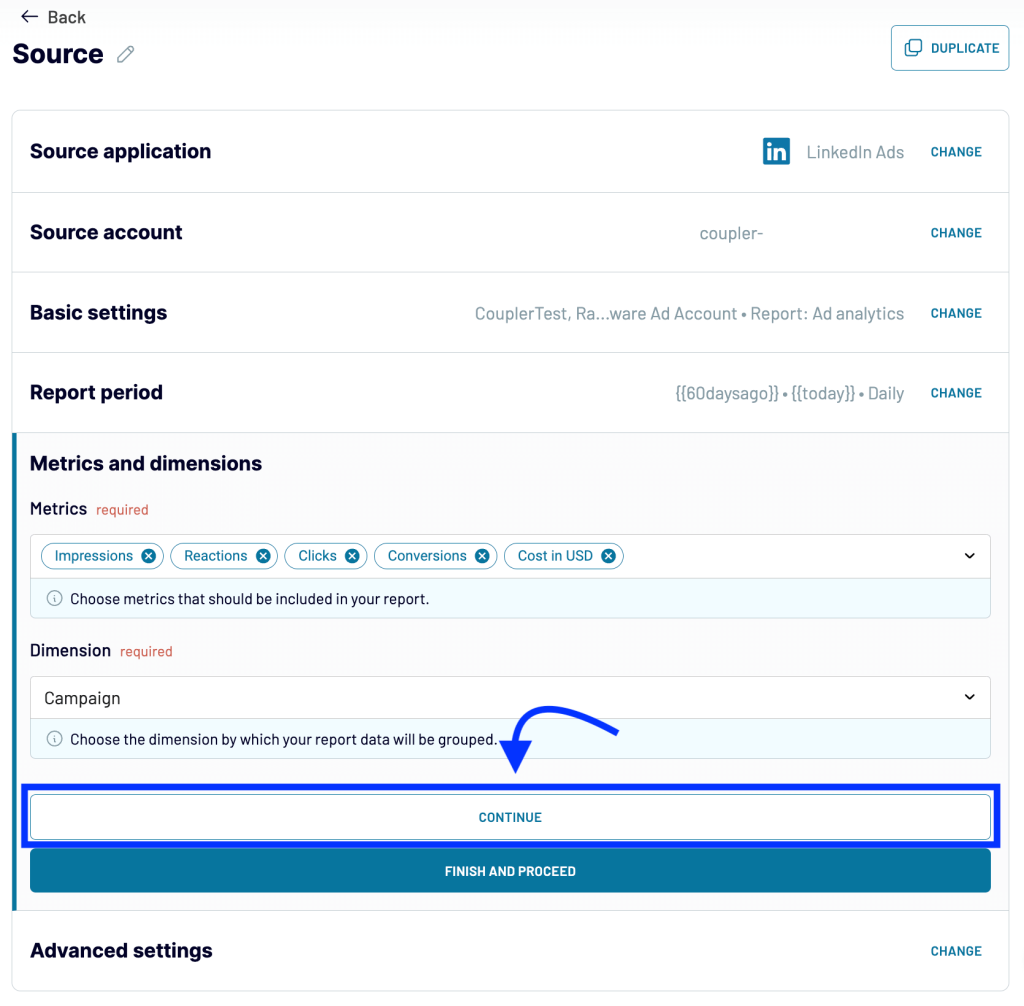
You can also add more data sources to create a multi-channel or cross-channel report. Check out our digital advertising guide to learn more about other ad types and best practices.
2. Transform data
In the next step, you can review your data and make different transformations. This can be helpful, especially when creating a report in a BI tool. Even though tools like Looker Studio offer the capability to modify data within the tool, performing these transformations there can cause your report to run slower so it’s better to prepare the dataset before loading it.
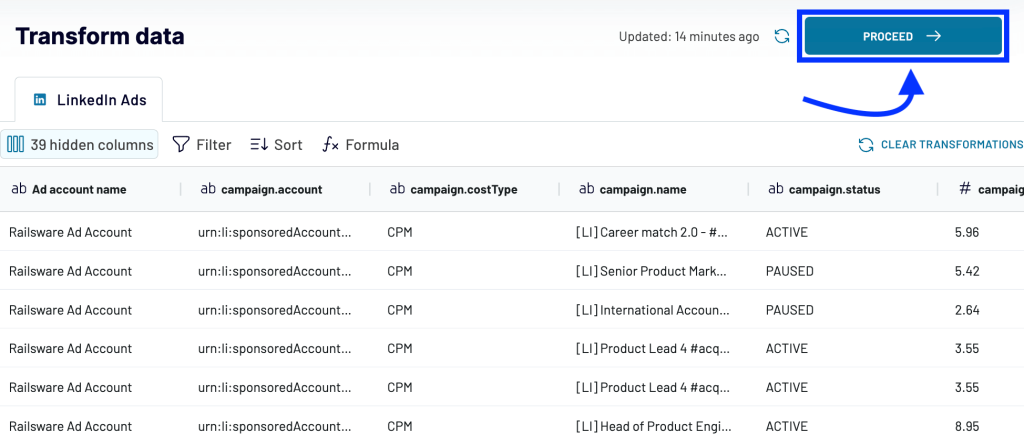
Available transformations:
- Add, rearrange, and rename columns
- Hide the columns you don’t need
- Use formulas and perform calculations
- Sort and filter data
- Blend data from several accounts or apps
The latter is helpful if you want to create a cross-channel PPC report. You can connect several ad platforms and merge performance data into a single dataset.
Coupler.io supports all popular ad sources – Google Ads, Twitter Ads, Facebook Ads, TikTok Ads, and more.
3. Load data and schedule updates
Next, follow the wizard’s instructions to connect your destination account. After that, you can set your preferences for automatic updates. Coupler.io can refresh your LinkedIn Ads report in the destination app at specific intervals. You can choose to have the report refreshed once a month, once a week, daily, hourly, or every 15 minutes. This provides you with the most current information in near-real-time and ready for analysis.
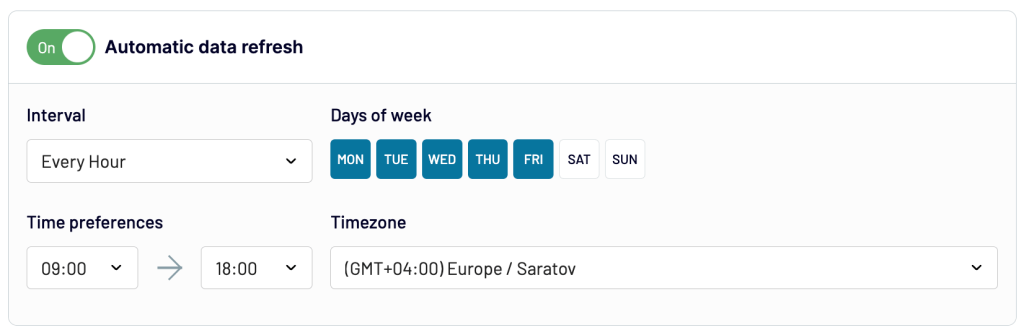
Save and run the importer. That’s it! The data for your performance report is ready.
How to set up LinkedIn Ads reporting via the API
In the previous section, we explained how to automate LinkedIn Ads reporting in just a few minutes without coding or any technical knowledge. However, if you want to build a custom social media reporting solution, you can do this via the LinkedIn Advertising API.
This method may require a significant amount of time and technical expertise. Firstly, you will need to create scripts to retrieve the required data from LinkedIn Ads. The next step involves writing scripts to load this data into your preferred destination application. However, before you begin coding, there are some preliminary steps to complete: creating an app, obtaining access to the LinkedIn Advertising API, and receiving an access token. Let’s take a closer look at this.
Step 1. Get access to the Advertising API
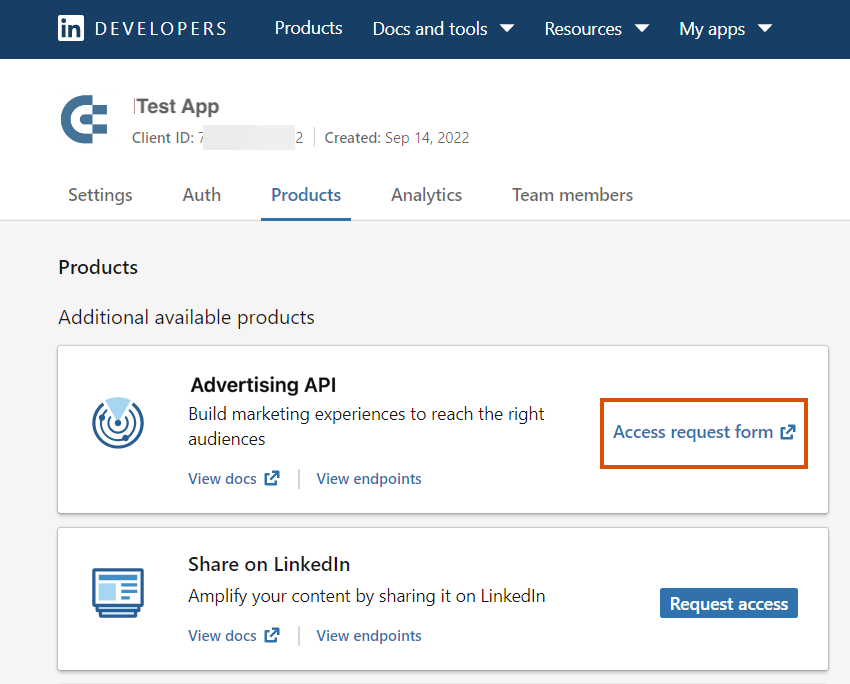
First, create an app on the LinkedIn Developer portal. Then, navigate to My Apps –> select your app -> Products. Request access to the Advertising API.
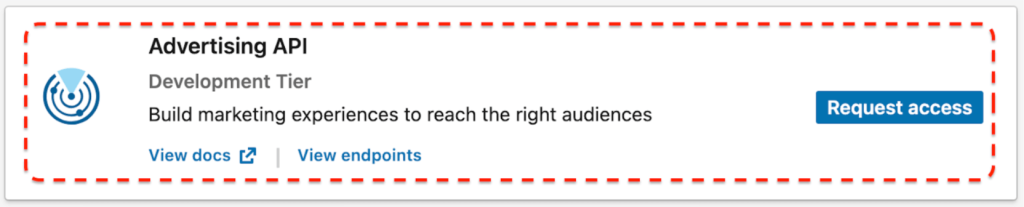
Wait till the Access request form link appears. Then, click it and fill out the application form.
LinkedIn will review your application and grant you access if you meet their criteria. They include having an established use case that doesn’t fall under the restricted or unapproved category.
Once you get access to the Advertising API, it will be shown on your app’s Product tab in the Added products section.
Step 2. Generate an access token
In the next step, you will need to obtain an access token. Please keep in mind that this should only be done after the previous step is completed and you are granted access to the Advertising API.
You can do this in different ways, which are well described in the official documentation:
- Option 1 – using LinkedIn Developer Portal Token Generator
- Option 2 – using LinkedIn’s public Postman workspaces
Let’s go through the main steps of the first option. Open the LinkedIn Developer Portal Token Generator tool and select your app from the dropdown.
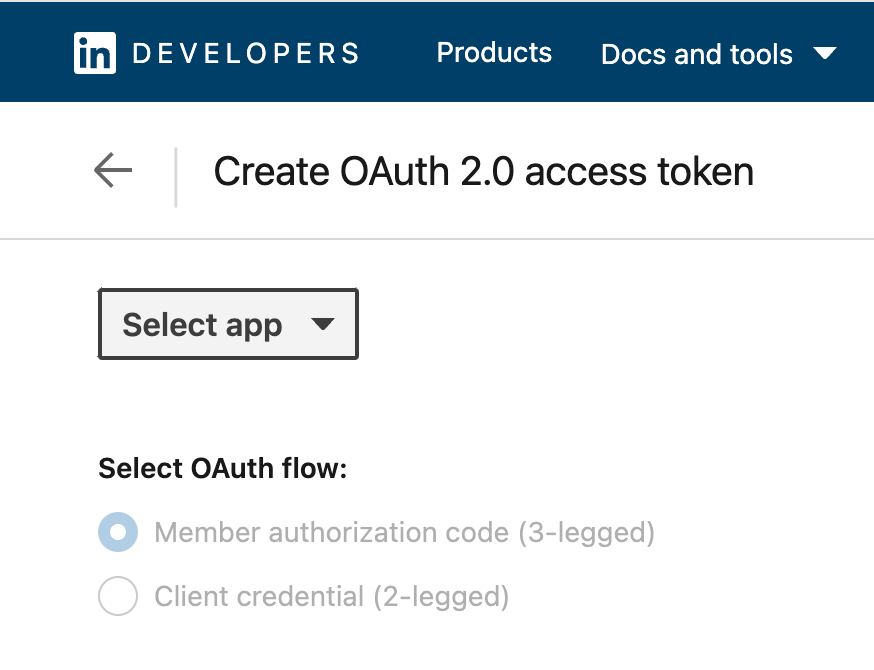
Select OAuth flow and scopes:
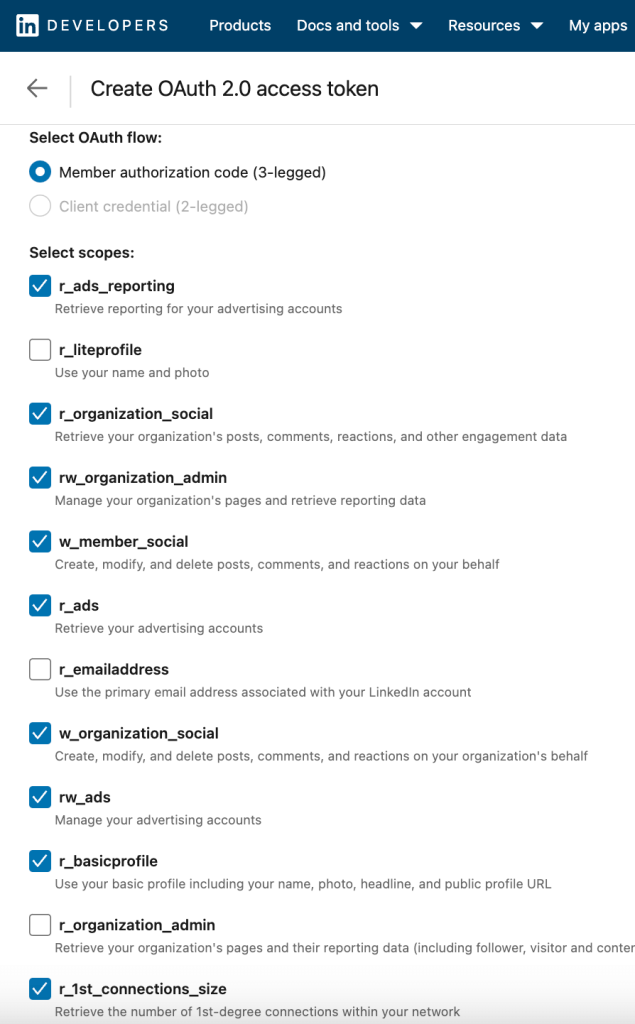
Approve the access request from your app:
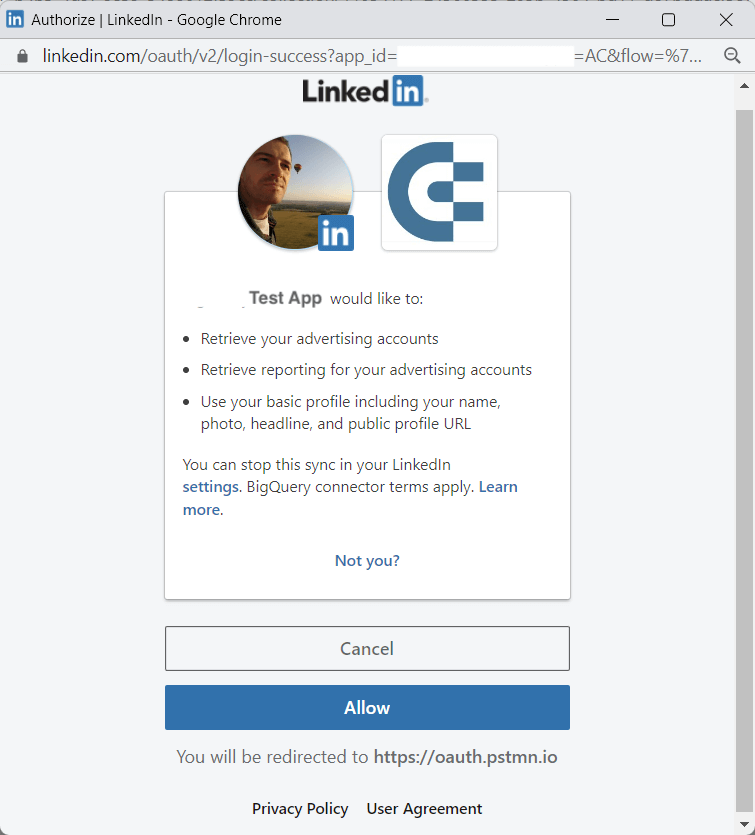
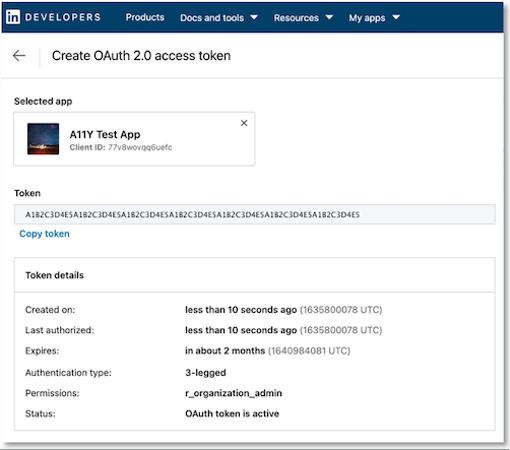
Once you have allowed access, return to the Developer Token Generator. The token and token details should appear on the Create OAuth 2.0 access token tab. Copy your token and paste it into your application code.
Step 3. Extract data via the LinkedIn API
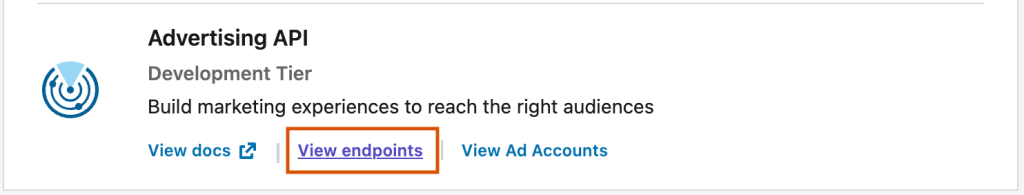
Once you get the access token, you can send requests to the LinkedIn API to export the data you need. This requires specifying endpoints for different data types. Navigate to your app -> Product tab, and click View endpoints under the Advertising API block.
Here, you will find information about different endpoints:
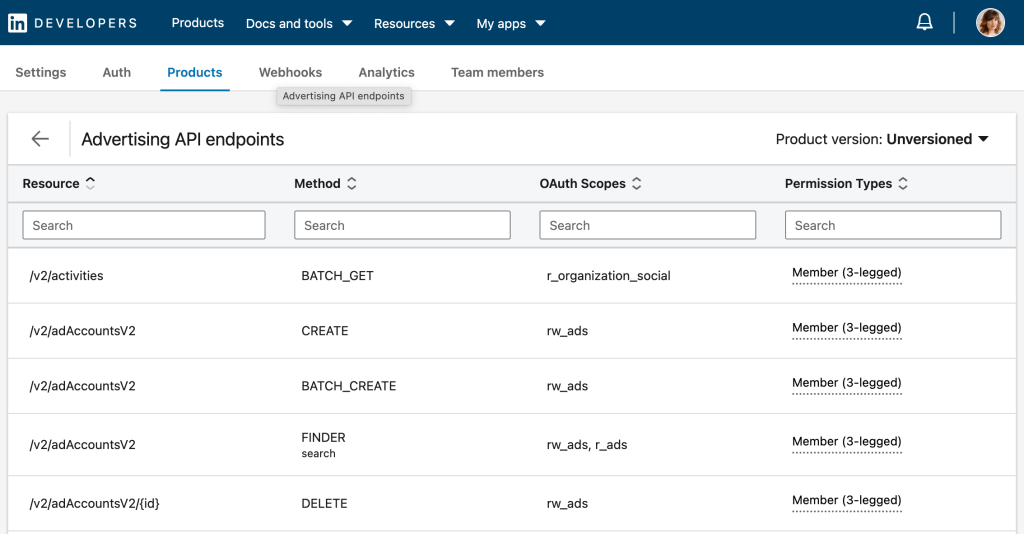
You can now retrieve the necessary information and send it to the destination app you selected.
For more information on working with the LinkedIn Ads API, check the Official Documentation Guide.
Bonus: How to export LinkedIn Ads data manually
Manual data extraction doesn’t let you automate LinkedIn Ads reporting. However, it may be useful for one-time reports or if you don’t need to refresh your metrics often.
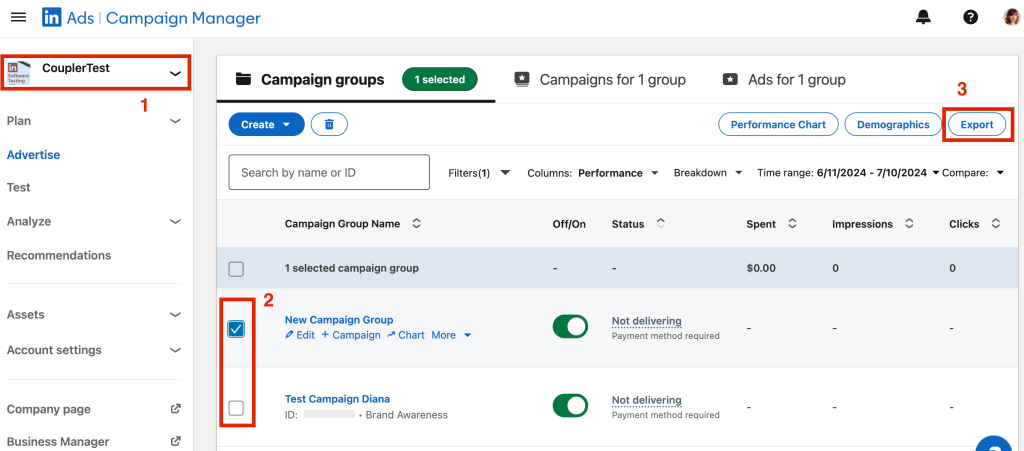
To download your ad data, go to the Campaign Manager. Select the ad account and specify the date range (1). Then, tick the campaigns you are interested in (2). In the upper right corner, press Export (3). If you want to extract data on the account level, skip the second step: you will only need to select your ad account, specify the date range, and click Export.
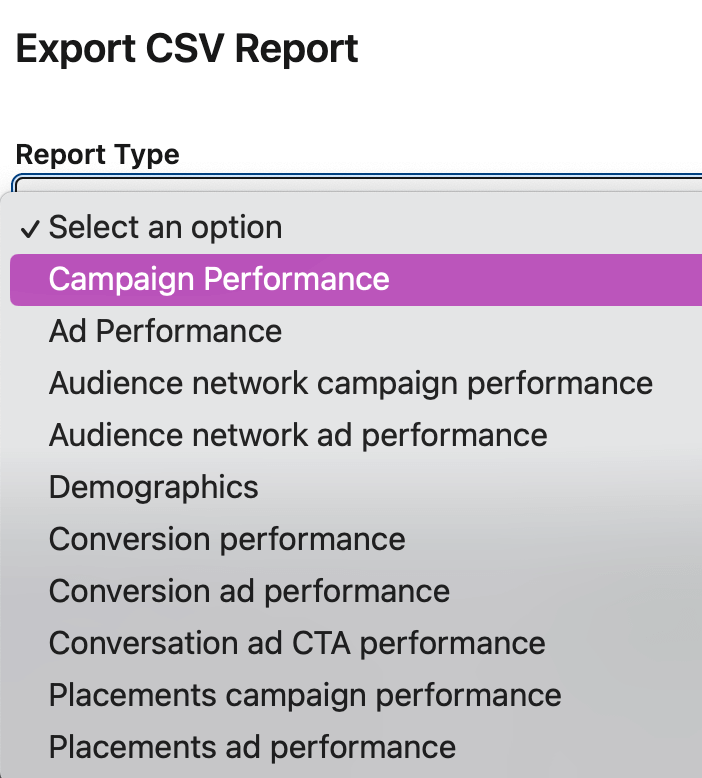
Then, select report type – for example, Demographics, Conversion performance, or LinkedIn Audience network ad performance. After this, the CSV file with your data will be downloaded automatically.
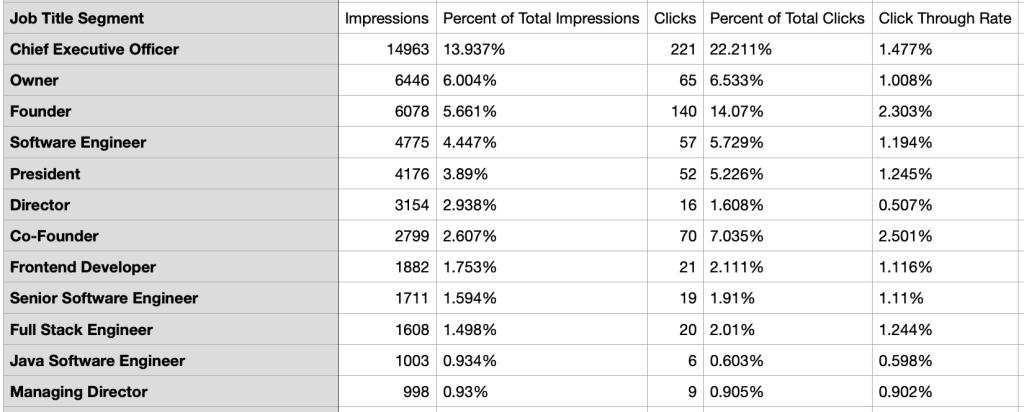
For example, here we exported demographic data and opened it in column view. The dataset contains information about the target audience. The metrics are organized by country, company segment, job title, and job function segment.
CSV is a widely supported file format that can be imported into most applications of your choice.
As demonstrated, extracting data through LinkedIn Ads Campaign Manager is quite straightforward. However, for continuous analysis, it is advisable to explore automation options.
Automating LinkedIn Ads reporting can be simple
To sum it up, automation works by calling the LinkedIn Advertising API to retrieve data and then running another script to load data into your destination app.
If you have tech knowledge and are comfortable working with scripts, you can do this yourself. If not, you should use a tool where this job is already done by someone else. Coupler.io gives you access to ready-made integrations in a simple user-friendly interface. The platform connects LinkedIn Ads to a range of BI tools, spreadsheet apps, and data warehouses. It also offers free automated templates that enable you to build live dashboards in minutes and streamline LinkedIn Ads analytics. We recommend you try them out and see how they help you make data-based decisions.
Good luck with your LinkedIn Ads reports!

Automate LinkedIn Ads reporting with Coupler.io
Get started for free