LinkedIn serves as a global hub for leads for over 58 million businesses seeking to establish authority in their respective industries. While LinkedIn Ads Manager offers basic reporting to get you started, its native insights often feel too limiting. Hence, to truly use your data for strategic decision-making, a more powerful tool is needed, such as Power BI.
97% of Fortune 500 companies currently use Power BI. And you can also benefit from it to transform LinkedIn Ads data into detailed, actionable insights that enhance both short- and long-term decision-making.
So, let’s explore the best available options for you to optimize your business processes through automation.
Comparing ways to load data from LinkedIn Ads to Power BI: Find your best fit
Power BI’s native connectors don’t support LinkedIn ads as a data source. As a result, you will need to explore other methods to connect and load your LinkedIn Ads data into Power BI. Here are the three main options available
| Method | Description | Ease of Use | Automation | Customization |
| Coupler.io | A reporting automation and analytics platform to turn data into insightful reports. It automates data transfer to Power BI on a set schedule. | Very Easy | Scheduled refresh | High: – Data transformation – Data aggregation – Support for 60+ app sources and 10+ destinations |
| Manual CSV export & Power BI import | Manually export LinkedIn Ads data as CSV, then import into Power BI, for those preferring a hands-on approach. | Easy | None (Manual updates required) | Moderate: – Custom data selection during export – Manage data pipeline manually |
| Custom data integration via API | For advanced users, APIs allow custom data imports from LinkedIn Ads to Power BI. This method offers flexibility in choosing specific metrics, data fields, and refresh intervals. | Complex | Triggered or scheduled | High: -Fully customizable to business needs |
Connect LinkedIn Ads to Power BI using Coupler.io: Adopting automation
If you’re a business seeking to automate your data export processes, Coupler.io offers the simplest way to do so. To make it even easier, we have prepared the form below where we’ve already preselected LinkedIn Ads as a source and Microsoft Power BI as a destination. Simply click Proceed to get the ball rolling!

To automatically connect LinkedIn Ads to Power BI using Coupler.io, follow these three simple steps:
Step 1: Extract data from LinkedIn Ads
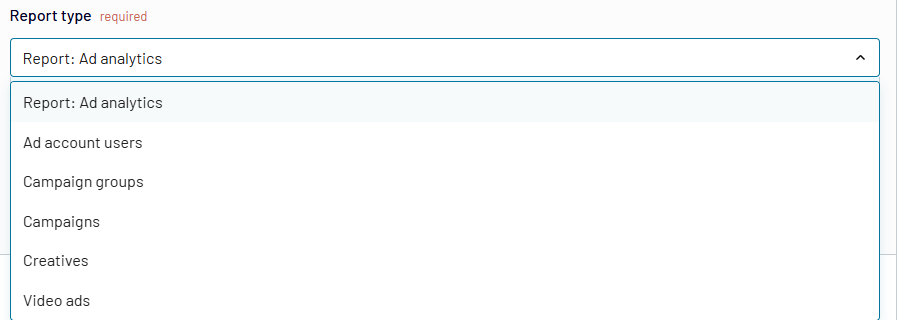
First of all, you will authenticate your LinkedIn Ads account in Coupler.io. Now, select the respective ad account (s) and the type of report you want to export. This includes Ad analytics, Ad account users, campaign groups, campaigns, creatives, video ads, and so forth.

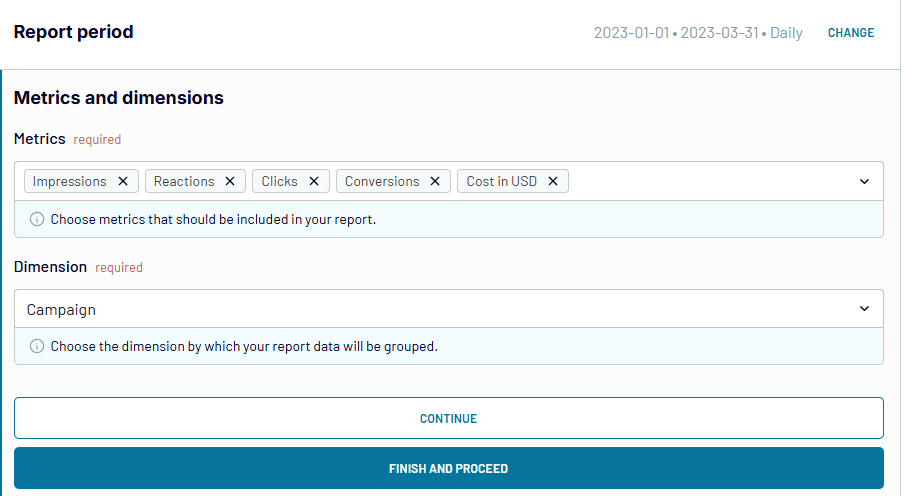
Next up, you will set the report period which is set to two months by default. Select the relevant metrics you need, including clicks, impressions, conversions, etc. You can also customize dimensions if needed.

Step 2: Transform data
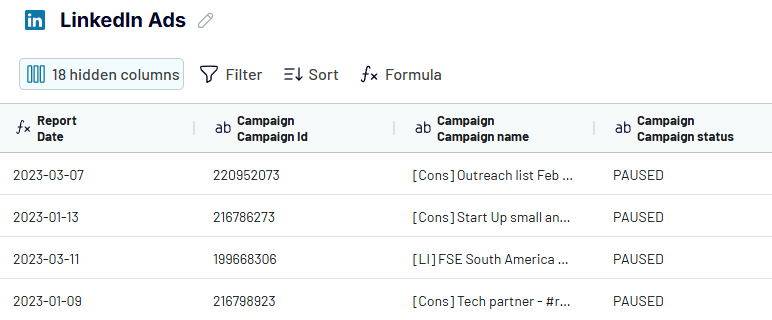
Coupler.io allows you to preview the imported data and apply relevant transformations before initiating the export to Power BI. These include filtering, sorting, applying formulas, removing columns, and adding custom columns per your needs.

Step 3: Load data to Power BI and schedule refresh
Follow the instructions to load data from LinkedIn Ads to Power BI. You need to generate an integration URL and copy it.

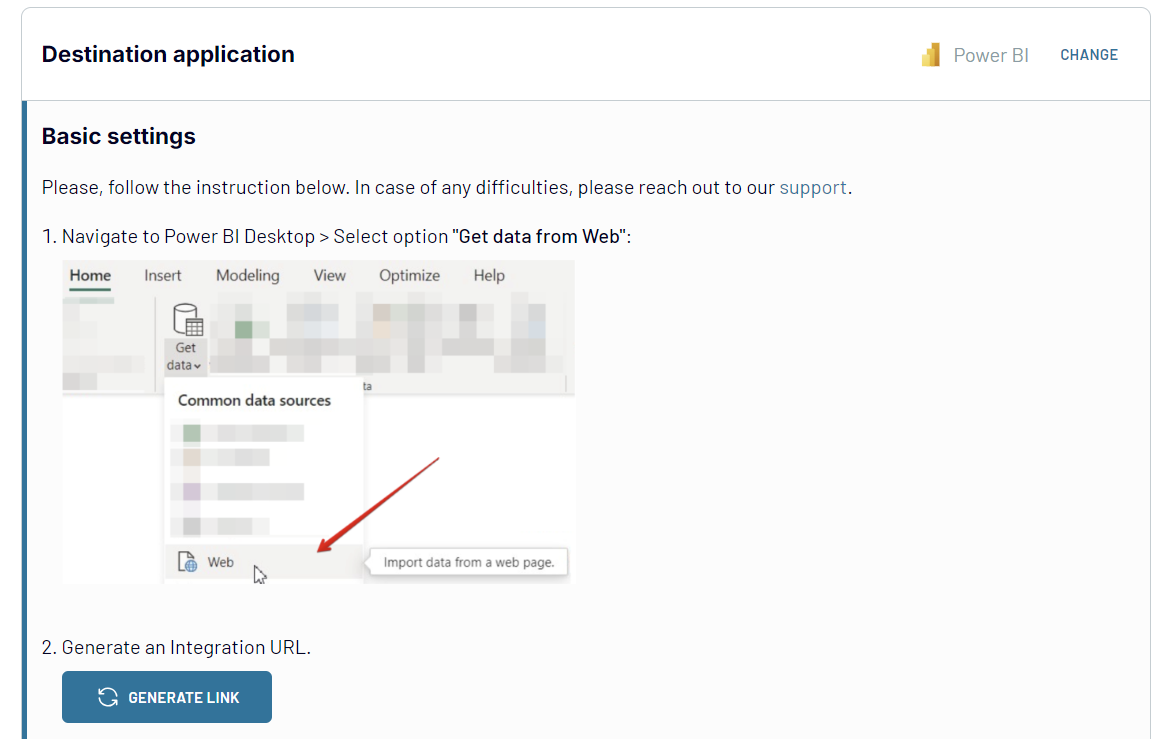
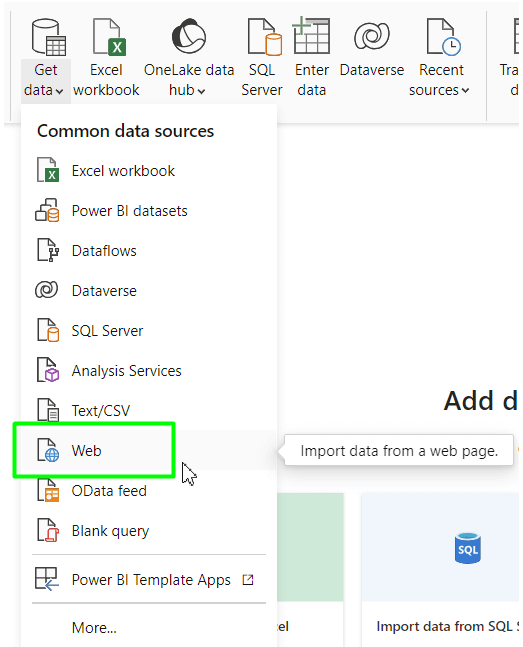
Then open up Power BI (desktop) and select Web from the Get data tab.

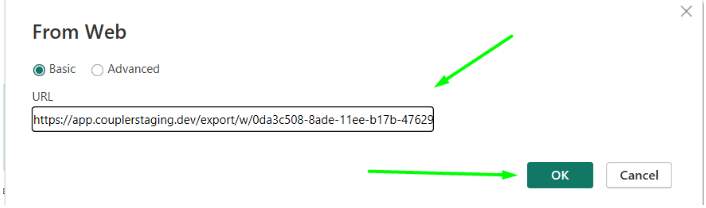
Insert the integration URL and click OK.

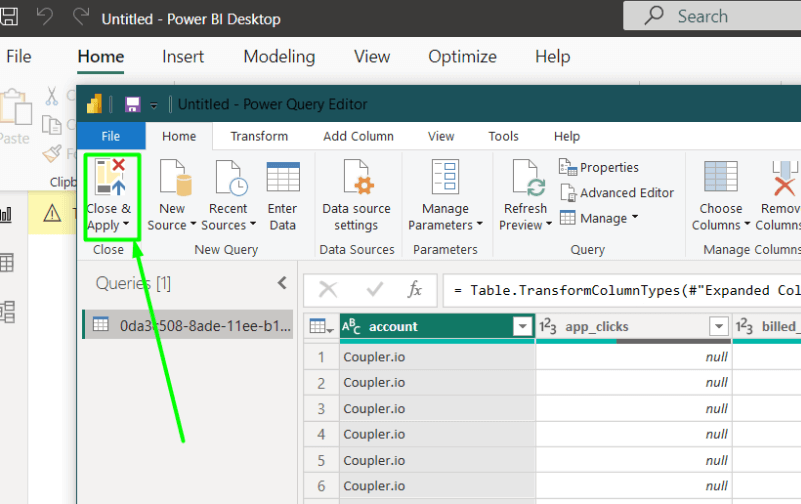
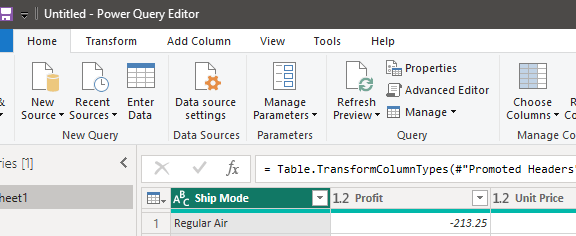
Now, your data will be imported into Power Query Editor where you can review it and apply additional transformations if needed. Then click Close & Apply to load the dataset to Power BI.

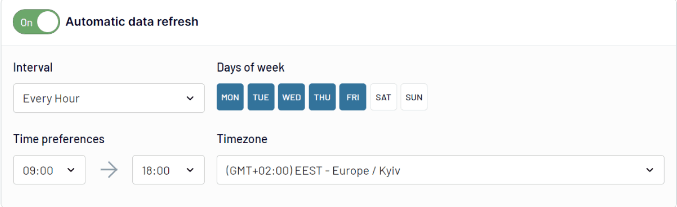
With Coupler.io, you can always configure automatic data refreshes according to your preferred schedule. For this, go back to your Power BI connector and enable the Automatic data refresh. Your LinkedIn Ads data will be connected and regularly updated in Power BI, so your reports are always up-to-date with the latest metrics.

That’s all you need to connect LinkedIn Ads to Power BI to get the best automation for your business.
Manually connect LinkedIn Ads to Power BI: CSV Export & Power BI Import
If you want to pull LinkedIn Ads data into Power BI for a one-time analysis, you could opt for a free and simple manual method. This works well for getting a snapshot of your campaign data. However, if you need to automate your reporting process, this method may not be a good option. Let’s examine what it looks like.
Log in to your LinkedIn Ads account and head over to the Ads Manager. Select the ad account and campaign data you want to export.
- Next, click on Advertise from the sidebar, which displays all your active campaigns.

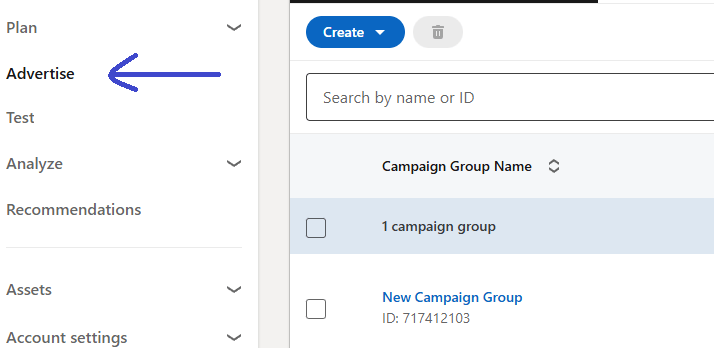
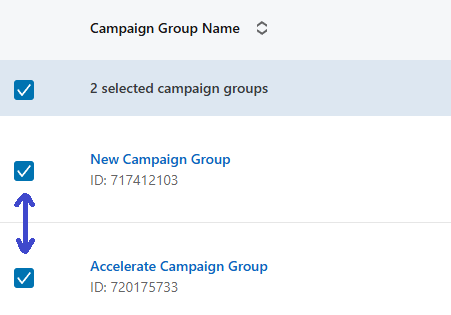
- Choose the campaigns or campaign groups you’d like to export by checking the boxes beside them.

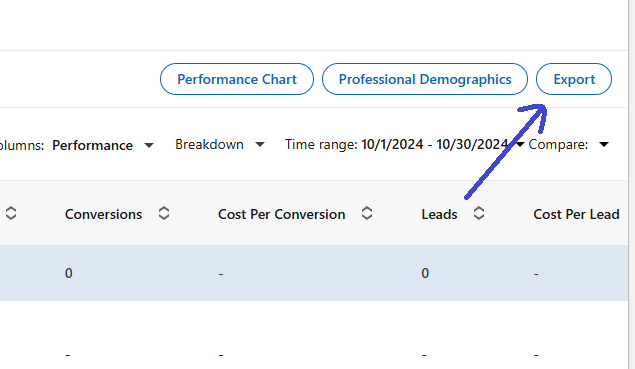
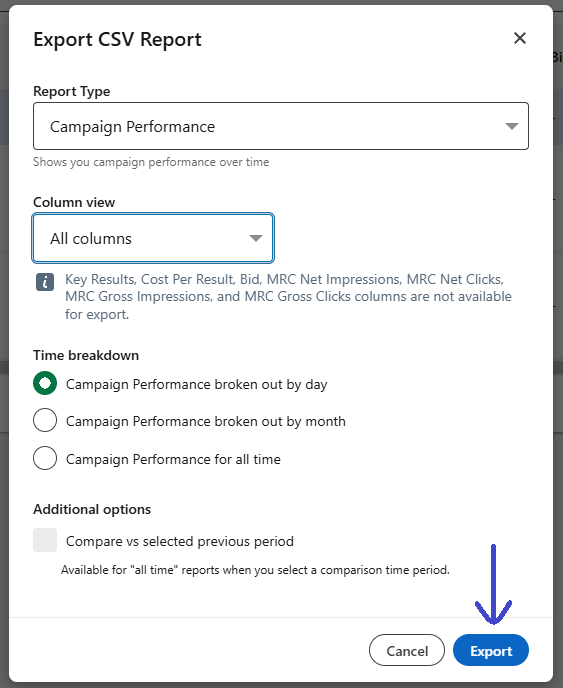
- On the top-right of the page, click Export.

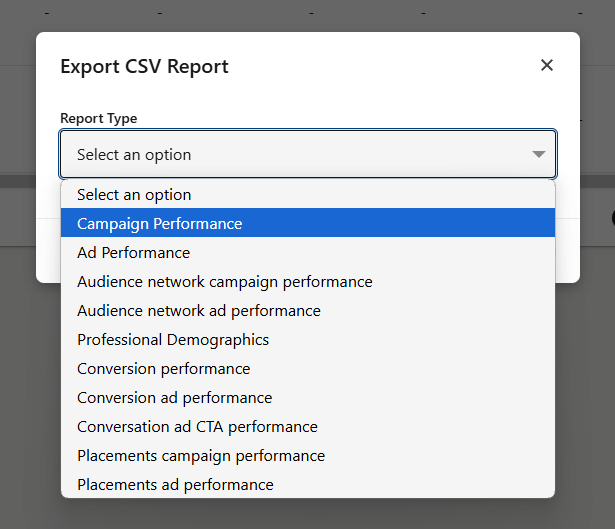
- Select the type of report you want, such as Campaign Performance. Choose your desired report type and proceed.

- You can further customize your export by selecting specific metrics like impressions, clicks, and conversions.
- Adjust the date range or add grouping dimensions (e.g., daily or monthly performance) to tailor the report to your analysis needs.
- Once you’ve configured everything, click Export again, and your data will download as a CSV file, ready for use.

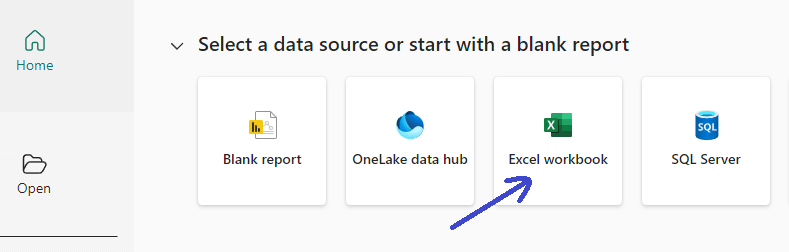
- Open Power BI, and select Excel workbook to import your CSV file.

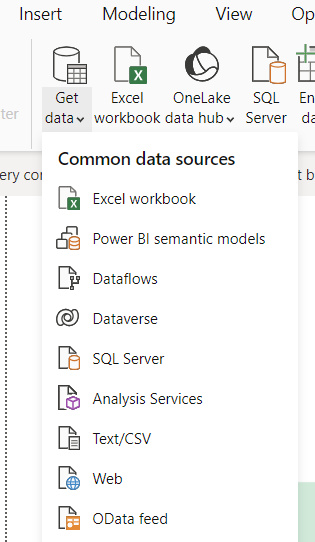
- Or go to Get data => Text/CSV.

- Click on Transform Data after selecting the relevant data sheets.

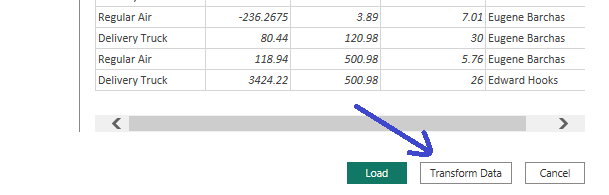
- Use Power BI’s Query Editor to clean, sort, and further customize the data as needed.

That’s it—your LinkedIn Ads data is now loaded into Power BI, ready for analysis. This manual approach gives you full control but requires periodic updates to keep your reports current.
Use LinkedIn’s API to load LinkedIn Ads data into Power BI
LinkedIn’s API lets you connect LinkedIn Ads data straight to Power BI. You get to pick which metrics you need, like impressions, clicks, or conversions. You’ll save this data as a JSON file online, which makes it easy for Power BI to access. Here’s how you can set it up:
- First, you need to join LinkedIn’s Marketing Developer Program to gain access to the API. Once LinkedIn approves you, they give you an access token. This token lets you safely pull in data from LinkedIn Ads. To get the access token, use this code in Python:
import requests

url = 'https://www.linkedin.com/oauth/v2/accessToken'
params = {
    'grant_type': 'client_credentials',
    'client_id': 'YOUR_CLIENT_ID',
    'client_secret': 'YOUR_CLIENT_SECRET'
}
response = requests.post(url, data=params)
access_token = response.json()['access_token']
- Now you’re connected. You can now pull specific campaign data. You decide which metrics you want and set dates or pick certain campaigns. Here’s an example of how to get campaign-level data and save it as a JSON file:
# Define the API Endpoint and Headers
ads_url = 'https://api.linkedin.com/v2/adAnalyticsV2?q=analytics&campaign=demo_campaign&dateRange.start.day=1&dateRange.start.month=10&dateRange.start.year=2024'
headers = {
    'Authorization': f'Bearer {access_token}',
    'Content-Type': 'application/json'
}

# Retrieve Data and Save as JSON
ads_response = requests.get(ads_url, headers=headers)
data = ads_response.json()

with open('linkedin_ads_data.json', 'w') as json_file:
    json.dump(data, json_file)
The JSON file, linkedin_ads_data.json, now has all your LinkedIn Ads data.
- Next, you’ll host it online so Power BI can access it.
- To connect Power BI to your LinkedIn Ads data, you need to put this JSON file online using a web server or cloud storage that gives a public link. Try services like AWS S3, Google Cloud Storage, or Dropbox.
- To keep the data updated, you can either overwrite the existing file or create a new file each time.
- To overwrite the existing file, set up your Python script to overwrite the same JSON file each time it pulls new data. The file name and location stay the same. Only the content updates with the latest LinkedIn Ads data.
- Host this file online, and Power BI will refresh from it. This keeps your reports current without creating extra files.
- You can also save a new JSON file each time the script runs. However, this method is not as productive since it requires you to manually update Power BI’s data source link to the latest file each time.
- Either way, once you upload the file to a public folder or bucket, make sure you get a shareable link.
- Copy the URL of your JSON file. Power BI will use this link to connect to your data.
- With the link ready, go to Get Data > Web in Power BI. Enter the URL.
Power Query will load the JSON data, so you can build live reports with automatic updates.
When you host the JSON online, Power BI can refresh the data on a set schedule. This way, you always have the latest LinkedIn Ads data in your reports without needing to do manual updates.
Easy-to-use report templates for LinkedIn Ads
Power BI is a key tool for transforming data from LinkedIn ads into actionable insights. However, creating reports and dashboards to analyze your PPC performance can be very time-consuming. If you’re in a pickle and need quick access to your data, you can rely on Coupler.io’s dashboards. These are white-label templates to track your LinkedIn Ads campaign performance in Power BI and other data visualization tools with almost no setup. You get all your key insights in one place, ready to help you make smarter decisions, fast.
PPC dashboard template for multi-channel ad campaigns
Managing ads across different platforms can be quite challenging. To simplify the process, you can utilize the free PPC dashboard template for Power BI by Coupler.io. This template gives you a holistic view of all your campaigns in one place, eliminating the need to change tabs over and over. It seamlessly connects with Google Ads, Facebook Ads, LinkedIn Ads, and TikTok Ads, allowing you to compare the marketing data from these data sources side-by-side.

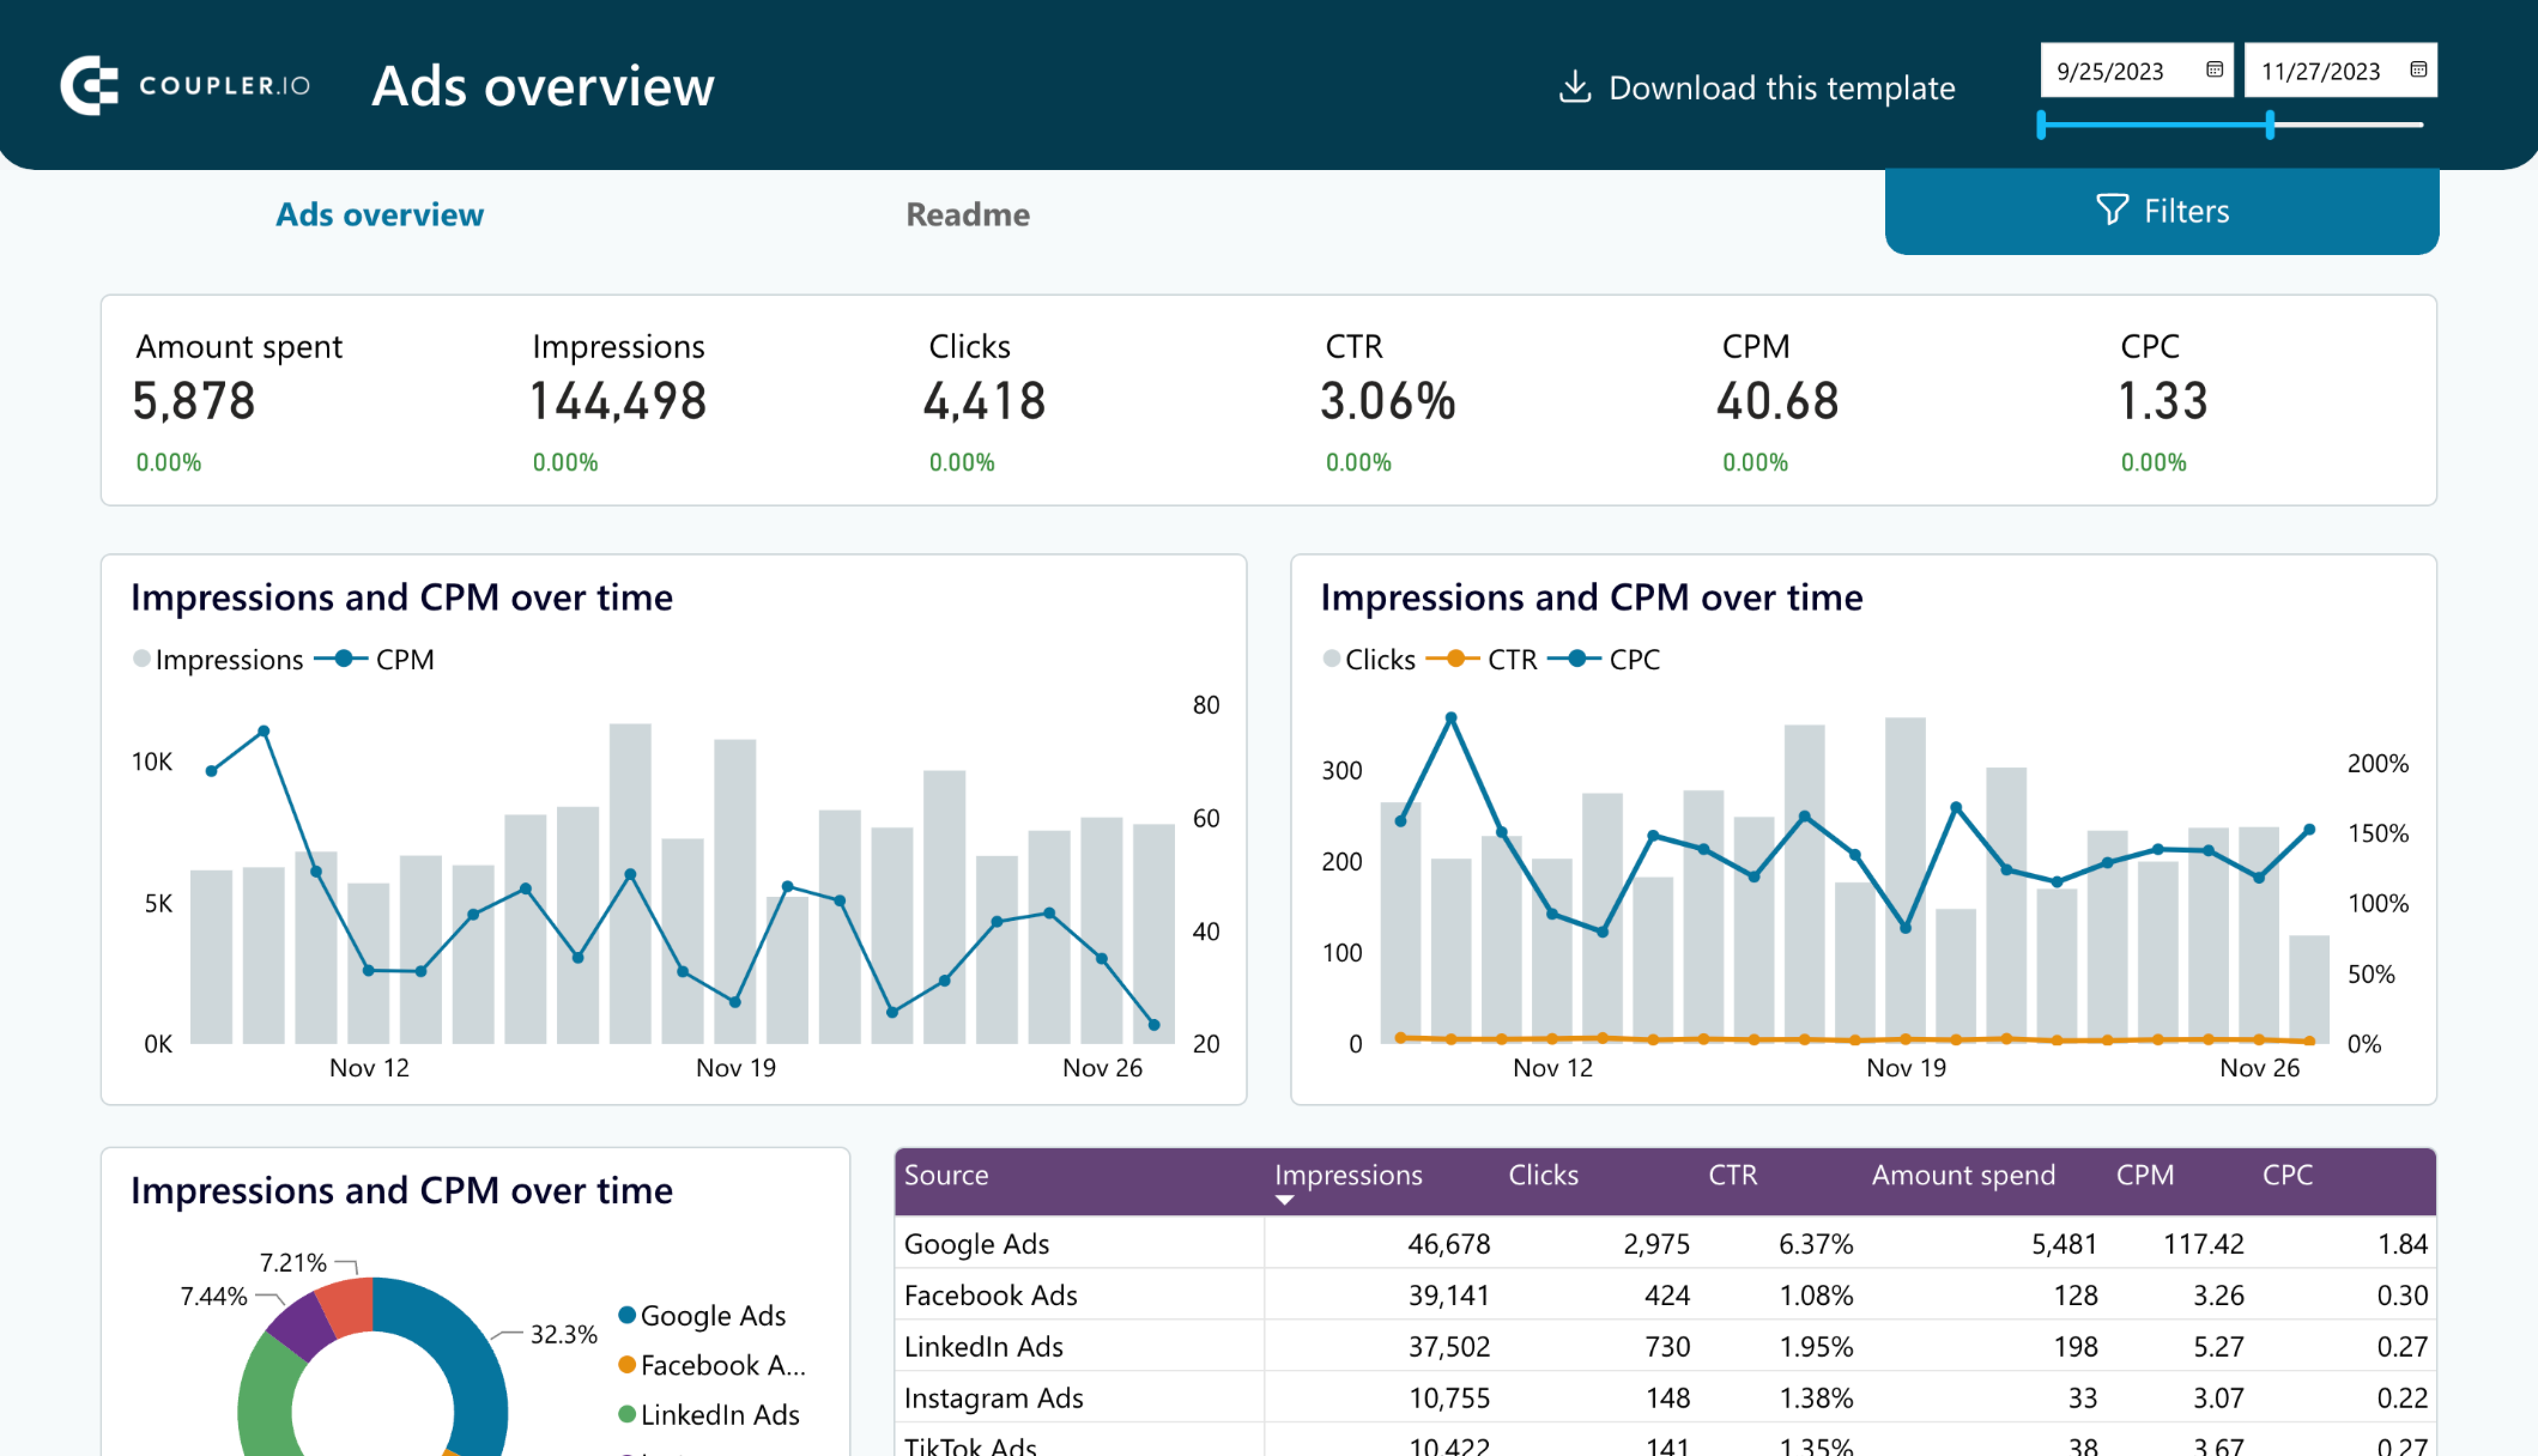
You only need a few minutes to set this up, and then you’re ready to track your ad performance in one view. The dashboard is also available in other business intelligence tools. Pick the version you like and try it right away!


PPC multichannel dashboard in Google Sheets
Use a PPC dashboard designed for Google Sheets to track the performance of your campaigns across multiple advertising platforms.


PPC multichannel dashboard in Looker Studio
Get a comprehensive PPC reporting tool to track the performance of your campaigns launched at multiple advertising platforms.


PPC multichannel dashboard in Power BI
Use a Power BI PPC dashboard for tracking and analyzing your advertising campaigns across multiple platforms.


PPC multichannel dashboard in Tableau
Track and analyze the performance of your advertising campaigns across various platforms using a one-stop PPC dashboard in Tableau
LinkedIn Ads dashboard template for Looker Studio
As of right now, Coupler.io doesn’t have a LinkedIn Ads dashboard template specifically for Power BI. But, since it allows you to connect LinkedIn Ads to Looker Studio, you can explore a ready-made dashboard for this BI tool. And if you like it, contact us with a request to replicate it for Power BI.
This LinkedIn Ads performance dashboard brings in all your LinkedIn Ads data—like clicks, conversions, and engagement—and displays it in clear, simple graphs. There’s no need for you to dig around in LinkedIn’s tools. If you want a quick and effective way to see your ad performance, this Looker Studio dashboard is worth a look.

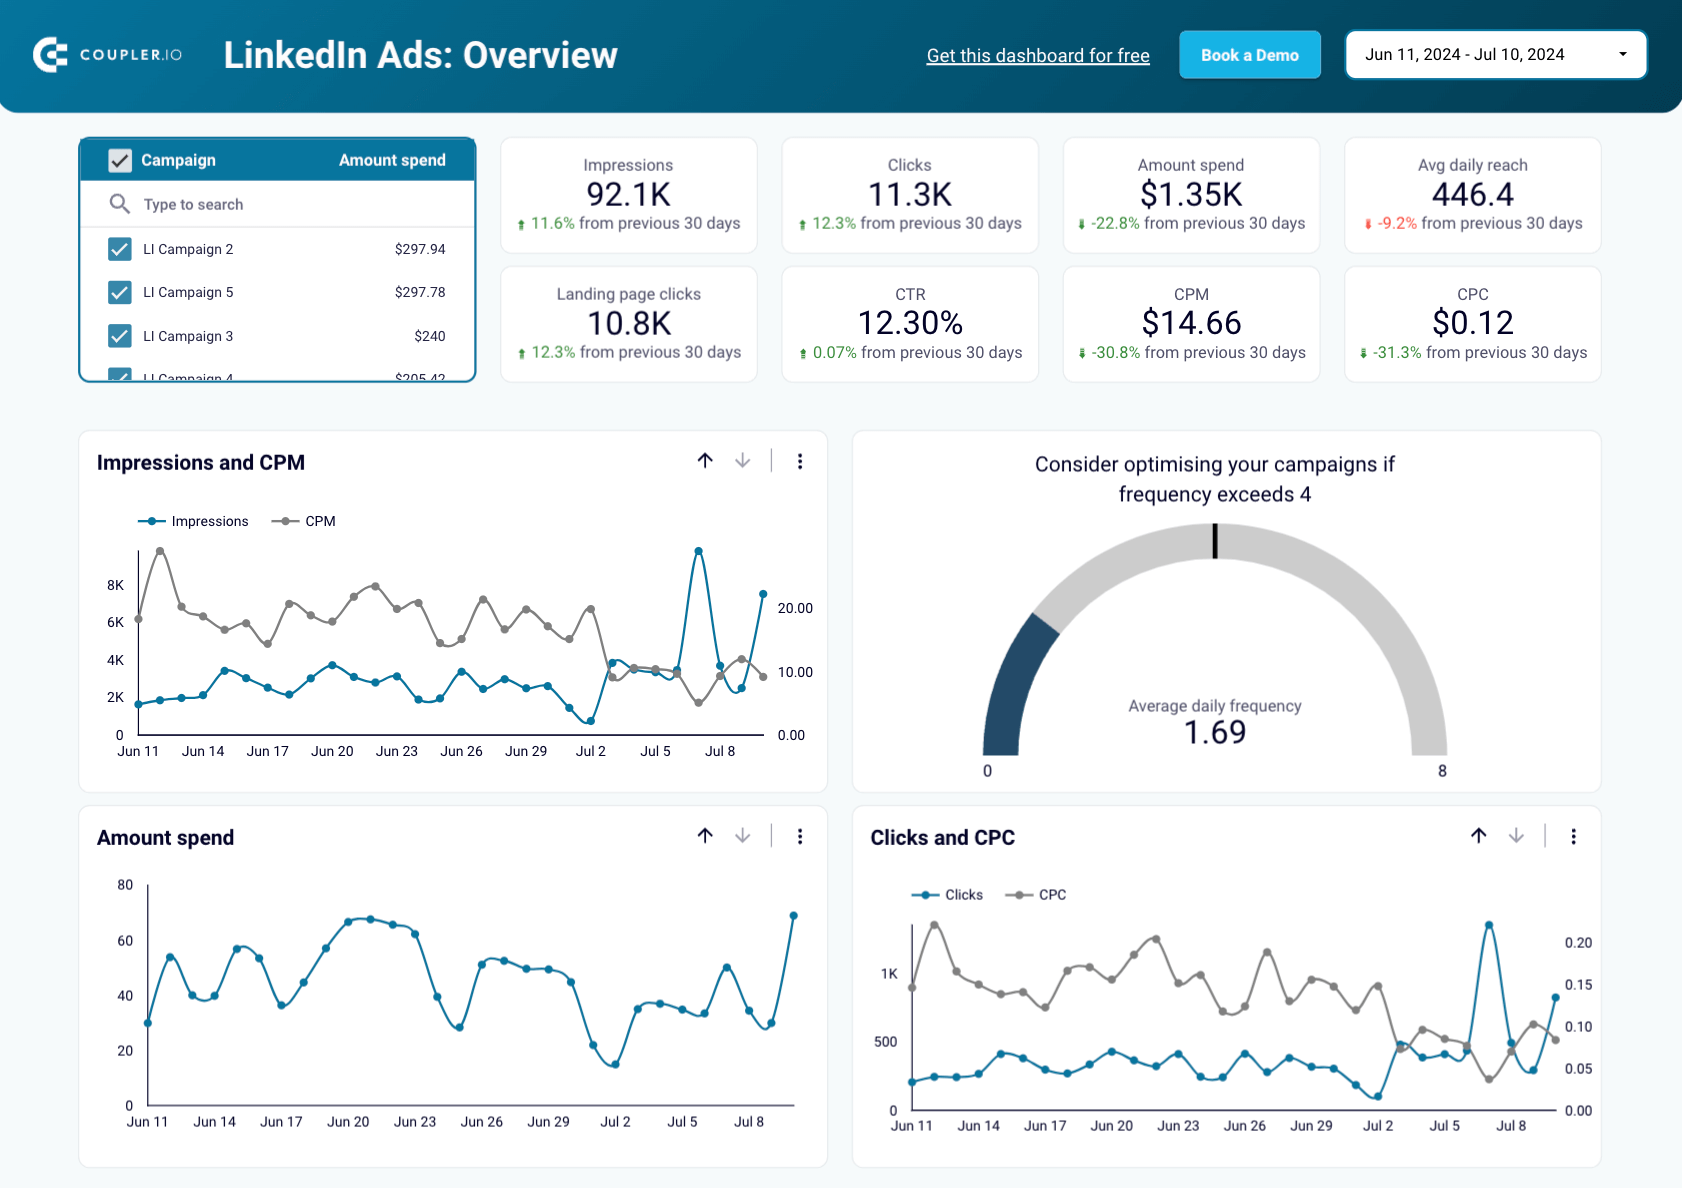
You can also track multiple ad campaigns in a single view, saving time and allowing you to focus on improving results. Coupler.io has already set up the LinkedIn Ads connector, so your data is ready to go. This template works in Looker Studio and Google Sheets, so you can choose the one that fits your needs best.
Is Power BI the right tool for your LinkedIn Ads report?
Power BI is a powerhouse for data visualization, no doubt. But is it the complete answer to keeping your LinkedIn Ads data current? Not exactly. While it’s fantastic for building reports, keeping it in sync with real-time LinkedIn Ads data can be time-consuming.
That’s where Coupler.io steps in, connecting and automating data updates to feed Power BI with the latest from LinkedIn Ads, Google Ads, Facebook Ads, and more.
Imagine: no more manual downloads, no gaps in your reports—just a smooth, automated data flow. Set it up, and let the metrics come to you, constantly updated, so you’re always ready to dive into fresh insights.
So, are you still juggling manual imports, or is it time to add automation for a smarter, faster workflow?
Automate your PPC reporting in Power BI with Coupler.io and spend more time on insights and less on setup.
Automate PPC reporting with Coupler.io
Get started for free