Google Looker Studio (Data Studio) is a powerful data reporting and visualization tool that allows you to create insightful reports. It provides a set of visual elements and data connectors that optimize your reporting experience. All you need to do is connect your data source to Looker Studio and create a report.
But, sometimes, data sources may not contain all the necessary fields to get the required insights. Looker Studio calculated fields are useful in such scenarios.
This in-depth guide covers everything about calculated fields in Looker Studio: what they are, how to create Looker Studio calculated fields, and how to use them efficiently.
But first, a few basics.
What are Looker Studio calculated fields?
Calculated fields in Looker Studio are metrics or dimensions you can create from existing fields in the data schema or chart by applying calculations or functions via formulas.
Calculated fields extend the capabilities and information in the data sources. They are helpful when you want to process the field before using it.
For example, you can create a calculated field to:
- Perform arithmetic calculations
- Manipulate string data
- Transform and manipulate time data
- Perform logical operations
Calculated fields offer functionality equivalent to spreadsheet formulas and functions.
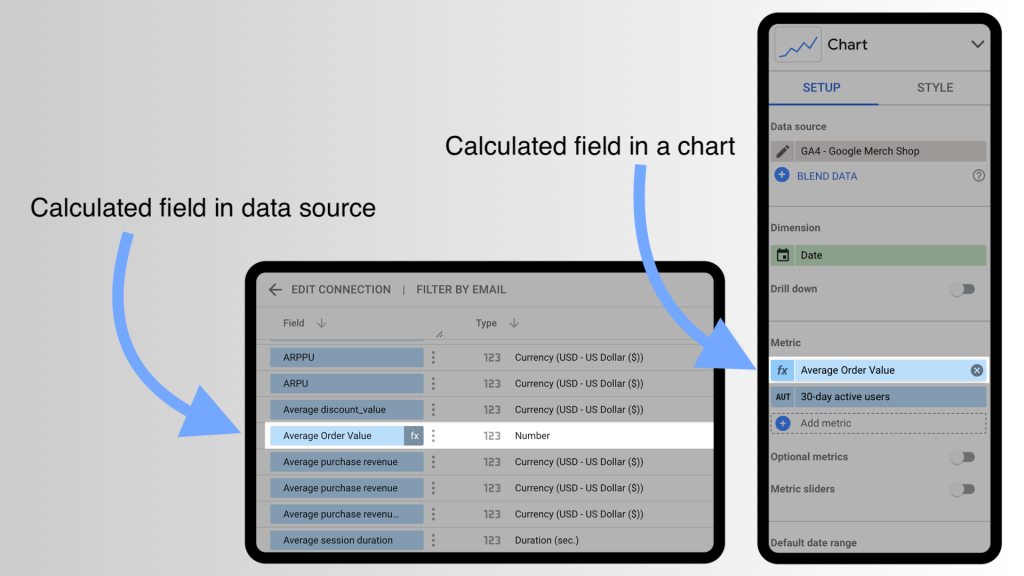
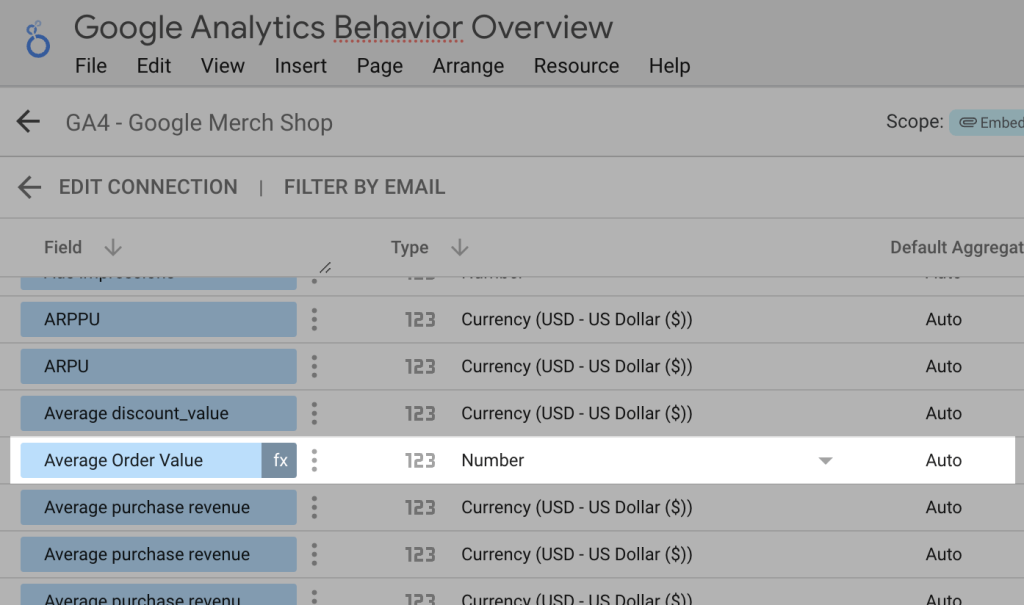
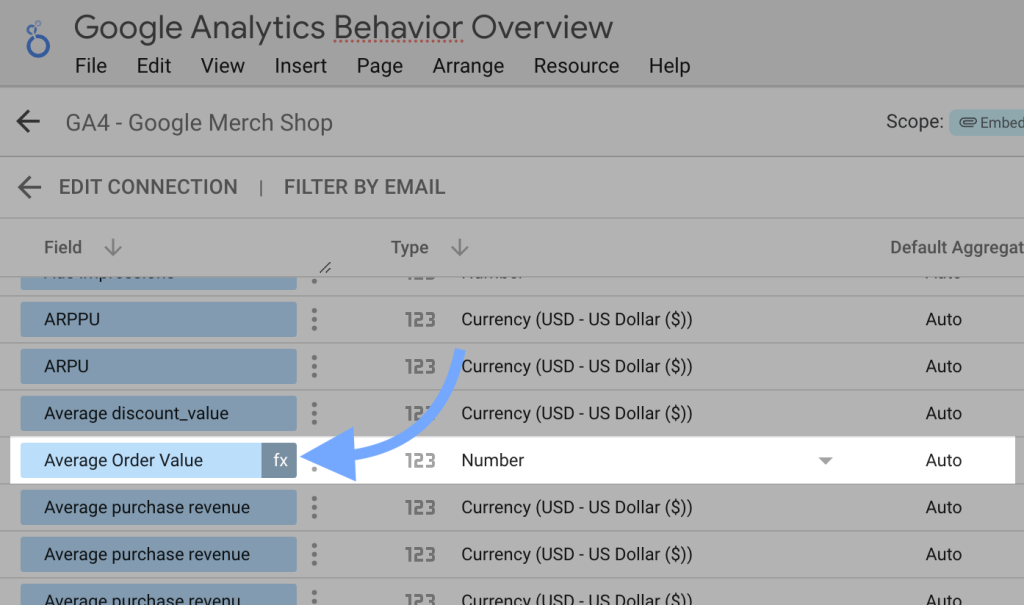
Here’s what calculated fields look like in Looker Studio (you can identify them by the “fx” symbol):
Can you create calculated fields for the external data sources?
Yes, it is possible to create a calculated field for external data sources integrated with Looker Studio. In such cases, Looker Studio applies the formula after loading the data.
However, it causes performance issues when you’re dealing with large datasets. And you may even witness a lag. In addition, the calculated fields are not inherently copied when you make a copy of your report. You may need to recreate all the calculated fields again.
Therefore, a better way around this is to create the calculated fields before loading data into Looker Studio.
But how do you do that?
You can use a data integration and automation platform to transform the data before loading. Coupler.io offers a powerful transformation tool to create new fields in the data source before loading it into Looker Studio.
We cover the step-by-step method to do this in the latter part of this article.
Types of Looker Studio calculated fields
There are two types of Looker Studio calculated fields depending on where they’re created. Each has its scope of usage and purpose.
Data source calculated field
The data source calculated field can be used in all the reports where that data source is used. It can be used just like any other normal field in the charts. You can filter it and also use it to create another calculated field.
Data source calculated fields can be metrics or dimensions.
They have the following limitations:
- They can not be created for a blended data source.
- You need edit rights to the data source for creating/editing this type of calculated field.
Chart-specific calculated field
The chart-specific (aka chart-level) calculated field can be created to perform math, functions, or return results based on logical branching.
Chart-specific calculate fields can be metrics or dimensions.
They have the following limitations:
- They can not be used in any other chart or report. They exist only for a specific chart.
- They can not be used to create other calculated fields.
- You need to be the report editor to create chart-level calculated fields.
Quick Takeaway: If you want to reuse a calculated field in multiple reports or charts, create it in the data source. And if you want to use it in a specific chart, go for a chart-level calculated field.
How to create calculated fields in Looker Studio? – Complete tutorial
Looker Studio calculated fields can be created either in charts or data sources. Ensure that you have the required editing rights before proceeding.
For example, we have two metrics: 1) Total Revenue and 2) Number of Conversions.
We can create a new calculated metric to get the Average Order Value by using a simple formula.
Let’s see how to do this.
Create a calculated field in data source
Open the Looker Studio report in edit mode and follow the steps mentioned below to create a calculated field in the data source.
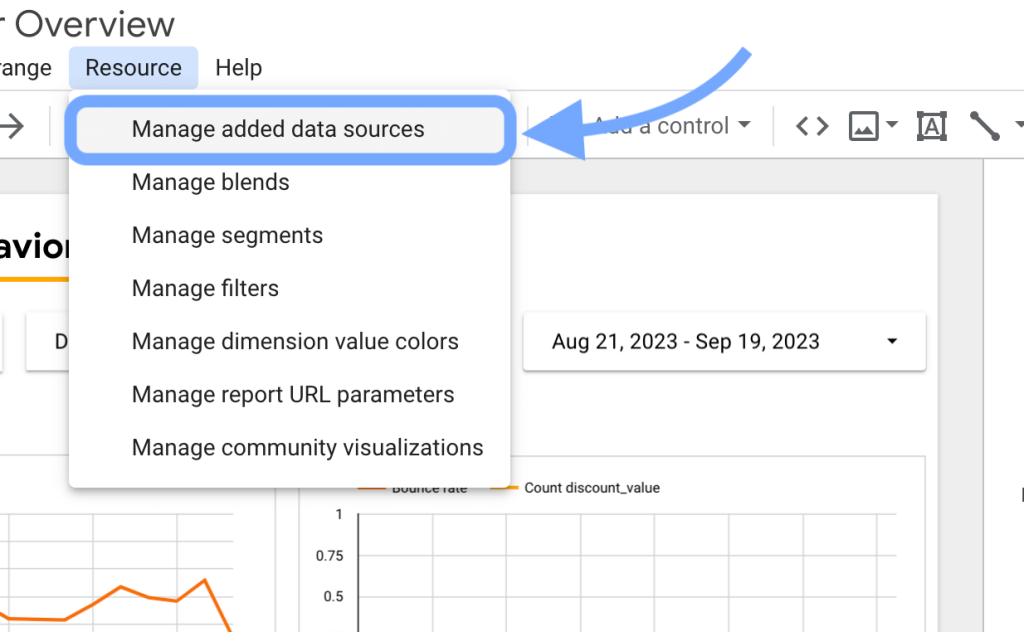
Step 1: Open added data sources
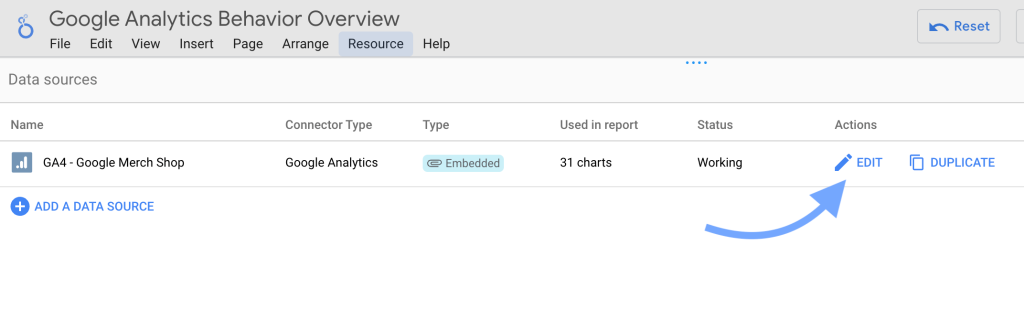
In the Looker Studio report, go to Resources > Manage added data sources.
Step 2: Edit a data source
Click Edit against the data source you want to create a calculated field into.

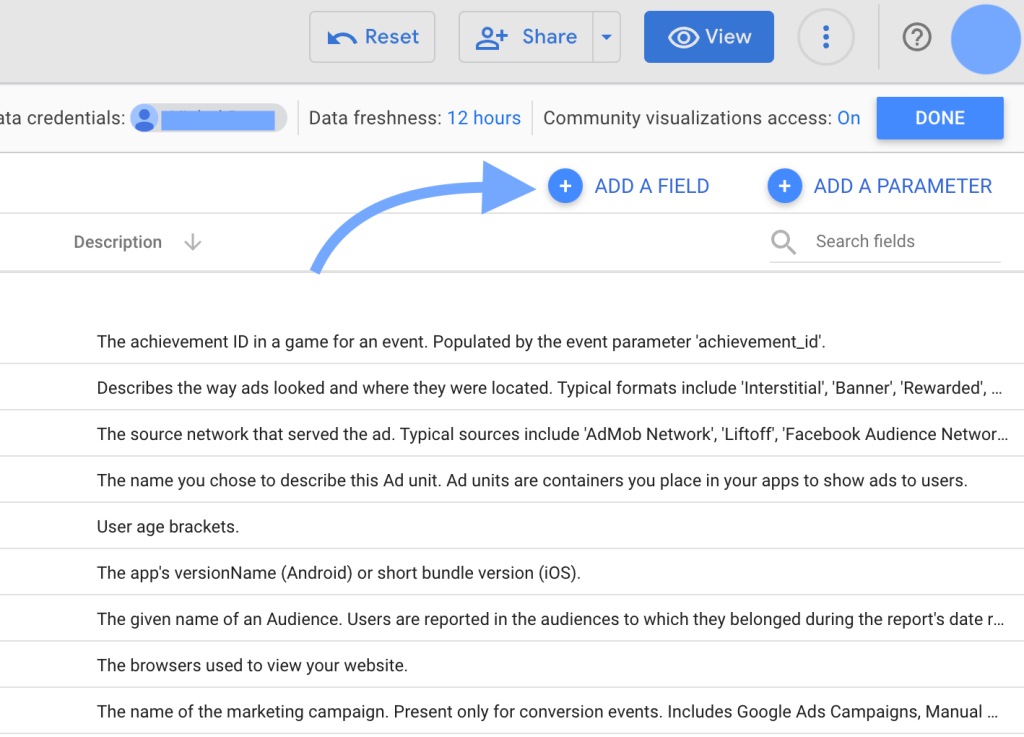
Step 3: Click Add a Field
In the data source editor, click the Add a Field button on the top-right corner.
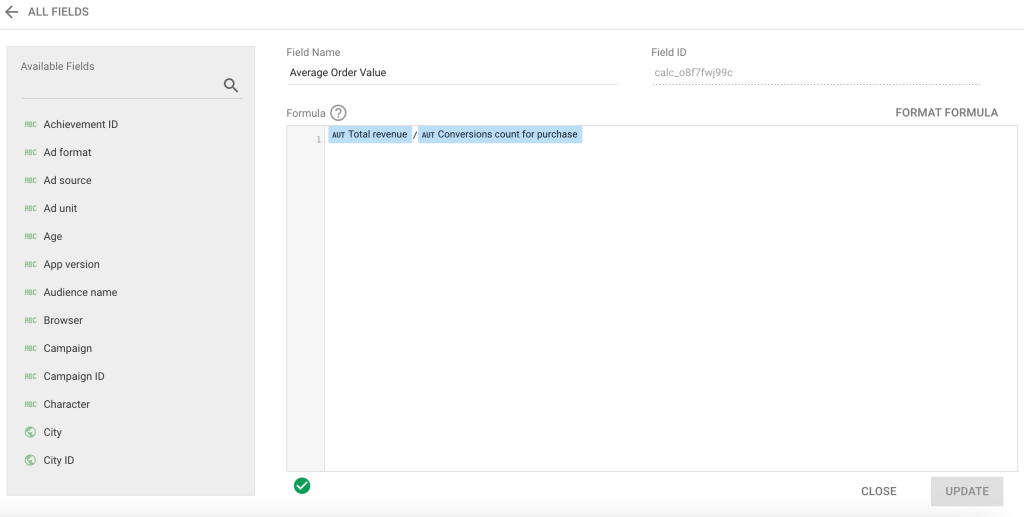
Step 4: Enter the field name & formula
Enter the name for the calculated field, e.g., Average Order Value. And enter the formula for calculating the field.
You can use other metrics and dimensions in the data source to get the desired results. For example, we’ll divide the Total revenue metric by the Conversions count for purchase metric.
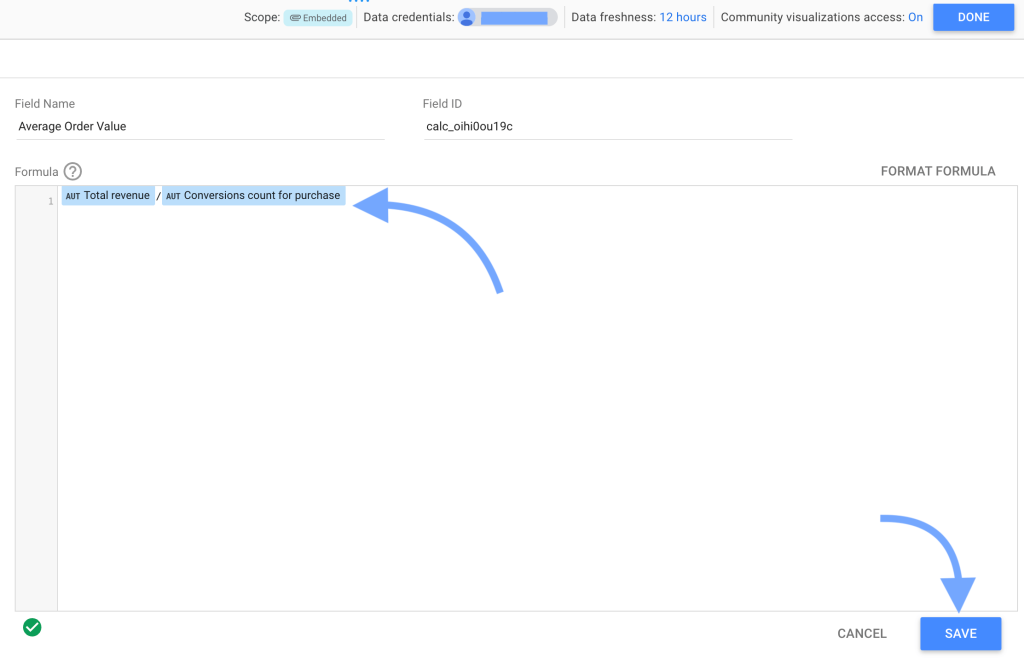
Once you’re done, click Save on the bottom right.
Note: The green tick on the bottom-left of the editor suggests that the formula is valid. In case of invalid formulas, you may not be able to save the calculated field.
You can find the saved calculated metric in the data source.
Like other regular metrics, you can use this calculated metric for data visualization through charts.
Create a chart-specific calculated field
In Looker Studio, open a report in edit mode and follow the steps mentioned below to create a calculated field in a chart.
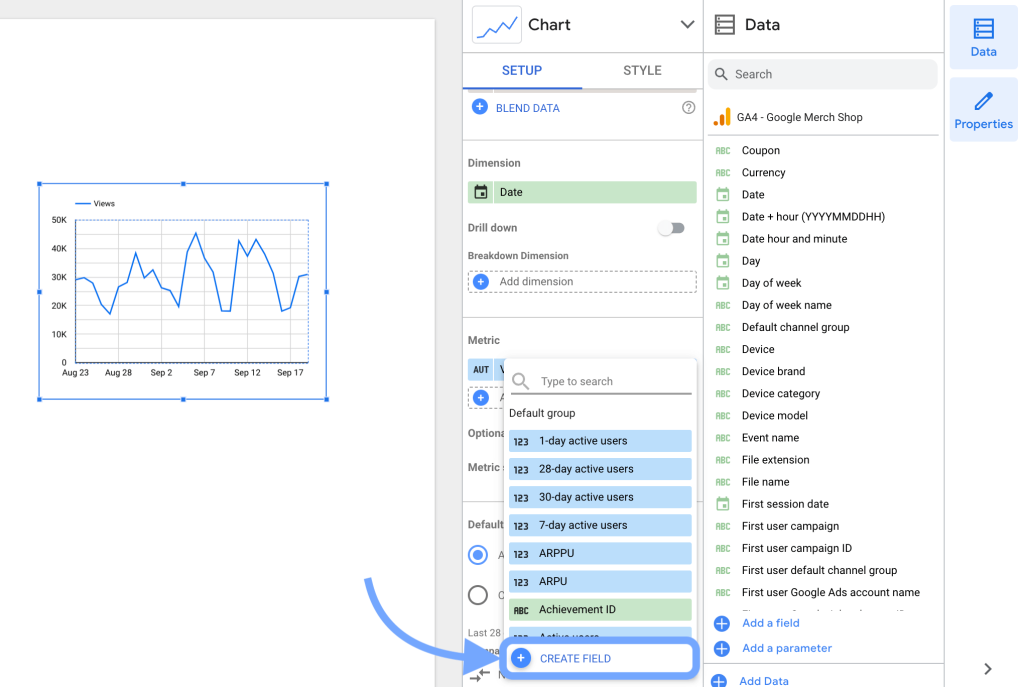
Step 1: Select a chart > setup > create field
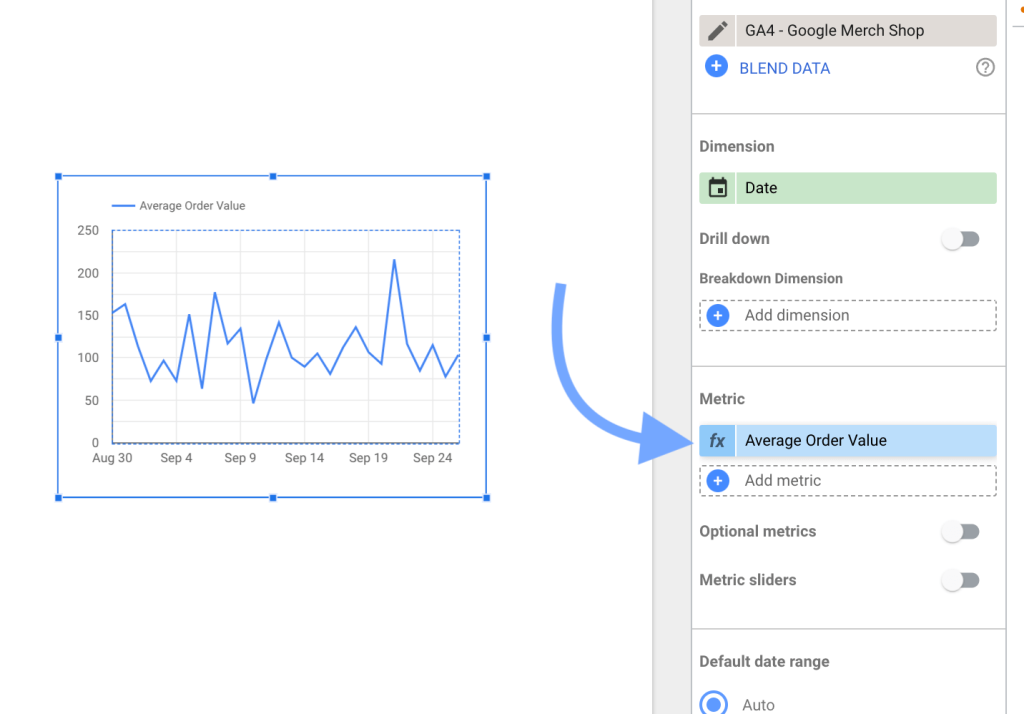
First, select a specific chart in the report to create a new calculated field. Go to the Setup tab, click on the Metric or Dimension field, and click Create New Field.
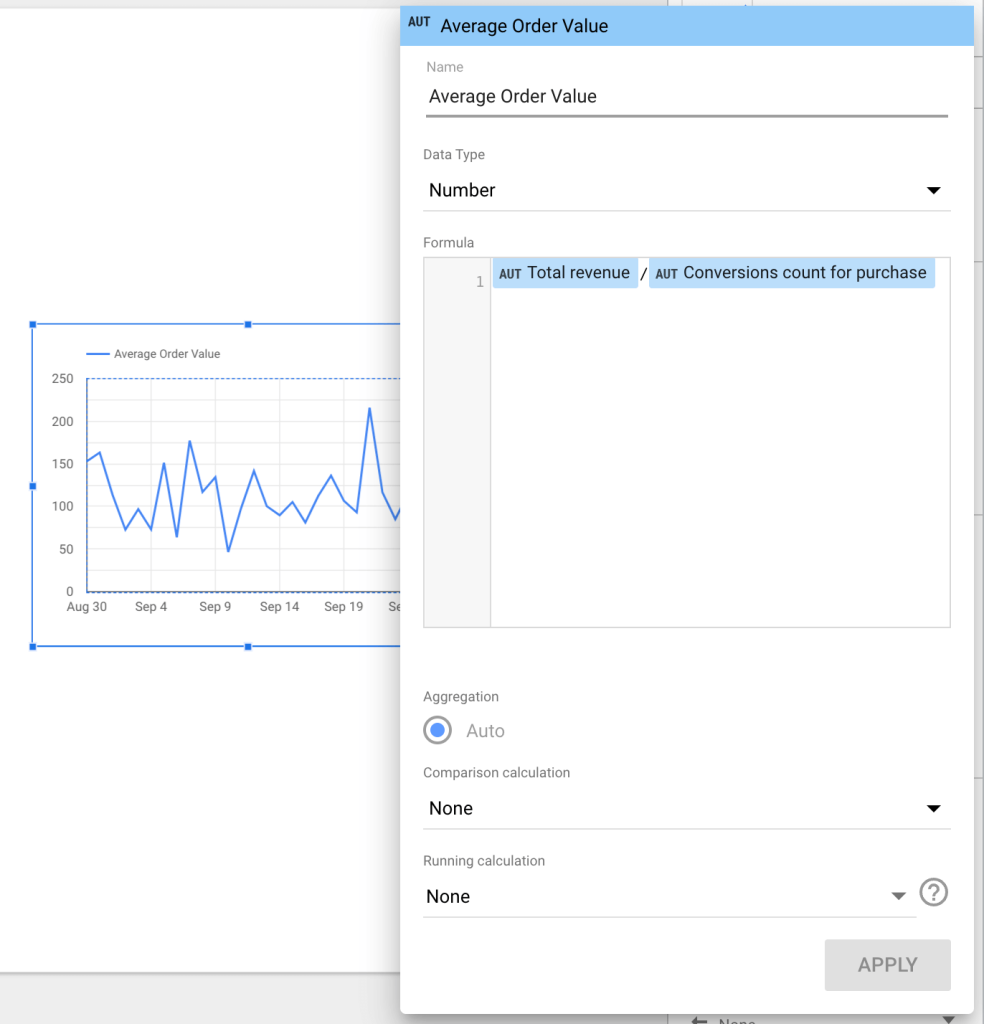
Step 2: Enter the field name & formula
Set a name for the calculated field, and enter the formula.
For example, here, we’ll divide the Total revenue metric by the Conversions count for purchase metric.
You can also set the data type for the metric/dimension.
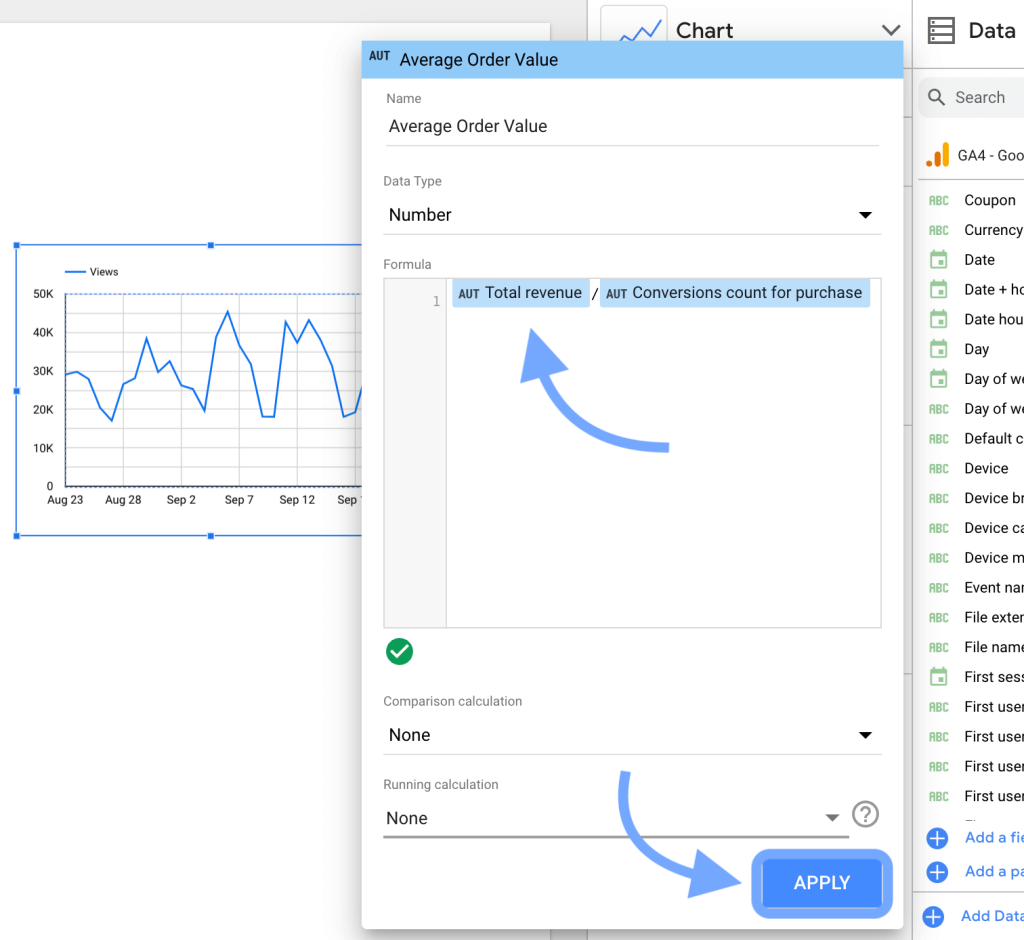
Click Apply at the bottom-right corner to save the metric.
Now, you can use this new calculated field in that specific chart.
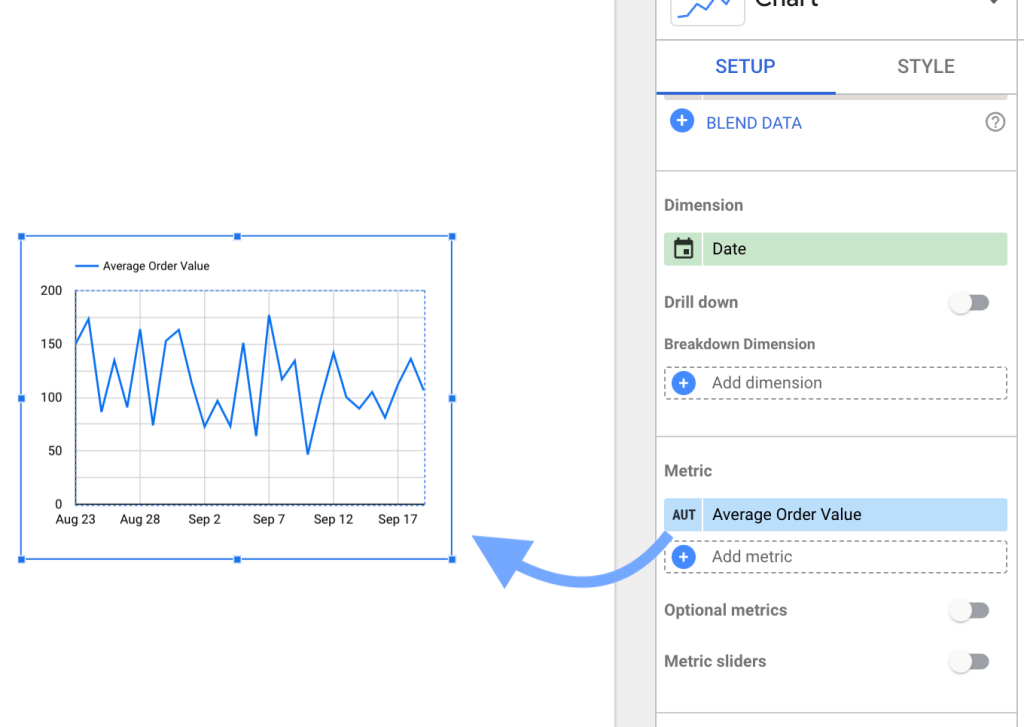
Remember, this is a chart-specific metric, and it can not be used anywhere else.
In Looker Studio Pro, you can use AI to help you create calculated fields. Learn more about this in our blog post where we’ve compared Looker Studio vs Looker Studio Pro.
How to create calculated fields for the data to be loaded to Looker Studio?
Creating calculated fields in data before loading to Looker Studio can be a good option because:
- You can reuse them across charts and reports
- They do not cause performance issues
- Easier to create and manage without complex steps
Platforms like Coupler.io also offer better functionalities for calculated fields than native ones. For example, you can mix dimensions and metrics to create a new column, which is not possible in the native calculated fields.
Coupler.io is a data automation and analytics platform. It allows you to connect multiple data sources to Looker Studio. With Coupler.io, you can transform data before loading it to Looker Studio, namely filter, cleanse data, and also create new fields.
It is an efficient way to create calculated fields since the created fields can be directly used in Looker Studio, just like other regular fields.
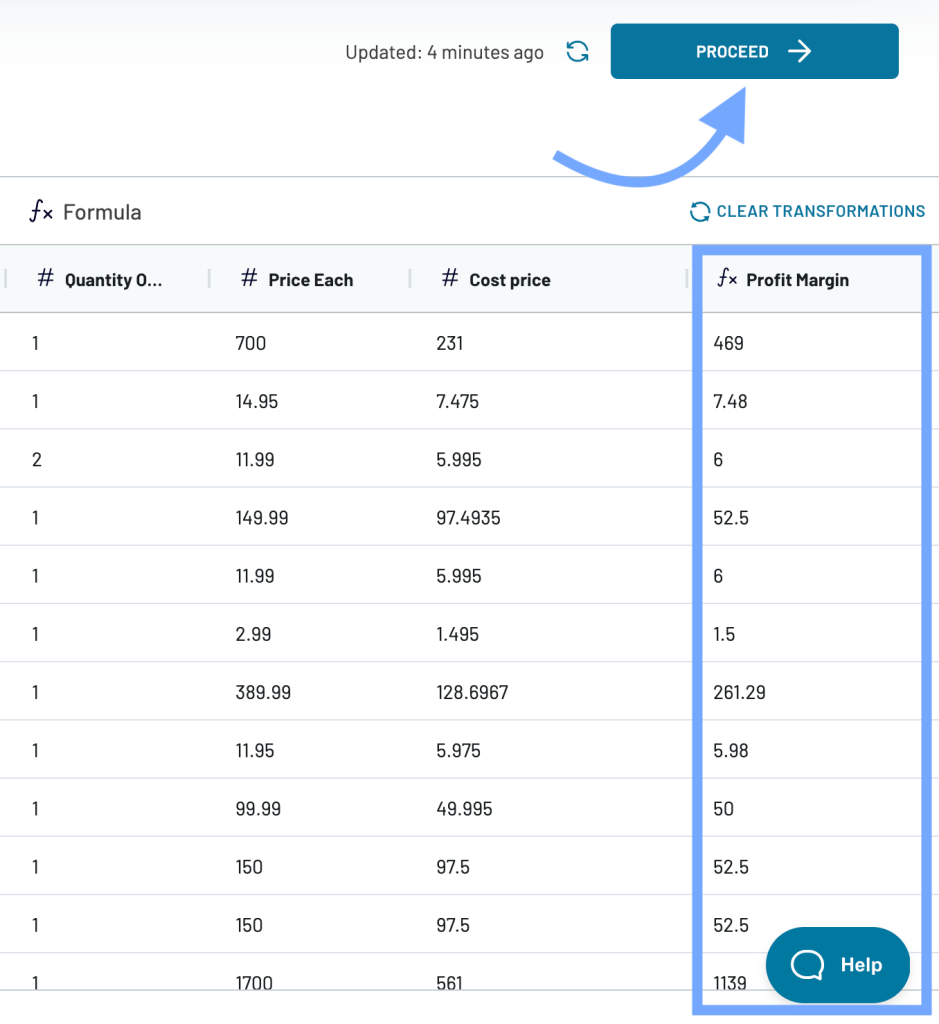
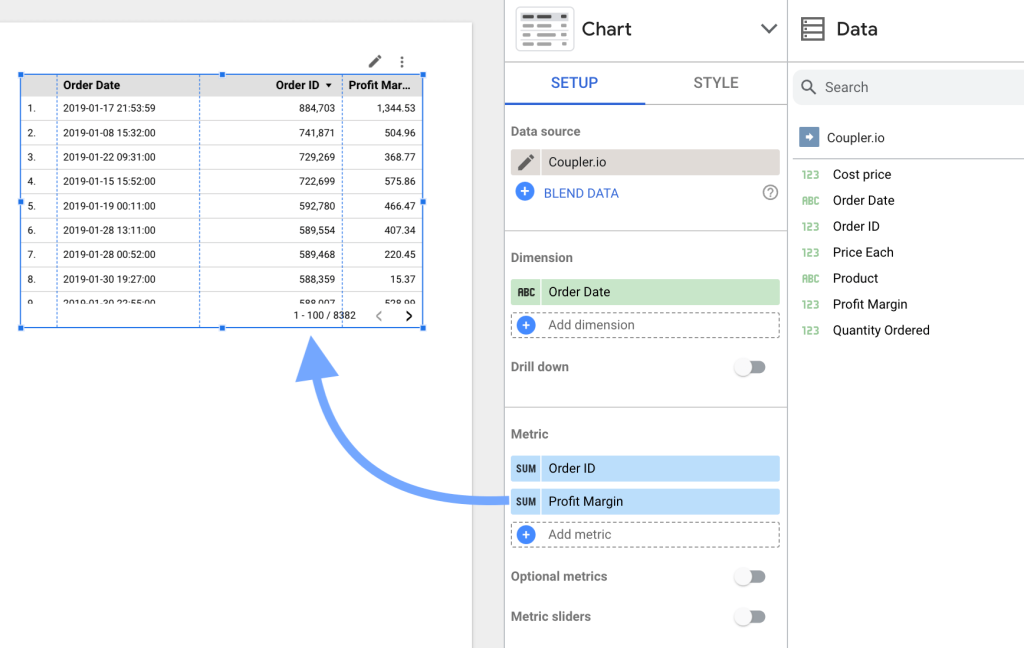
Let’s say we have e-commerce sales data in an Excel sheet. And it contains Product Price and Cost Price. We can create a new column to calculate the profile margin. We connected our Excel workbook to Looker Studio using Coupler.io.
You can connect your desired source by easily selecting it in the form below right away and clicking Proceed.
Step 1: Extract data
Set up the data source to extract data from. For example, to connect with Excel, you must connect your OneDrive account and select the appropriate worksheet.
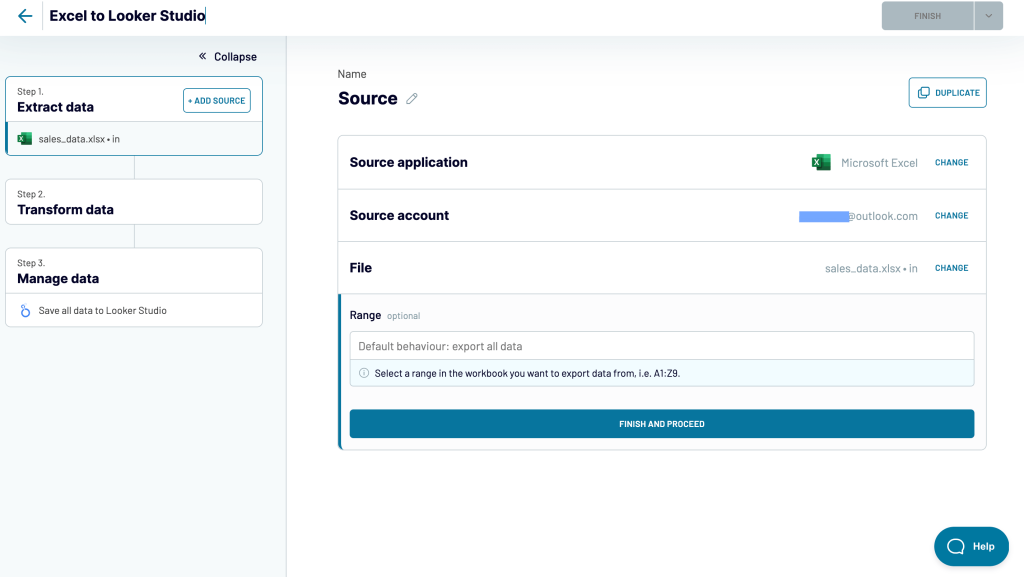
Click Finish and Proceed.
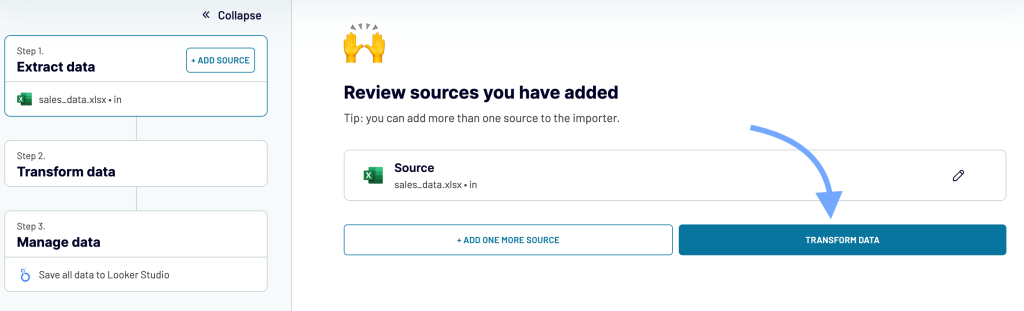
Now, review the data source you’ve added to the importer. You can also add more sources from here and consolidate data. Click Transform Data.
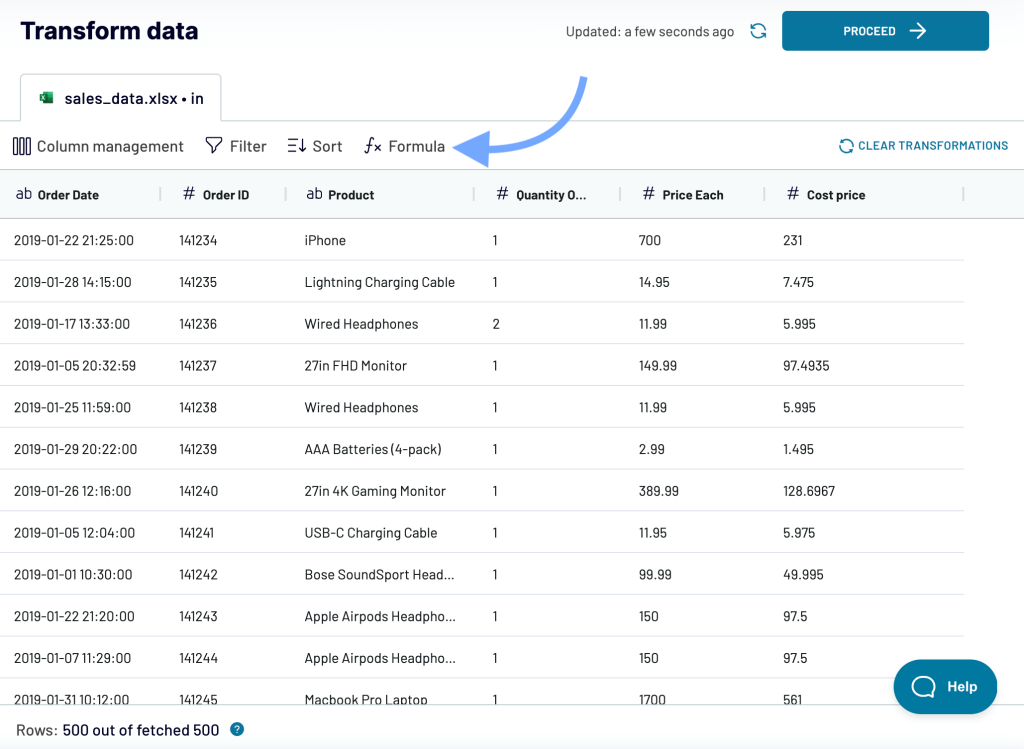
Step 2: Transform data & add a new column
In the data transformation step, you can see a preview of the data columns from the connected sources.
Here, you can hide specific columns, filter or sort data, and add additional columns.
To create a new calculated column, click the Formula button on the top of the data preview.
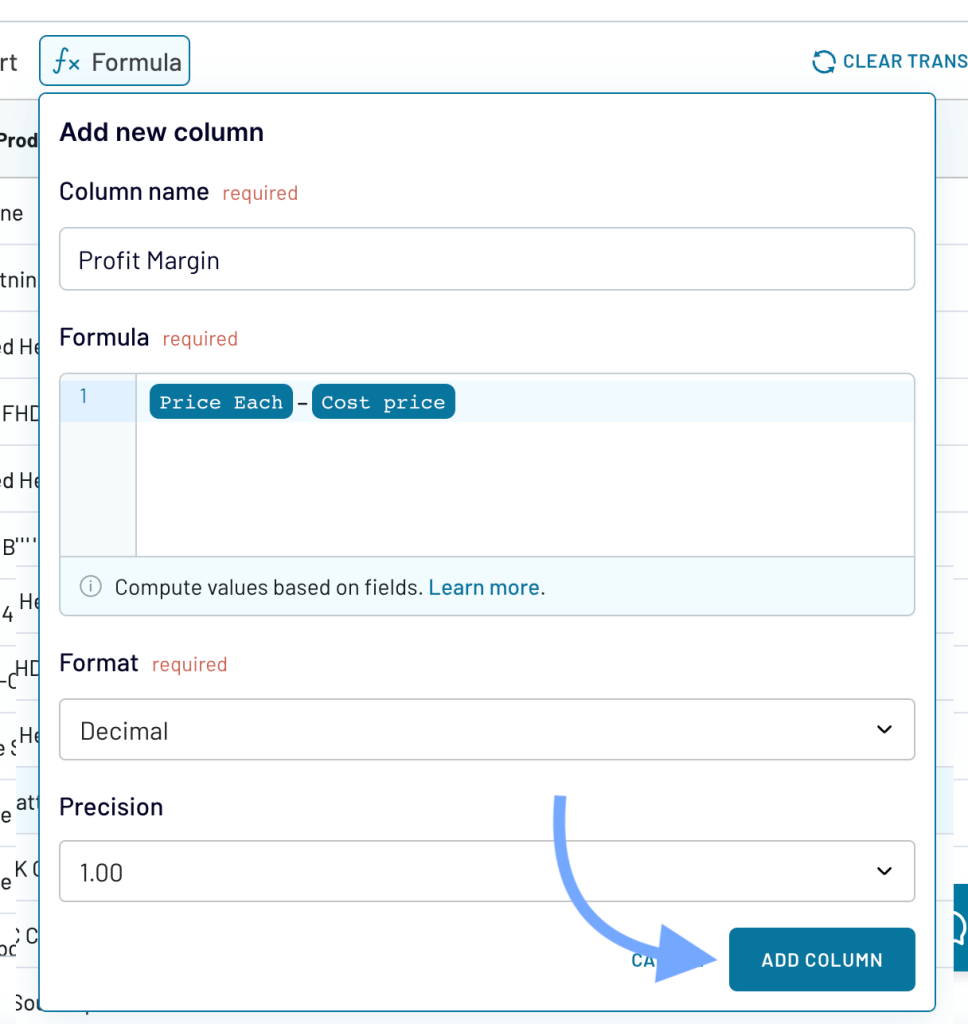
Now, fill in the following fields:
- Column Name: The name of the custom column or calculate field.
- Formula: The formula to calculate the new field. You can use various logical operators, functions, and existing fields to create the formula. Learn more here.
Select the appropriate data format and set the decimal precision for the output data.
Click Add Column to create a calculated field.
The new column will be added to the table.
Click Proceed for the next steps.
Step 3: Manage data to Looker Studio
In the Manage data step, click the Looker Studio link (marked in the screenshot below.)
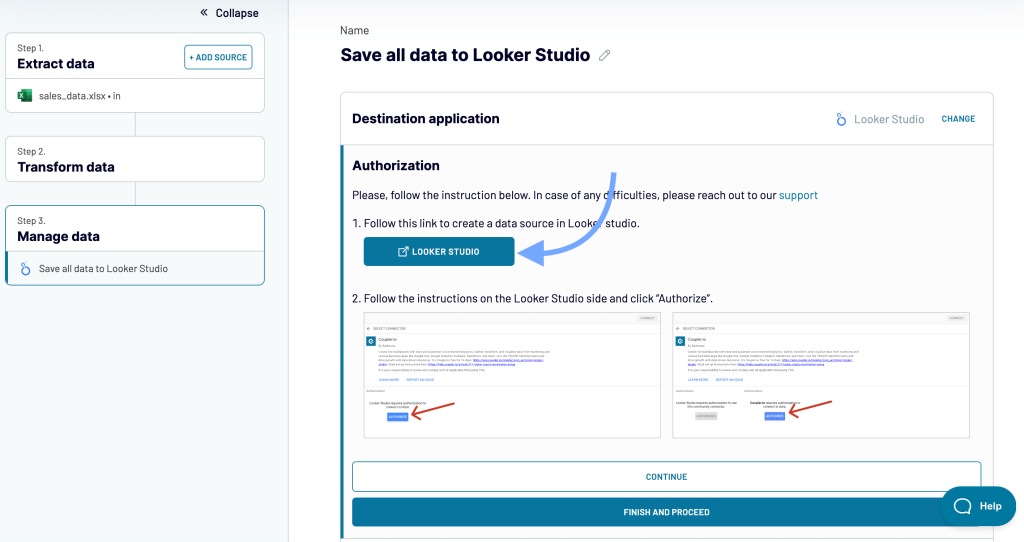
You’ll be redirected to Looker Studio, where you need to authorize and connect the Coupler.io importer.
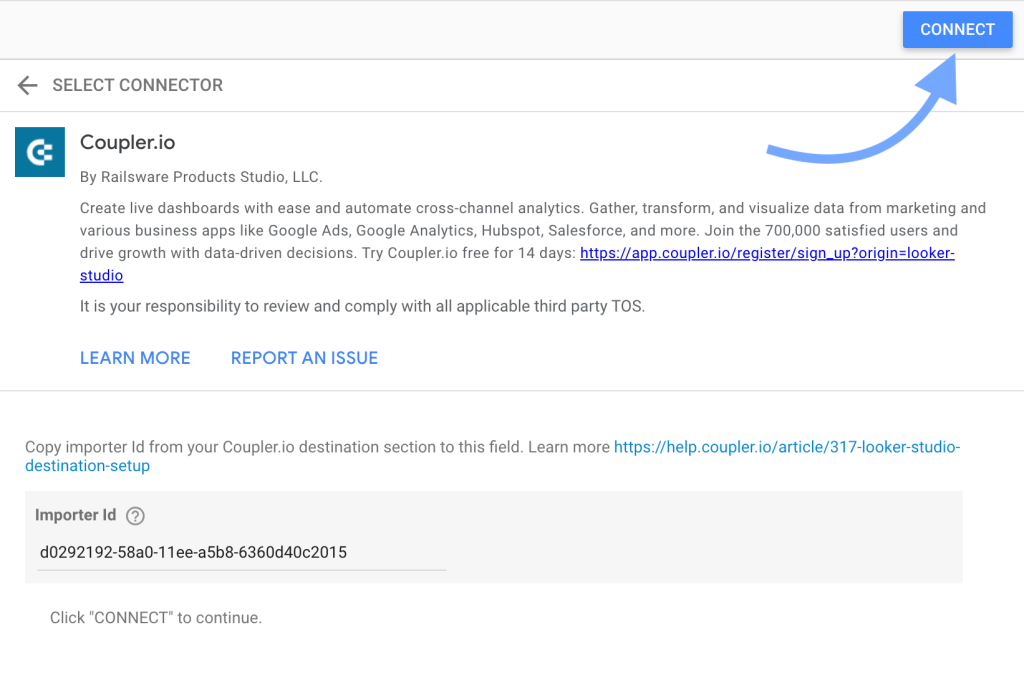
Authorize the connection if prompted. Click Connect on the top-right corner.
A new data source will be added to the Looker Studio report. It will also contain the calculated field (that we created using Coupler.)
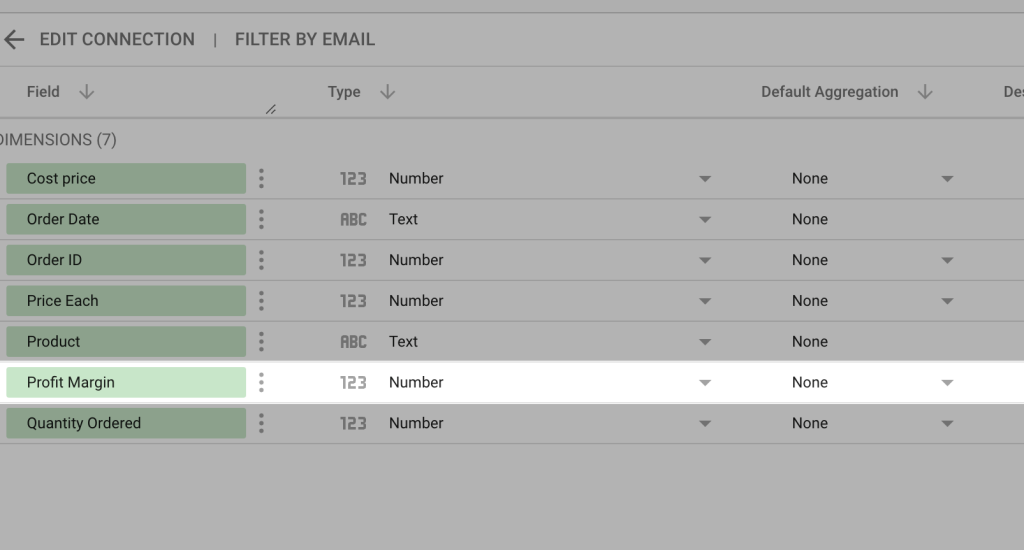
You can use this source to create reports.
This way, Coupler’s transformation module can help you easily create calculated fields in data sources. It also works for dimensions (i.e., fields containing strings) and can help you create fields of various data types.
It also supports data flow automation. You can configure the importer to refresh data at regular intervals (up to every 15 minutes). Learn more about this and other features in our guide on how to connect multiple data sources to Looker Studio.
How to build Looker Studio calculated field formulas?
Looker Studio calculated field formulas help you perform actions on the existing field(s) and create new metrics or dimensions.
You can use basic arithmetic operators, predefined functions, and branching logic to derive new fields.
Google Looker Studio functions
Looker Studio functions allow you to perform calculations or process the existing fields. You can use them to quickly get the desired output from the existing fields and/or arguments.
Looker Studio calculated fields support the following functions:
Aggregation Functions
These functions allow you to aggregate data from the fields.
For example, the AVG(X) will return the average of all values of X.
Arithmetic Functions
These functions allow you to perform mathematic operations like addition, trigonometric functions, etc.
For example, the POWER(X, Y) returns the value of raising X to the power Y.
Conditional Functions
These functions allow you to assign values based on conditional logic.
For example, the formula below will apply conditional logic to metric X and return “High” for values above 100 and “Low” for other values.
CASE
WHEN X > 100 THEN "High"
ELSE "LOW"
END
Date Functions
These functions allow you to work with data & type fields. You can change the format, compare them, or manipulate the data.
For example, the DATE_DIFF(X, Y) function returns the difference between two dates, X and Y, in days.
Geo Functions
The geological functions allow you to convert codes into continent, subcontinent, country, region, and city names.
For example, the TOCITY(X [Input Format]) function will return the name of the city by country code X. You also need to specify the input format in the function.
Text Functions
The text functions allow you to perform various operations on text strings, such as concatenation, formatting, and comparison.
For example, the CONCAT(x, y) will combine two strings, X and Y.
Other Miscellaneous Functions
These are the functions for data type conversion, hyperlinks, and creating image fields.
For example, the HYPERLINK(URL, link label) function creates a hyperlink with the provided URL and label.
You can also use Regular Expressions (regex) in the formulas. But there are alternative functions as well. To learn more about the supported functions, refer to the official Google resources.
An example of using a function in Looker Studio calculated field
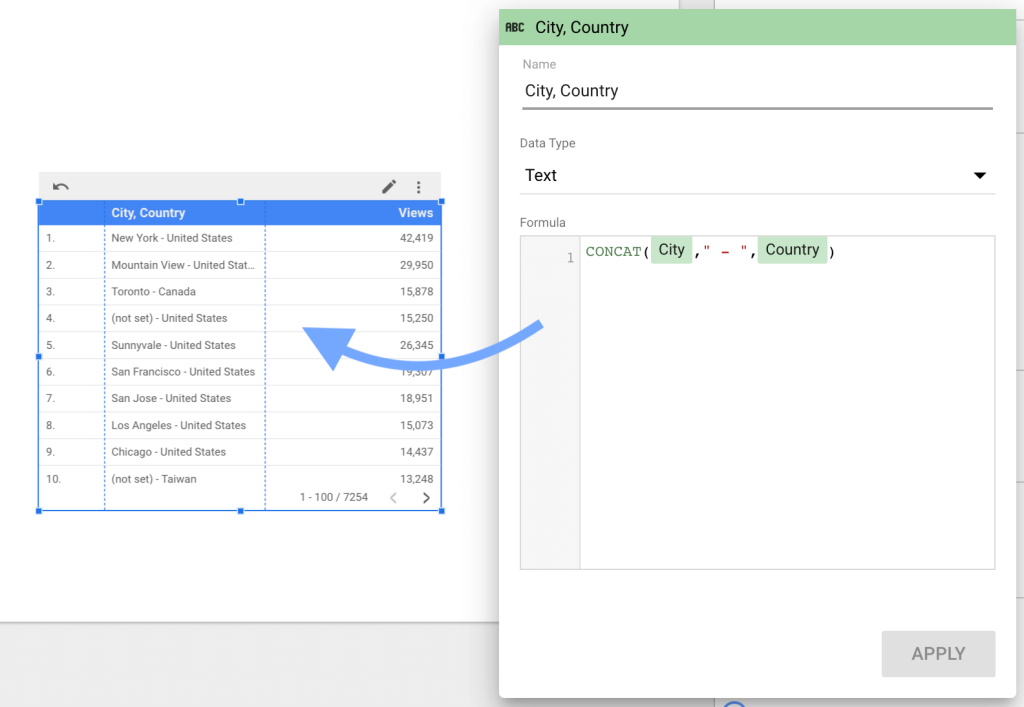
Let’s say we have user data that contains their city and country names in two distinct dimensions and we want to combine them with a hyphen between them.
We can do this by using the CONCAT() function like this:
CONCAT(city, " - ", country)
Here’s what it looks like:
Similarly, you can use other Looker Studio calculated field functions to get the desired output.
Google Looker Studio operators
Operators are symbols or certain keywords that manipulate the data inputs and return results. They can be used with other functions to define logic and get the desired result.
Different types of operators for Looker Studio calculated fields are listed below.
| Type | Operator | Description |
| Arithmetic Operators (Both sides of the comparison must be numbers) | + | Addition |
| – | Subtraction | |
| * | Multiplication | |
| / | Division | |
| Comparison Operators (Both sides of the comparison must be of the same type) | = | Is equals to |
| != | Is not equal to | |
| > | Is greater than | |
| >= | Is greater than or equal to | |
| < | Is less than | |
| <= | Is less than or equal to |
Looker Studio also supports logical operators that return true, false, or null values. You can use operators such as AND, OR, IS, IN, NULL, and NOT to perform logical operations. Learn more about the logical operators from here.
A simple example of using a logical operator in Looker Studio calculated fields
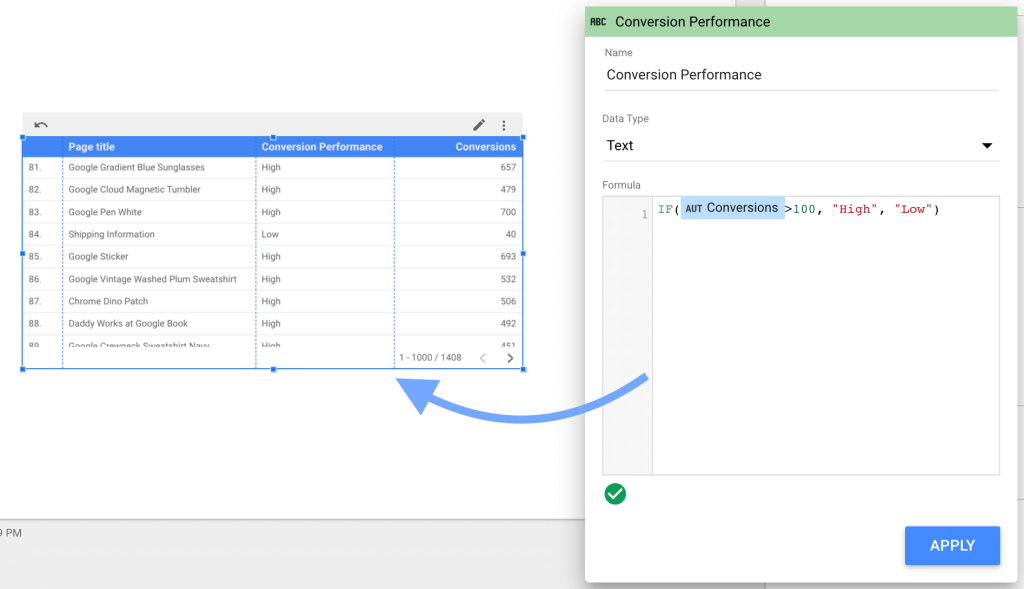
Let’s say we’ve data on the number of conversions by page. And we want to classify the pages based on conversions. We can use the IF function along with a”>” comparison operator to do that.
IF(Conversions>100, "High", "Low")
This will create a dimension with the value “High” for pages with above 100 conversions and “Low” for others.
Similarly, you can use other operators to manipulate data and get the desired results.
Google Looker Studio literals
Literals in Looker Studio calculated fields are used to specify a constant value of built-in datatypes. And they’re of four types:
- String Literals: They specify a constant value of strings using single or double quotation marks. For example, “John Doe” and ‘John Doe’.
- Date Literals: They specify the date and time values. The values are preceded by appropriate markers. For example, DATE ‘2023-9-3’ and DATETIME ‘2023-9-3 18:30:00’.
- Numeric Literals: They are unquoted floating point values, such as 1, 2, and 3.33. Example: (IF order_value < 100, …..).
- Boolean Literals: The literals true and false are used when working with boolean expressions. Example:
IF(Boolean field = true, "yes","no").
Learn more about the literals from here.
You can combine these functions, operators, and literals to build a Looker Studio calculated field formula.
How to edit calculated fields in Looker Studio?
To edit a Looker Studio calculated field, you’ll need to have the required access.
- For chart-specific fields: You must be an editor of the chart
- For data-source fields: You must have edit rights for the data-source
Editing a calculated field in Looker Studio is straightforward.
Here’s how to do it.
Edit a calculated field in the data source
In a Looker Studio report, click Manage added data source under the Resource menu.

The list of connected data sources to the report will be displayed.
Click Edit against the data source to edit its calculated field.
In the data source editor, look up the calculated field you want to edit.
Click fx beside the field name to edit it.
Now, the field editor will appear on the screen.
Modify the field details, like name and formula and save it. All the charts using that calculated field will reflect the changes.
Edit a chart-specific calculated field
To edit a chart-specific calculated field in Looker Studio, open the respective chart.
Hover the cursor over the respective field. Click fx on the left of the field to edit it.
Modify the calculated field name, data type, and formula as per your needs.
Click Apply to save the changes.
How to filter Looker Studio calculated fields?
Looker Studio calculated fields in the data source can be filtered, just like other regular fields. You can filter a specific chart of the entire report.
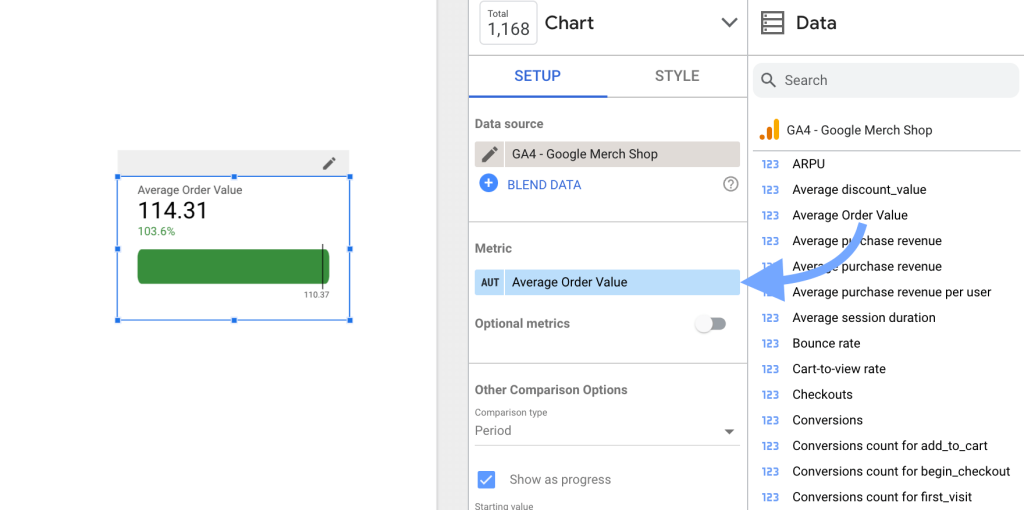
Let’s say we have a calculated metric for the average order value. We want to filter a specific chart to show data for average order values greater than $50.
Here’s how to do it:
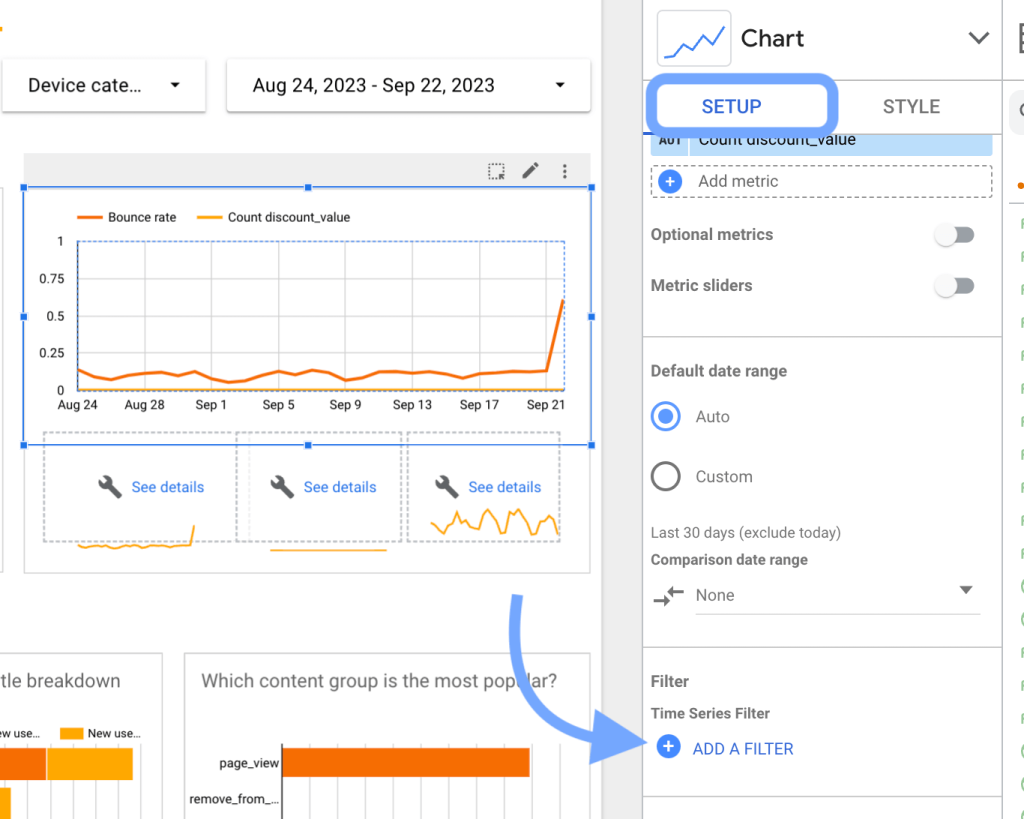
Select a chart and edit its properties. In the Setup tab, scroll down to Filters and click Add a Filter.
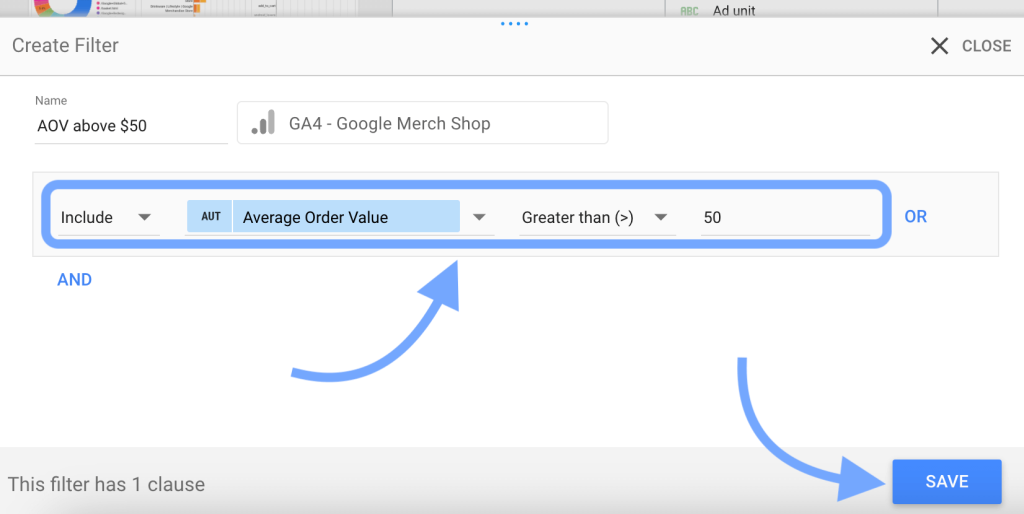
Enter the filter name.
Select the calculated field from the drop-down list and set up the filter.
Click Save to apply it.
In the same way, the calculated fields can be used to filter data in reports. You can filter the report to show only specific records based on the calculated field’s value.
How to use calculated fields in Looker Studio?
Looker Studio calculated fields are helpful to get more out of your data. Just like standard fields, these custom fields can be used to visualize data in charts.
Calculated fields serve multiple purposes.
And here are some common ones:
- Create custom metrics: You can create new metrics from existing fields. For example, getting the conversion rate from the number of conversions and total visitors.
- Derive dimensions: You can apply specific transformations to existing dimensions or apply logic to existing fields to get new dimensions. For example, getting the full name of the customer by combining first and last names.
- Segment data: You can segment data using the CASE WHEN conditions. For example, you can classify customers based on their age groups into “18-24”, “25-30”, and so on.
- Cleanse data: In case your data contains a lot of inconsistencies, you can create a calculated field to cleanse it. For example, you can convert lowercase to uppercase and remove special characters.
Looker Studio calculated field examples & use cases
Looker Studio calculated fields help you enhance data analytics and visualization. It offers plenty of options to modify the data and make it insightful before visualizing it.
Here are some real-life examples of calculated fields in Google Looker Studio.
Example #1 Group SEO report by pages
Let’s say you’re analyzing the SEO report of an ecommerce site and you want to classify the pages into different categories, i.e. products, categories, and blog posts.
You can do this by creating a new calculated field and using the CASE function.
Here’s an example formula:
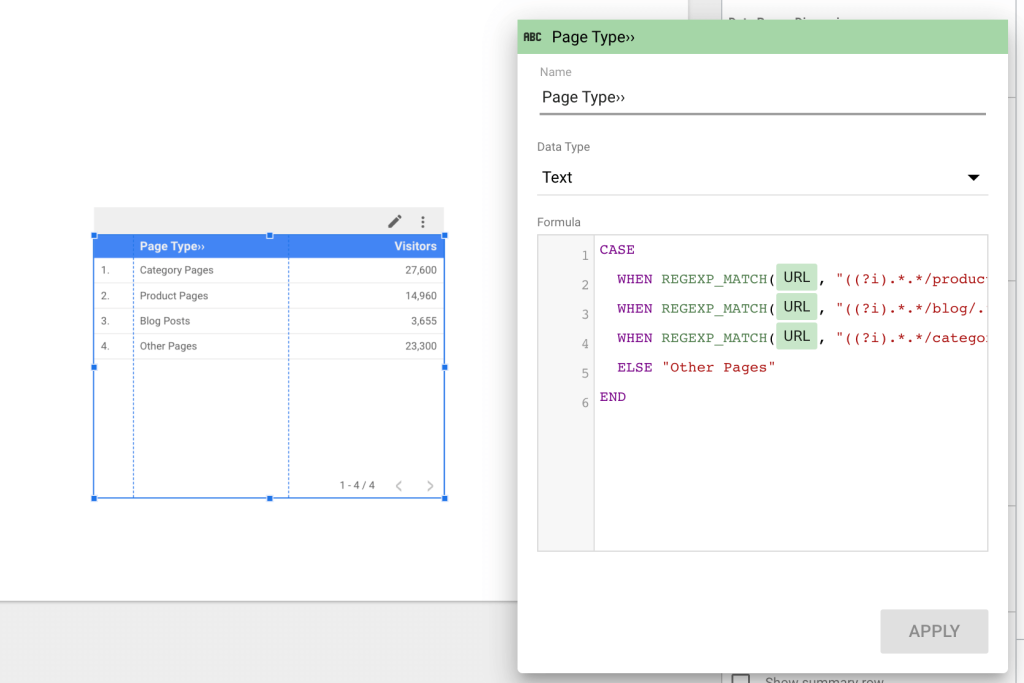
CASE
  WHEN REGEXP_MATCH(URL, "((?i).*.*/product/.*).*") THEN "Product Pages"
  WHEN REGEXP_MATCH(URL, "((?i).*.*/blog/.*).*") THEN "Blog Posts"
  WHEN REGEXP_MATCH(URL, "((?i).*.*/category/.*).*") THEN "Category Pages"
  ELSE "Other Pages"
END
In the above formula, the CASE function evaluates different conditions and assigns a value according to the page URL. The REGEX_MATCH function checks if the URL field contains specific terms.
Each case is evaluated one after one until the value is found true. If none of the cases is found true, then a default value is assigned to the dimension (which is “Other Pages” in this example.)
For example, if the page URL is https://example.com/product/, then the above formula assigns a “Product Pages” value.
Here’s what it looks like:
This is just a basic example. You can modify the formula, implement your own logic, and use it for complex classifications.
Example #2: Create annotation in charts
One clever way to use Looker Studio calculated fields is to annotate charts.
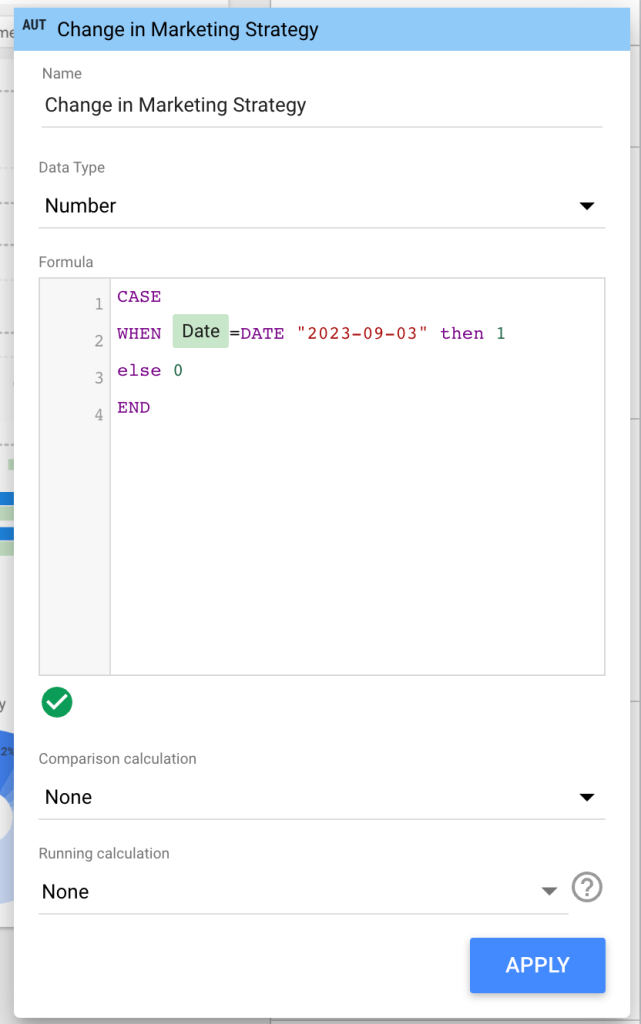
The logic here is to create a calculated metric, the value of which is 1 only on specific data. You can use this metric to annotate the chart by displaying bars.
For example:
CASE
WHEN Date=DATE "2023-09-03" then 1
else 0
END
In the above formula, we’ve used the CASE function to assign value=1 to the metric only when the date is “2023-09-03.” (We’ve used the DATE literal to specify the date value here.)
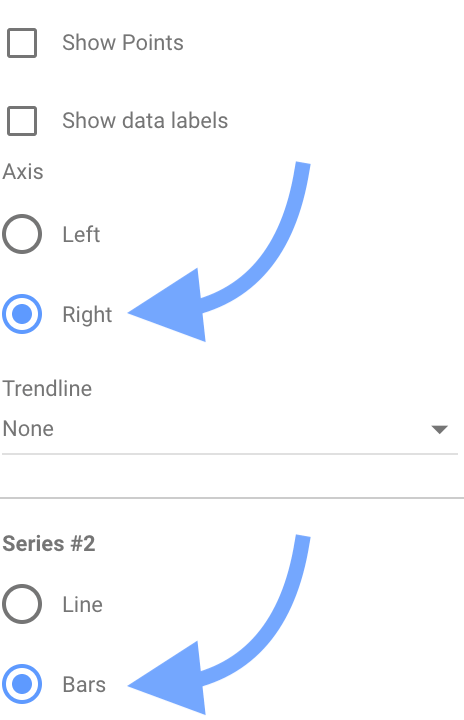
Next, to make it appear as a vertical line on the chart, we need to change its style to “Bar.”
In the Chart editor, go to Style.
Change the Axis to Right and the graph type to Bars for the created series.
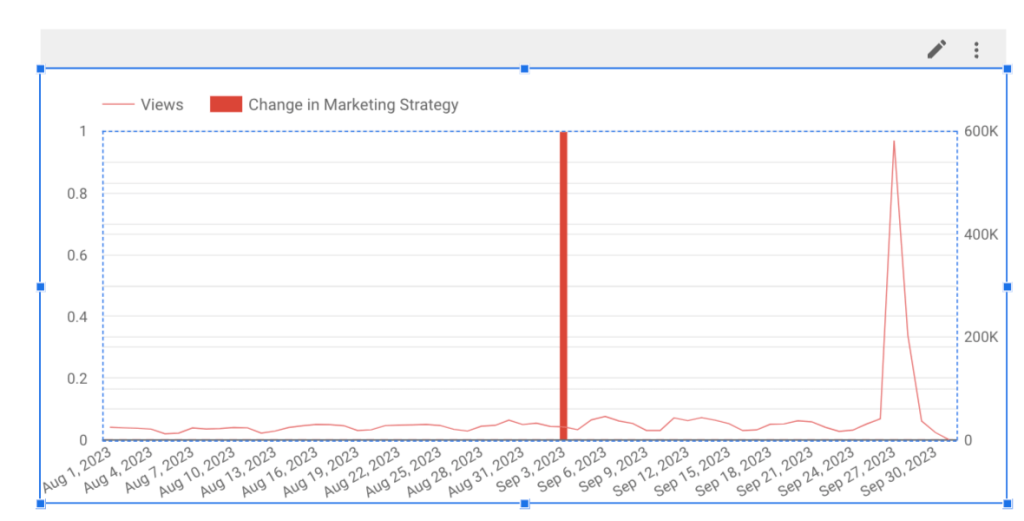
Here’s what it looks like:
Example #3: Calculate cart abandonment rate
You can perform basic to advanced calculations in Looker Studio calculated fields. They’re pretty helpful in deriving new metrics from existing ones.
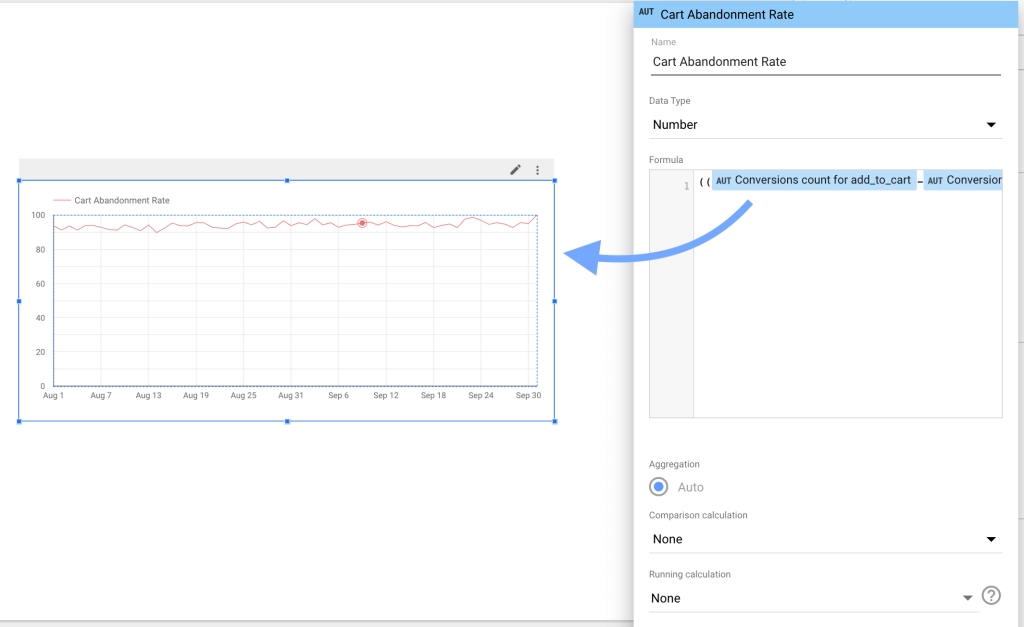
Let’s say you have metrics for the number of add-to-cart events and conversions. You can use these metrics to create a new metric for cart abandonment rate.
The cart abandonment rate is calculated as:
(Number of Abandoned Carts / Total Number of Carts) * 100
To get the number of abandoned carts, we can simply subtract the number of conversions from the number of add-to-cart events.
Here, we’ll use -, *, and / arithmetic operators along with brackets to get the cart abandonment rate.
((Conversions count for add_to_cart-Conversions count for purchase)/Conversions count for add_to_cart) * 100
Similarly, you can calculate other required metrics.
Building a custom report in Looker Studio can be time-consuming. But it doesn’t have to be. Our custom reporting templates help you quickly visualize data and get valuable insights.
Check out our library of Looker Studio reporting templates and start tracking your business performance.
Limitations of calculated fields in Looker Studio
Looker Studio calculated field offers a powerful way to get the right insights from the data. But it has some limitations:
- Metrics and dimensions can not be mixed to create a new field
- Only one type of data can be used in the calculated field formula
- You need edit access to data sources & charts to create them
The calculated fields in Looker Studio can be really difficult to manage and organize, especially when you’re working on a shared report.
Poor reporting performance is a major issue while using calculated fields in Looker Studio. They slow down the reporting since the metrics are re-calculated on each refresh. This can be a real concern when you’re working on a really large dataset.
The solution is to pre-calculate these metrics in the data source before loading.
Coupler.io solves this problem. It integrates multiple data sources with Looker Studio with a powerful data transformation tool to create custom fields. It helps you:
- Speed up reporting and overcome performance issues
- Blend data from multiple sources and create new columns
- Create custom fields using multiple metrics and dimensions
- Efficiently manage new fields through importer
It also supports data automation by refreshing reports at regular intervals. With 50+ data sources supported, including popular apps and services, you can automate data flow to Looker Studio and other destinations like Google Sheets, Excel, BigQuery, and Microsoft PowerBI. Sign up now & and get started for free.
Summary: Efficiently manage Looker Studio calculated fields
Looker Studio calculated fields can be a powerful tool to get deeper insights. In summary, here are some points to keep in mind to use them effectively:
- Use simple formulas and avoid complex expressions
- Keep the field names self-explanatory
- Do not use the same name for multiple fields
- Always remove the unused calculated fields
- Break down complete complex formulas into multiple reusable fields
That’s all about calculated fields in Looker Studio.
Automate data export from 50+ apps to Looker Studio with Coupler.io
Get started for free