
Steve MacFeely, the Director of Data and Analytics at the WHO, once mentioned that dashboards still play a hugely important role in transmitting key messages and paving data-driven decisions. Marketers at Coupler.io go along with this statement since almost any decision is based on data analysis. Which keyword to target, which campaign to launch, which article to update, etc. You can have data to drive your marketing activities as well if you use the best Looker Studio marketing dashboards.

Marketing is vast, and so are the dashboards for it. To make it simple, we have sub-categorized the Looker Studio marketing dashboards based on the data sources and their usage. So, you’ll find the best examples for analyzing PPC and social media performance, web analytics, and marketing funnel.
Best Looker Studio marketing dashboards for PPC
1. PPC multi-channel dashboard by Coupler.io
This PPC multi-channel dashboard is a perfect solution for marketers who run advertising campaigns on more than one platform. It’s a Looker Studio template meaning that you can start using it right away.

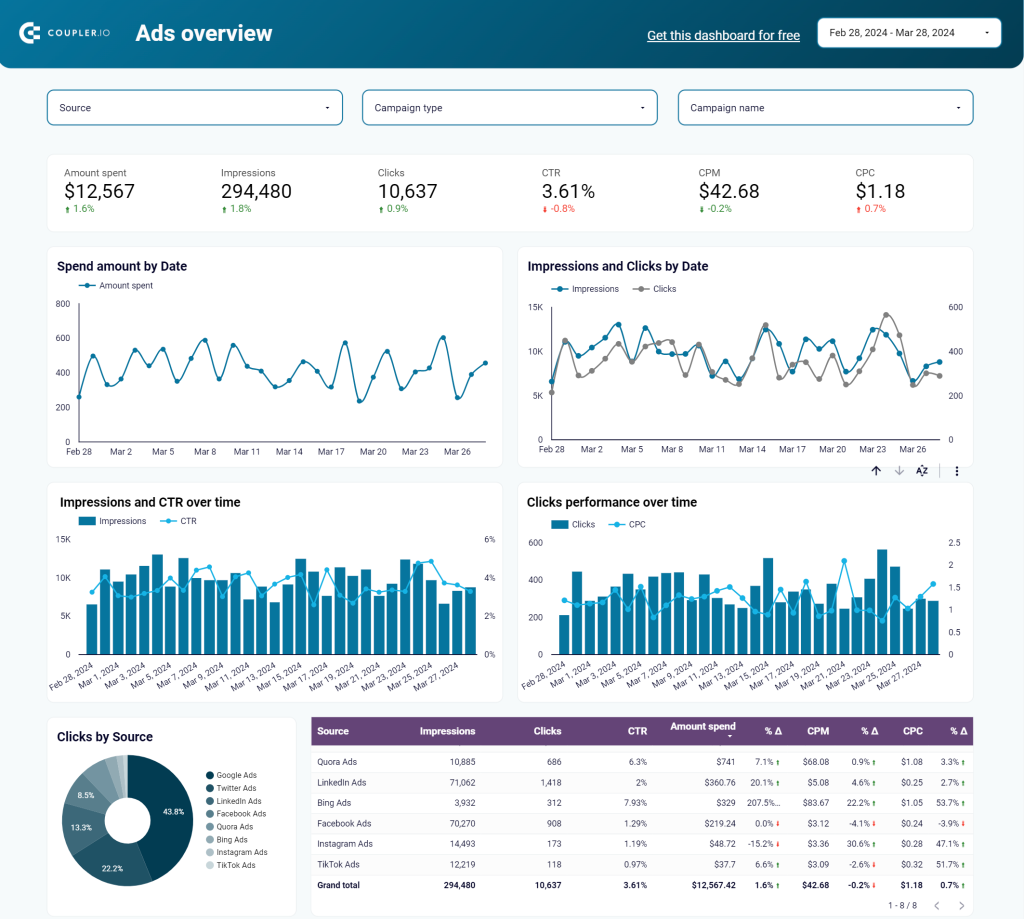
The dashboard connects to multiple ad sources, including Facebook Ads, Google Ads, LinkedIn Ads, Instagram Ads, and TikTok Ads. This way, you have an overview of all your campaigns in one place. Of course, you can only use the needed source and exclude the ones you won’t need. The setup flow takes up to 5 minutes or less if you use fewer ad data sources.
Dashboard metrics:
- Amount spent
- Impressions
- Clicks
- Click-Through Rate (CTR)
- Cost-Per-Click (CPC)
- Cost per thousand impressions (CPM), etc.
Template rating
| Integrability | ????? |
| Interactivity | ????? |
| Usability | ????? |
| Accessibility | Free |
2. Facebook Ads dashboard by Coupler.io
The Facebook Ads marketing dashboard for Looker Studio by Coupler.io provides you with a convenient way to check and share your PPC campaign performance. The dashboard template has a built-in connector to Facebook Ads. So, you won’t have to worry about exporting data and loading it to your dashboard.

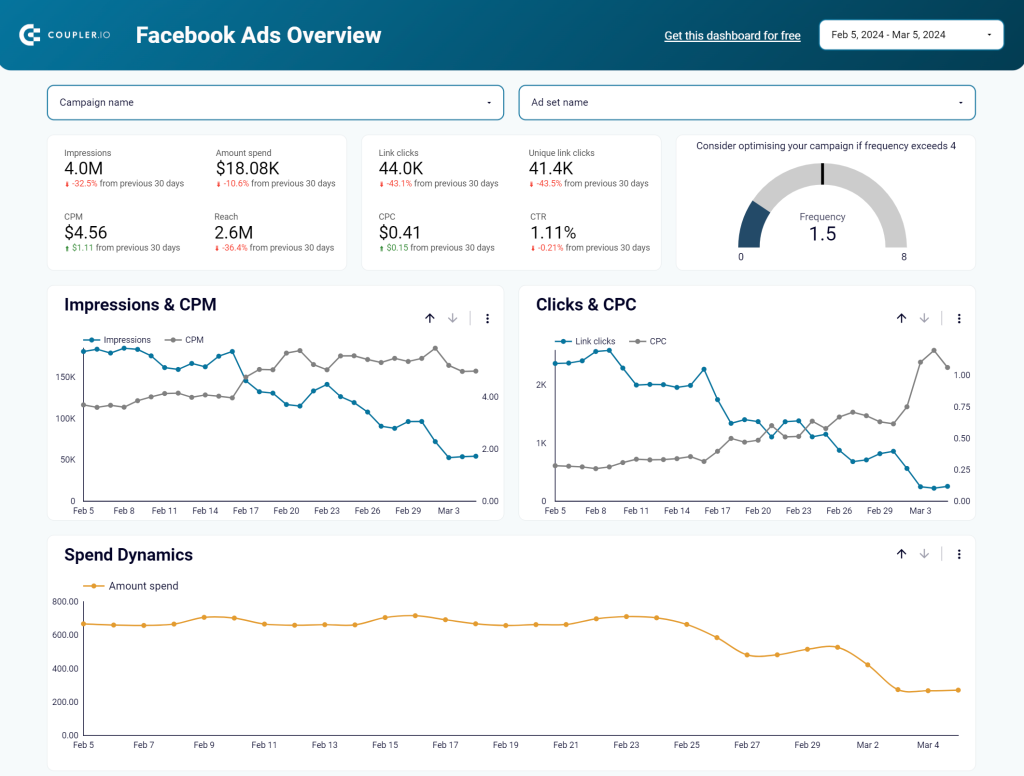
The dashboard is white-label, i.e., you can easily tune it for your brand color, add/replace metrics, and simply adjust it to your reporting requirements. It takes around 2 minutes to fork the dashboard and connect it to your Facebook Ads accounts. The template comes with instructions on how to set it up. If you need additional information on the integration, you can read this step-by-step guide to connecting Facebook Ads to Looker Studio.
Dashboard metrics:
- Impressions
- Link clicks
- CPM
- CPC
- CTR
- Frequency
- Reach
- Amount spend
- Unique link clicks
Template rating
| Integrability | ????? |
| Interactivity | ????? |
| Usability | ????? |
| Accessibility | Free |
3. Google Ads dashboard by Coupler.io
Want to make sure that your paid ads on Google are performing well and also share the results with your managers or clients? Coupler.io offers a free Looker Studio dashboard for Google Ads that allows you to track your ads performance. This dashboard template provides insights about your most valuable metrics such as clicks, conversions, CPA, CPC, click-through rate, and so on.

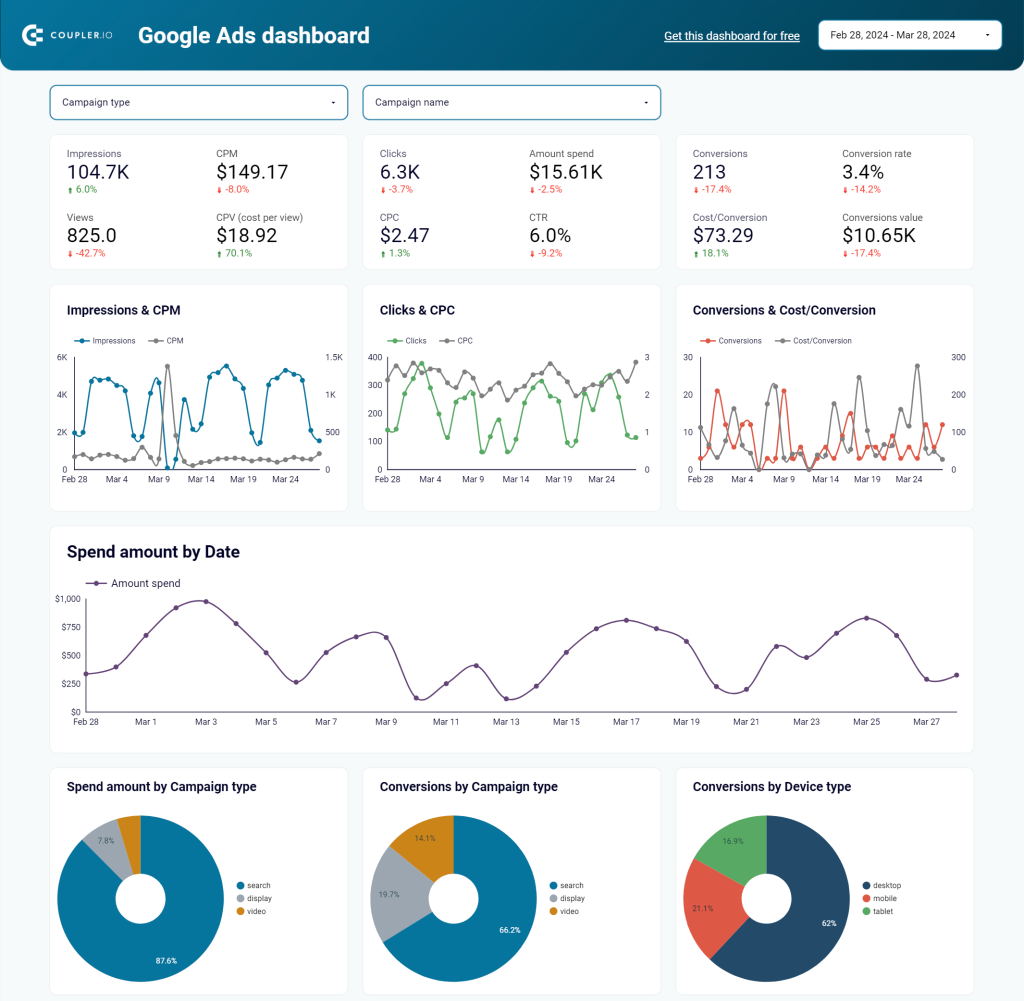
The template has an integrated Google Ads connector by Coupler.io that makes the dashboard self-update on a schedule you set out. Just like the dashboard for Facebook ads, the Google Ads one can be customized to your reporting needs. At the same time, if this dashboard is not enough for you or you’d like to build your own one from scratch, here’s a step-by-step guide on how to connect Google Ads to Looker Studio.
Dashboard metrics:
- Impressions
- Clicks
- CTR
- Average Cost-per-Click
- Conversions
- Cost per conversion
- Cost per thousand impressions (CPM), etc.
Template rating
| Integrability | ????? |
| Interactivity | ????? |
| Usability | ????? |
| Accessibility | Free |
4. LinkedIn Ads dashboard by Coupler.io
This LinkedIn Ads dashboard template is a decent analytics tool to monitor the performance of your advertising campaigns on LinkedIn. The set of key metrics is similar to what the dashboards above have: amount spent, clicks, CPC, and others. However, you will also get information about leads and lead form opens.

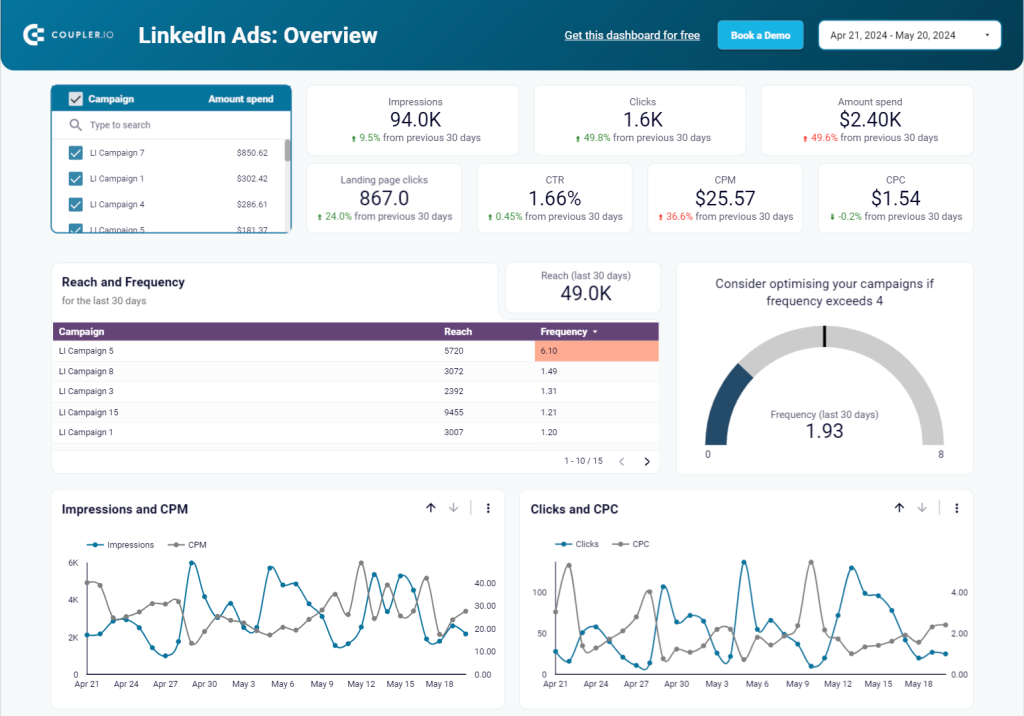
Any dashboard designed by Coupler.io has a built-in Looker Studio connector. So, you’ll only need to connect your LinkedIn account, and Coupler.io will create a data source in Looker Studio. Set a desired schedule and enjoy the up-to-date information on your marketing dashboard.
Dashboard metrics:
- Impressions
- CPM
- Amount spend
- Clicks
- CPC
- CTR
- Conversions
- Conversion rate
- Lead form opens
- Leads
- And others
Template rating
| Integrability | ????? |
| Interactivity | ????? |
| Usability | ????? |
| Accessibility | Free |
5. Facebook Ads and brand awareness dashboard
Individual or multi-channel PPC dashboards are only limited to analyzing PPC campaign performance. The Facebook Ads and brand awareness dashboard is perfect for comparing PPC and brand awareness campaigns. It’s especially useful if you run awareness Facebook Ad campaigns and want to see their effect on Google SERPs.

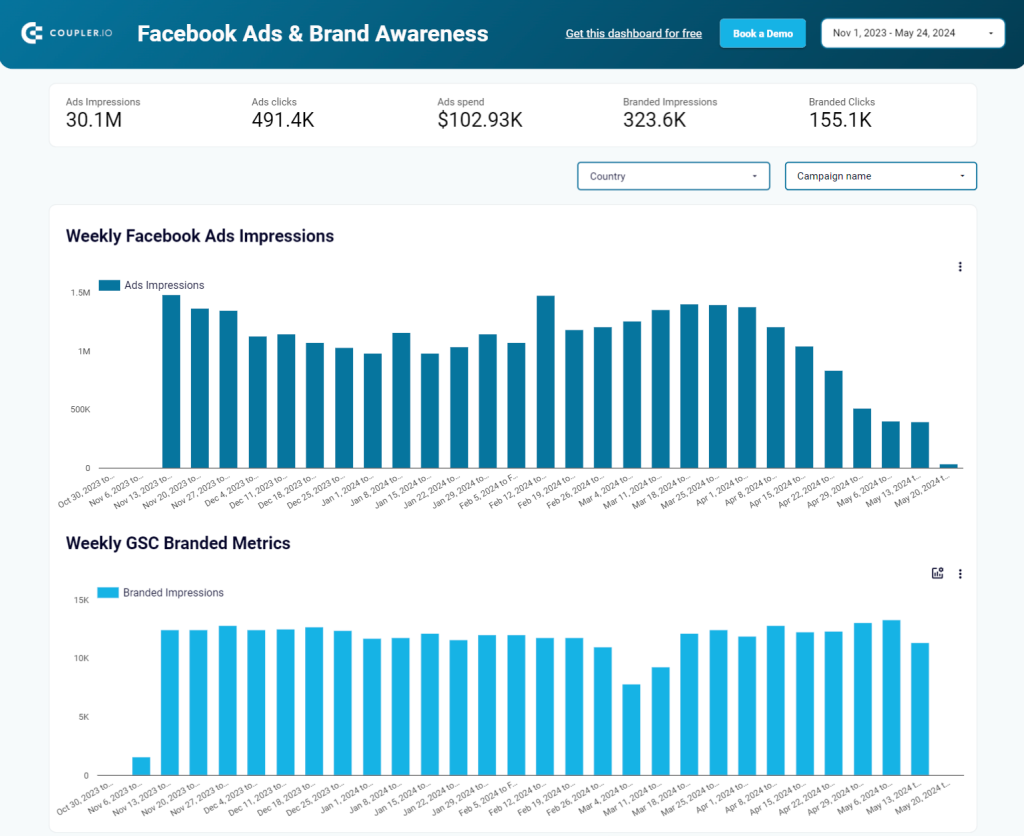
This dashboard collects data from Facebook Ads and Google Search Console and compares results in the form of interactive bar charts. You can select specific Facebook ad campaigns to check how the overall branded impressions and clicks correlate with branded search results. It is useful for optimizing ad spend, refining strategies, and boosting brand visibility.
To use this dashboard by Coupler.io, follow the steps in the Readme tab.
Dashboard metrics:
- Ads impressions
- Ads spend
- Ads clicks
- Branded impressions
- Branded clicks
Template rating
| Integrability | ????? |
| Interactivity | ????? |
| Usability | ????? |
| Accessibility | Free |
6. All-in-one marketing dashboard
The all-in-one marketing dashboard provides a unified view of your marketing efforts across various channels. It integrates data from Google Analytics, Google Search Console, ad platforms, social media, email tools, and YouTube.

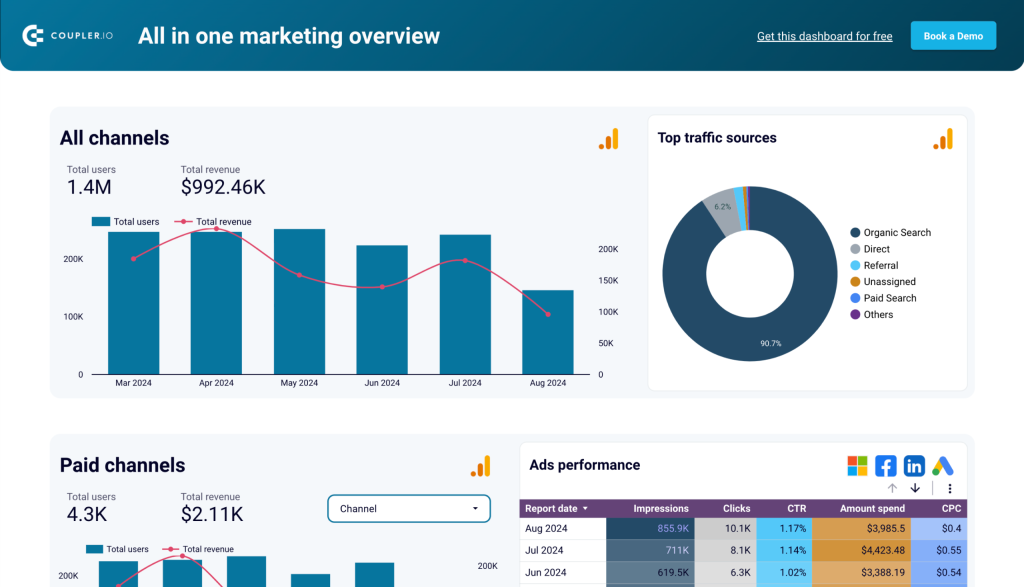
Using this dashboard, you can track the performance of paid ads, organic searches, social media interactions, and email campaigns in a single interface.
Follow the instructions inside the template to connect your accounts and proceed to actionable data insights.
Dashboard metrics:
- Ad performance: impressions, clicks, CTR, amount spent, CPC
- Google search performance: impressions, clicks, CTR, average position
- Social media performance: impressions, page views
- YouTube performance: views, minutes watched, engagements
- Email performance: emails delivered, open rate, bounces, unsubscribes, clicks
Template rating
| Integrability | ????? |
| Interactivity | ????? |
| Usability | ????? |
| Accessibility | Free |
7. Instagram dashboard for SMM reporting by Coupler.io
You can easily track the performance of your Instagram social media activities with this interactive social media dashboard. It provides insights into your audience demographics, profile interactions, and reach of your Instagram posts.

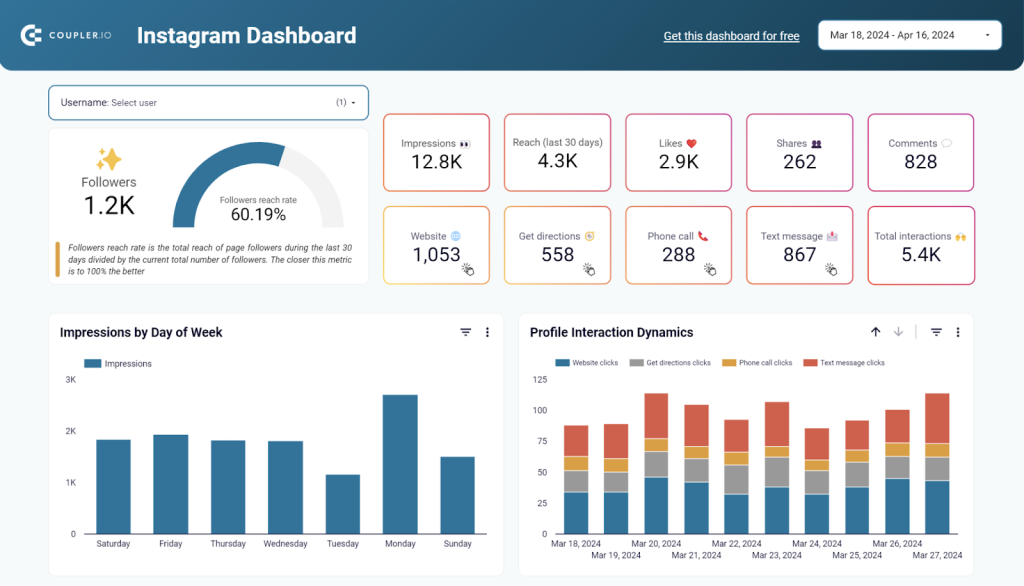
Since this Instagram SMM dashboard is designed by Coupler.io, you can start using it without any hassle. All you need to do is connect your Instagram account to populate the dashboard with your data. It takes no more than 3 minutes to get a ready-to-use report at your fingertips.
Dashboard metrics:
- Followers
- Impressions
- Reach
- Likes
- Shares
- Comments
- Website clicks
- Get direction clicks
- Phone call clicks
- Text message clicks
- Total number of interactions
Template rating
| Integrability | ????? |
| Interactivity | ????? |
| Usability | ????? |
| Accessibility | Free |
8. YouTube dashboard by Coupler.io
In our selection of the best marketing dashboards in Looker Studio, we included this YouTube dashboard template. It provides a complete overview of your YouTube channel performance and three reports for subscribers, reach, and traffic sources.
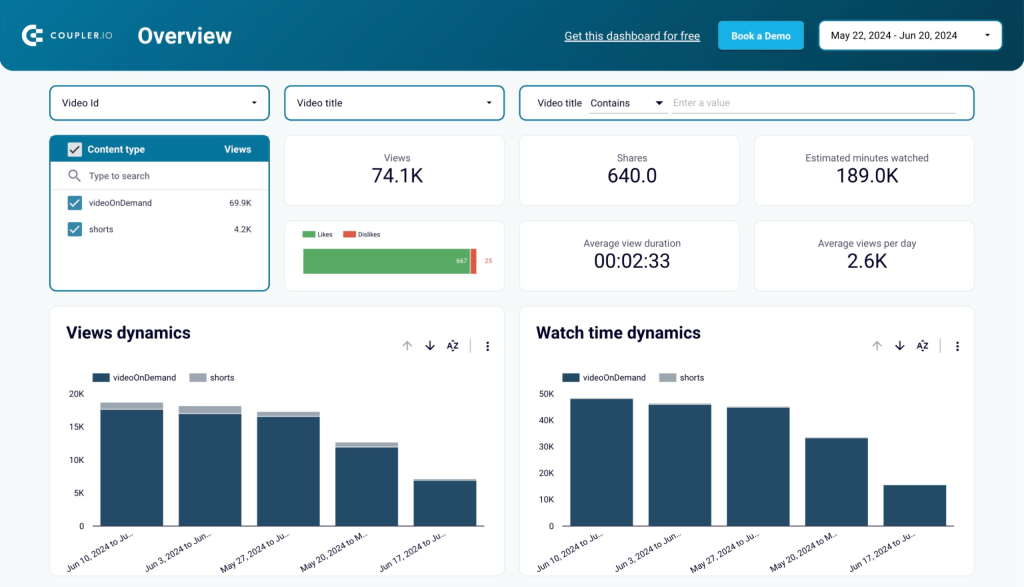
The dashboard displays insightful information about video performance, viewer engagement, and content strategy. It loads data from YouTube analytics using the built-in connector. It is one of the influencer marketing dashboards by Coupler.io, and it allows you to monitor channel dynamics, analyze audience segments, and drill down into every video’s performance on your channel.
Dashboard metrics:
- Views
- Likes/dislikes
- Shares
- Average view duration
- Average views per day
- Subscribers gained/lost, etc.
Template rating
| Integrability | ????? |
| Interactivity | ???? |
| Usability | ????? |
| Accessibility | Free |
9. TikTok dashboard
If you want to grow on TikTok, this dashboard is a must-have. It visualizes every crucial TikTok metric in an intuitive and interactive way.

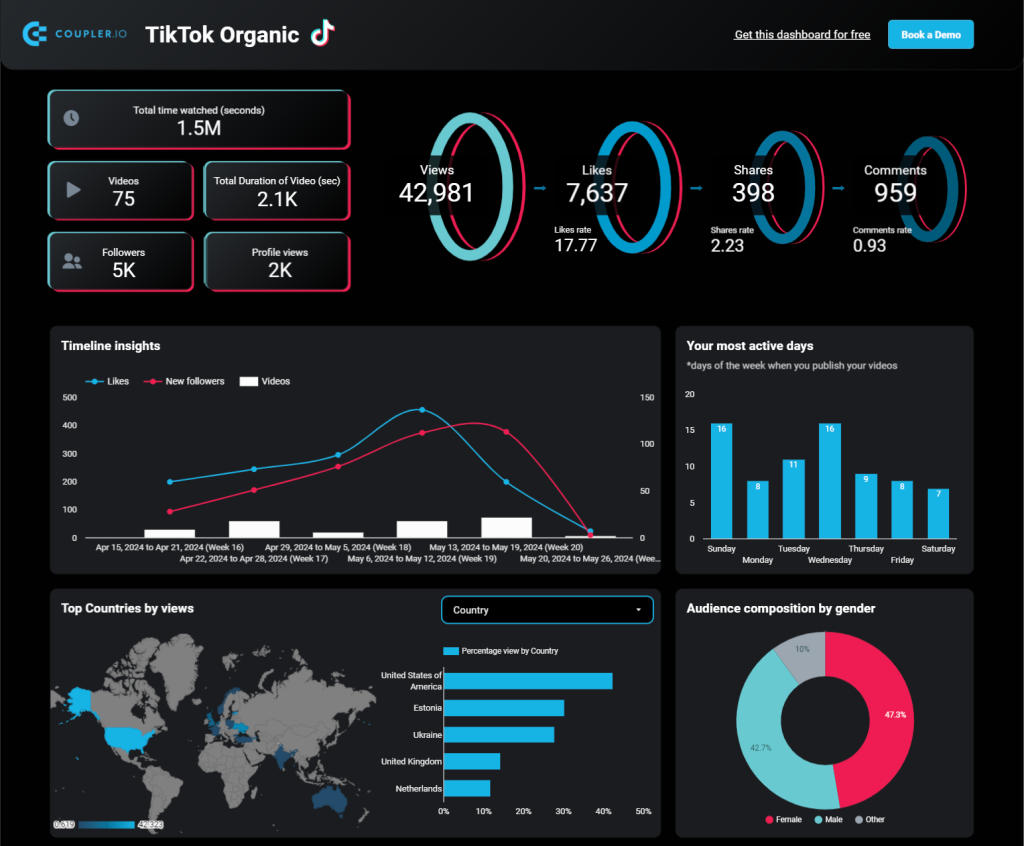
The TikTok dashboard highlights key metrics like watched hours, videos posted, followers, and profile views. The engagement funnel shows total views, likes, shares, and comments, resembling an acquisition funnel. This helps you understand engagement on the platform.
The timeline graph shows which videos bring in the most followers or likes so you can focus on similar content. These insights help to create a better content strategy and grow on the platform.
To use this Coupler.io dashboard for your TikTok account, follow the simple instructions in the Readme tab.
Dashboard metrics:
- Total time watched
- Video
- Total duration of videos
- Followers
- Profile views
- Views and views by country
- Likes, comments, and shares
- Active days
Template rating
| Integrability | ????? |
| Interactivity | ????? |
| Usability | ????? |
| Accessibility | Free |
Use this dashboard to overview the performance of major social media platforms: Facebook, Instagram, LinkedIn, and YouTube.
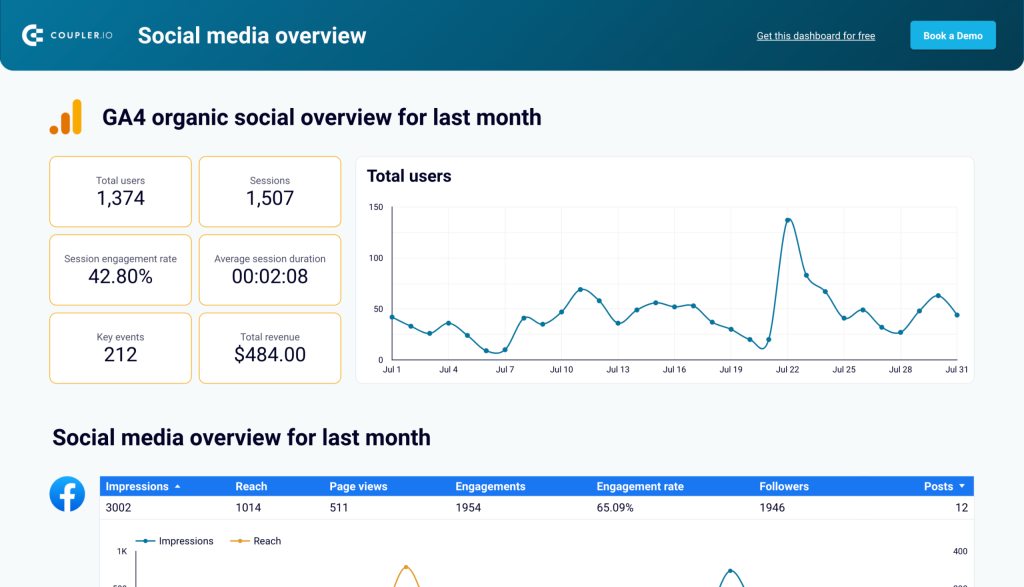
With integrated data from GA4, you can analyze how these social channels contribute to your website traffic and total results. Additionally, the dashboard provides insights into last month’s dynamics for each platform.
To get started, follow the instructions inside the template to connect your social media accounts and dive into analytics.
Dashboard metrics:
- Total users
- Impressions, reach
- Page views, video views
- Engagement rate
- Followers
- Posts
- Total revenue, etc.
Template rating
| Integrability | ????? |
| Interactivity | ????? |
| Usability | ????? |
| Accessibility | Free |
Web analytics dashboards in Looker Studio
11. SEO dashboard for Google Search Console by Coupler.io
It makes sense to have a dedicated Looker Studio dashboard for SEO to track and understand your SEO performance. For this, you can try this dashboard template for Google Search Console.

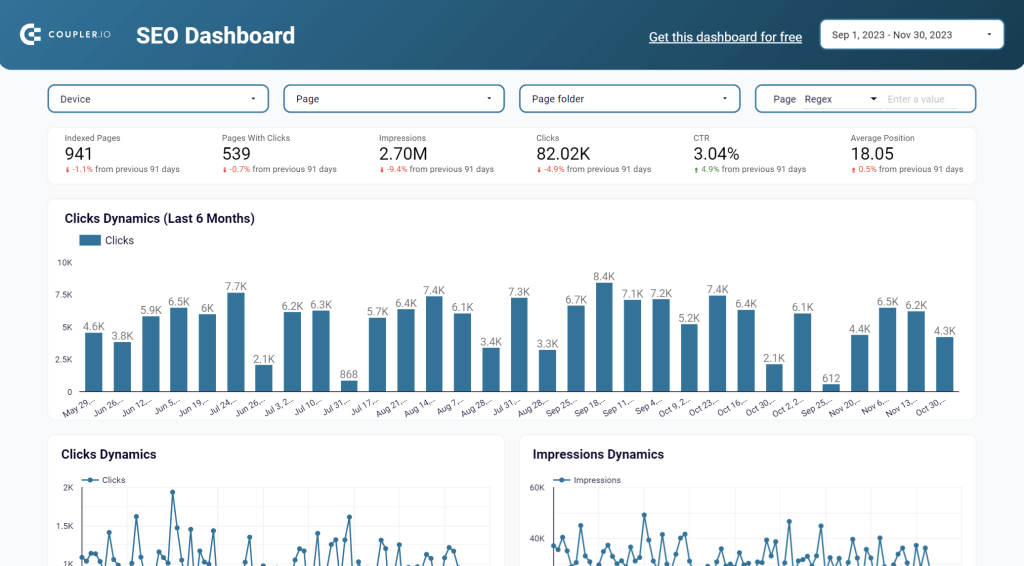
It’s designed to answer many questions such as how many indexed pages you have, which pages have clicks, what are the best and worst performing pages, etc.
You can connect the template to your GSC account using the integrated connector and start using the dashboard right away. It will take around 2 minutes to obtain a valuable SEO report with ease.
Dashboard metrics:
- Indexed pages
- Pages with clicks
- Impressions
- Clicks
- CTR
- Average position
- Click dynamics
- Best and worst performing URLs, etc.
Template rating
| Integrability | ????? |
| Interactivity | ????? |
| Usability | ????? |
| Accessibility | Free |
12. Web Analytics dashboard by Coupler.io
Google Analytics is the single source of truth for all your website performance data. The Web Analytics dashboard by Coupler.io visualizes the data from GA4 so you can derive better insights from it.

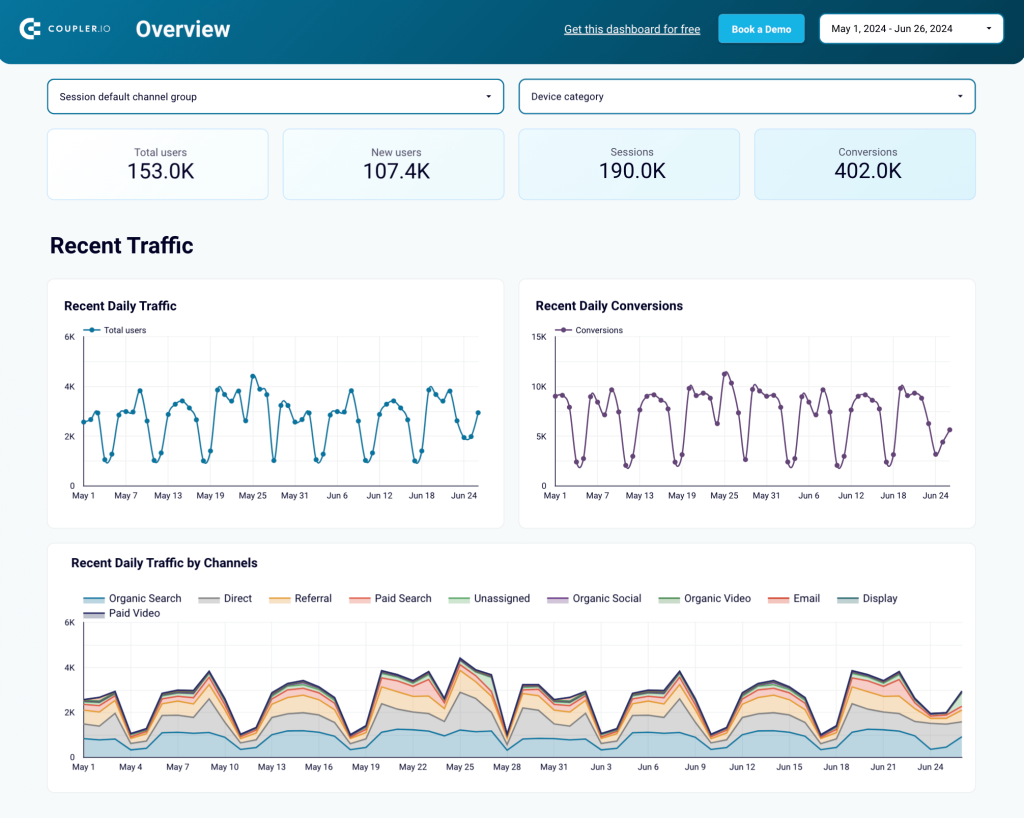
It has four pages dedicated to different areas of website performance: Overview, Acquisition, Behavior & Audience, and Conversion.
- Overview: Shows overall traffic and its sources on a monthly and weekly basis.
- Acquisition: Details the sources of your traffic, such as organic search, direct visits, and referrals.
- Behavior & Audience Page: Displays user behavior on your site and demographic information.
- Conversion Page: Tracks conversions, showing how users complete desired actions on your site.
This dashboard is your one-stop shop for all your web analytics needs. To use this template for your website, follow the steps in the Readme tab.
Dashboard metrics:
- Total users and new users
- Sessions
- Conversions
- Traffic
- Conversion rate
- Total purchases
- Total revenue
- Views
- Demographics
Template rating
| Integrability | ????? |
| Interactivity | ????? |
| Usability | ????? |
| Accessibility | Free |
13. GA4 dashboard for multiple properties
The Google Analytics dashboard is perfect for managing multiple websites or apps and tracking the performance of different GA properties in one place.

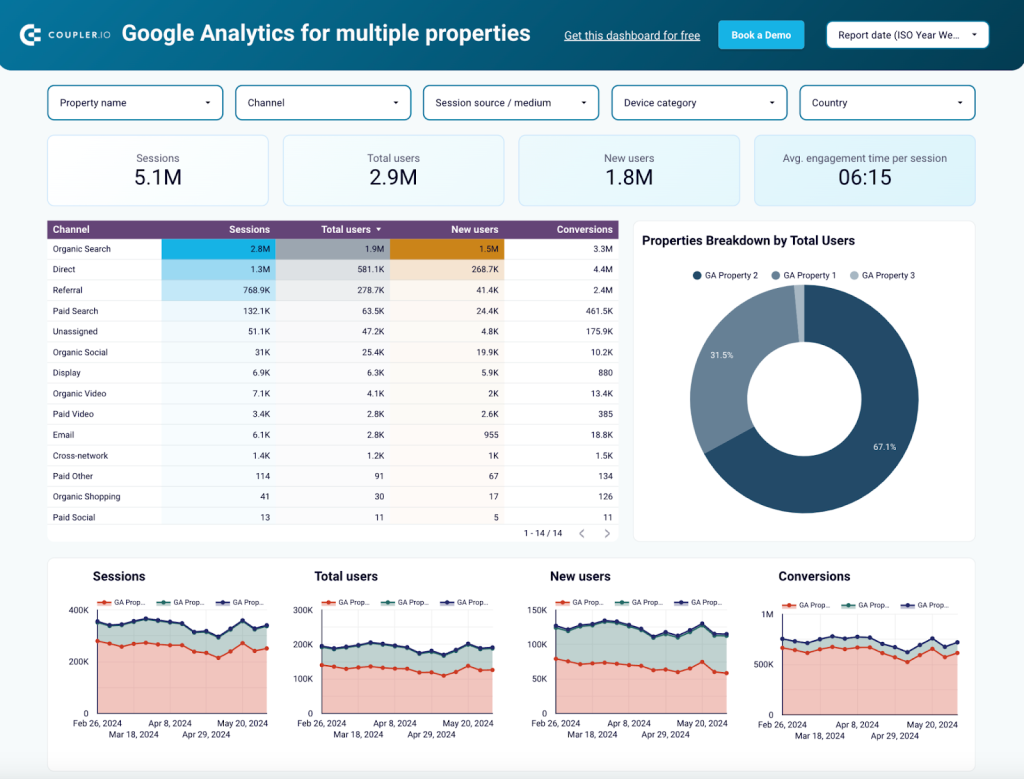
It tracks sessions, users, conversions, and average engagement time. You can analyze the traffic sources to see where users come from.
With this dashboard, it is easy to understand user behavior and engagement metrics to know which channels work best. You can use this template with your own data in minutes by following the steps in the Readme tab.
Dashboard metrics:
- Total users and new users
- Sessions
- Traffic
- Average engagement time per session
Template rating
| Integrability | ????? |
| Interactivity | ????? |
| Usability | ????? |
| Accessibility | Free |
14. Digital Analytics Dashboard for eCommerce by Treffsikker
How is your eCommerce performing? Discover with the help of this Looker Studio dashboard. The digital analytics dashboard provides valuable insights into the performance of your online store. Some of the metrics included in the template are Revenue, eCommerce Conversion rate, Transactions, and Sessions.

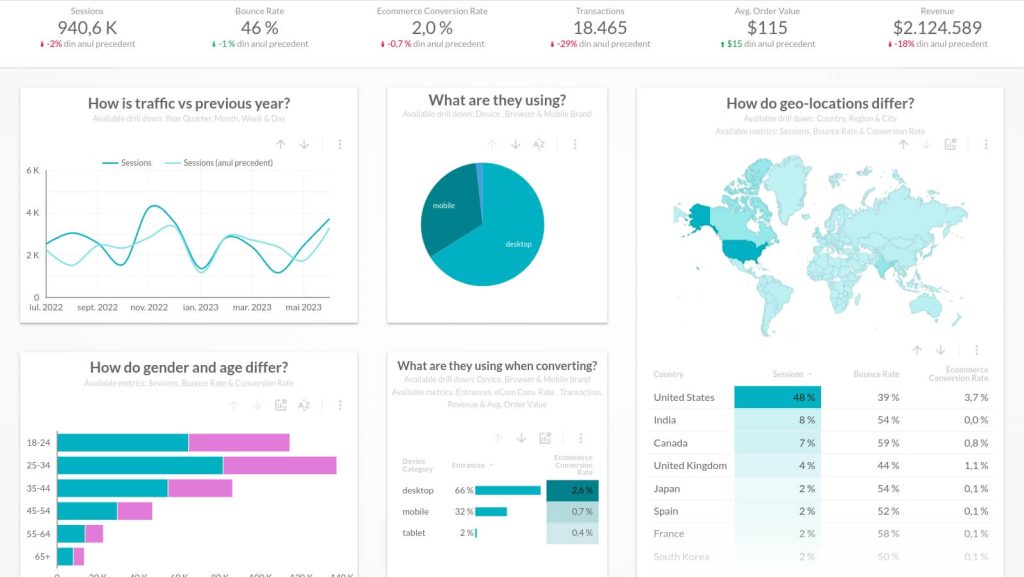
The dashboard has 4 pages: users, traffic, behavior, and conversions. On each page, you’ll find answers to questions associated with your different marketing activities, for example, how do channels perform, which product is most visited, how are the campaigns performing, etc.
Dashboard metrics:
- Sessions
- Bounce rate
- Conversion rate
- Transactions
- Average order value
- Revenue
Template rating
| Integrability | ? |
| Interactivity | ??? |
| Usability | ???? |
| Accessibility | Free |
15. Google Analytics for Firebase Report by Google
Firebase is a platform that helps you create and grow apps. At the heart of Firebase is Google Analytics, which integrates across Firebase features and provides you with unlimited reporting. This Looker Studio dashboard for Firebase is designed to present some of these reports using the power Looker Studio data visualization.

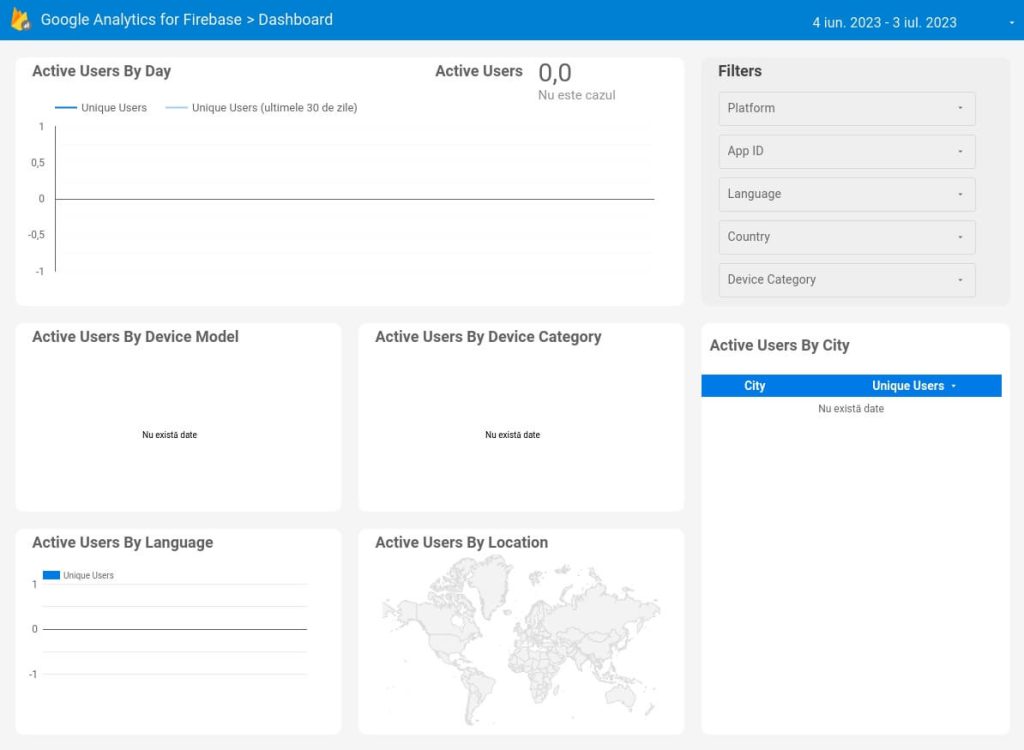
The dashboard has 4 pages: dashboard, events, users, and conversions. You can easily use this dashboard template for your data since it’s equipped with a built-in native BigQuery connector. Mind that this will only work if you have linked your Firebase project to BigQuery.
Dashboard metrics:
- Active users
- Events
- Conversions
- Users
Template rating
| Integrability | ????? |
| Interactivity | ????? |
| Usability | ???? |
| Accessibility | Free |
16. Site Speed Performance Dashboard by DataBloo
Did you know that 40% of visitors will leave a website if it takes longer than three seconds to load? This shows that website performance is not just about how many people visit it but also about how fast it loads and if it has any indexing problems.

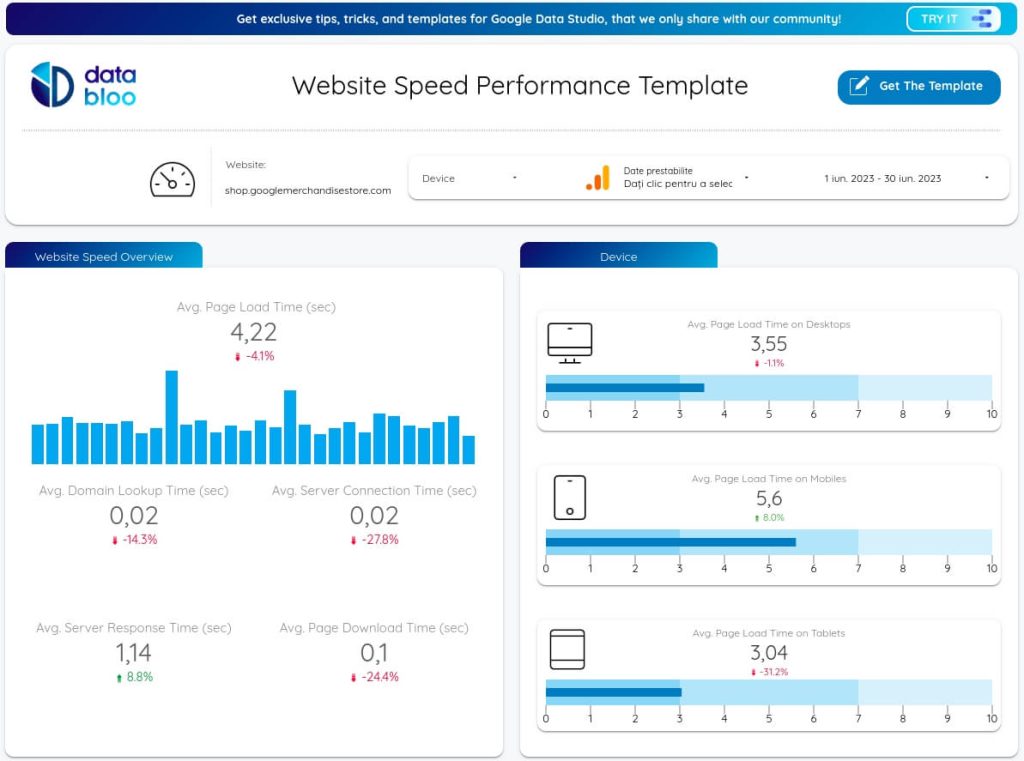
If you want to make sure that your site loads at the speed of light, then you should check out this site speed performance dashboard by Data Bloo. It’s a template, so you can easily reuse it without handling the connection part yourself. It has a connector to Google Analytics which contains all the necessary information for this dashboard.
Dashboard metrics:
- Avg. Page Load Time
- Average Domain Lookup Time
- Avg. Server Connection Time
- Avg. Page Download Time
- Avg. Page Load Time on Mobiles
Template rating
| Integrability | ????? |
| Interactivity | ???? |
| Usability | ????? |
| Accessibility | Free |
Marketing funnel dashboards in Looker Studio
17. Shopify marketing funnel analytics dashboard
The Shopify marketing funnel dashboard tracks your marketing efforts and sales funnel performance. It highlights key metrics like the amount spent, revenue, orders, and ROI. The acquisition funnel intuitively visualizes the journey from ad impressions to new customers.

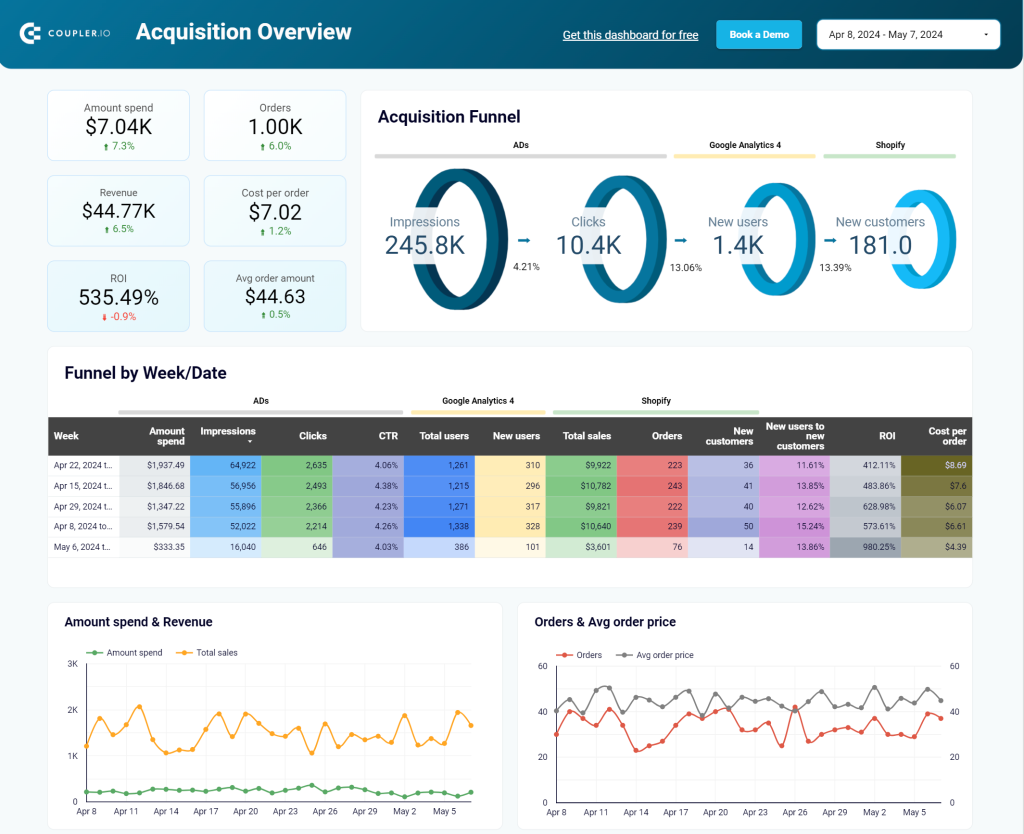
The weekly data for impressions, clicks, total users, and new users helps you understand how ad spending translates into sales. With the insights from this Shopify dashboard, you’ll be able to make data-driven decisions and boost your ecommerce store’s performance.
You can use this template to make a dashboard with your own data. Just follow the steps in the Readme section.
Dashboard metrics:
- Amount spend
- Orders
- Revenue
- Cost per order
- ROI
- Avg. order amount
- Impressions
- Clicks
- Conversions
Template rating
| Integrability | ????? |
| Interactivity | ????? |
| Usability | ????? |
| Accessibility | Free |
18. Customer acquisition dashboard for Pipedrive
The Pipedrive customer acquisition dashboard tracks your marketing funnel from ad impressions to new leads. It shows key metrics like cost per lead, impressions, clicks, and new users.
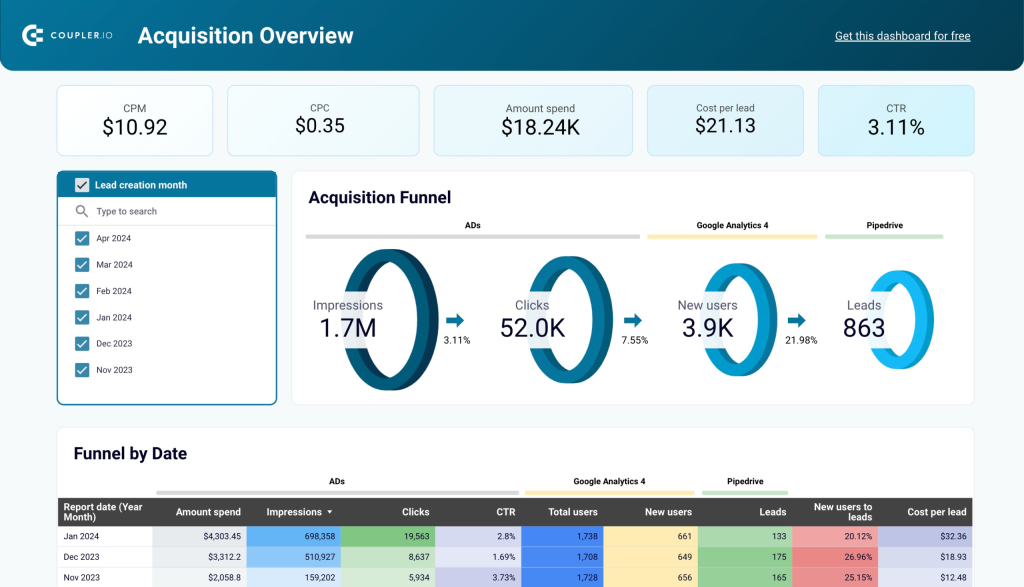
The monthly data table for impressions, clicks, total users, and new users shows how advertising efforts translate into new leads.
The trends in ad spend, conversion rates, and cost per lead help to keep the budget in line with performance. This dashboard is useful to make data-driven decisions, boost customer acquisition efforts, and improve ROI.
If Pipedrive is your go-to sales and CRM tool, then use this dashboard template with your data in minutes.
Dashboard metrics:
- CPM
- CPC
- Amount spend
- Cost per lead
- CTR
- Impressions
- Clicks
- Leads
Template rating
| Integrability | ????? |
| Interactivity | ????? |
| Usability | ????? |
| Accessibility | Free |
19. HubSpot customer acquisition dashboard
The HubSpot customer acquisition dashboard helps you track and analyze your customer acquisition process using the HubSpot data. You can see how much you spend and the cost per lead, SQL, and customer.
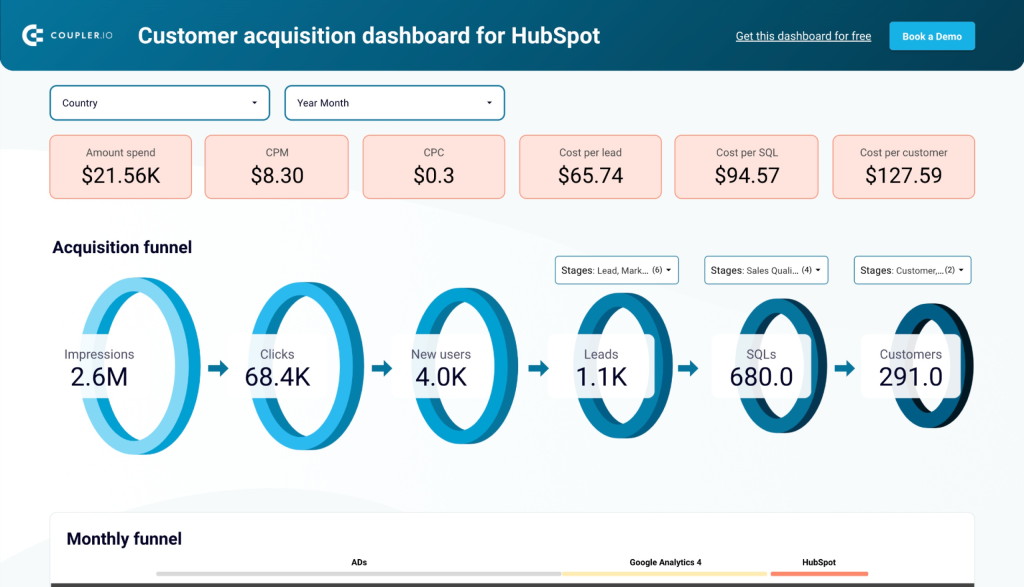
It displays key metrics like impressions, clicks, new users, leads, SQLs, and customers. The monthly and geographic data show you where your efforts are most effective. This dashboard is ideal for understanding your marketing performance, optimizing sales processes, and improving ROI.
Use this dashboard template with your own data by following the simple steps in the Readme tab.
Dashboard metrics:
- CPM
- CPC
- Amount spend
- Cost per lead
- Cost per SQL
- CTR
- Impressions
- Clicks
- Leads
- Conversions
Template rating
| Integrability | ????? |
| Interactivity | ????? |
| Usability | ????? |
| Accessibility | Free |
Benefits of using marketing reporting dashboards in Looker Studio
Why Looker Studio and not another option? Why use a pre-made marketing reporting dashboard? Well, because there are a lot of advantages compared to creating your manual reports from scratch.
- Better data visualization: Most Looker Studio marketing reporting dashboards come with graphs, charts, and other data visualization elements that will make your report easy to understand and share with stakeholders or managers.
- Easy to use: All of the templates we are going to share are configured and include the most important metrics you need to monitor for each activity or channel. All you will have to do is to use your own data. This means connecting your source (Google Analytics, YouTube, Google Spreadsheets, Facebook Ads, etc.) to Looker Studio so that the data can be exported and modified.
- Customizable: Don’t need all of the metrics showcased? No worries, you can make changes to the marketing reporting dashboard to suit your needs better.
- Collaboration and Shareability: Looker Studio reporting dashboard can be shared with your manager or clients. Also, your co-workers can have access to them so that they can add their own insights and data.
- Free and fast: Most of these Looker Studio templates are free to use, while for some you just need to pay a monthly subscription that is budget-friendly. However, it is worth it considering that it will take you a few minutes to add your data instead of spending hours collecting and introducing data manually.
Convinced? Let’s take a look at the best Data Studio templates.
Best practices for marketing reporting dashboards in Looker Studio
Want to use one of the examples we’ve added above? We’ve prepared a few best practices you should consider before getting started.
- Check the metrics: The whole meaning of using a reporting dashboard is to have a clear overview of the most important metrics and KPIs for your campaigns. While you might like the design of any of the marketing reporting dashboards presented, you will need to check and see if they include all of the metrics you want to monitor and analyze.
- See if the template is free: Check to see if the dashboard is free to use or if it is just a demo. Some of the dashboards are just demos, so you have limited content that you can use.
- Read the instructions: These dashboards usually come with a few instructions on how to use them. The dashboards from Coupler.io also show you how to automatically extract data from Facebook Ads or Google Ads directly to Looker Studio. This way, the report will be updated automatically, on a schedule.
- Customize the report: Don’t forget to add your branding assets such as your logo to the report to make it your own. It will make the report ready to share with stakeholders.
How to create marketing reporting dashboards in Looker Studio
Want to create your own report from scratch? No worries, we’ve prepared a short step-by-step tutorial that will help you make dashboards and reports in Looker Studio like a pro.
- Open Looker Studio and select the account you want to use. Then, select Blank Report.
- Looker Studio will ask you to choose one of its connectors from which you want to import data. For this example, we are going to use Coupler.io to export data from Hubspot. Before we get started with the connector, let’s configure the export from Hubspot to Looker Studio so that you can schedule exports and benefit from real-time data.
- Please log in to your Coupler.io account and add a new importer. Select Hubspot as a source and Looker Studio as the destination.

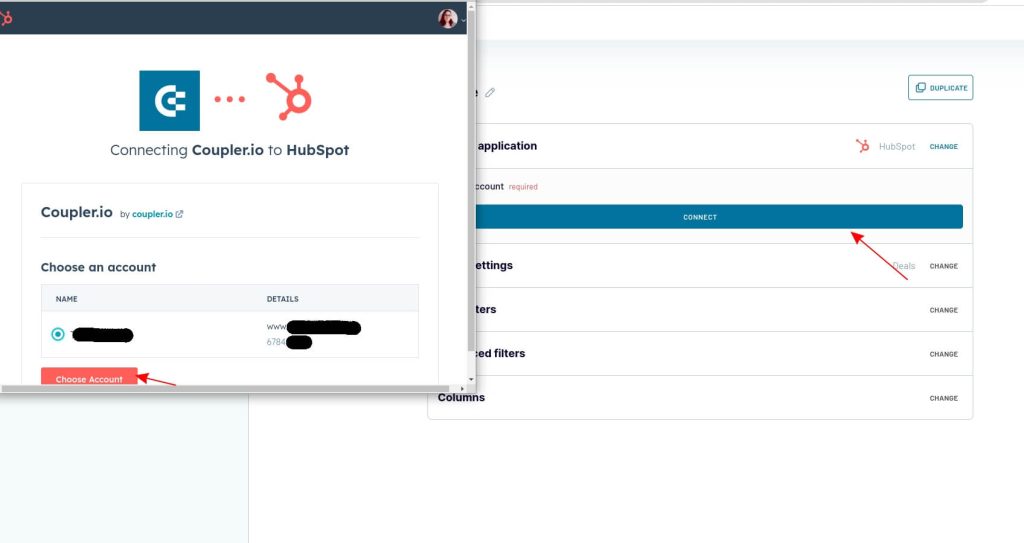
- You will need to authorize Coupler.io’s access to Hubspot data. Select an account and offer permissions to Coupler.io to allow this export.

- Select the data entity you want to export from Hubspot. For this example, we selected “Contacts”.

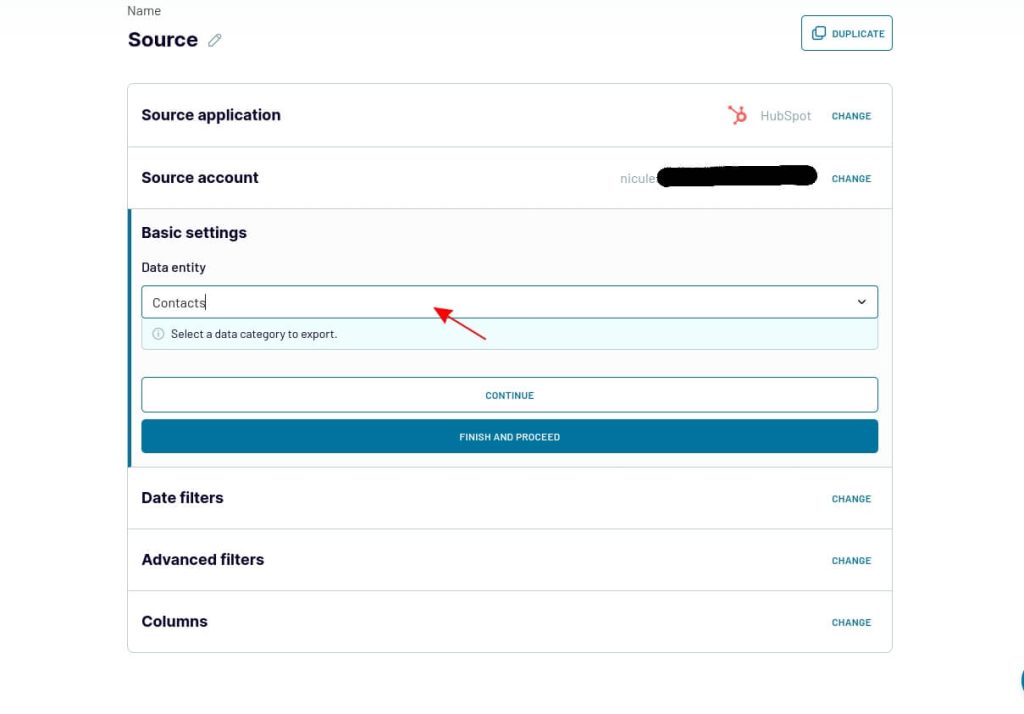
- You can click finish and proceed if you don’t need to add date filters and other advanced filters. Next, you will need to set up the destination.
- Generate an access token if you did not do that earlier and copy it. Click the button to create a data source in Looker Studio and follow the instructions.
- Authorize Looker Studio and Coupler.io’s connection. After this, you will be able to complete the connection between Coupler.io and Looker Studio. The data you’ve selected will be added to Looker Studio.

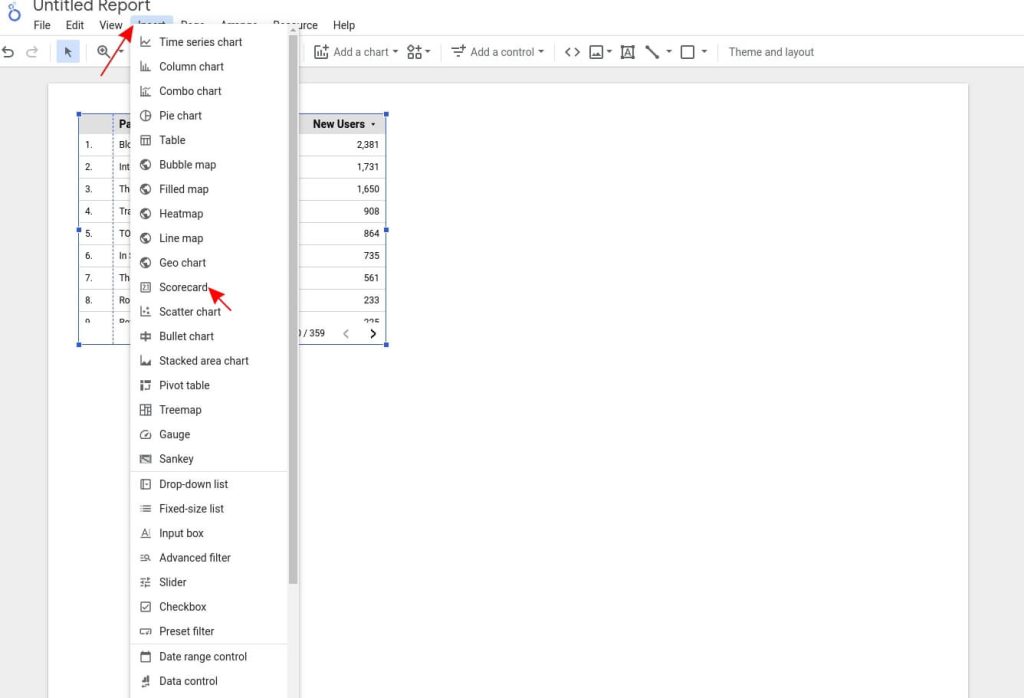
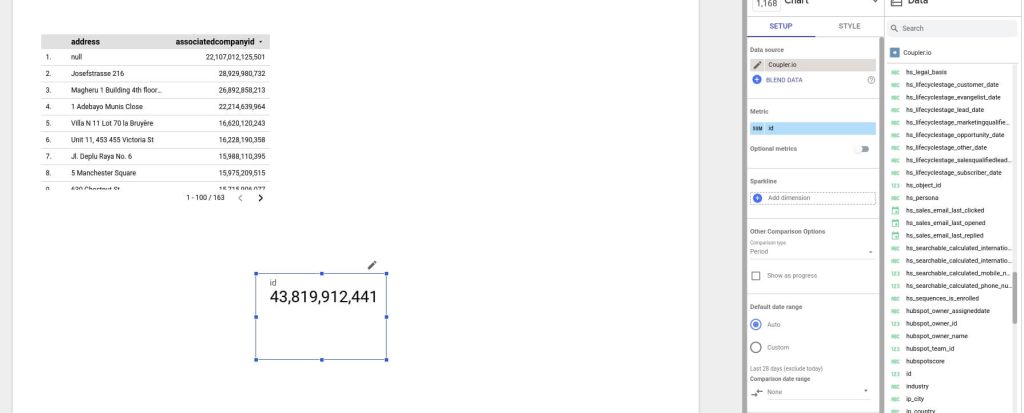
- After your analytics data is pulled from Hubspot, it’s time to add some scorecards. Click on Insert, and a dropdown menu will appear from which you can select the scorecard.

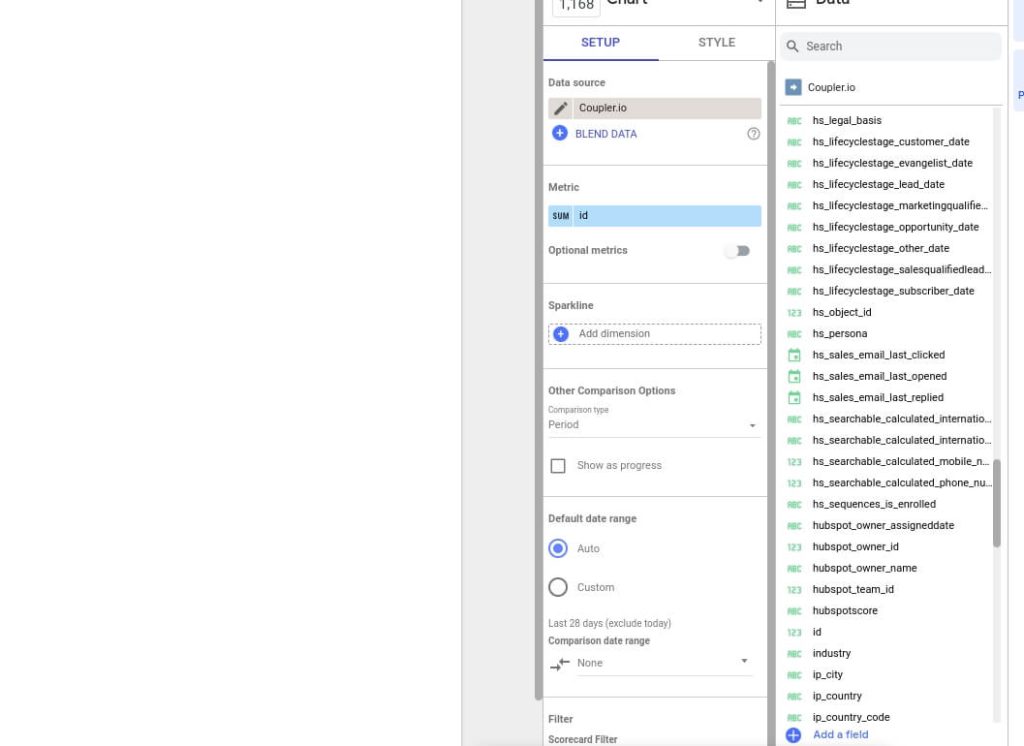
- Once you have selected the scorecard and placed it on your dashboard, you just need to select the right metric. For this example, we used “ID”.

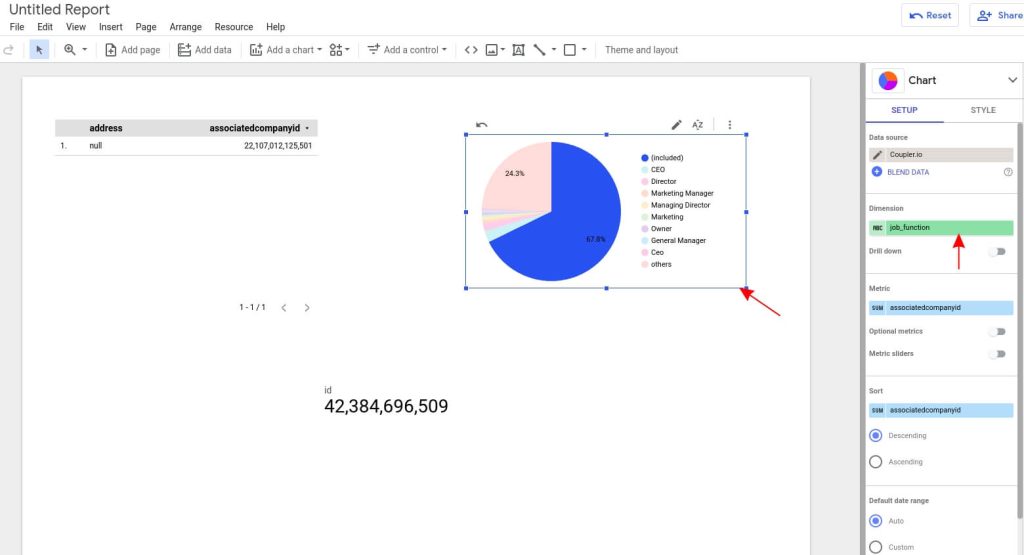
- To make data easier to analyze, you will need to add some data visualization elements like graphs. Click on Insert once again and add the chart.
- We’ve added a pie chart. Now, select the metric you want to display. For this example, we selected “Job Function” to see the jobs of our contacts and make a comparison.

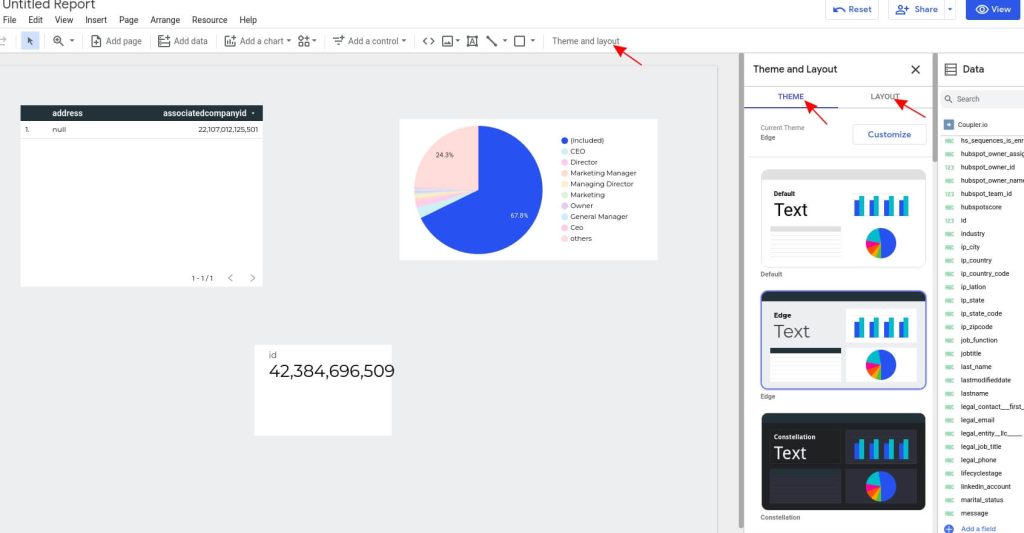
- It’s time to make this dashboard your own. You can style it just the way you like. To do so, you will need to click on Theme & Layout and select what you like.

That’s it! Now, you can add the scorecards, graphs, and charts you need to showcase your data better. Click on View to see your dashboard. Here’s how ours looks:

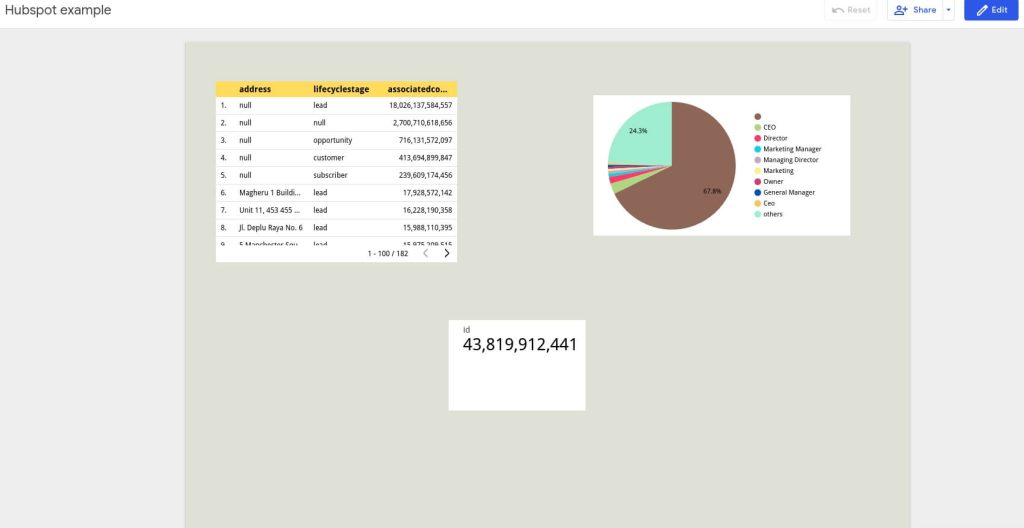
Also, don’t forget to give a name to your report and add all of the branding elements necessary such as a logo. Personalize the dashboard and share it with stakeholders, managers, or co-workers.
Should you use dashboard templates or create marketing reports in Looker Studio from scratch?
If you want to make sure that your marketing efforts are not in vain, then you should monitor and analyze the most relevant metrics for your marketing campaigns. There are hundreds of ready-to-use templates that you can choose from in Looker Studio.
The templates that we included in the article focus on the most important metrics for each marketing strategy. However, if you need an in-depth report, then you might need to create a custom dashboard. Creating a Looker Studio dashboard from scratch can be a bit challenging. However, it allows you to have a tailored report where you can include any metric you need.