Most organizations use dozens of apps – be it for running a cross-channel ad campaign, bringing together sales data from different stores, or just for keeping track of projects. So, it’s often necessary to include quite a lot of data sources in a Looker Studio report.
However, the more apps you connect, the slower Looker Studio gets. In fact, it’s not that fast even with two data sources connected, so if you add dozens of them, performance will be severely affected. Such visualization might be quite hard to use, and you definitely don’t want your graphs to get frozen in the middle of a presentation. But how can you overcome this problem?
Read on to find out how to connect as many data sources as you wish and easily visualize your data from numerous apps without sacrificing performance.
If you need to use multiple data sources in Looker Studio, what are your options?
There are a couple of ways to do this. Which one is right for you, depends on what apps you use and how many you want to connect to Looker Studio. Here are three main options:
- Connectors by Google. This option allows you to connect multiple data sources to Looker Studio quickly and easily, and completely for free. The downside is that the number of apps offered by Looker Studio natively is very limited. Currently, there are a bit over 20, and most of them are various Google products. If you need an app that’s not on the list, you’ll need a partner data connector.
- Partner connectors. Looker Studio features hundreds of partner connectors, but their quality and reliability may vary a lot. To ensure a stable data flow, you can use Coupler.io, a connector that supports over 60 different data sources. Additionally, it allows you to blend data before loading it to Looker Studio and refresh your report automatically on a schedule.
- Establishing a connection via an API. This method requires working with APIs and is more technical. It allows you to create a custom connection tailored to your specific use case. We won’t be covering this method in-depth as it’s already well described in Looker Studio’s API documentation.
In this article, we explain step-by-step how to use the first two options – native connectors and partner connectors. Let’s summarize what you get with each of the options in a brief overview.
Connecting Looker Studio to multiple data sources – a summary
| Parameter | Native connectors by Google | Partner connector by Coupler.io |
|---|---|---|
| Number of apps available | 20+ | 60+ |
| App type | Mostly Google products | Popular business app from various domains |
| Apps available | Google Analytics 4 Google Ads Google Sheets BigQuery YouTube Analytics My SQL Google Search Console Google Ad Manager 360 Google Cloud Storage NEW Search Ads 360 PostgreSQL Search Ads 360 Campaign Manager 360 Cloud Spanner Cloud SQL for MySQL Display & Video 360 | Facebook Ads LinkedIn Ads Google Ads Instagram Ads Mailchimp Pipedrive Excel Google Sheets Google Ads Google Analytics 4 Calendly Shopify Salesforce Hubspot YouTube Tableau Stripe See the full list of 60+ sources |
| Calculable metrics and blending data | Must be done on Looker Studio’s side and slows it down | Can be done on Coupler.io’s side prior to importing data to Looker Studio. Doesn’t affect your dashboard’s performance. |
| Performance with adding multiple data sources | Performance affected The more data sources you plug in directly into Looker Studio, the slower it gets | Performance not affected You can connect an unlimited number of sources to Coupler.io and blend your data. Then, Looker Studio will only be connected to one data source – Coupler.io |
| Price | Free for the native 20+ sources, except for the cases when you need to pay for using the connected app (e.g., for queries in BigQuery). | The free plan is available. Paid plans start with $24/month |
So, if you want to connect 3 and more sources and/or not all your sources are available natively, then you should opt for a partner connector. You can use it to plug in even natively available apps as well – it will be easier to manage all the connections from one place.
What’s important here is to find a tool that will feature most or all of your apps. And it also needs to have data transformation capabilities so that you can blend data before sending it to Looker Studio and then plug it in as one data source. Then you will get a visualization with data from multiple sources, and the performance won’t be affected.
If you opt for a tool that doesn’t offer data transformation, you will have to plug in data sources into Looker Studio one by one, making it slow. The same goes for connecting several apps separately with native functionality.
How to connect Looker Studio to multiple data sources in bulk with Coupler.io
Coupler.io offers dozens of ready-to-use dashboards built in Looker Studio and allows you to integrate multiple data sources in just a few minutes. It has a simple and intuitive interface, so you don’t need any prior knowledge for this. There are two ways to connect multiple data sources with this method:
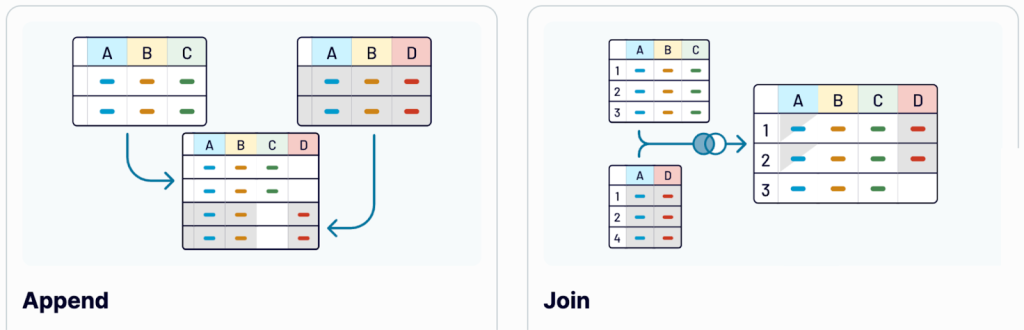
- Append – creates a dataset where data from one app is placed below the data rows from another app. Columns with identical names are matched and combined, while unmatched columns are included as is.
- Join – combines data using the left join key. This allows you to keep all the information from your main dataset and only add the matching elements from the other sources. Columns that didn’t match the conditions you specified won’t be included.
Append data from multiple sources
In this example, we will connect Google Ads and Facebook Ads to Looker Studio to create a cross-channel report.
Step 1. Connect data sources
Sign up for Coupler.io in order to use the platform (no credit card is required). You can use the form below and connect your source to Looker Studio right away.
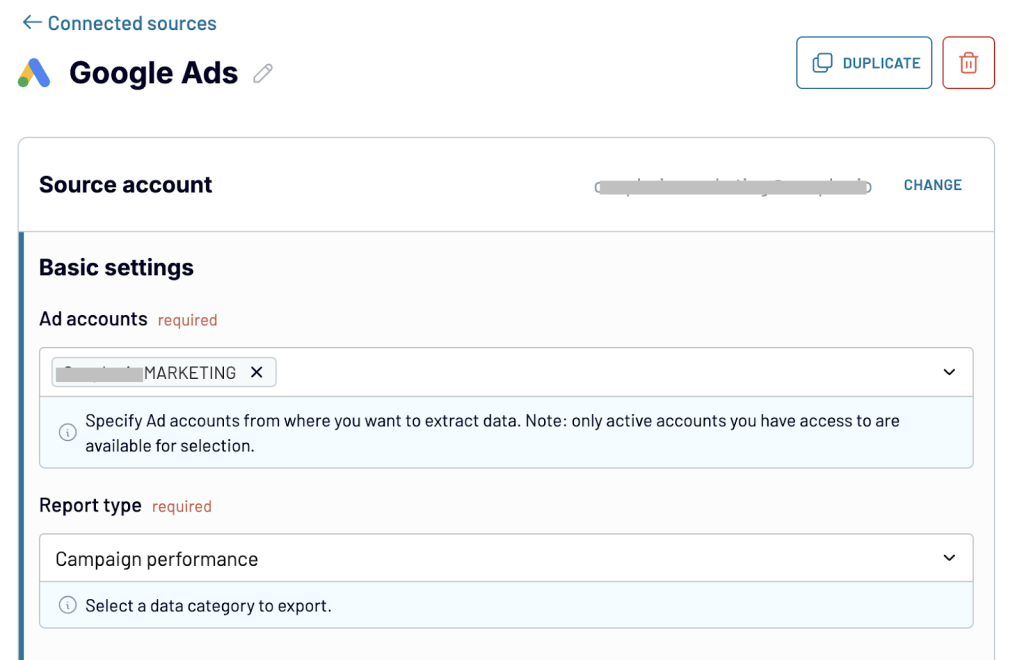
Add a new importer and select a data source – Google Ads. Connect your Google Ads account, specify the report type to extract. In our example, this will be a Campaign performance report. Then, select the report period.
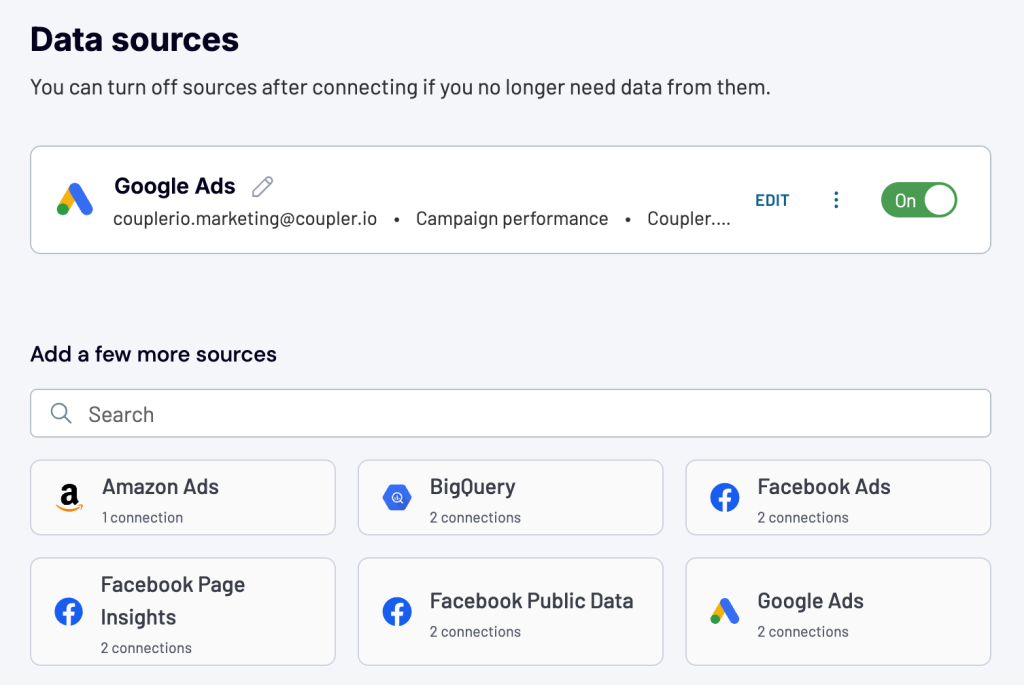
Once done, you can add more sources. In our example, we need to add Facebook Ads. Use the search bar to find the needed source and click on it.
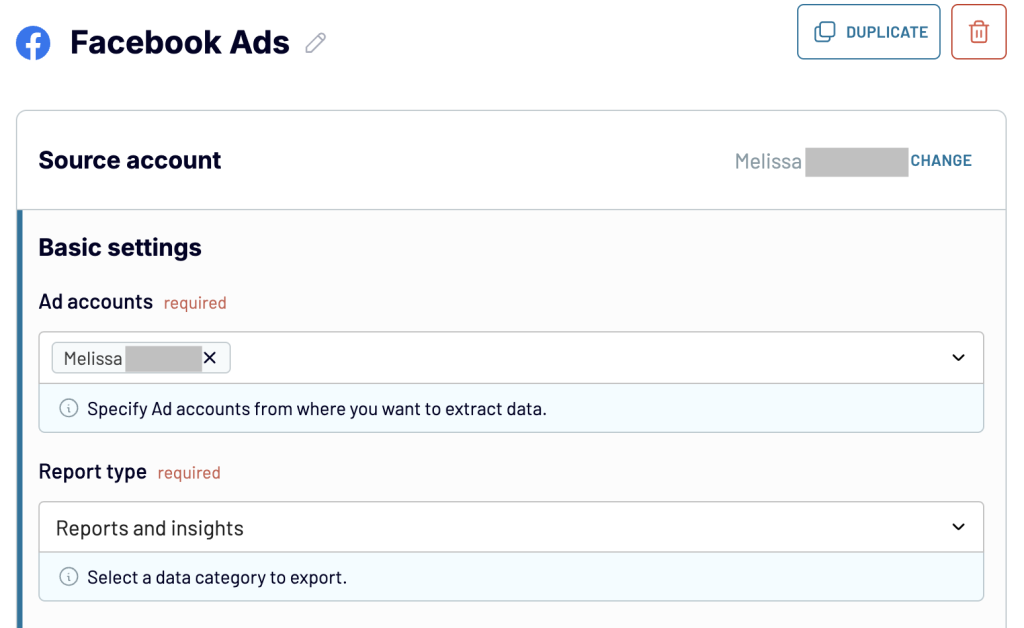
Just like with the previous source, we connect the Facebook Ads account and select the report type.
Important: Make sure to select report types that have the same metrics and date range for all your data sources. This way the blended dataset makes sense.
When all the sources are connected, move on to the Transformations step. That’s where you can append your data.
Step 2. Transform and append data
We can now select how to combine data from these two apps. As we want to Append data, we choose this option.
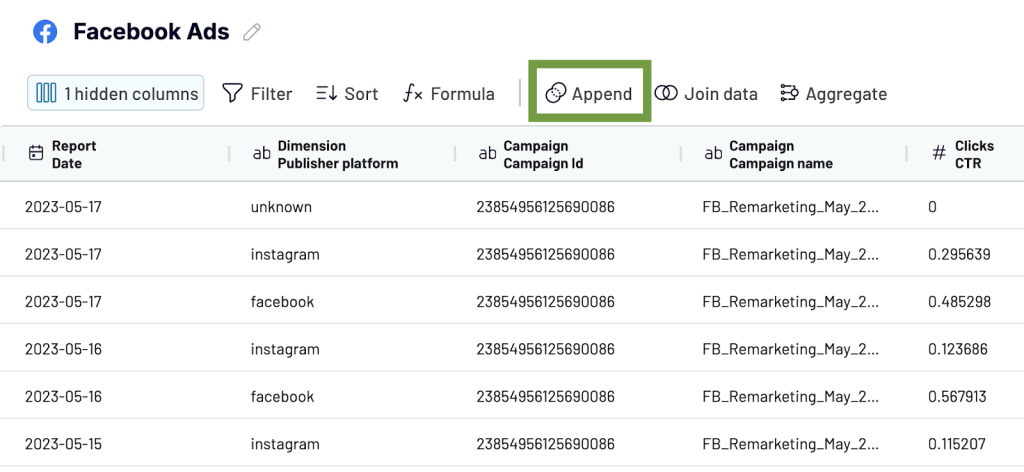
Please note that columns are matched by name. As data from different sources usually has a different structure, it makes sense to rename any unmatched columns so that they are combined properly. Our suggestion would be to determine the set of metrics you want to collect for each channel (e.g. Impressions, Clicks, Conversions) and adjust the naming in each of the sources.
Data has been appended. In the screenshot below, you can see data from Facebook Ads was placed under the dataset from Google Ads. Columns with identical names were matched and combined: Account name, Report date, and Campaign name. Columns that couldn’t be matched were added without blending.
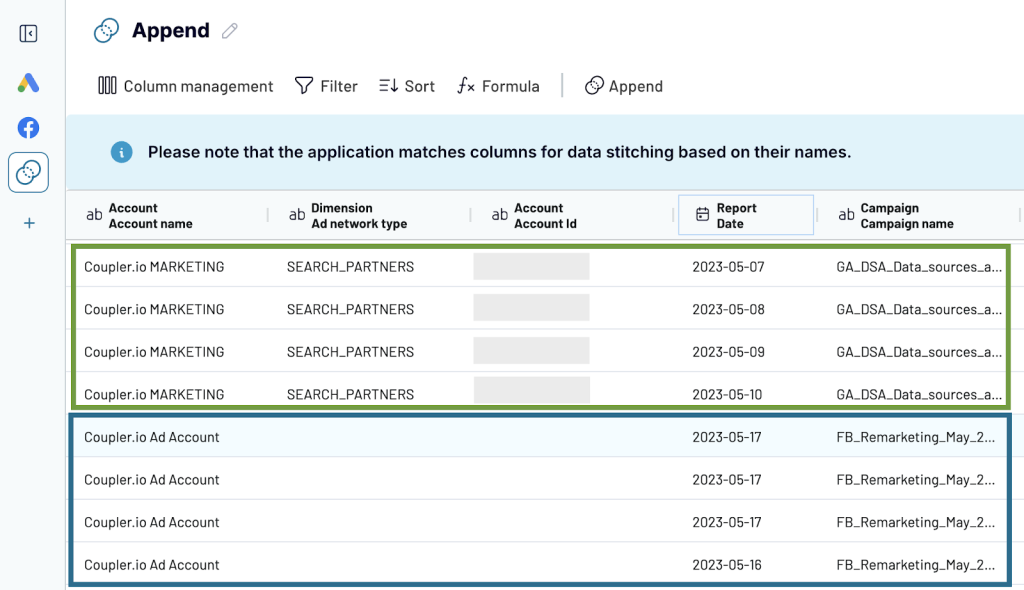
Apart from this, the data Transformation module allows you to:
- Hide unnecessary columns
- Rename and rearrange columns
- Sort and filter data
- Use formulas and perform calculations
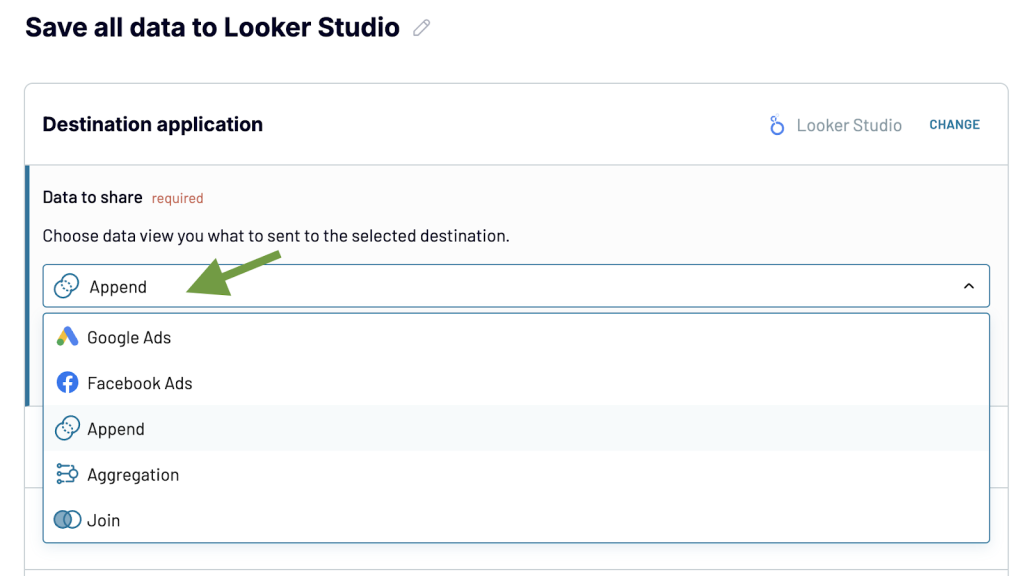
Step 3. Load the combined data to Looker Studio
Once your dataset is ready, move to the next step and select Looker Studio as a destination. Then, in the Data to share field, select the appended dataset to send it to Looker Studio.
Next, follow the onscreen step-by-step instructions to send your data to Looker Studio.
The blended dataset from two or more applications will be connected to Looker Studio as a single data source, Coupler.io.
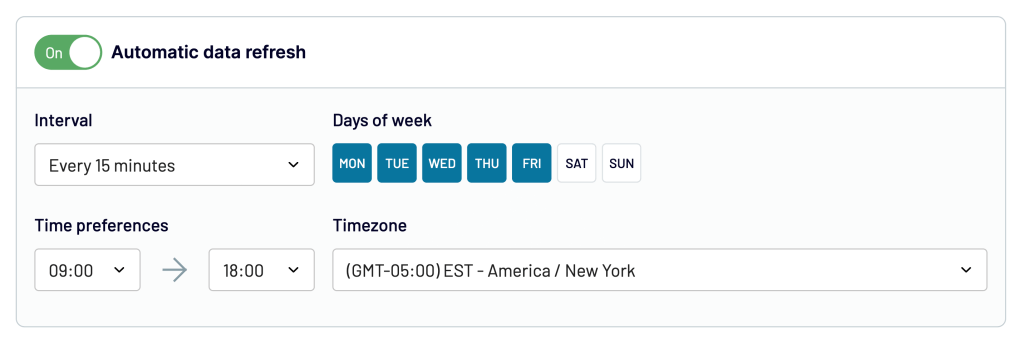
Now you can set up a schedule for the updates. Toggle on Coupler.io’s Automatic data refresh feature and specify your preferences for the schedule. Coupler.io can collect fresh data from your data sources and send it to Looker Studio as often as every 15 minutes.
Join data from multiple sources
Data Join is a term Coupler.io uses to describe combining data from two or more sources using LEFT JOIN (from the SQL terminology). This means all the elements from the left (main) dataset are kept while only the matching elements from the right dataset are included in the joined set.
Let’s use this method to combine data from Google Search Console and Google Analytics 4. We will join the data to get a landing page performance report. It can be a useful instrument for monitoring your website health in the wake of constant Google search algorithm updates.
Step 1. Connect data sources
Sign up for Coupler.io if you don’t have an account yet (no credit card is required). Once again, you can use the form below to connect your source to Looker Studio right away.
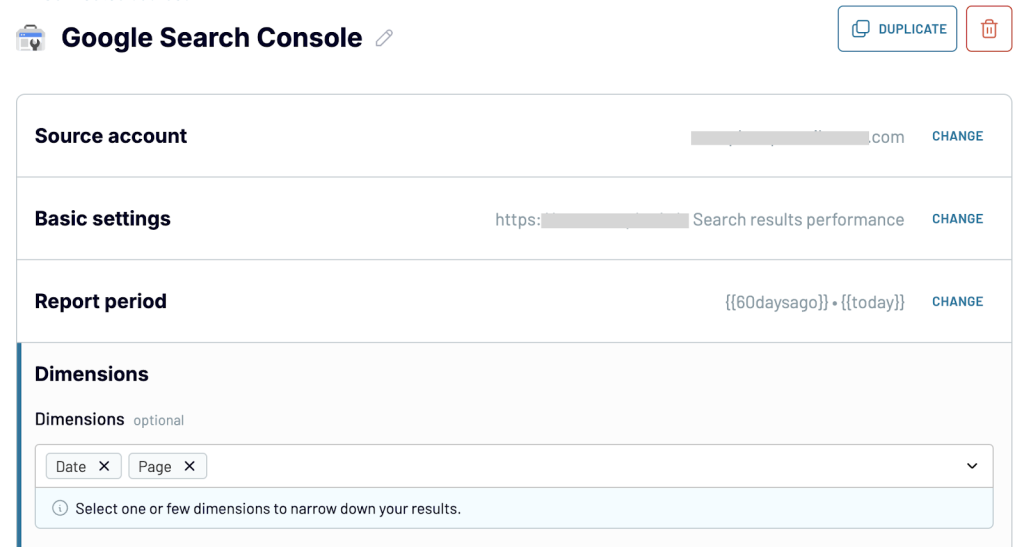
Next, connect your GSC account and select the website for data extraction. In the report type, select Search results performance. For dimensions, select Date and Page.
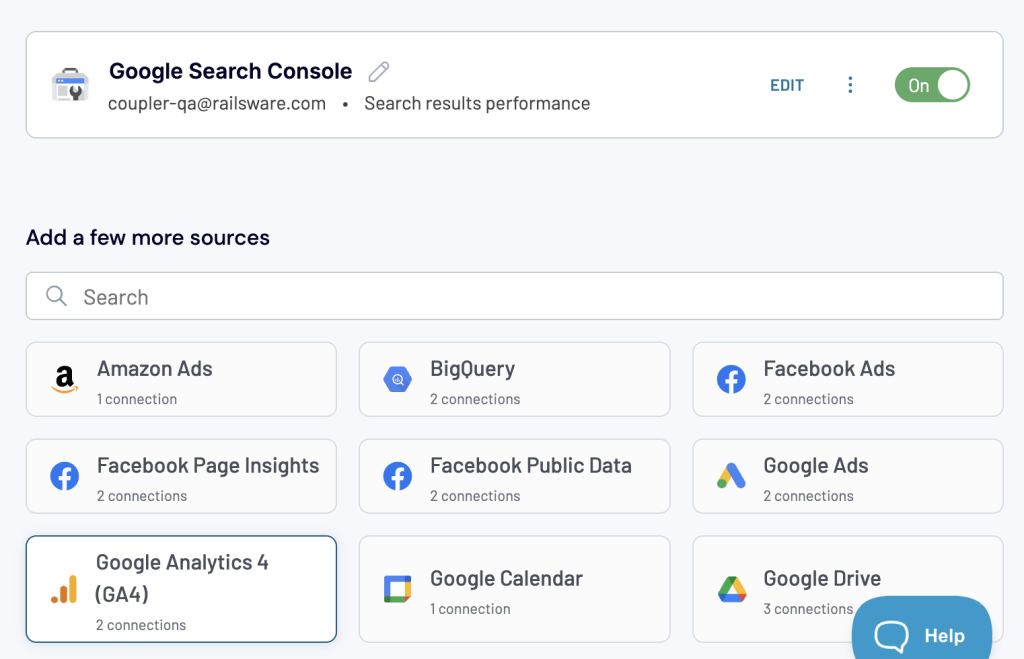
In the next step, select Google Analytics 4 as an additional data source.
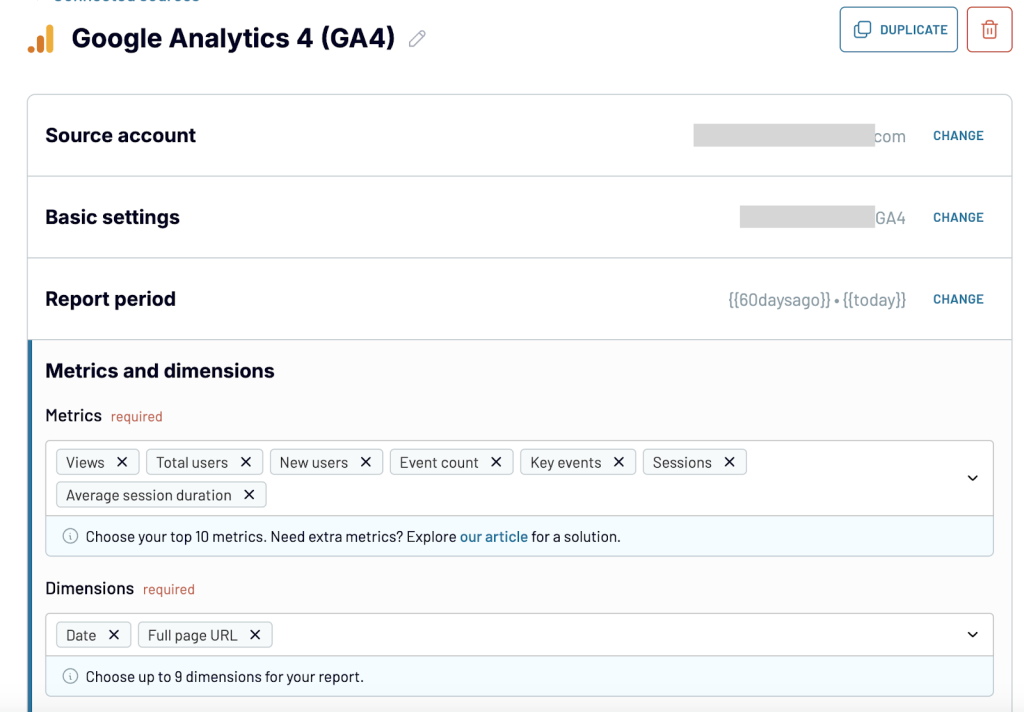
Repeat the same steps to connect your Google Analytics account and specify what data to extract. Then, add the necessary metrics and dimensions as shown in the screenshot below.
Now, let’s move on to the next step and join data from these two data sources.
Step 2. Transform and join data
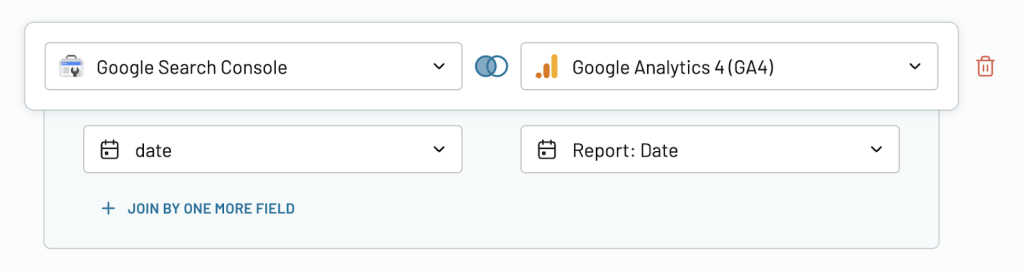
In the data transformation module, select Join data.
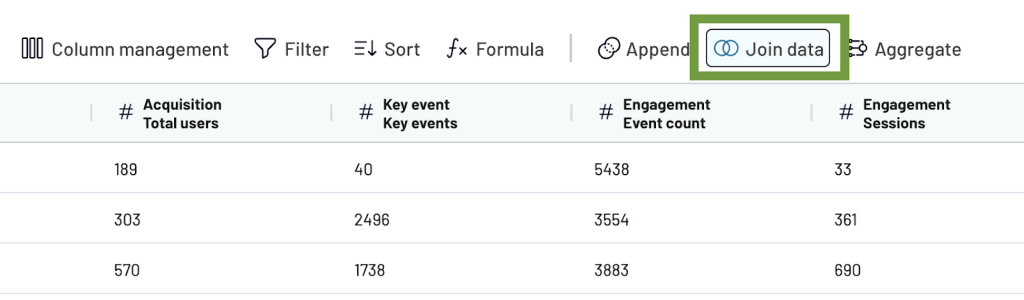
Then, specify how to join your data. The app on the left will be your main source, meaning that only matching information from the app on the right will be added to the joined dataset. Select the columns to join data by. In our example, it’s Date. Once everything is ready, press Join data.
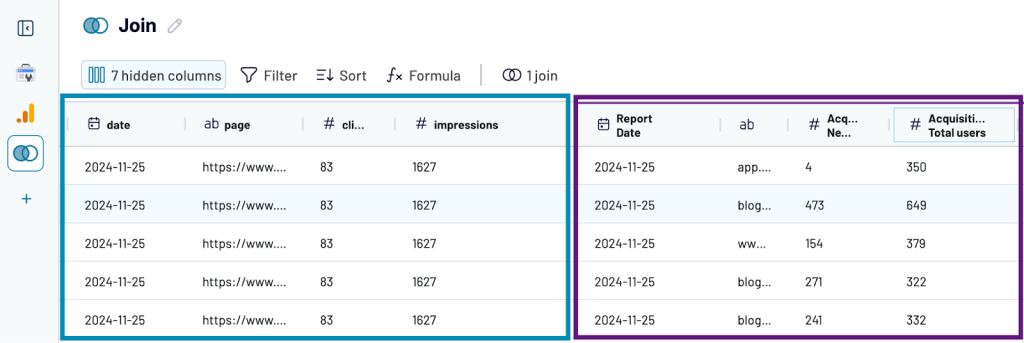
Here’s the joined dataset. Data from Google Search Console (on the left) was joined with data from Google Analytics 4 (on the right). You can use the data transformation module to further refine the results: sort and filter data, hide or rearrange columns, and so on.
Step 3. Load the combined data to Looker Studio
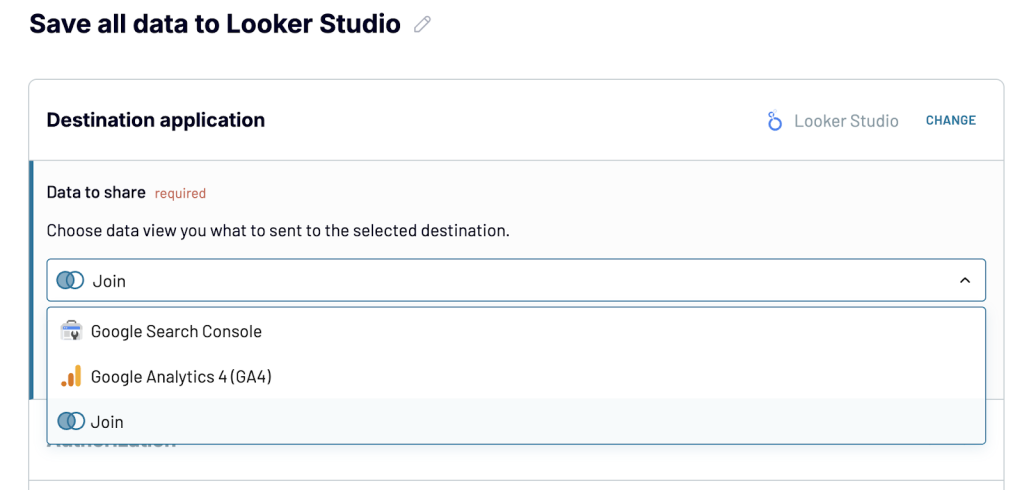
Once your dataset is ready, connect it to Looker Studio. In the Data to share field, select the joined dataset (Join).
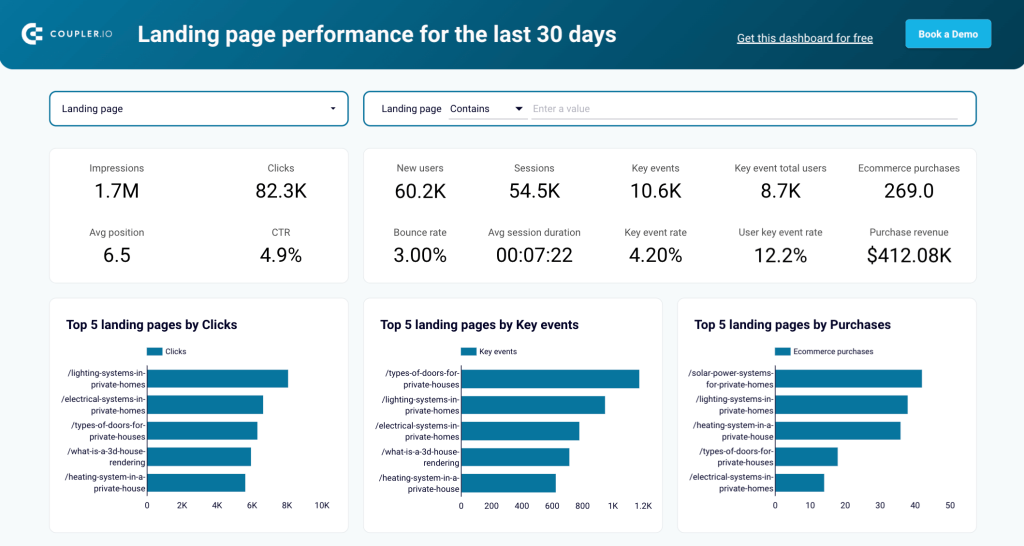
Follow the onscreen instructions to finalize the data transfer and create a new report in Looker Studio. Additionally, Coupler.io allows you to select a custom schedule for the updates and keep data in your dashboard fresh. Here’s what a ready report in Looker Studio may look like:
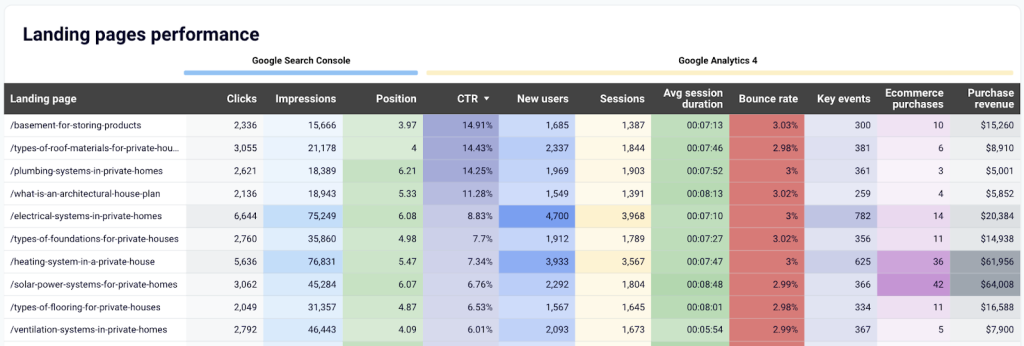
Alternatively, you can use a ready-made template for this Landing page performance report to save time. Then, data joining, other transformations, and data visualization will happen automatically under the hood.
With Coupler.io, you get access to over 100 report templates in Looker Studio, Google Sheets, Power BI, and Tableau. Try it out right away for free.
How to connect multiple data sources in Looker Studio one by one (natively)
In case you don’t need a data automation solution for your current tasks, let’s explore the native method. As we’ve already mentioned, if you plug in three or more data sources into Looker Studio one by one (not as a single dataset), your visualization will slow down. The more sources you add, the slower it gets. (This refers to connecting data sources separately both with a native method and via partner connectors). However, such an option might do the trick for some use cases. Let’s see how it works.
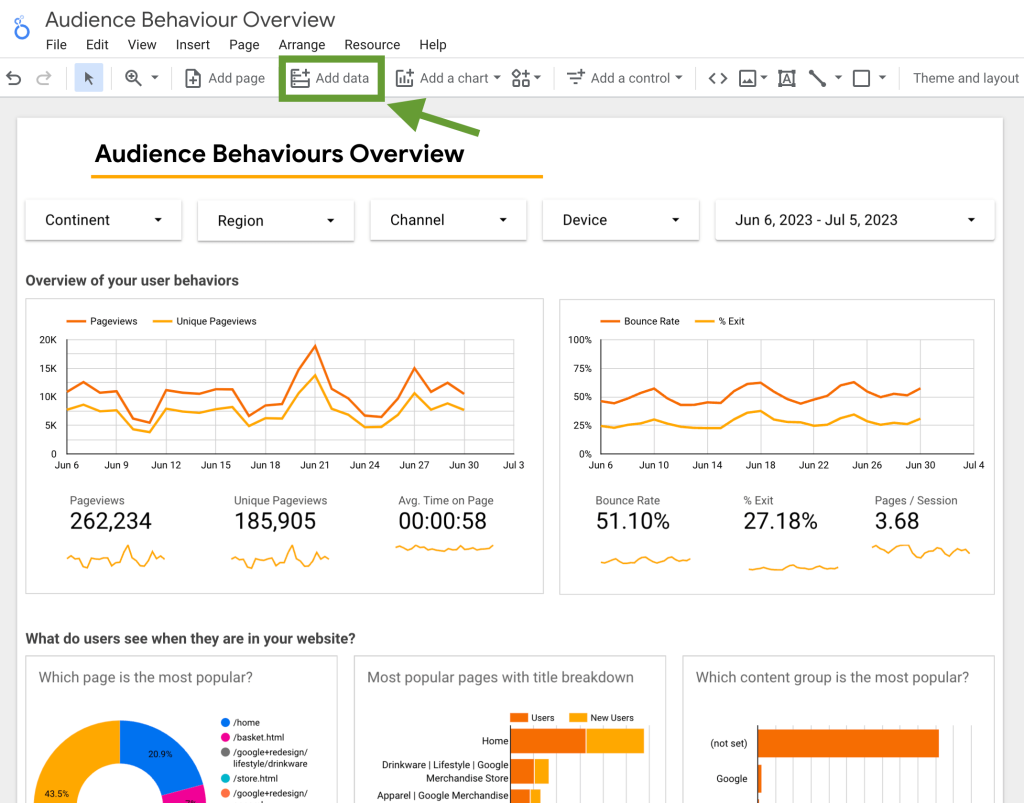
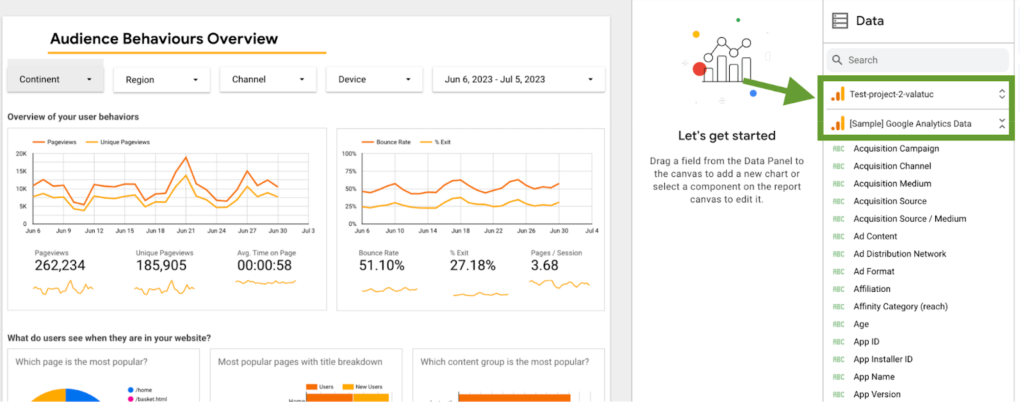
For example, we have an Audience Behaviors Overview dashboard. Now the report is connected to Google Analytics, and we want to add another Google Analytics account to consolidate this data. Let’s see how to do this.
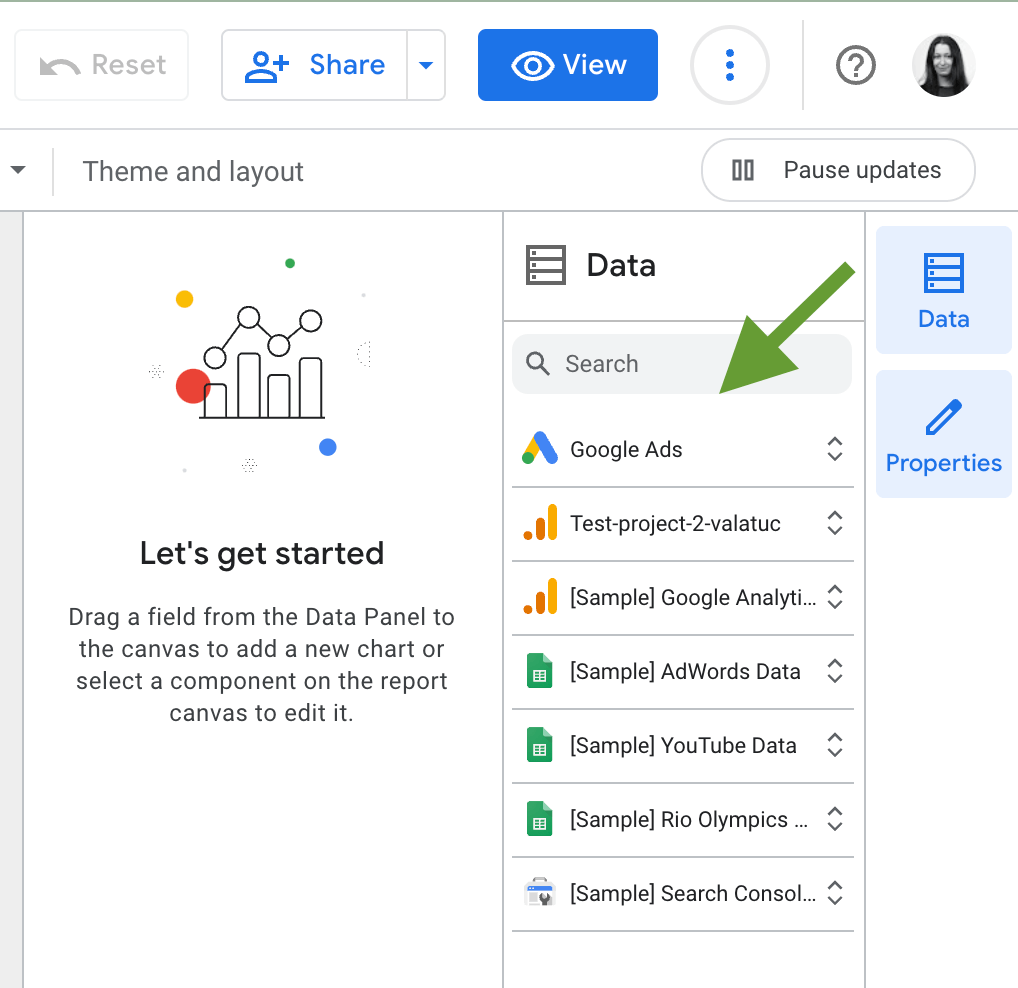
- To connect multiple data sources to Looker Studio, open the report you want to edit and press the Add data button in the menu bar as shown below.
- Alternatively, you can achieve the same result by going to Resource -> Manage added data sources -> Add data source, or just click +Add data in the lower right corner.
- After this, you will see the list of available connectors. Select the connector you need and follow the instructions to add the selected data source to your Looker Studio account. In this example, we’ll connect another Google Analytics account.
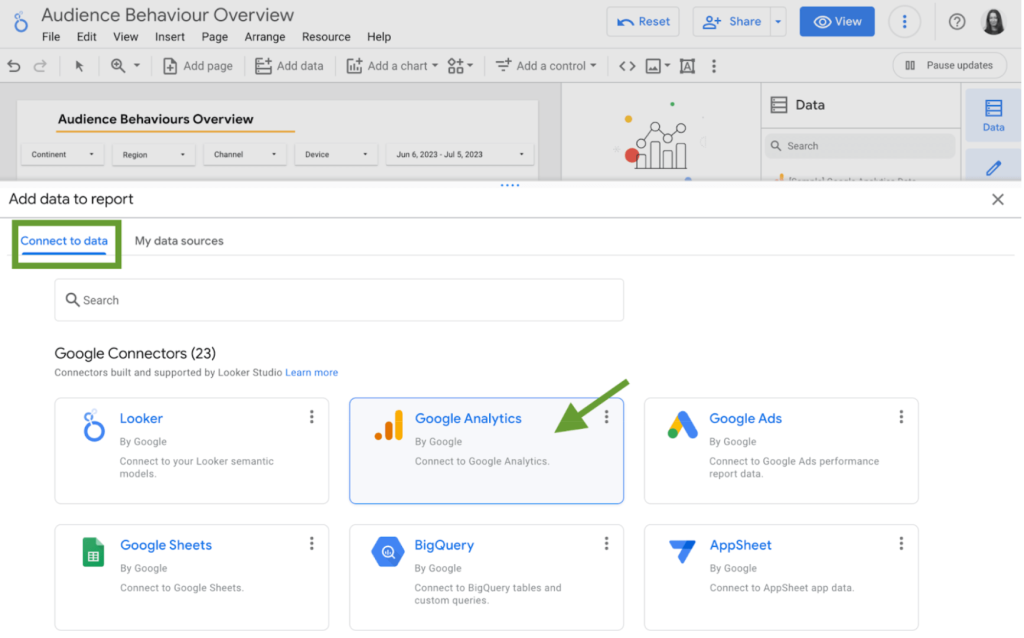
- Click on the Google Analytics tile, and then click Authorize. Log in to your account to connect it. Then, select the sub-account and property you need and click Add.
- For other apps, these steps will be mostly the same.
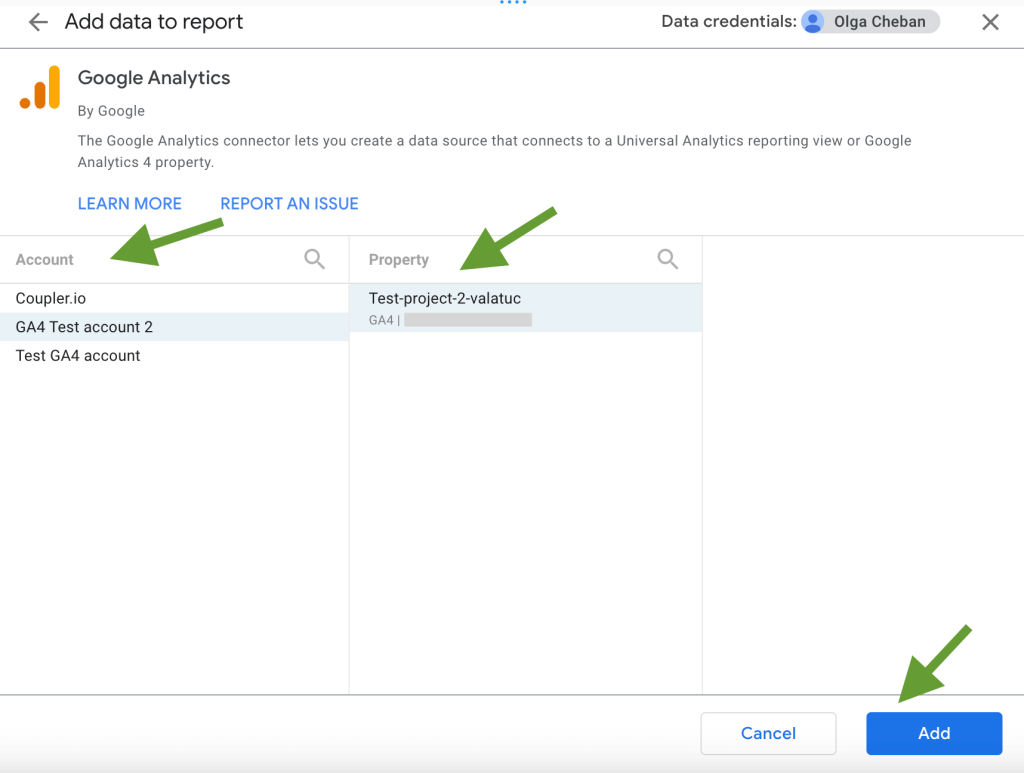
- After this, the data source we’ve just added appears on the list in our report. ??Google Analytics data from the second account is now available.
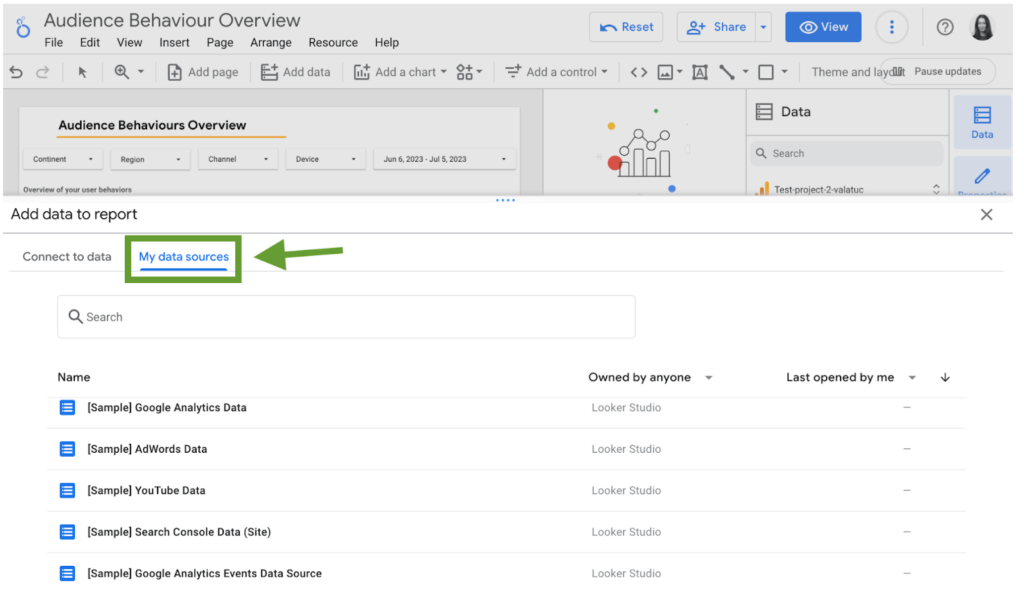
- If the data source is already connected (for example, if you use it in another report), there’s a slightly different way to add it. You can press Add data as we did in the beginning, then switch to the My data sources tab. Select the source you want to connect and click the Add button. It will be included in the report sources shortly.
Using the method described above, we can connect more sources to the report.
However, it’s worth mentioning that Looker Studio allows you to connect no more than 5 sources per app. For example, you can connect 5 tabs from Google Sheets, but you can’t connect 6 or more tabs. If this is a blocker for you, you can use Coupler.io to blend data from multiple sources before loading it to Looker Studio – in such a case, Looker Studio will treat this as just one data source, Coupler.io.
Now you can use multiple data sources in Looker Studio. However, remember that the more sources you plug in, the slower your dashboard will get. If you also need to sort or filter your data or perform some calculations, this will further affect performance. Such a visualization might be difficult to use.
So, if you need to connect a lot of apps, it makes sense to consider a partner Looker Studio connector. It connects to all or most of these apps, blends data on its side, and loads a ready-to-use dataset to Looker Studio. We already explained how to use this method in the previous section.
Now, let’s see how you can combine data from different sources in a Looker Studio report.
How to use Looker Studio with multiple data sources in one chart
Once all your data sources are connected, you might want to combine their data in one chart or table. To do so, you will need to use Looker Studio’s data blending functionality (that is if you decided not to blend data with a partner connector).
There are two main methods that allow you to do so:
- Automatic blending – in this case, you select two tables you want to merge and let Looker Studio analyze them and decide what join key to use and how to combine your data. This method is quick, and sometimes it works smoothly. But quite often you will need to edit the results as Looker Studio doesn’t always merge data the way you wanted to.
- Step-by-step blending – with this method, you will need to manually configure the tables you want to blend, choose the dimensions and metrics, and specify how to blend them (select the fields to include into your join key). This requires more effort, but you will get a more quality result.
Let’s take a quick look at both options.
Blending data in Looker Studio automatically
Here are the steps to combine data from two data sources in one table:
- Connect your data sources to Looker Studio.
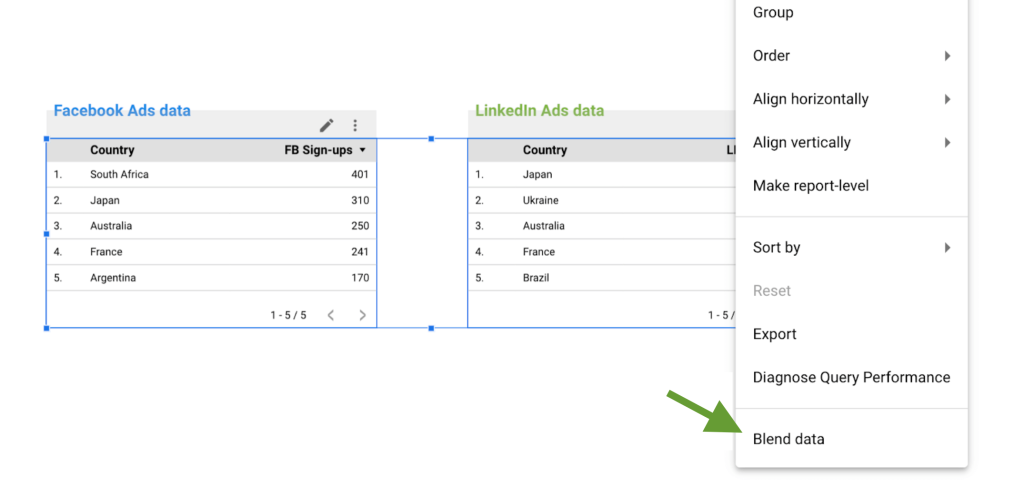
- Add data you want to blend to the report, then select the charts you are going to merge and right-click to see the menu. Select Blend data.
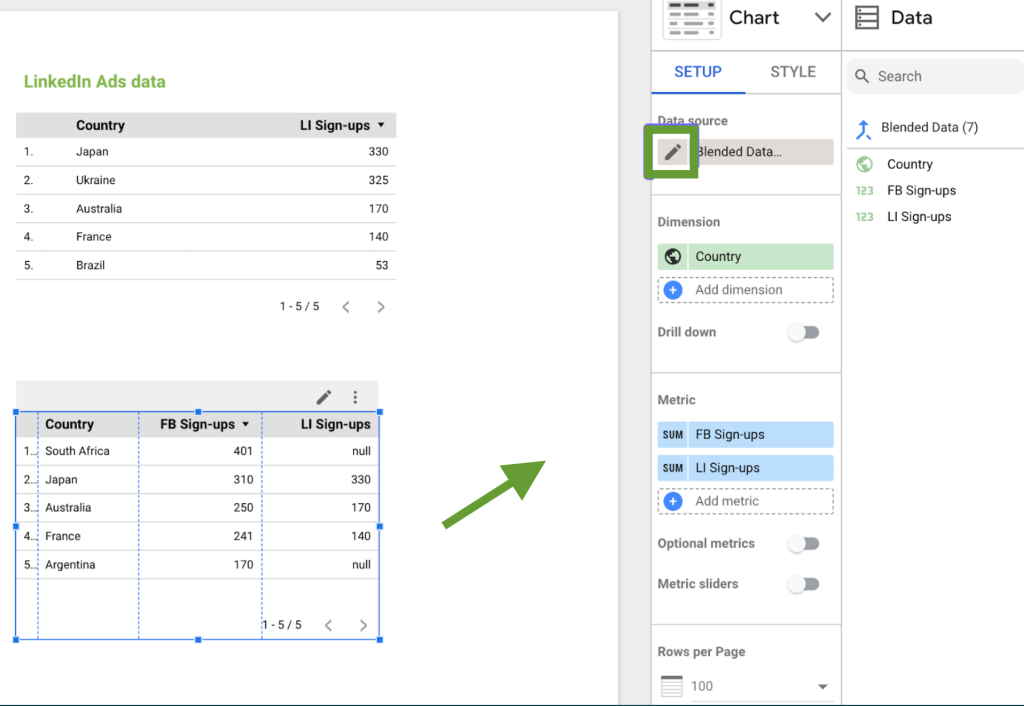
- Looker Studio will merge your data automatically. Then, check the result and use the menu on the right to make the edits, if necessary. For more advanced settings, such as changing the join operator for your join key, click the pencil next to your data source. We’ll talk a bit more about the join operator types in the next section.
Combining data in Looker Studio step by step
- Connect your data sources to the Looker Studio report.
- In the Looker Studio menu, click Resource -> Manage blends -> Add a blend.
- Add the tables you need to combine and choose metrics and dimensions to blend.
- You will also need to select a join type so that Looker Studio knows how to blend your data.
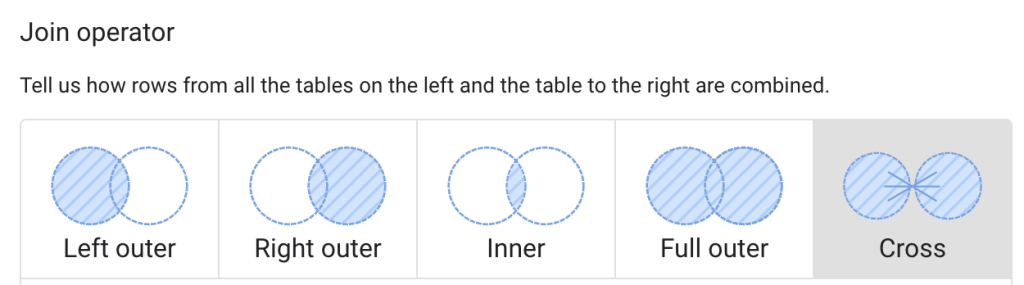
There are five join types, or join operators, in Looker Studio:
- Left outer – creates a dataset containing matching rows from the right table, plus non-matching rows from the left table. This is a default option.
- Right outer – Pulls all matching rows from the left tables, plus non-matching rows from the right table.
- Inner – blends only matching rows from the left and right tables, and leaves out the rest.
- Full outer – creates a dataset containing all rows from the left tables and right table, whether they match or not.
- Cross – returns every possible combination of rows from the left and right tables.
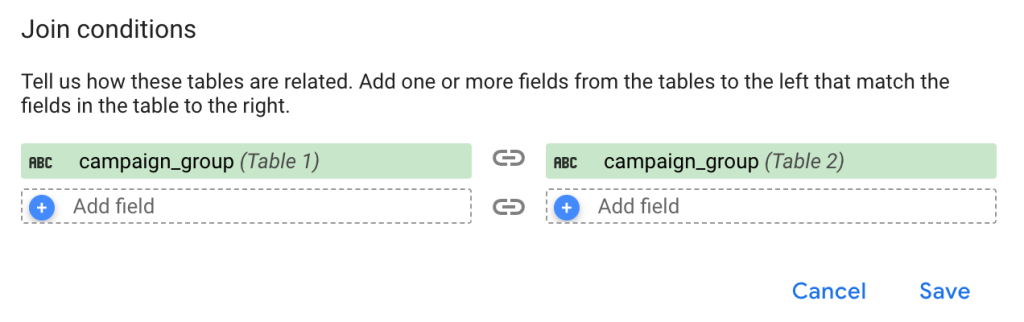
In the join conditions section, you will also need to specify how dimensions in table A correspond to those in table B and what to combine with what. This set of fields will be your join key – parameters for “joining”, or blending, your data.
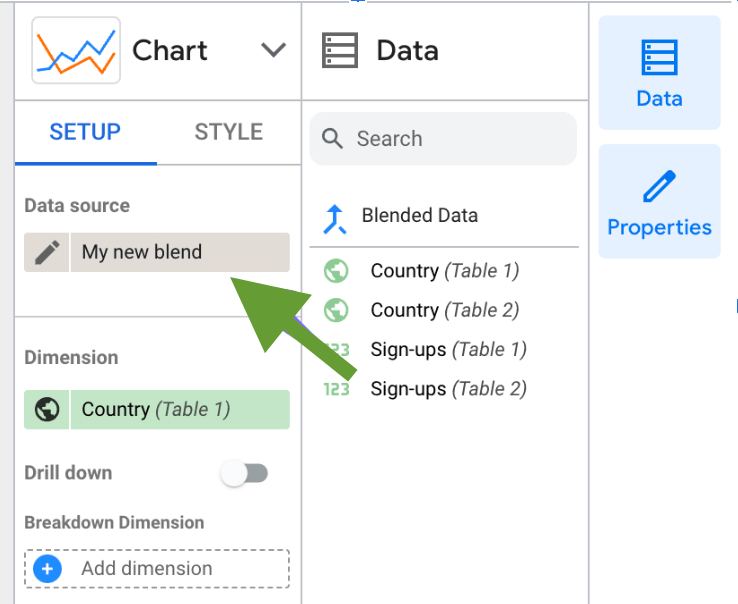
- Once ready, click Save. Specify the name for the new blended dataset in the upper right corner, in the Data source name field. Press the Save button below.
- That’s it! Now your blended dataset is ready for use. You can find it in the list of data sources under the name you specified in the previous step.
If you need more details about blending data from multiple data sources in Looker Studio, check out our Looker Studio Blend Data Tutorial.
Examples of Looker Studio dashboards combining data from different sources
In the previous sections, we explained how to connect Looker Studio to multiple data sources. If we add enough data entities from each source, we will get a comprehensive dataset that can be visualized in an insightful dashboard like the ones below.
PPC multi-channel dashboard
This dashboard is designed for analyzing advertising performance across multiple platforms. It combines data from such apps as Google Ads, Twitter Ads, LinkedIn Ads, Facebook Ads, and more. In total, it features data from 8 apps. If they were connected to Looker Studio separately one by one, such a dashboard would be very slow and difficult to work with.
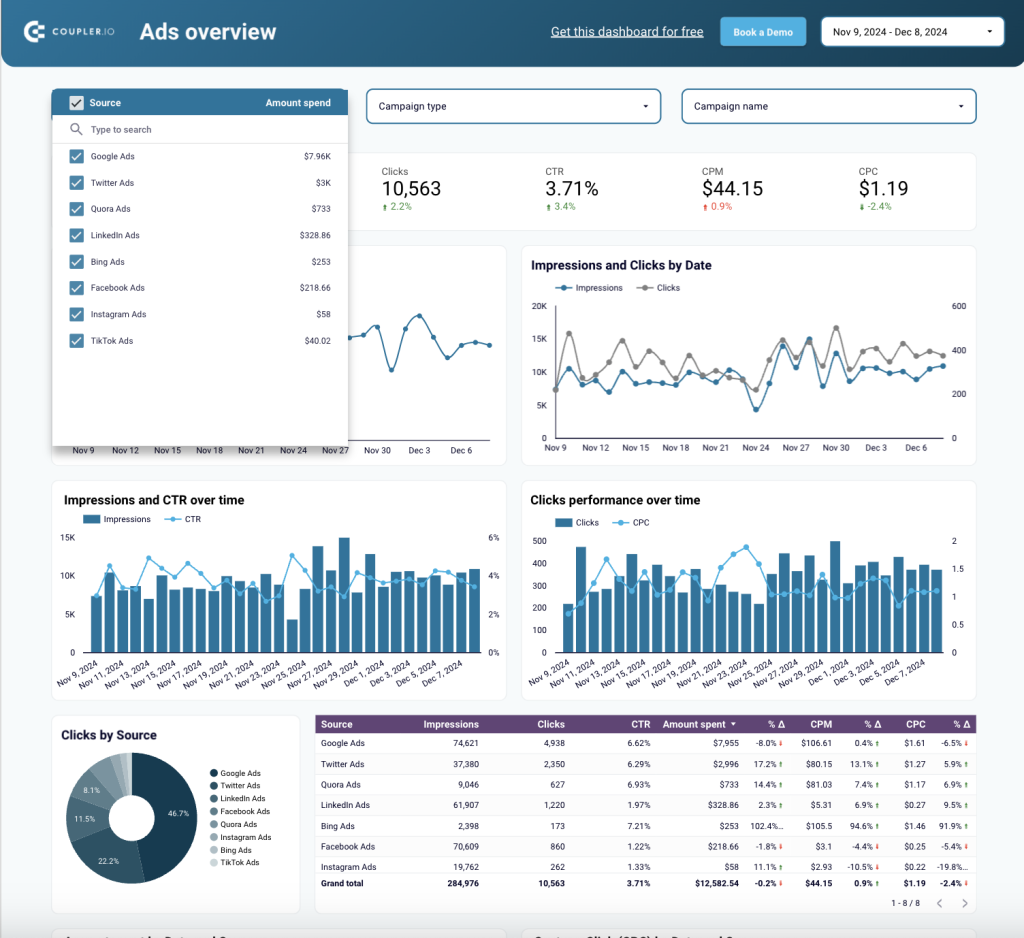
However, that is not the case because these 8 apps are connected to Looker Studio via Coupler.io. With the help of its data transformation block, the information from all the ad platforms was combined into a single dataset using the Append method. As a result, Coupler.io is the only data source connected to Looker Studio. This ensures good performance and enables you to manage multiple data sources from one place.
All-in-one marketing analytics dashboard
Our next example is a comprehensive report showing the KPIs from multiple marketing data sources. These include Google Analytics 4, several paid ad platforms, Google Search Console, YouTube, and email marketing services (see the full version of the dashboard in Looker Studio).
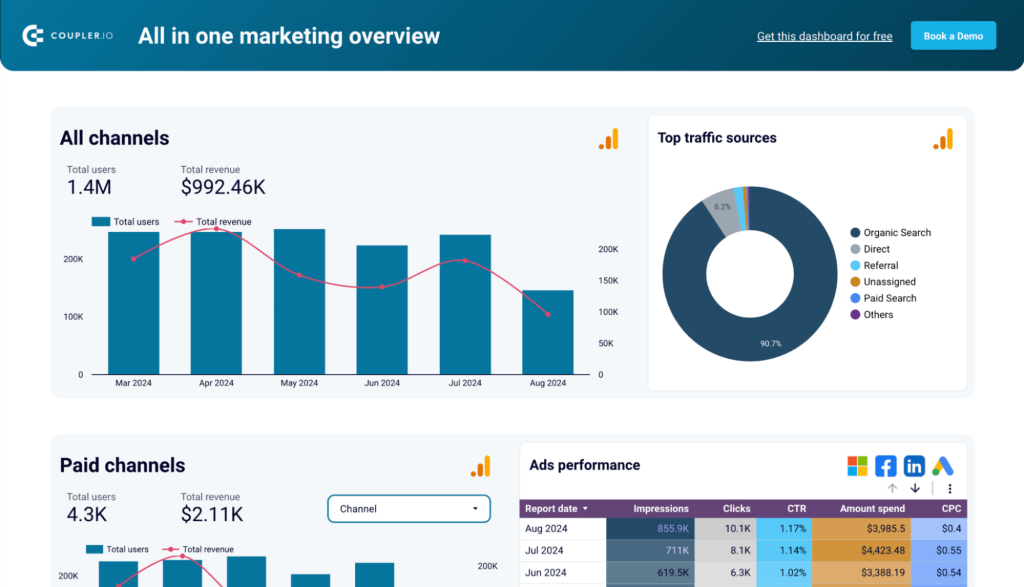
Similarly to the previous example, data here was blended in Coupler.io and then automatically channeled to Looker Studio. While information from other data sources was combined by appending, data from the ad platforms was joined and aggregated by month. In the table below, you can see cumulative ad performance metrics. This approach gives you the flexibility to include all the necessary data in your dashboard without sacrificing performance.
Google Analytics dashboard for multiple properties
The GA4 report for multiple properties allows you to visualize data from several websites in one dashboard. This can be useful for companies that have multiple products or run separate websites for different regions.
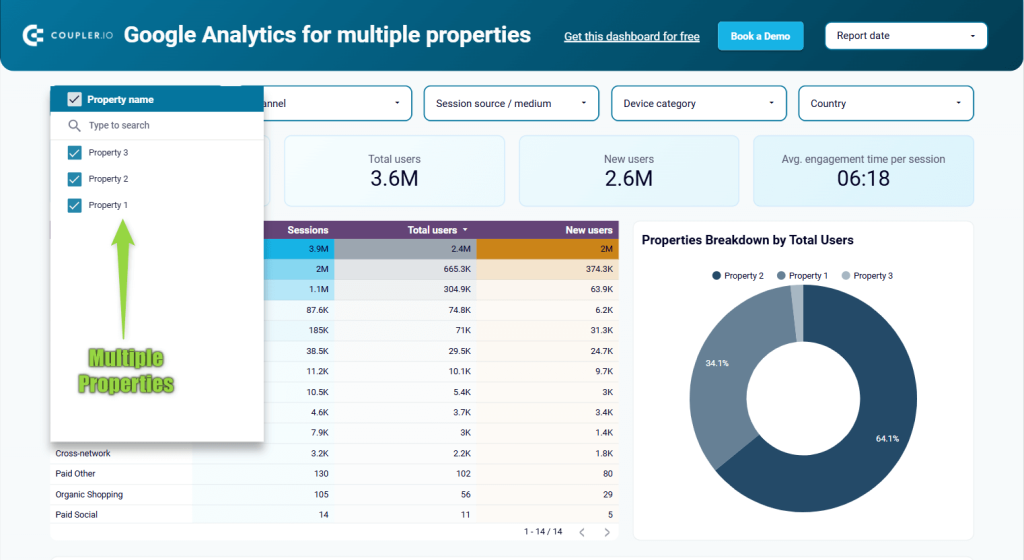
With the help of Coupler.io, this data is joined and then visualized as a single dataset. This provides you with aggregated numbers on metrics such as Total users, Sessions, and Average engagement time per session. If needed, you can also filter data by property to show data for each website separately.
Customer acquisition dashboard for Pipedrive/HubSpot
The next dashboard on our list is a good example of how blending data from multiple sources produces valuable insights. The report features data from ad platforms, Google Analytics 4, and a CRM app and uses it to visualize the acquisition funnel.
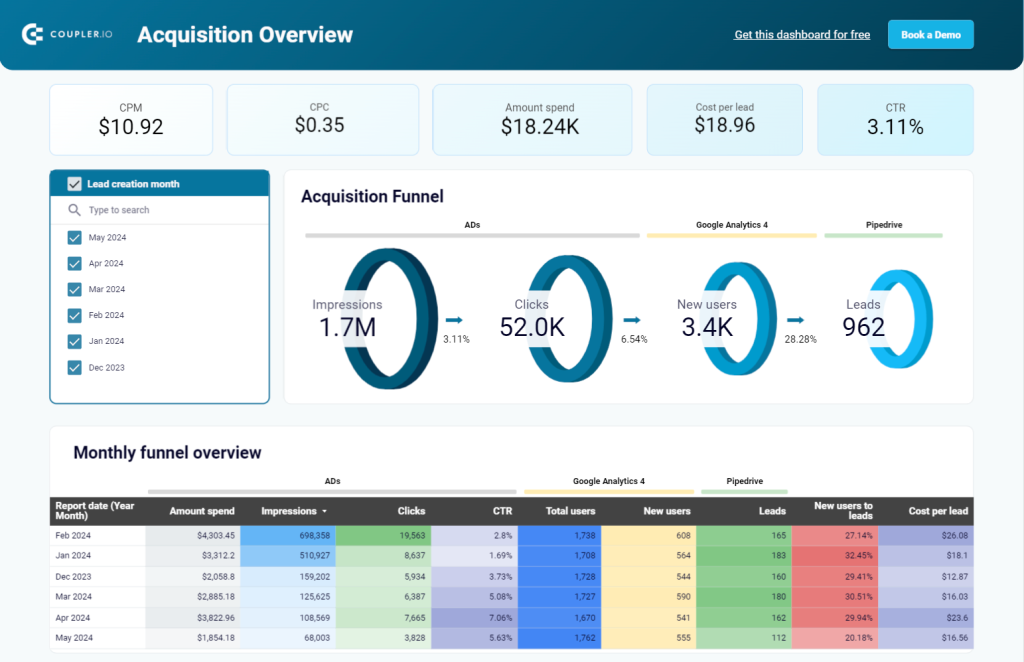
This data is joined in Coupler.io by the report date. As a result, one can trace how advertising efforts bring new users and how those users convert into leads. This allows you to evaluate the efficiency of ad campaigns and see how many leads they eventually bring and at what cost. This information wouldn’t be available if you only looked at these data sources separately.
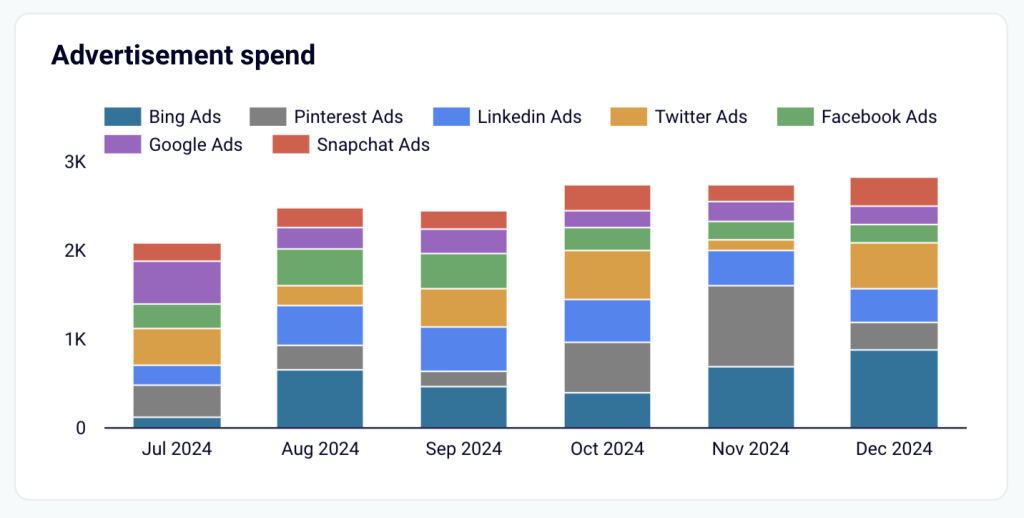
Additionally, the report features a stacked bar graph based on appended data from different ad platforms. This allows you to zoom in and analyze ad spend by platform.
Email marketing analytics dashboard for Mailchimp/Klaviyo
Our last example is a Looker Studio dashboard presenting a performance funnel for email marketing campaigns. It combines data from Mailchimp/Klaviyo and Google Analytics 4 using the Join method. As a result, one can see how many purchases and revenue were generated by the email marketing activities.
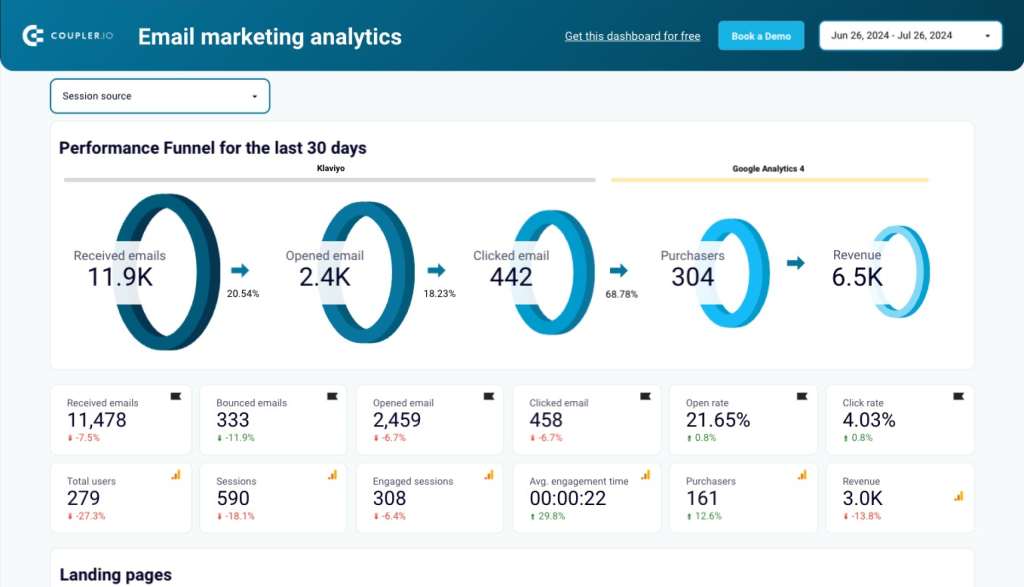
Thanks to combining data, you can even see the financial results of individual landing pages. Such insights help you understand what types of content and campaigns drive revenue. This information can be used to improve your strategy and maximize the results.
What is the best way to visualize data from multiple data sources in Looker Studio?
Using native connectors and opting for partner connectors are both viable methods that allow you to connect multiple data sources to Looker Studio.
The first method is a good option if you only need to connect several apps and if they are mostly Google products and, therefore, come with a native connector.
However, for more complex Looker Studio reports, or simply for reports with different data sources that are not included in the native options, you will need to use a third-party solution. Coupler.io can help you plug in over 60 different apps. It offers you some valuable additional functionality, such as an intuitive data integration module and the ability to manage blended data with ease. You can also use it to automate and streamline all your data flows across your organization and increase efficiency with automation and optimization.
Automate reporting with Coupler.io
Get started for free