

If you want to make sure your SEO strategy will produce successful results, you should always keep an eye on the key metrics. Since you might need to look at data from different platforms, creating a report in Looker Studio is a great option. Looker Studio SEO report templates come in handy for this as they allow you to save significant time. In our article, we’ve prepared a list of the best dashboard templates you can use for SEO reporting.
Also, we are going to show you how to build an SEO dashboard from scratch or with the help of your Looker Studio template. And of course, we will look at what to include in the report.

Best Looker Studio SEO report templates
1. SEO dashboard for Google Search Console
Keeping track of website performance, top pages, and clicks is paramount. With the right Looker Studio SEO report template, you can get a useful dashboard to help you with that. This dashboard by Coupler.io gives you an overview of the key SEO metrics and provides information that you won’t easily get from native reports in Google Search Console. For example, it gives you a summary of the best- and worst-performing URLs.

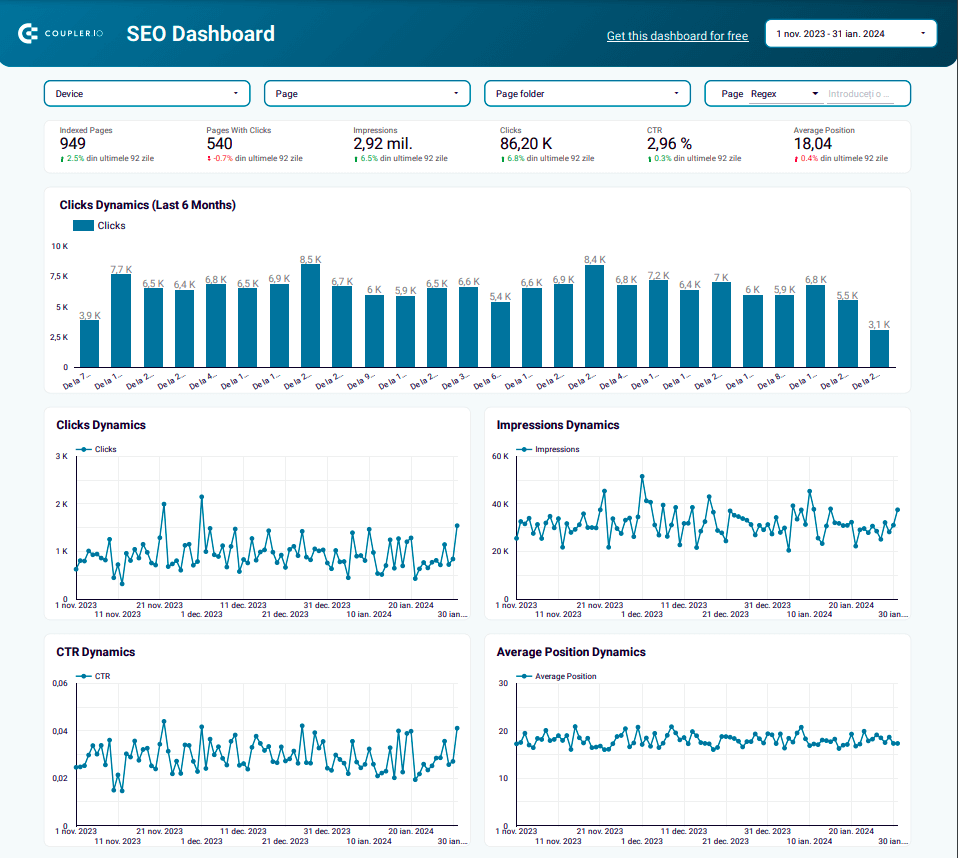
As this template is automated, your dashboard will be self-updating. In addition, it allows you to sort and filter your data, so you can work with it directly in the dashboard. All this helps you understand how your website is performing, allows you to optimize your strategy, and gives you a basis for informed decisions.
You’ll have a complete overview of the most important metrics, such as:
- Impressions
- Clicks
- CTR
- Average Position
- Click dynamics
- Best and worst performers
This dashboard template is free to use and it allows you to get a live dashboard with your data in just three minutes. It’s very convenient as you don’t need to go through the trouble of building a dashboard on your own. Once it’s ready, you can customize it with Looker Studio’s native functionality, if needed. The template is useful for ecommerce stores, SaaS businesses, and more.
2. Technical SEO dashboard
The essence of the technical SEO dashboard is to function like a diagnostic tool that provides a comprehensive picture of the website’s technical health.

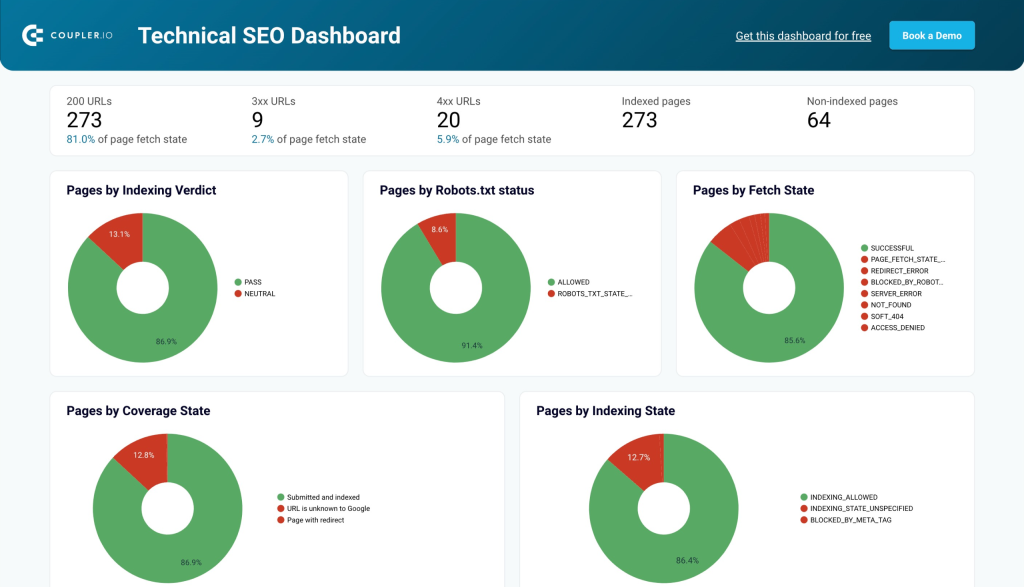
The template pulls data directly from Google Search Console to display the state of your web pages by indexing, coverage, and so on. As a result, you can understand how to prioritize technical SEO tasks to optimize search engine rankings and user experience.
On the dashboard, you can track the following:
- Total number of 200 URLs
- Total number of 3xx URLs
- Total number of 4xx URLs
- Total number of indexed pages
- Total number of non-indexed pages
3. Landing page performance dashboard
The dashboard template to monitor the performance of landing pages for the last 30 days.

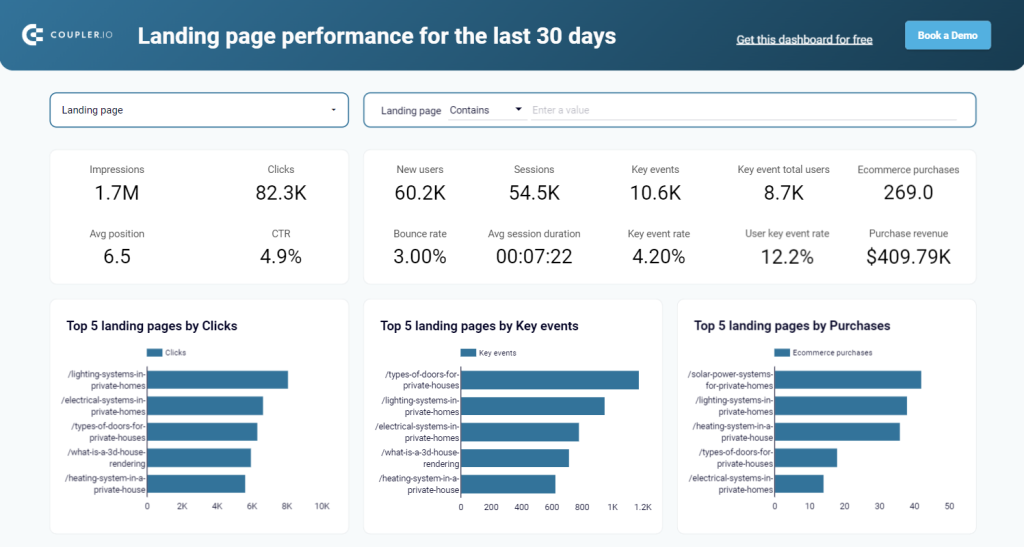
It collects data from two sources: Google Search Console and Google Analytics 4. As a result, you can get an overview of key performance metrics from two perspectives:
| Google Search Console | GA4 |
|---|---|
| – Impressions – Clicks – Average position – CTR | – New users – Sessions – Key events – Bounce rate – Average session duration – Ecommerce purchases – Purchase revenue |
The dashboard also provides the selection of the top 5 landing pages by clicks, key events, and purchases. At the bottom, there is a breakdown table showing the performance of each landing page.
To use the dashboard template, you only need to connect your accounts for GSC and GA4 by following the enclosed instructions. In a few moments, you’ll get a copy of the dashboard populated with your data.
4. Top search query performance dashboard by Coupler.io
Understanding which search queries (keywords) drive traffic to your website helps you improve organic visibility. The top search query performance dashboard acts as a free keyword-tracking tool—organizes your website’s pages by clicks and displays up to 10 search queries per page. Unlike Google Search Console, which limits query filtering to one page at a time, this dashboard gives you a structured view of all queries across all pages.

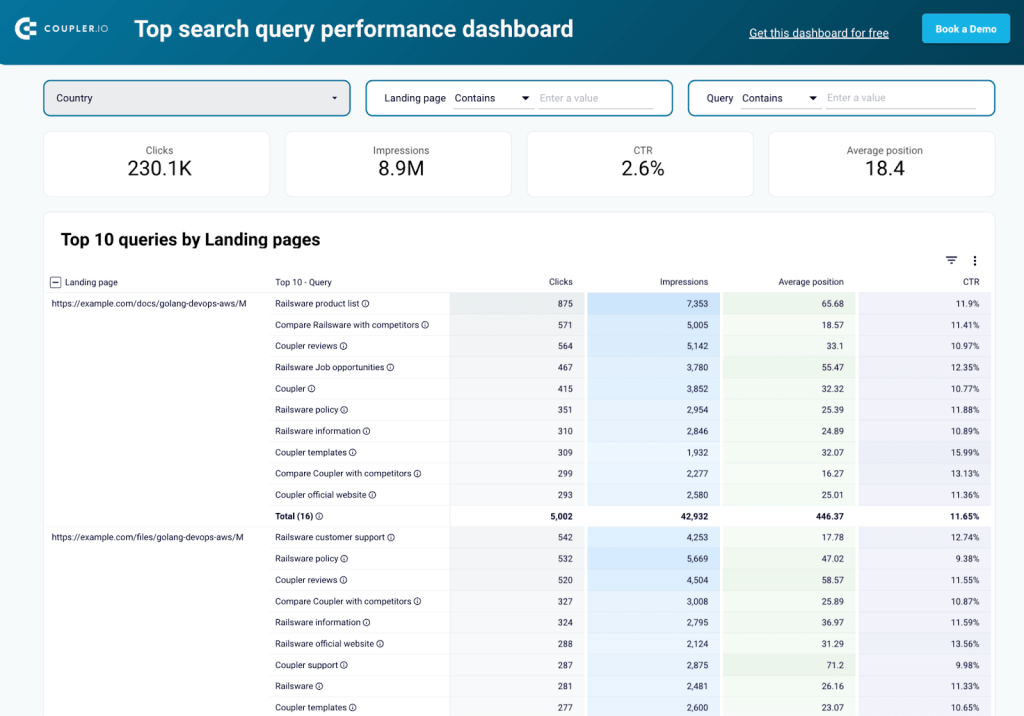
This dashboard provides an overview of key SEO performance metrics, such as:
- Impressions: total times your site appears in search results
- Clicks: number of users clicking through to your site
- Click-through rate (CTR): the percentage of users who click after seeing your site
- Average position: where your website ranks for queries
- Keyword relevancy: ensures ranking queries match page intent
Setting up this dashboard is quick and simple. Connect your Google Search Console data, and within minutes, you’ll have an in-depth visualization of search query performance. The dashboard also lets you filter by pages, queries, and countries to refine your SEO strategy.
5. Keyword analysis report

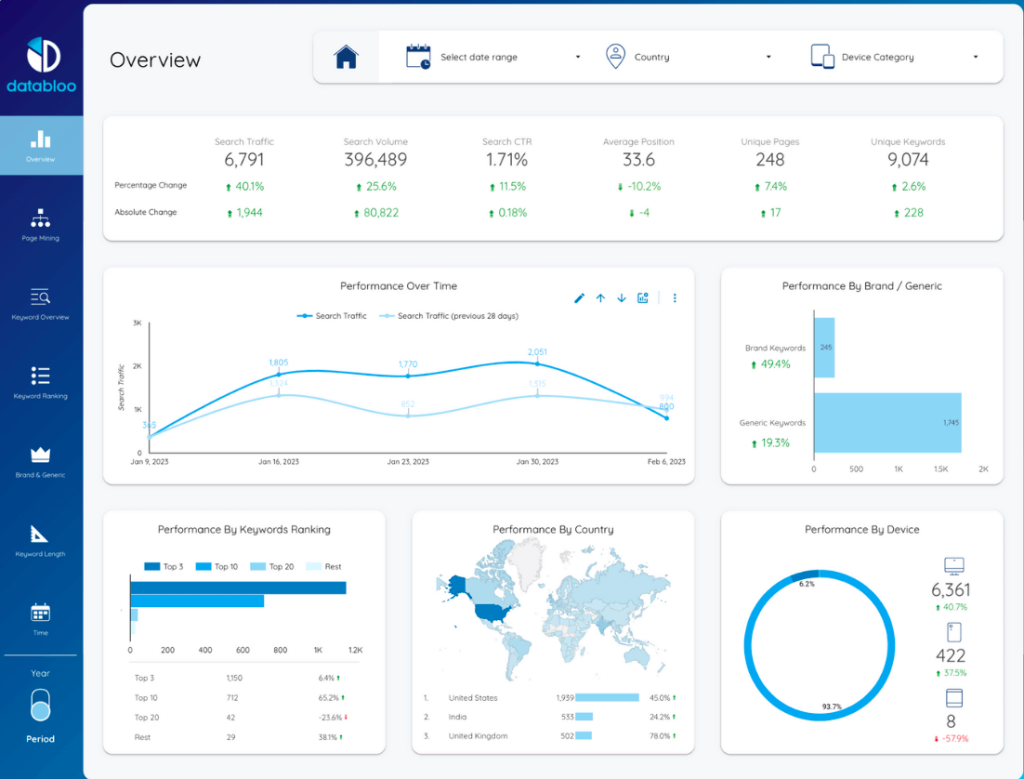
If you want to have an in-depth overview of your keyword performance, then you should consider creating a report that focuses on key metrics, such as unique keywords or search CTR. This Looker Studio SEO report template from DataBloo can help you keep track of how well your keywords are performing.
With this dashboard, you can analyze crucial metrics, such as:
- Search traffic and volume
- Search CTR
- Average position
- Unique keywords
- Performance over time
- Performance by country
- Performance by keyword ranking
As you can see, this dashboard focuses strictly on keywords. Also, keep in mind that this template is not free, and you will have to pay €129 to use it.
6. Core web vitals dashboard

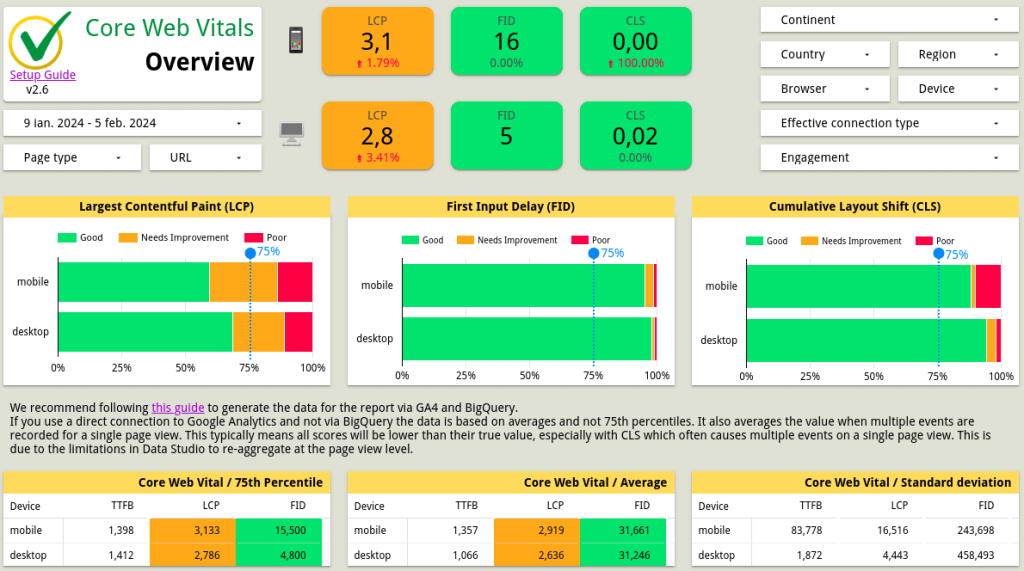
What type of experience do you offer your users once they end up on your website? While it is important to attract users with informative pages that follow the SEO guidelines, it is crucial to ensure that the users don’t leave your website as soon as they land there.
This Core Web Vitals dashboard from Web Site Advantage allows you to see exactly what your users are experiencing when they go to your website. You can analyze website performance and you’ll be able to keep track of metrics such as:
- LCP (largest contentful paint)
- FID (first input delay)
- CLS (cumulative layout shift)
- TTFB (time to first byte)
By monitoring and improving the core web vitals, you can ensure a better customer experience and enhance site performance.
7. ML-enabled SERP Analysis dashboard

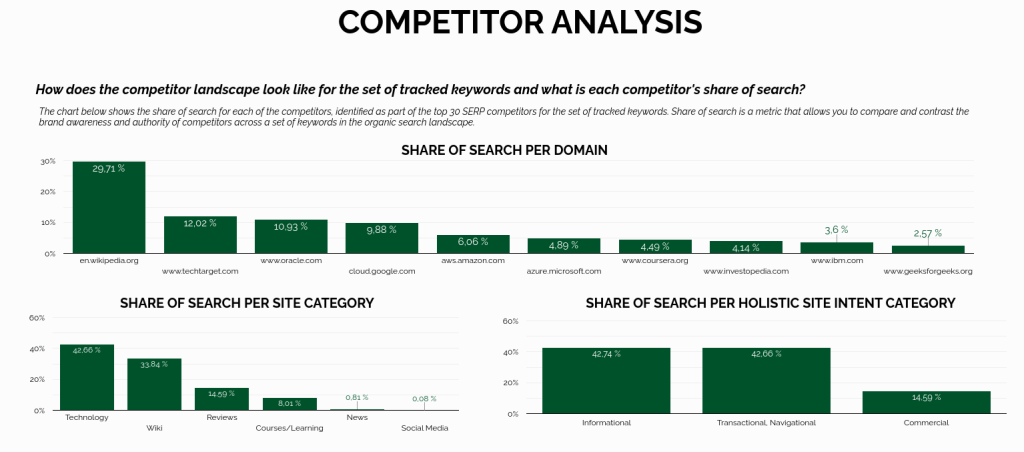
Want to know how your competitors are doing in SERP? With a Looker Studio SEO report template like this one, you can compare your digital marketing efforts with your competitors’.
This ML-enabled SERP analysis dashboard from Lazarina Stoy allows you to keep track of important metrics and KPIs such as:
- Share of search per domain or per site category
- Estimated traffic volume (ETV) of your competitors
- Top performing domains
- Sentiment score
Additionally, if you want to dig deeper and find out more about the competition, you can always use tools like Ahrefs, Moz, or SE Ranking.
8. SEO Query Dashboard

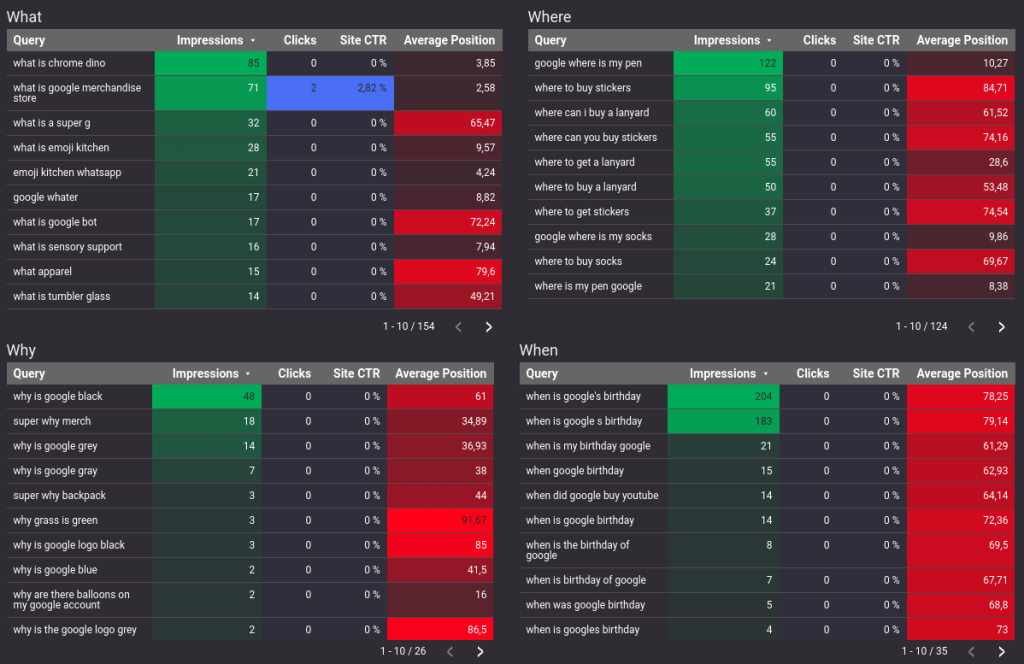
With this dashboard from Andy Simpson, you can discover the why, where, when, and more for your queries. This simple GSC dashboard helps you understand the type of search queries you’re showing up for. The queries can be put into different categories to check what questions your users ask to get to your website.
With data from Google Search Console, you can see important metrics like:
- Impressions
- Clicks
- CTR (Click-through rate)
- Position
How to use SEO report templates for in-depth SEO analytics
Example 1. Best and worst-performing URLs

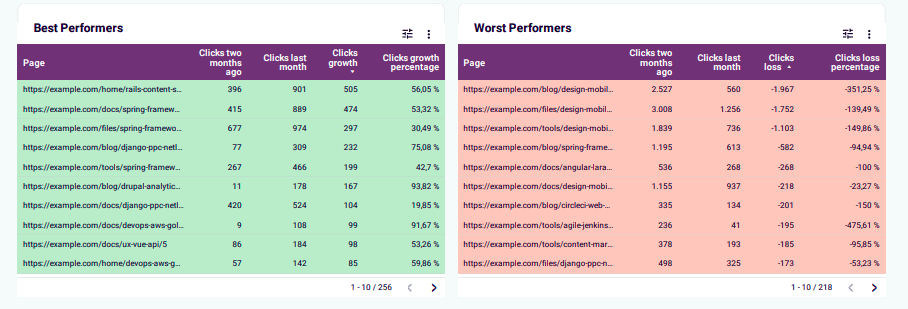
When you look through your Google Search Console reports, it can be hard to understand which pages are performing best and which ones are losing traffic by the day. As this information is not presented clearly in GSC, you will need to make an extra effort to figure that out. That’s when custom report templates can help. In the SEO dashboard by Coupler.io (#1 on our list), you can monitor this in near-real time. You will always know which articles or landing pages are attracting the most users and which need a bit more work.
Example 2. Exclude branded traffic

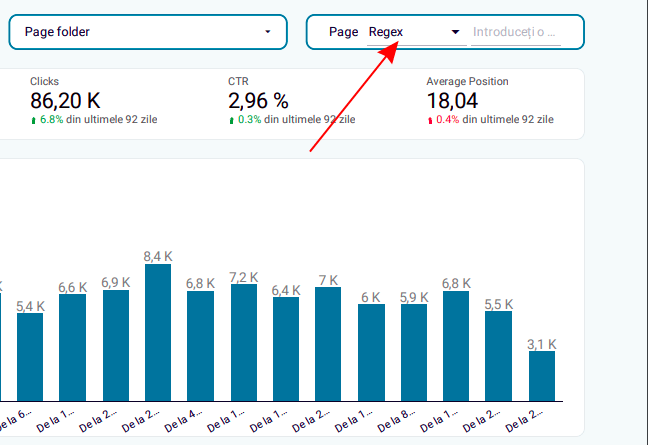
You may want to analyze branded traffic separately from the other SEO results, and vice versa. If you use a dashboard built with the help of Coupler.io’s template, you can apply a custom Regex to filter your data. For instance, you can add the name of your brand using this expression: ^(?!.*\b(BrandName1|BrandName2|BrandName3)\b).*$ to only show branded traffic.
Likewise, you can use other regular expressions for more filtering options.
How to build an SEO dashboard in Looker Studio yourself?
Option 1. Create a dashboard in 3 minutes with a free template
First, let’s start with the easy method, which is making a dashboard with a ready-to-use template. It allows you to get an SEO dashboard literally in minutes, and then you can customize the result to tailor it to your needs.
Let’s see how to build a dashboard with Coupler.io’s SEO template. It’s very easy to use and it comes with a built-in Looker Studio connector to Google Search Console.
- Go to the Readme tab and click the link to connect Google Console data. Once you have a Coupler.io account, you will be redirected to the Google Search Console importer.
- Follow the instructions on the screen and connect your GSC account.

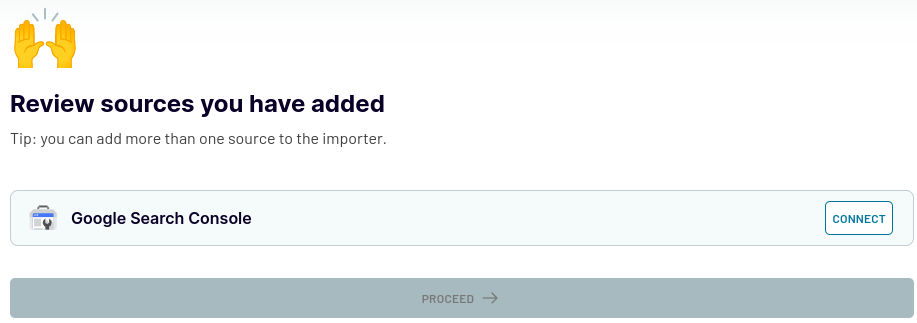
- After selecting the account and website, click Proceed to preview the data that is going to be loaded into the dashboard. You don’t need to change anything here, as you are using a pre-set template.

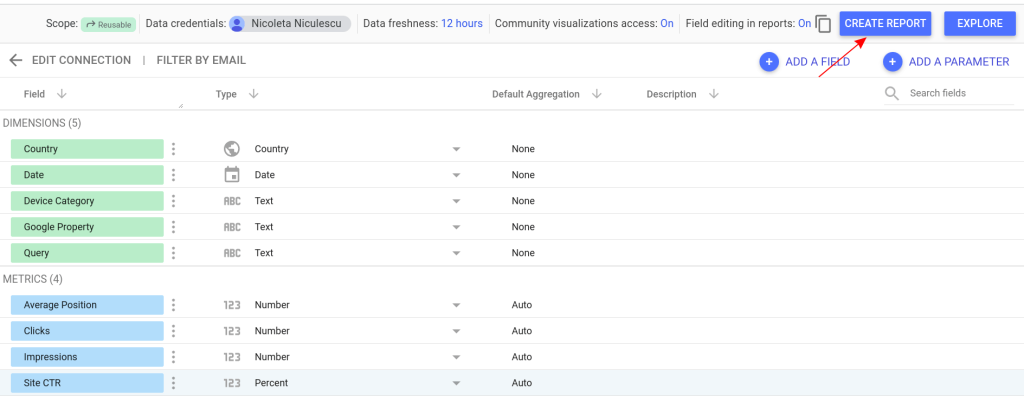
- Then, click Proceed and follow the in-app instructions to authorize the connector and create a data source in Google Looker Studio.
- Finally, hit the Create report button in Google Looker Studio, and you’ll be redirected to your copy of the dashboard.

- The data will be updated every 12 hours automatically. If you want to update the data as often as every 15 minutes, then you can go back to the importer and tweak the schedule.
Now, you have a customizable dashboard that you can use for SEO analysis:

For the other Looker Studio SEO report templates presented in this article, you will need to make a copy of the selected report and then populate it with data from the platforms used. Most of these dashboards have Google Search Console or Google Analytics 4 as their main data source so you’ll just need to connect your account to Looker Studio to extract data.
Then, you will be able to use the dashboards. Keep in mind that some of these SEO report templates in Looker Studio might not be free.
Option 2. Create a dashboard in Looker Studio from scratch
Let’s say you want to create an SEO dashboard with Google Search Console data. While GSC has a native connection to Looker Studio, using Coupler.io to connect is more convenient. You can clean and organize your data before loading it into Looker Studio. If you do it in Looker Studio instead, your data visualization will be working slowly.
1. Collect data from Google Search Console or another data source
To start transferring your data, click the Proceed button below. If you want to extract data from another app (for instance, GA4, Google Ads, Facebook Ads, etc.), just select it from the dropdown list.

Once you create a Coupler.io account for free, you can connect your GSC and select the site and the report type you wish to add to Looker Studio.
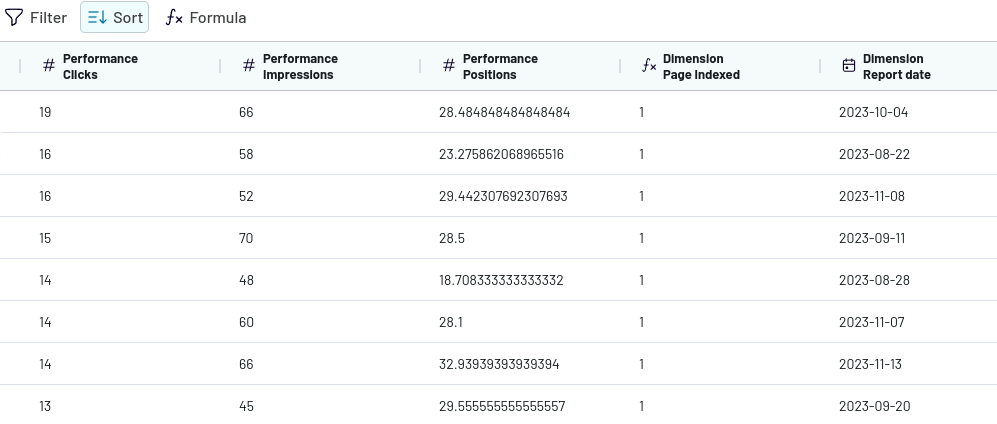
2. Organize and transform your data

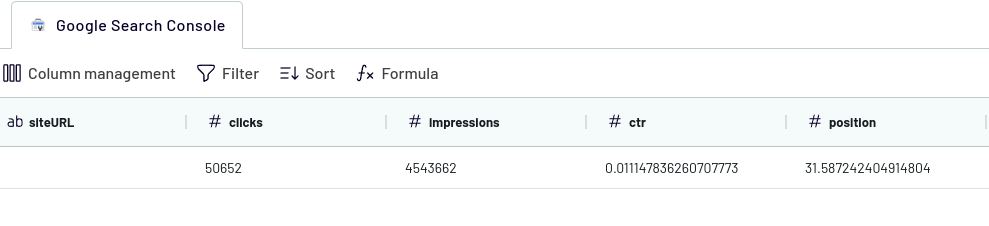
Now, you can preview and transform the data that will be added to your Looker Studio report. You can:
- Rename, rearrange, hide or add extra columns
- Apply filters and sort data
- Create new columns with custom formulas
- Combine data from several accounts or from different apps
Follow the steps from the wizard to add a new data source in Looker Studio to connect Coupler.io.
3. Schedule updates

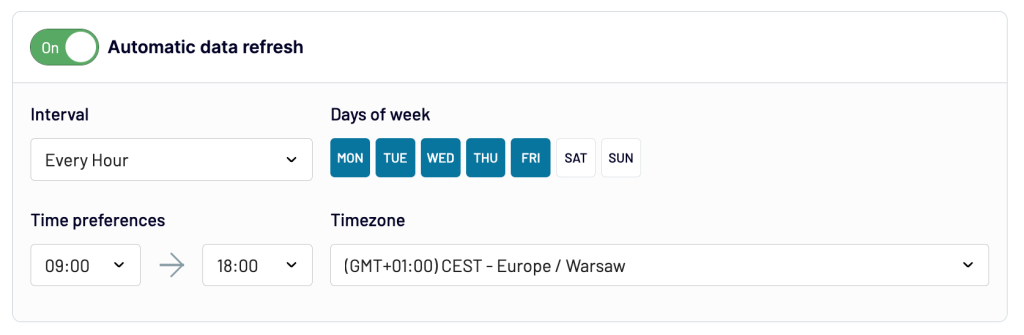
After you connect Google Search Console to Looker Studio with Coupler.io’s importer, you can go back to Coupler.io and schedule data updates. For near real-time reporting, you can choose to refresh your data every 15 minutes.
Then, go back to Looker Studio and click on Create report to get started.
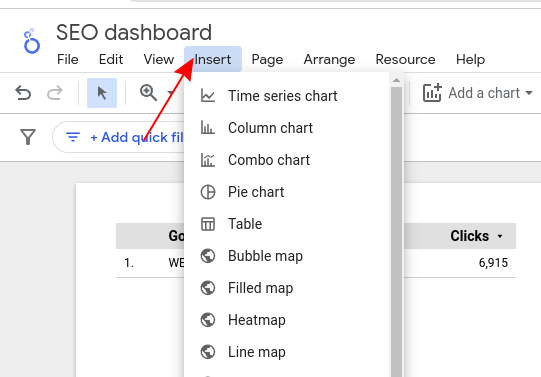
4. Add graphs and charts
Now, it’s time to decide what type of visual elements you want to add and how you want your data to be displayed in the dashboard. To add graphs or scorecards, click on Insert in the menu and select the visual element you need.

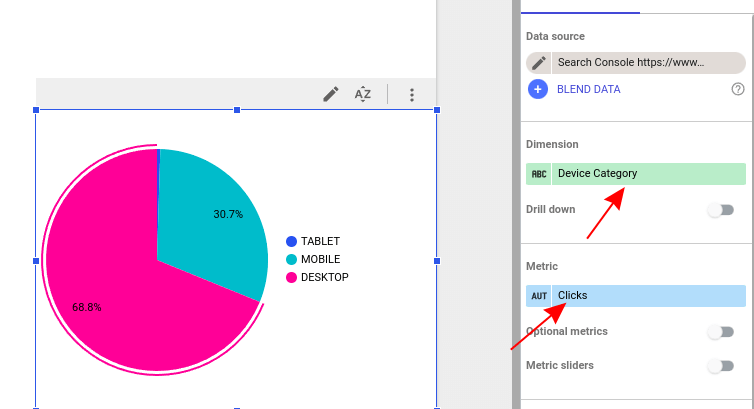
5. Select metrics and dimensions
After adding the visual elements, pick the dimension and the metrics you want to compare. For our example, we selected the dimension “Device category” and the metric “clicks” to see from which device our users access the website.

These are the basic steps on how to create a Looker Studio dashboard. Now, you will need to repeat steps 4 and 5 and fill the dashboard with visual elements that display and compare your metrics.
It can be complicated to create a dashboard from scratch. However, you can use one of the Looker Studio SEO report templates as a reference to help you understand what you need to add.
If you need more examples and tips on how to visualize your data, check out our video tutorial.

What to include in the SEO dashboard in Looker Studio?
There are many things you can add to your SEO dashboard. We have highlighted the most important sections you shouldn’t forget about.
- Overview section: In this part of the report, we recommend adding key metrics such as Total traffic, Organic traffic, and Conversions (goal completions).
- Traffic analysis: To keep an eye on website traffic, include Traffic over time, Traffic per channel, and Device breakdown.
- Search performance: This is a crucial section of the dashboard to know if your digital marketing efforts paid off. You should add Clicks, Impressions, CTR, and Position to check the performance in SERP. Top-performing pages can be included as well.
- Keyword analytics: For this section, we recommend including Top organic keywords and Keyword Position Distribution.
- Technical SEO Health: Another section that will give you valuable insights is technical SEO health. Here, you should include Page speed insights and Mobile usability.
- Backlink analysis: The number of domains that link to your content and their domain authority have a major impact on your domain authority and ranking. That’s why you should monitor Total backlinks, Referring domains, Top-linked pages, and Linking domains over time.
- User Behavior Metrics: Lastly, you should be monitoring the behavior of your users once they reach your website. Do they leave after a few seconds? Do they check out more pages? To find the answer to these questions, you need to include key metrics such as Bounce rate, Pages/session, and Average Session duration. Most SEO report templates in Looker Studio feature this information.
These sections and metrics should help you create an SEO dashboard that provides a complete overview of your SEO performance. However, there are also other insights and KPIs that you can monitor.
If data is available, you can also include competitor keyword performance and competitor traffic overview to know how well your website is performing compared to your competitors. This will allow you to work on optimization and improve your results.
Using Looker Studio SEO report templates for more efficient analysis
With one of the SEO report templates in Looker Studio presented in this article, you can make SEO reporting simple and more effective. These ready-to-use reports will save you a lot of time. Plus, with the Coupler.io SEO dashboard, you can have a near real-time overview of your performance.
You can also create a report from scratch, but it takes more time and effort than simply using a data studio template.
Automate SEO reporting with Coupler.io
Get started for free