Gone are the days when insights were buried in monotonous Excel sheets or confined to static PowerPoint slides. Today’s tools like Looker Studio (Google Data Studio) and Power BI stand at the forefront of this transformation, serving as the lenses through which businesses view their vast data narratives.
Looker Studio offers an intimate dance with Google’s suite, providing a familiar embrace for those vested in digital marketing analytics. Power BI brings Microsoft’s might, catering to intricate enterprise intelligence demands. Both platforms promise ease of use, yet they diverge significantly in scale and specialization.
In this comprehensive review, we dig deep into the nuanced functionalities of Looker Studio vs. Power BI. From the simplicity that endears them to novices to the depths that satisfy seasoned analysts, we bear each tool’s inherent strengths and challenges.
Looker Studio vs. Power BI: General overview
In the dynamic business intelligence (BI) world, the debate of Power BI vs. Looker Studio is critical for organizations. These two BI tools are leading contenders that offer robust solutions for data analysis and visualization. Each has unique strengths and considerations. This section aims to provide a comprehensive overview. It sets up the stage for an in-depth comparison which will guide businesses toward the right choice for their needs.
| Power BI | Looker Studio | |
|---|---|---|
| General Overview | A sophisticated analytics tool developed by Microsoft, offering robust data analysis and visualization | A free, cloud-based data visualization and modeling platform, known for its user-friendly interface and integration with Google’s suite |
| User Interface | Intuitive and easy to navigate, designed for users of all skill levels | User-friendly with a drag-and-drop feature, easy navigation, and convenient templates |
| Integration | Seamlessly integrates with other Microsoft services like Excel and SQL Server, and connects to various data sources | Primarily integrates with Google products and a wide range of external databases and services; limited native connections to external apps |
| Data Visualization | Offers visually appealing maps, Power Query for data transformation, and AI-enabled insights | Provides data blending, interactive visualization, calculated fields, and built-in templates for various reporting needs |
| Collaboration and Shareability | Features like workspaces, app publishing, and secure live sharing enhance collaboration | Supports real-time editing, version history, access controls, and live data sharing, leveraging Google’s infrastructure |
| Performance | Can handle large datasets but may experience slowdowns; limited MacOS support | Especially suitable for smaller teams without complex storage needs; larger organizations might find the free version insufficient |
| Customer Support and Community Resources | Comprehensive support for users with Microsoft Learn initiative, but some report long wait times | Limited direct support for free users, but many online guides and communities are available |
| Customization | Offers a variety of dashboard templates, enhancing report creation and analysis | Comes with various templates that boost productivity and allow for customization to align with branding elements |
| Challenges | Limited mobile experience and some rigidity in formulas; handling large datasets can be a challenge | Issues like opaque pricing for the Pro version, limited native paid add-on integrations, and some performance issues with larger projects |
| Pricing | Offers a free version, a Pro version at $10/user/month, and more extensive enterprise solutions | Looker Studio is free for self-service business intelligence. Looker Studio Pro costs $9 per user per project per month. It delivers advanced business intelligence and includes Google Cloud support |
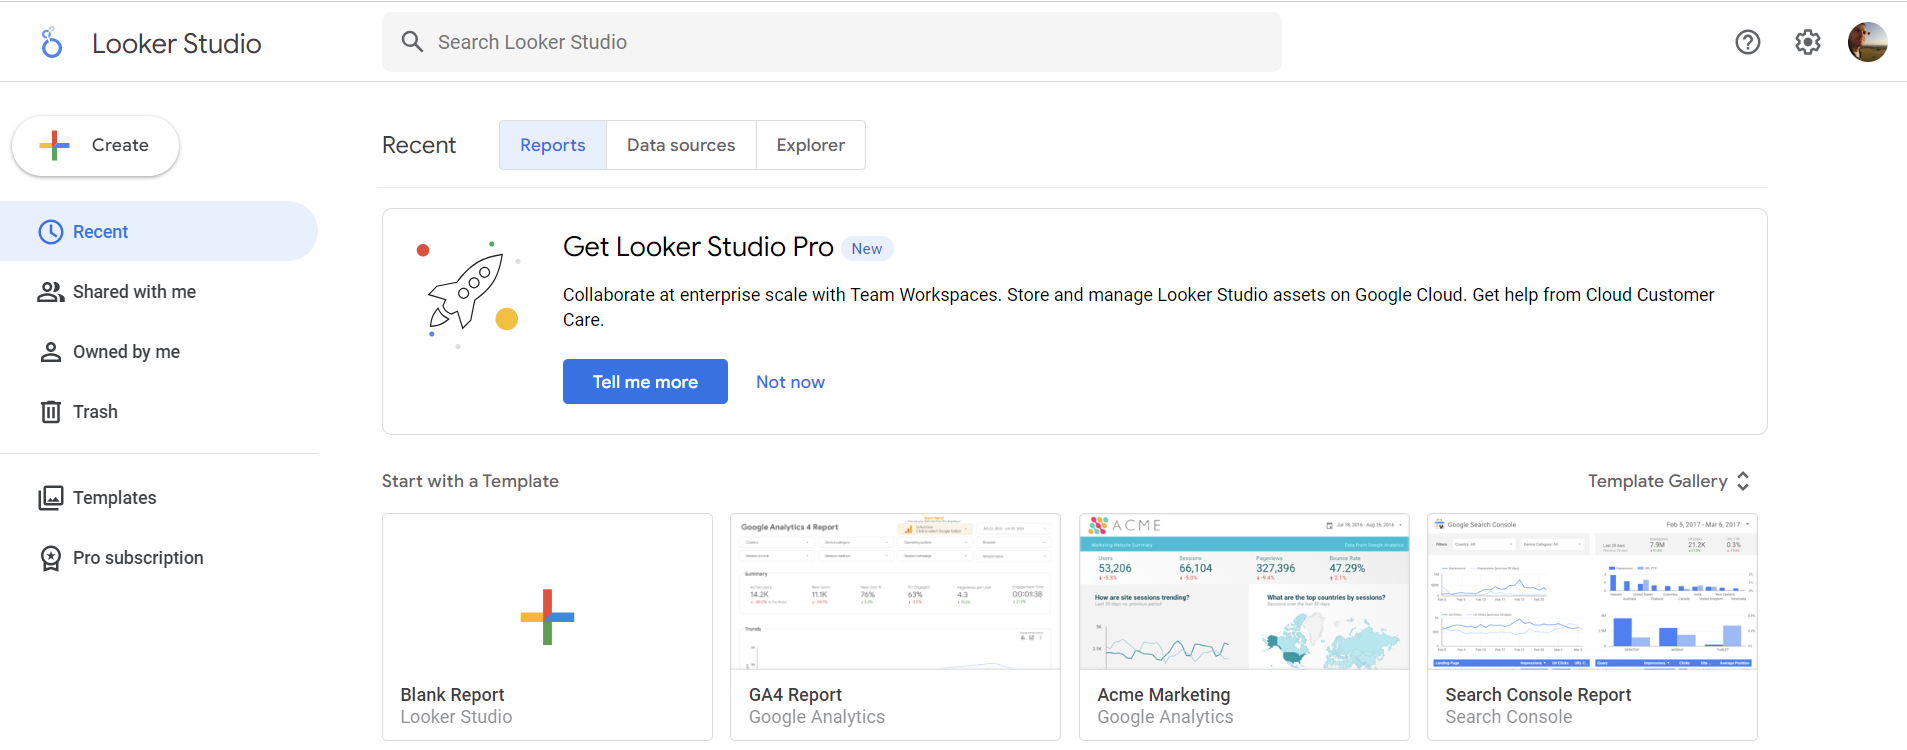
Looker Studio
Looker Studio is a free, cloud-based data visualization and data modeling platform. It simplifies creating custom reports and dashboards. The tool was previously known as Google Data Studio. Its friendly user interface allows users to organize and display essential information.
Looker Studio is a versatile tool that includes a range of data visualization and analysis features. The platform operates on a cloud-based storage system similar to Google Drive. This makes it especially suitable for smaller teams without complex storage like BigQuery.
We offer a Looker Studio detailed tutorial for newcomers. It guides users through creating interactive dashboards. This ensures users can fully leverage the platform’s capabilities for data reporting needs.

Looker Studio pros
- Affordability. Looker Studio’s basic version is available for free. This makes it an appealing option for those working within tight budgets.
- User-Friendly Interface. Experts behind the platform designed it for intuitive use. The tool comes with a drag-and-drop features and an easy-to-navigate layout. This reduces the learning curve. Users can create interactive dashboards and engaging reports hassle-free.
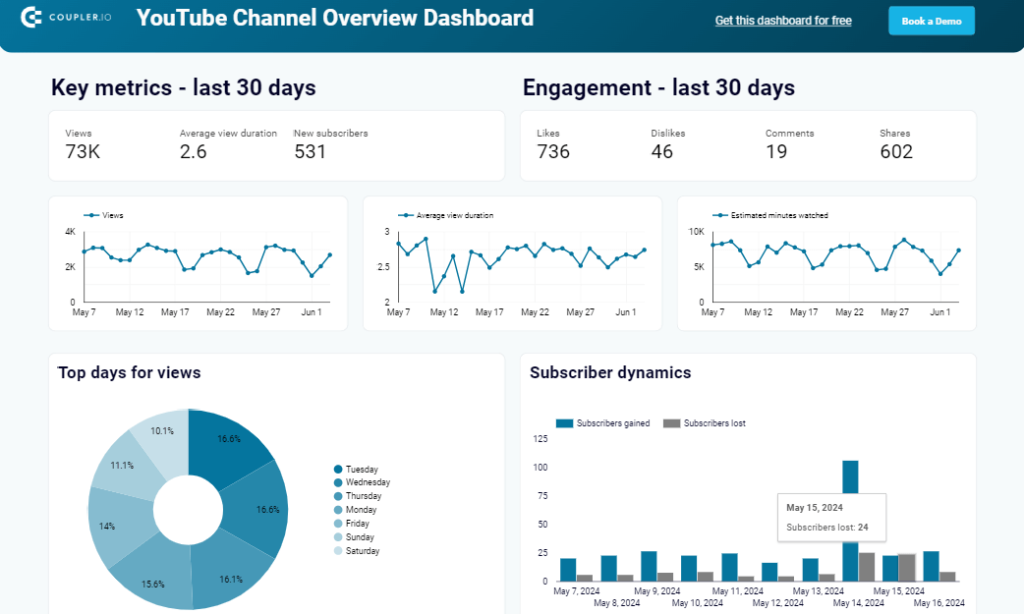
- Template gallery. Looker Studio comes with a template gallery which includes various templates that streamline the report creation process. These templates boost productivity by allowing quick setup for various reporting needs. Some of the dashboard templates are equipped with built-in data connectors, like these by Coupler.io. This way, you can easily load your data to the chosen template.
- Customization and Versatility. Users appreciate the ability to personalize reports with different fonts and colors. This versatility ensures that reports can align with branding elements. It makes them more coherent and professional.
- Diverse Data Sources. Looker Studio connects natively with multiple Google products. To connect to non-Google apps, you can use a bunch of partner connectors. One of them is Coupler.io, which provides over 50 Looker Studio integrations, including marketing, accounting, CRM, and other apps.
- Sharing and Collaboration. With Looker Studio, users can easily share reports with team members, clients, or other stakeholders. Looker Studio Pro offers additional collaboration features. This enhances the platform’s utility for larger teams.
- Google Platform Integration. Looker Studio is a Google product. It seamlessly integrates with many other Google services. This makes adoption straightforward for teams already using the Google ecosystem.
Looker Studio cons
- Opaque Pricing for Pro Version. While the basic version is free, Looker Studio Pro, aimed at larger teams and enterprises, does not have transparent pricing. To get a more accurate quote, users need to contact sales representatives.
- Insufficient native integrations. Limited native Looker Studio connectors mostly covering Google Services. Users may need to use partner connectors or third-party integrations. For example, they can use Coupler.io to connect to a broader range of apps. This expands the platform’s versatility.
- Limited Customer Support. Free users have limited support resources. However, there are many online guides and communities for assistance. Pro users can access more direct support, but some have reported long wait times.
- Challenges for Larger Organizations. Larger teams might find the free version insufficient for their needs. Upgrading to Pro is an option, but the costs may not be suitable for all businesses.
- Performance Issues: Some users have experienced lag, particularly with larger projects. While not a deal-breaker for most, it’s an area where improvements are anticipated.
- Design and Editing Limitations. Users have reported frustrations with moving elements and resizing panels. Google has progressed. However, users who are used to more responsive editing tools might find the experience lacking.
- Data Source Disconnections. Changing data sources or grouping elements can sometimes lead to disconnections. This can result in errors. This can be particularly troubling during presentations or time-sensitive projects.
- Complexities with External Data Sources. Connecting non-Google services can be tricky. It might require API knowledge or investment in third-party services.
Learn:
- Report Duplication Difficulties. Duplicating complex reports for different data sources can be cumbersome and time-consuming. This can be a significant drawback for those needing to quickly generate reports for multiple clients.
Looker Studio presents a robust, cost-effective solution for data visualization and reporting. This is especially true for small to medium teams already using Google’s ecosystem. Its user-friendly design, diverse integrations, and customization options make it a strong contender.
However, potential users should consider the cons. This is especially true for those from larger organizations. They need extensive external integrations. These include performance issues and limitations in customer support and report management.
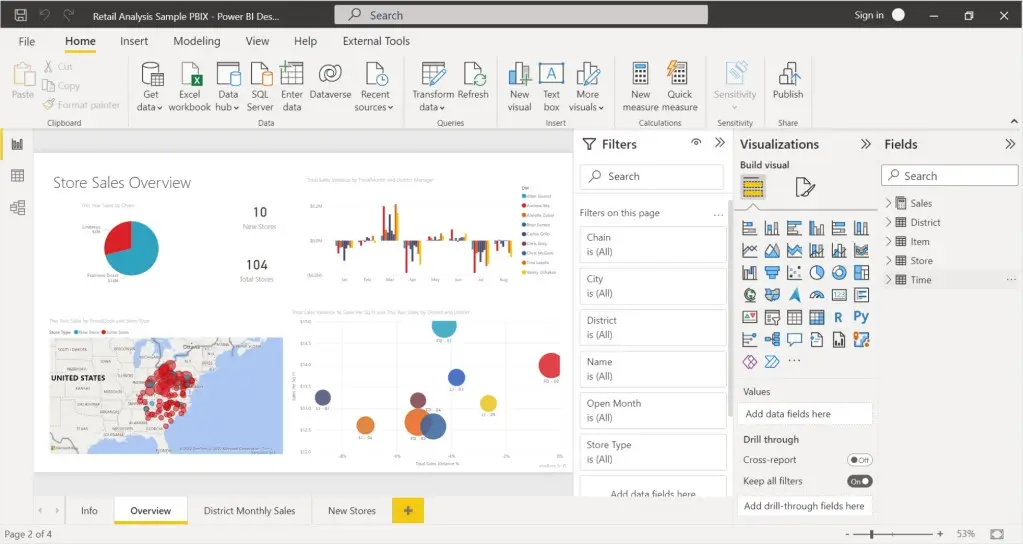
Power BI
Power BI is a sophisticated analytics tool developed by Microsoft. It is a dynamic service for business intelligence that offers a robust front-end platform. Users can easily visualize data and glean actionable insights. Also, as a data visualization tool, Power BI allows you to analyze, visualize, and share data across various departments. This enhances collaboration and decision-making within your organization.
As a Microsoft product, Power BI seamlessly integrates with other Microsoft services. These include Teams, Outlook, and Sharepoint. This integration makes it ideal for those already embedded in the Microsoft ecosystem. It ensures a cohesive and streamlined experience. Power BI excels in transforming data from many sources into interactive dashboards.
Explore our detailed Power BI tutorial. Learn how to leverage this tool for your business’s unique needs. Dive deeper into Power BI’s capabilities.

Power BI pros
- User-Friendly Interface. Power BI’s interface is intuitive and easy to navigate. It’s a user-friendly option for individuals of all skill levels. Its straightforward design ensures that users can learn quickly and utilize the platform.
- Seamless Microsoft Integration. As a Microsoft product, Power BI offers seamless integration with other Microsoft services like Excel and SQL Server. This integration benefits environments that already use Microsoft products. It allows for a cohesive and efficient workflow.
Explore how to connect API to Power BI.
- Powerful Data Transformation. Power BI includes an in-built tool called Power Query. This tool allows users to transform data by filtering and correcting inaccuracies. This feature ensures that the data used for analysis is clean and reliable.
- AI-Enabled Insights. Power BI Q&A is an AI feature built on natural language capabilities and machine learning. Users can gain quick insights by posing questions.
- Cost-Effective. Power BI’s pricing is not that high, considering its pricing plans start at $10 per month per user. This affordability makes it an attractive choice for small businesses. It also makes it appealing to larger enterprises who are looking to leverage powerful analytics without a significant investment.
Power BI cons
- Mobile Experience. Power BI offers a mobile app for accessing dashboards. However, the experience is less optimal compared to other platforms. The app doesn’t adjust to different screen sizes, hindering the mobile user experience.
- Limited MacOS Support. Power BI Desktop is only available for Windows 8 or newer versions. It lacks native support for MacOS. Users can employ a Virtual Machine to run Power BI on a Macbook, but this workaround may only be acceptable for some.
- Performance with Large Datasets. Power BI can experience performance slowdowns when handling huge datasets. It can manage up to 100 TB of data. Beyond this, users may notice reduced responsiveness and longer processing times.
- Rigid Formulas. Power BI’s formula capabilities are limited. For example, the concatenate function can only combine two elements simultaneously. The DAX language is powerful for custom calculations. However, it lacks flexibility and can be challenging for complex visualizations.
- Data Handling Capacity for Free Versions. The free version of Power BI has a data capacity limit of around 2GB. Larger datasets require an upgrade. Ingesting millions of rows of data takes a great deal of time.
Power BI is ideal for beginner data analysts and small organizations. It offers a user-friendly interface, seamless Microsoft integration, and cost-effectiveness. Despite some limitations, like mobile experience and handling large datasets, its benefits often outweigh these issues. This makes it the right choice for your marketing BI needs.
Looker Studio vs. Power BI: Full comparison
This section thoroughly compares Microsoft Power BI vs. Looker Studio. We’ll examine their products, integrations, functionalities, collaboration features, learning curves, and pricing structures. Such an overview aims to help users clearly understand each tool’s offerings. It guides you to the right choice for your data analysis requirements.
Power BI vs. Looker Studio: Products
First, let’s compare the range of products Looker Studio vs. Power BI offers:
Power BI products
- Power BI Desktop. A free Windows-only application used primarily for data visualization activities. It allows connection to various data sources. It also features tools like Power Query, Power Pivot, and Power View. These tools enable comprehensive data handling and report creation.
- Power BI Service. A cloud-based platform for publishing and collaborating on reports and dashboards. It offers features like automatic data refresh and role-based access control.
- Power BI Pro. A subscription plan for Power BI Service costs $10 per user per month. It offers enhanced collaboration and publishing features.
- Power BI Premium. This product is aimed at enterprises with more users. It offers extra capabilities and support for $4,995 per month.
- Power BI Mobile. Provides access to reports and dashboards on mobile devices. It has offline capabilities for viewing messages without an internet connection.
Looker Studio products
Looker Studio does not segment its offerings into distinct products like Power BI. Instead, it provides a comprehensive, cloud-based platform. Users can use it to create customized, interactive dashboards and reports. It integrates with various data sources, primarily within the Google ecosystem.
Looker Studio vs. Microsoft Power BI: integrations
Secondly, it is time to look at an essential aspect of any business intelligence tool – integration capabilities. Looker Studio vs. Power BI offers extensive integrations but approaches them differently.
Power BI integrations
Power BI excels with its ability to connect to various sources, including databases like SQL Server and Oracle, cloud services such as Azure and AWS, spreadsheets, and web services. Power BI Desktop offers more extensive data sources than Power BI Service, featuring built-in apps and connectors to integrate data. Finally, Power Query is used to gather data from these various sources, which is then crafted into datasets for visualization.
Power BI Desktop has a range of supported data sources, from flat files and databases to Microsoft Fabric, Power Platform, Azure, and various online services. Despite the limited data sources in Power BI Service, it’s still a powerful tool for accessing existing data, adding files like Excel workbooks, connecting to cloud databases, and maintaining updated reports with auto-refresh settings.

Looker Studio integrations
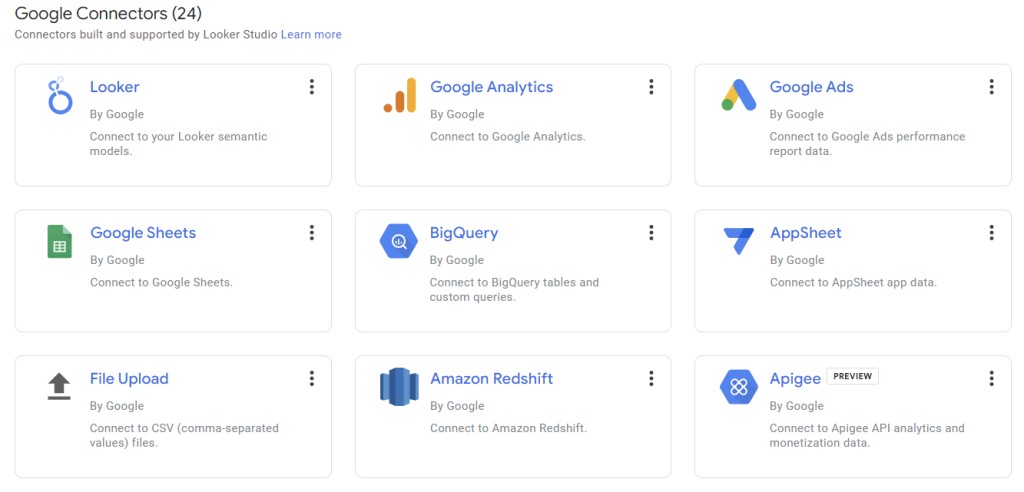
Accessing various applications and data sources is pivotal in extracting valuable insights from datasets. To facilitate this, Looker Studio has developed a comprehensive hub of data connectors. It directly integrates with 18 Google products, including Google Analytics, Google AdWords, and Google Sheets, providing users with a seamless connection to these essential services.
Furthermore, Looker Studio extends its reach by offering connections to an impressive array of 454 external databases, such as MySQL and PostgreSQL, broadening the scope for data importation and analysis. Despite this extensive network, Looker Studio’s native connections to external apps are generally less numerous than Power BI’s.

While Looker Studio has limited connections to external apps and Power BI might offer only some desired integration, Coupler.io is a solution for both. It’s a data integration platform that expands the range of Looker Studio and Power BI integrations. Select the needed app from the drop down and specify which destination you need (Power BI or Looker Studio), then click Proceed. In a couple of simple steps, you’ll get you app connected to the selected destination.

With Coupler.io, users can automatically connect 50+ business apps to either BI tool via direct integration and schedule updates. The platform currently offers a variety of dashboard templates specifically designed for Looker Studio. In the near future, this service will expand to include a range of templates tailored for Power BI. This expansion promises to significantly enhance the data visualization and reporting capabilities of both platforms.
Microsoft Power BI vs. Looker Studio: Functionalities
Thirdly, to understand the scope of Looker Studio vs. Microsoft Power BI, one should focus on its key functionalities and key features. So, let’s do that next.
Power BI functionalities
- Data Visualization. Power BI not only offers visually appealing maps for location-based data but also turns your data into compelling visuals with advanced data-analysis tools, AI capabilities, and user-friendly report creation. This enriches user insights and understanding significantly.
- Data Alerts. Power BI offers data alerts so that the users can receive notifications when dashboard data exceeds set thresholds. This tool is synchronized across platforms and integrated with Power Automate. It provides a proactive approach to data management.
- Mapping Types. Offers four core map types: Basic, Filled, ArcGIS, and Shape Map, each with distinct visualization capabilities??.
- Advanced Analysis with AI. Power BI supports custom visualizations using R and Python, allowing for highly customizable data presentations.
- Microsoft Fabric. Integrates with Microsoft’s ecosystem for seamless data management and analysis.
Looker Studio functionalities
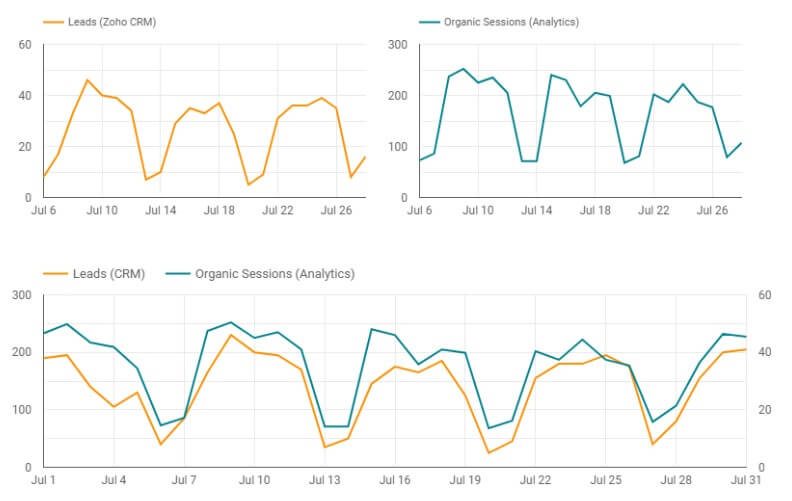
- Data Blending. Compare data from multiple sources using a common “join key”. For example, you can blend data from different CRM tools and Google Analytics and visualize these insights. For blending large datasets, it makes sense to use third-party connectors since this functionality can make Looker Studio slow. For example, Coupler.io allows you to connect multiple data sources and blend data from them.

- Interactive Visualization. Customize interactive reports using filters, drop-downs, sliders, and other controls. Engage with charts, tables, graphs, geographic heat maps, and scorecards. This enhances the analysis experience.
- Calculated Fields. Create new metrics using functions and calculations for data manipulation, both within Looker Studio. For extensive calculations, however, it’s better to use calculated fields created outside of Looker Studio. For example, Coupler.io allows you to create calculated fields for your data before it’s loaded to Looker Studio. This way, your Looker Studio report won’t suffer from slow performance or glitches.
- Looker Studio API. Facilitate the automation of managing and migrating Looker Studio assets for Google Workspace or Cloud Identity organizations. It allows quick configuration of applications to leverage Looker Studio’s powerful data visualization and reporting capabilities. Makes it easier to create and manage interactive dashboards and engaging reports.
- Template gallery. Access a template gallery to find free templates as a starting point for your interactive reporting. The templates come with interaction filters to enhance user engagement and analysis.
- Widgets. Several available to customize dashboards for tailored analytics.
Looker Studio vs. Microsoft Power BI brings unique functionalities, catering to diverse data visualization and analysis needs. Understanding their capabilities, from data blending to advanced AI analytics, helps identify the right tool for specific business requirements, ensuring effective and insightful data utilization.
Reports and templates in Looker Studio vs. Power BI
Templates in Looker Studio and Power BI dramatically simplify and accelerate reporting. Both platforms offer a variety of dashboard templates tailored to different needs. Users can find these templates within the platforms or through connectors like Coupler.io, which offers templates for both Looker Studio and Power BI. Data aggregation with its further visualization does not need to be as complex as it was before.
Now, let’s have a glance at how Power BI and Looker Studio deal with templates.
Report templates in Looker Studio
In Looker Studio, there is a report gallery where users can access and copy report templates directly. Some templates allow you to connect your own data sources to create reports. This makes it easy to leverage Looker Studio’s visualization capabilities. It is especially helpful for those who are new to the platform or seeking a quick start on their data projects.
Report gallery is not the only way to find Looker Studio report templates. Partner connectors usually develop their own galleries of reports designed to facilitate their users’ reporting. For instance, here is a dashboard gallery by Coupler.io and here is what a report template may look like.

Templates in Power BI
For Power BI, the template gallery is not accessible as in Looker Studio. However, you can find these templates on the Power BI forum.
These templates include report pages, visuals, data model definitions, and query definitions. However, they do not include the data itself. To create a template, users export it with a .PBIT extension. Using the template involves opening it in Power BI Desktop. The user may be prompted to provide values for any parameters and specify the location of the underlying data before the report can be created.
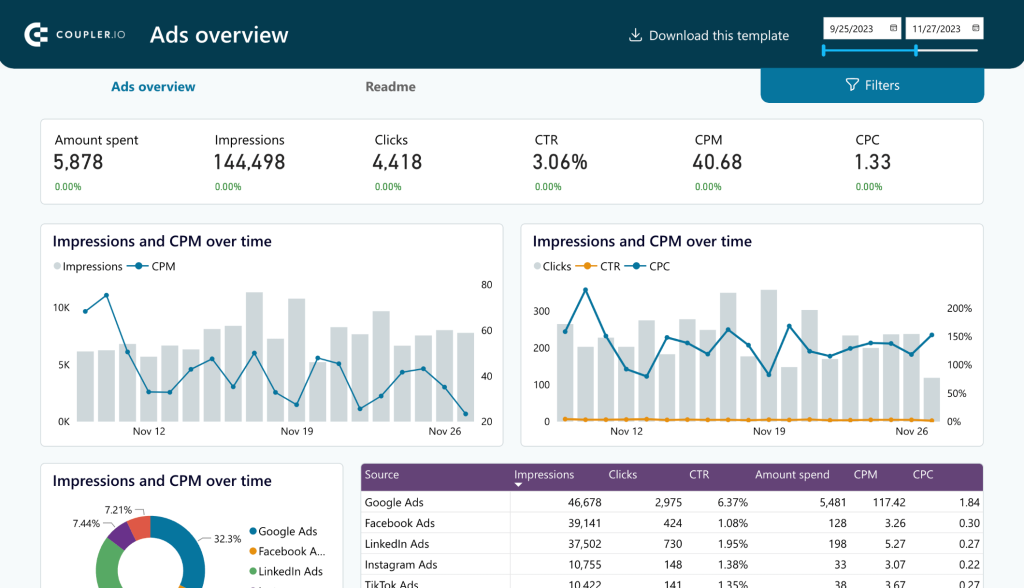
Similarly to Looker Studio, partner connectors provide their PowerBI report templates designed with built-in integrations. For example, here is a PPC multi-channel dashboard template in Power BI by Coupler.io.

Both platforms provide a way to streamline the report creation process through templates. Power BI requires a download, while Looker Studio allows for direct copying within the platform.
Looker Studio and Power BI stand out for their collaboration and shareability features. Here’s how each platform enhances team collaboration and report distribution.
Power BI collaboration and shareability
- Workspaces. Organize and collaborate on reports and dashboards with teams.
- Power BI Service. A cloud service for publishing and sharing insights.
- App Publishing. Distribute Power BI apps to users in your organization.
- Sharing Dashboards and Reports. Share insights easily with stakeholders.
- Embedding. Embed reports in websites or apps for wider access.
- Exporting. Export reports for offline access and analysis.
- Secure Live Sharing. Share live data securely within and outside the organization.
For more information on Power BI sharing and collaboration capabilities, turn to documentation and the platform’s Microsoft Learn initiative.
Looker Studio collaboration and shareability
- Google’s Data-Sharing. Leverage Google’s infrastructure for secure and efficient data sharing.
- Real-Time Editing. Collaborate in real-time on reports and dashboards.
- Version History. Track and revert changes with version control.
- Access Controls. Manage who can view or edit with robust access controls.
- Link Sharing. Easily share reports with a link.
- Embedded Reports. Embed reports in web pages or intranets.
- Email Scheduling. Schedule and send reports via email automatically.
- Live Data Sharing. Share live data for up-to-the-minute insights.
Visit the Looker Studio documentation to better grasp the tool’s sharing and collaboration capabilities. Looker Studio and Power BI offer distinctive features to streamline collaboration and enhance data sharing. Choosing the right platform depends on your team’s specific needs, preferred tools, and the complexity of your data-sharing requirements.
Looker Studio vs. Power BI: pricing
Understanding the pricing structure of Looker Studio vs. Microsoft Power BI is essential for organizations planning their BI strategy. Here’s a breakdown of the different plans and features each platform offers.
Power BI pricing
- Free. Create visualizations and dashboards without sharing capabilities.
- Power BI Pro. Share reports within the organization at $10/user/month.
- Power BI Premium. Advanced analytics and all Pro features at $20/user/month.
- Power BI Premium per Capacity. For the entire organization without user limits at $4,995/month.
- Microsoft Fabric. Access to Microsoft Fabric for a comprehensive experience. Pricing varies.
Looker Studio pricing
- Looker Studio. No charge for self-service business intelligence.
- Looker Studio Pro. The price is $9 per user per project per month. It includes department-level business intelligence and Google Cloud support. It also includes system administration.
Both Power BI and Looker Studio provide a range of plans to accommodate various organizational needs, from small teams to large enterprises. Assessing these options in light of your specific requirements and budget will guide you to the most suitable choice for your business intelligence needs.
The Verdict – Looker Studio or Power BI?
There’s no one-size-fits-all answer when deciding between Looker Studio vs. Power BI. Looker Studio excels with its seamless integration with Google products and user-friendly interface, making it ideal for those already in the Google ecosystem. Power BI, however, stands out with its deep Microsoft integration and powerful analytics capabilities, which are suitable for those needing advanced data handling and data storage.
Optionally, you can check out more Looker Studio alternatives and the best Power BI alternatives, as well as our comparison of Excel vs. Power BI.
Your choice should align with your specific data needs, team familiarity, and the scale of your operations. Both platforms offer unique strengths, so consider the one that aligns best with your business’s data strategy and workflows.
In your decision between Looker Studio and Power BI, consider leveraging Coupler.io for its expansive range of dashboard templates, enhancing both platforms’ capabilities. As Coupler.io grows, anticipate a broader array of 2024 templates specifically tailored to enrich your experience with Looker vs. Power BI.