
Having reliable, actionable YouTube data in front of your eyes can help you produce better videos and, as a result, achieve your business goals. You’ll find plenty of that data directly in YouTube analytics. However, many would agree that such data is much easier to understand and act on if it’s placed on a good-looking Looker Studio dashboard.
But how do you get such a dashboard? What kinds of metrics should you look at? How do you get your data into Looker Studio in the first place? We’ll cover all these questions and more in this tutorial on building a Looker Studio YouTube template. Read on to learn more!
How to build a Looker Studio YouTube template
You have three options to choose from:
- Create a dashboard yourself
- Request a service to create a bespoke dashboard
- Use a white-label dashboard template
Creating a Looker Studio YouTube dashboard from scratch can be a time-consuming process, often taking days or even longer. You need to design a layout, connect the dashboard to YouTube, calculate metrics, and so on.
Another option is to seek help from a professional data analytics team or service. You can define the requirements and get professional assistance in identifying the most critical metrics for your channel. As a result, you’ll be provided with a dashboard that meets your particular needs. However, this may take several weeks.
White-label templates make reporting incredibly fast and straightforward. Instead of spending days on development and messing with API, you can have a fully functional Looker Studio YouTube dashboard in minutes. Coupler.io, a reporting automation platform, offers a bunch of dashboard templates in Looker Studio including for YouTube. They are free, automated, and are easy to set up. Let’s check them out.
YouTube dashboard template with detailed performance analytics
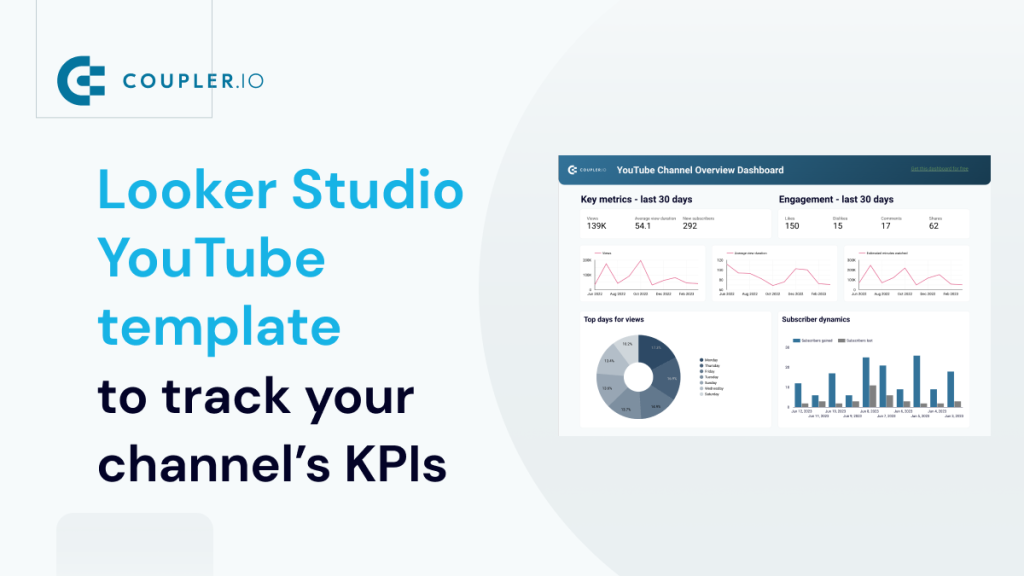
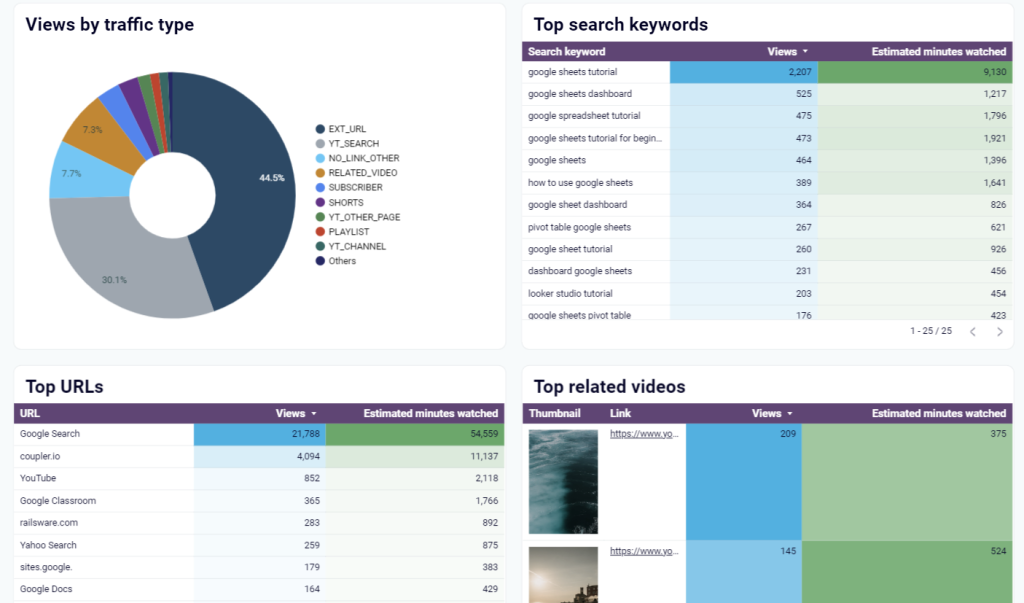
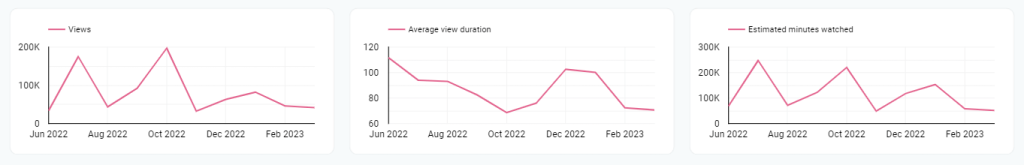
This dashboard template provides you with a comprehensive overview of your YouTube channel’s performance. You can track crucial metrics such as views, engagement, audience demographics, subscription dynamics, traffic source, and much more. With the insights derived from this social media analytics dashboard, you can make data-driven decisions to drive the success of your YouTube channel.

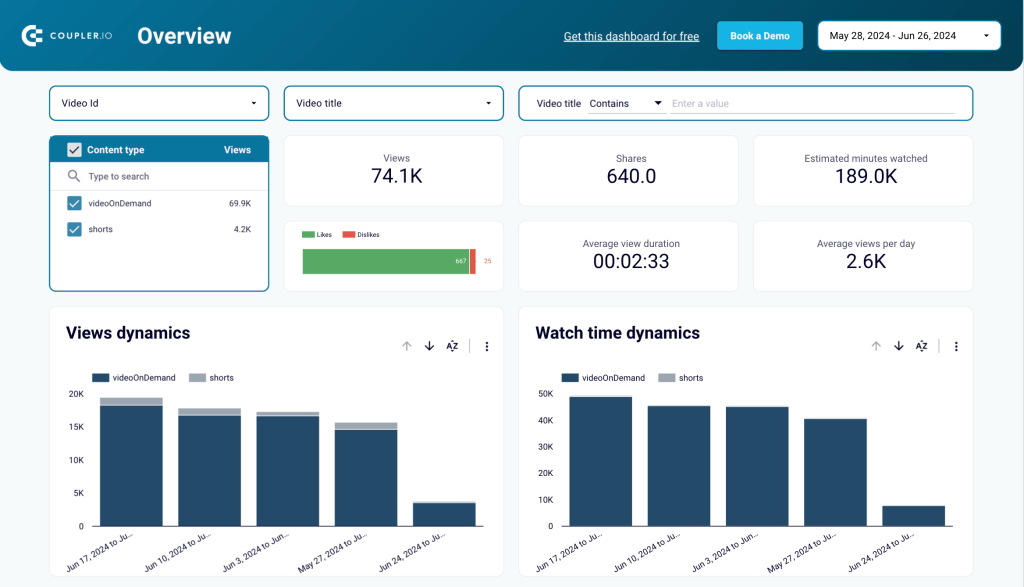
The overview of channel performance is good but the template also gives other valuable analytics:
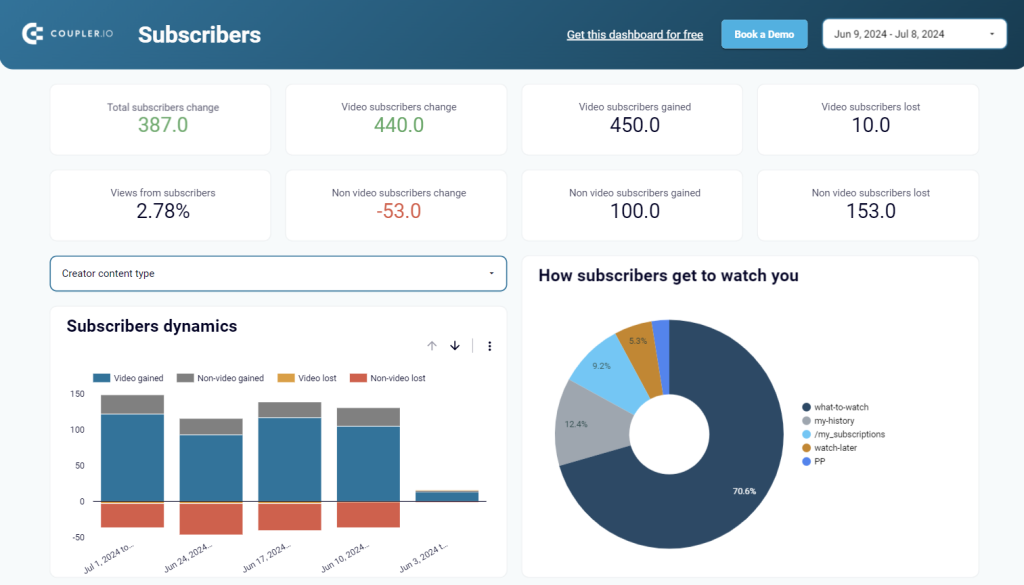
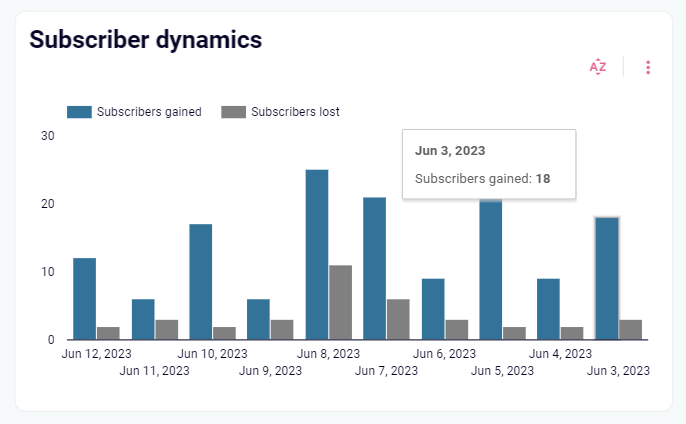
- Analysis of subscribers: how they get to watch your channel, what is the subscription dynamics, and so on.

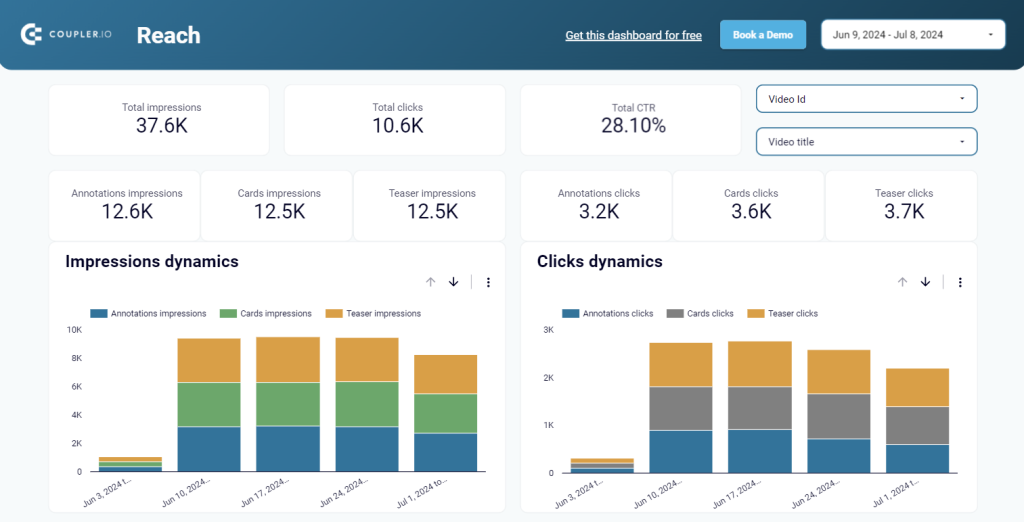
- Insights into the channel reach including views/clicks dynamics, impressions and clicks on annotations, cards, and teasers, etc.

- Traffic sources analytics showing the top search keywords, URLs, and related videos.

How to set up the template
As this is an automated report template, all you need to do is plug in your YouTube channel and Looker Studio accounts. All the settings are already pre-selected, so your data will be transferred and visualized automatically. Also, Coupler.io automatically keeps your dashboard up to date.
Check out essential influencer dashboards to have in 2024.
It only takes a few minutes to create your own copy of the dashboard. No technical knowledge or any coding is required. Open the Looker Studio YouTube template and navigate to the Readme tab. Follow the instructions to set up a Coupler.io importer.
- After that, connect your Google account associated with your YouTube channel. Select the channel you want to use for the template.
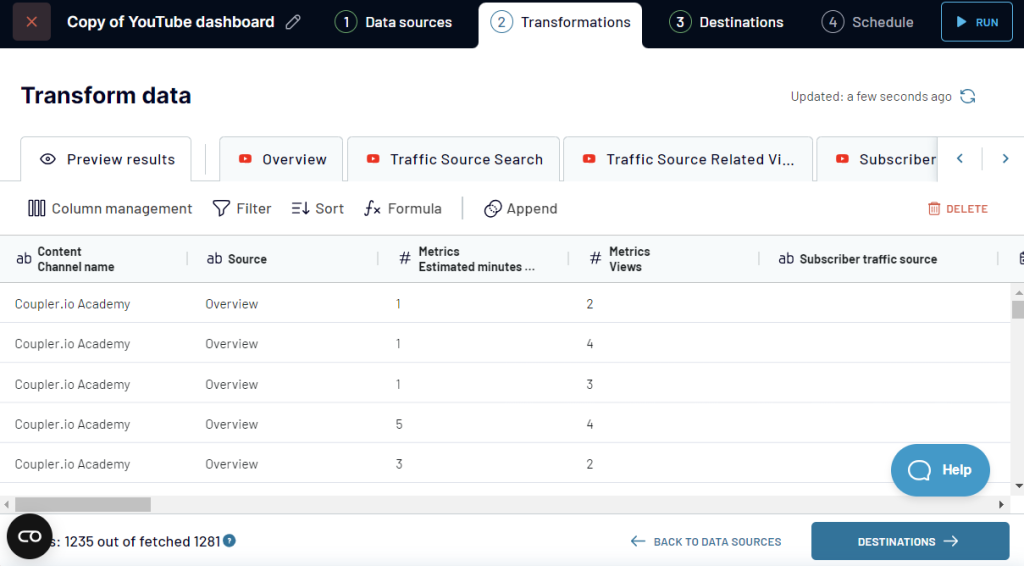
- Once you’ve selected the channel, click Transformations to preview your dataset. No actions are needed here – just click Destinations.

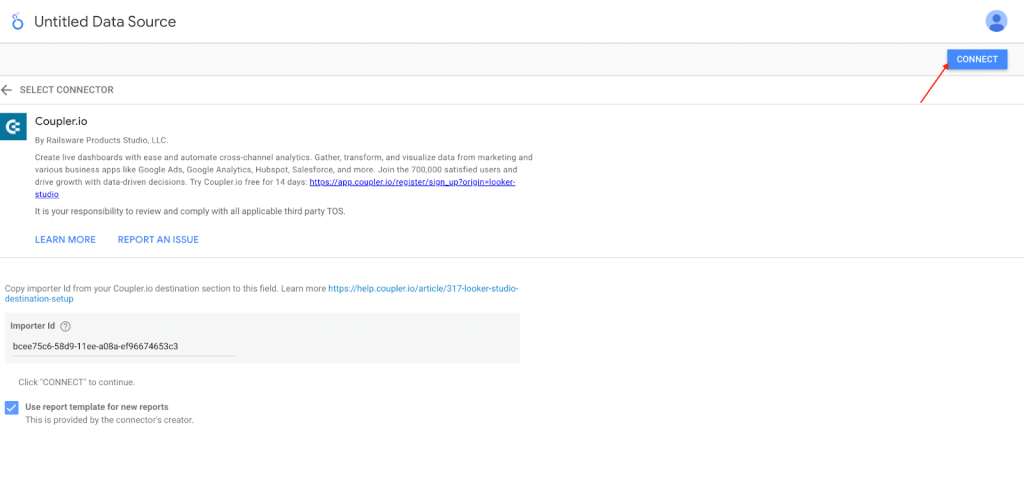
- Now it’s time to connect your destination application – Looker Studio. Follow the onscreen instructions to authorize the Looker Studio connector, then click Connect. This will create a Looker Studio data source connected to your YouTube data.

- Then, click on Create Report to create your own copy of the dashboard.

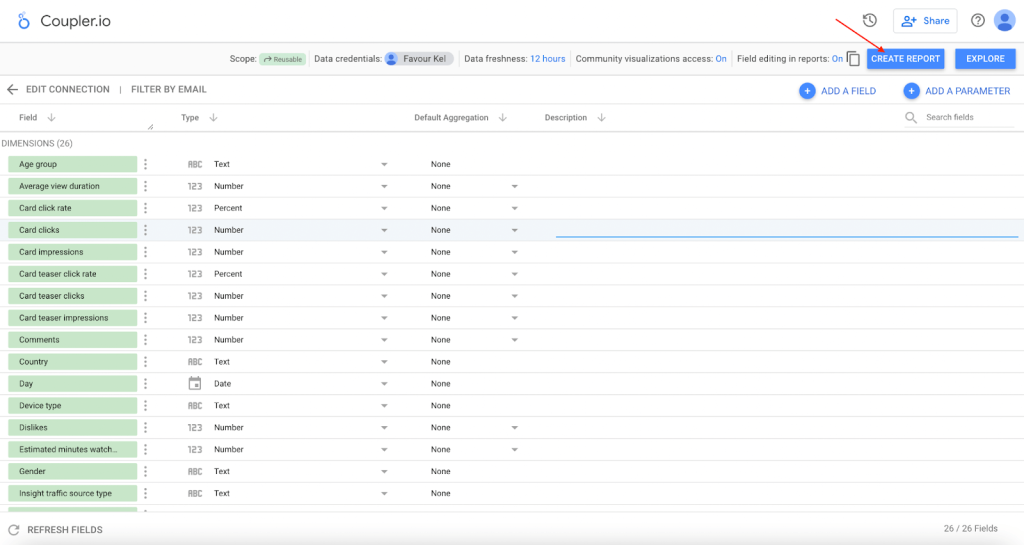
You will get a copy of the YouTube dashboard with your data populated.
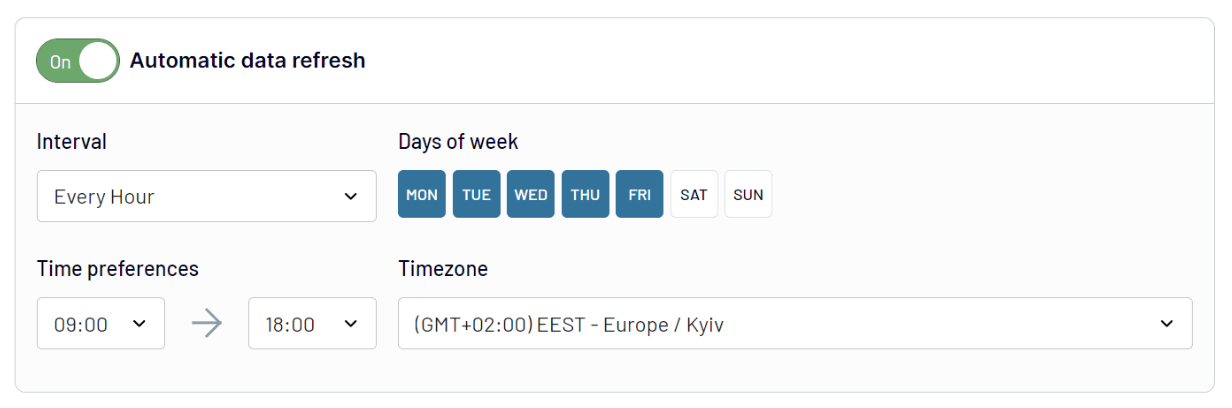
One more thing. Your YouTube report is self-updating which means it will refresh data on its own. By default, we’ve set up a daily refresh frequency, but you can change it to your preference. For this, you need to go back to Coupler.io, click Finish and Proceed, and change the configuration of the default schedule. You can have the data refresh schedule close to real-time – every 15 minutes! Once you’re ready, click either Save and Run or Save and Close.

Now you can use Looker Studio functionality to customize your dashboard. If needed, you can add more data, move the blocks around, add and delete sections, and so on.
That’s it! The whole process only takes minutes.
YouTube KPIs dashboard template
The YouTube dashboard template above provides detailed analytics into different areas of your channel performance. If you do not require that much information, check out this option. It’s a one-page dashboard that focuses on key performance indicators of your channel
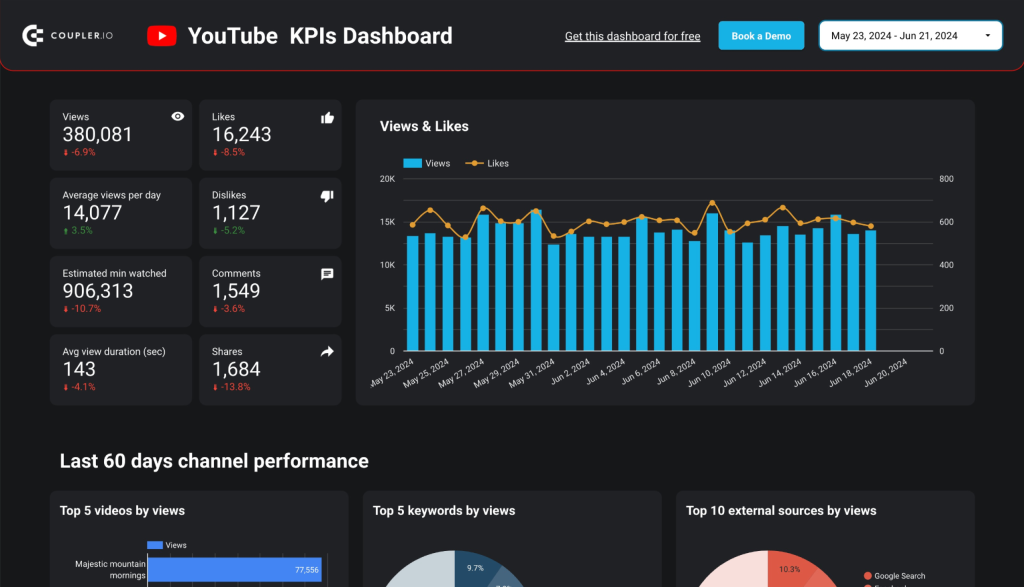
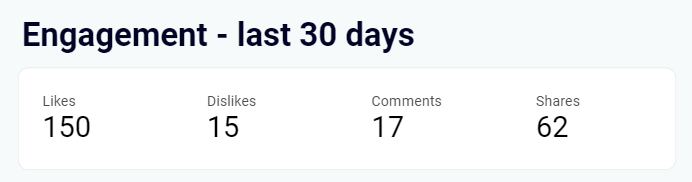
Here you only get essential information without in-depth analytics. In addition to the overview of key metrics such as views, likes, comments, and others, the dashboard features the following data:
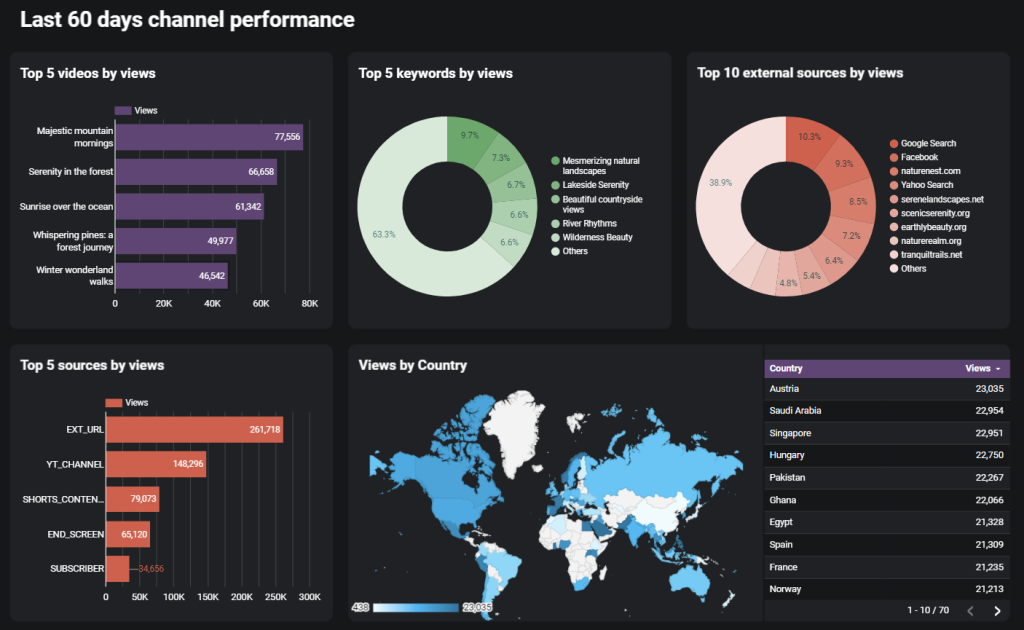
- Last 60 days’ channel performance including top keywords, videos, sources, views, etc.

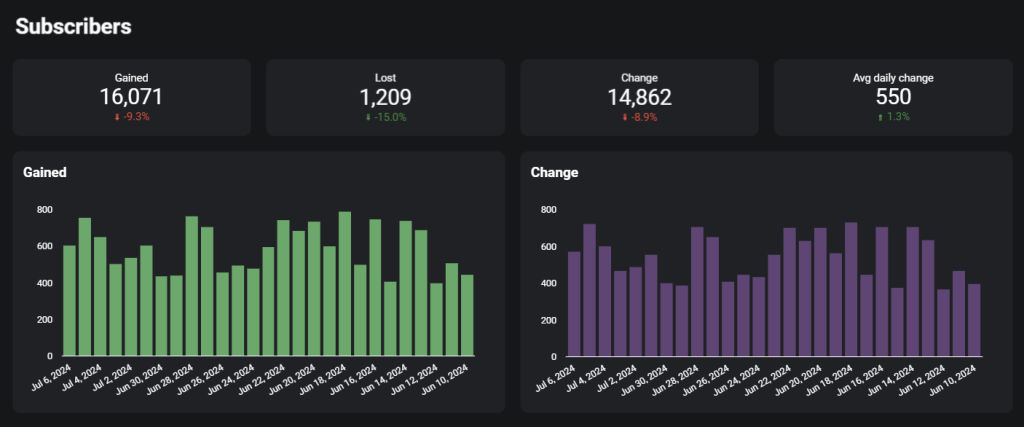
- Subscriber progress overview including how many subscribers were gained/lost and the change dynamics.

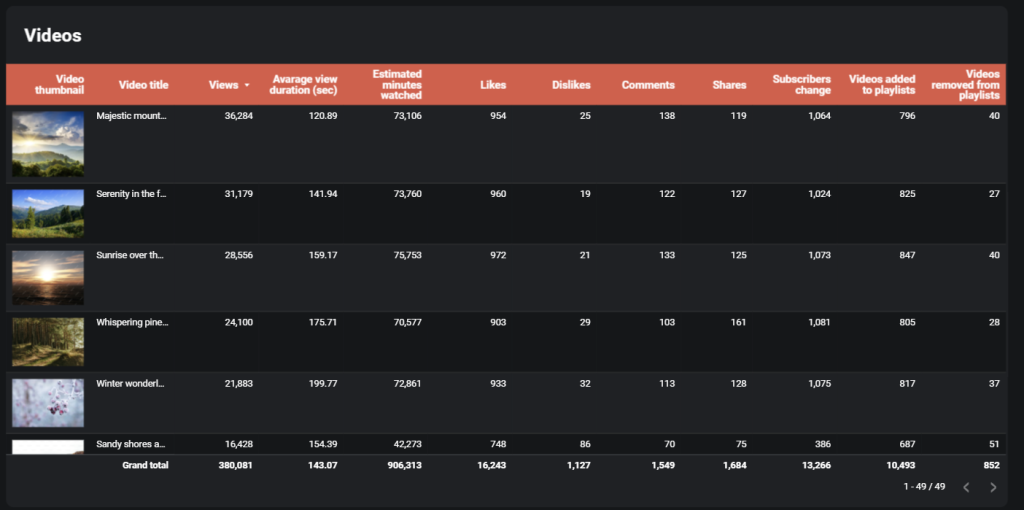
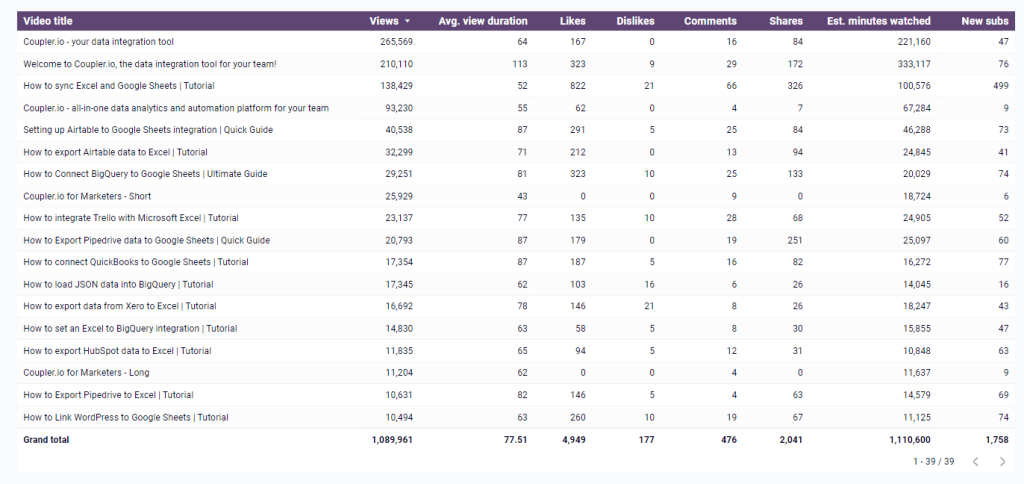
- A table with video content performance breakdown by views, likes/dislikes, comments, shares, etc.

The setup flow for this YouTube dashboard template is pretty much the same as for the one above. So, give it a try right away!
Bonus: Website traffic from YouTube – performance analysis dashboard template
This dashboard template differs from the ones above by data source – it’s based on the data from Google Analytics 4 and allows you to analyze the traffic coming to your website from YouTube.
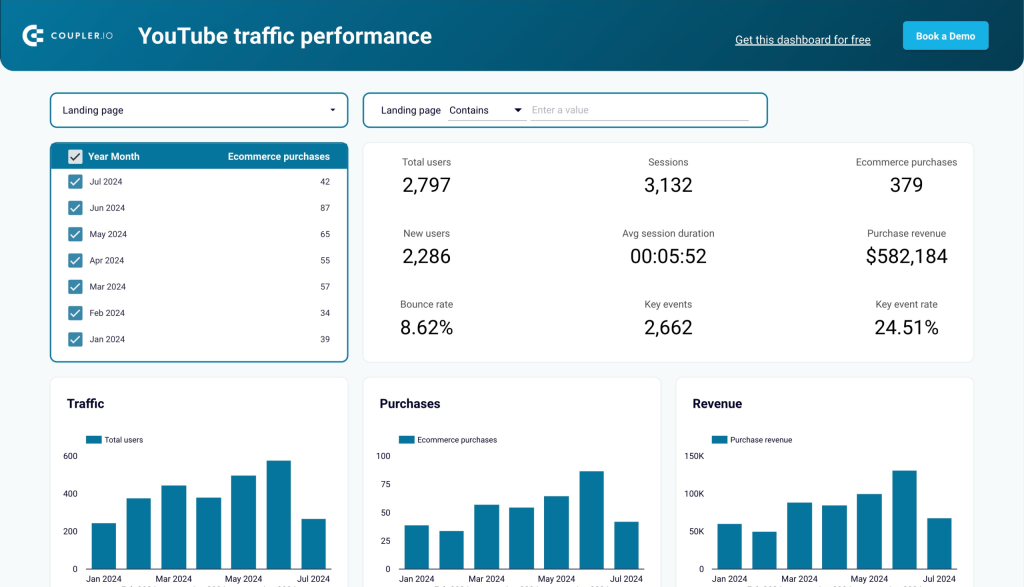
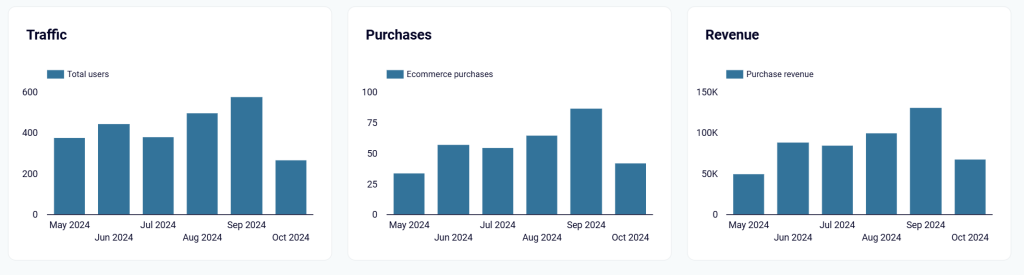
With this dashboard, you can monitor the performance of your video series in terms of conversions on the website. These include how many users came to your website, how many purchases they made, and how much revenue you got from those conversions.

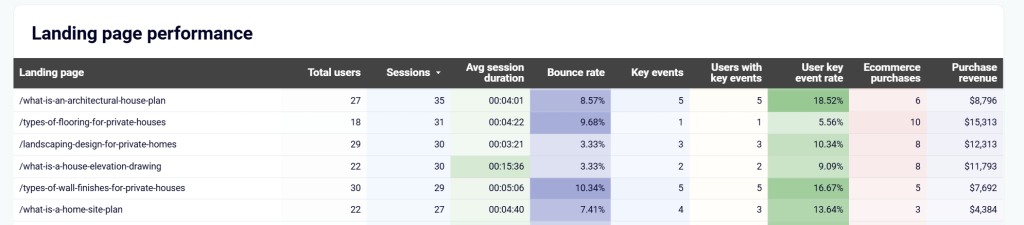
The dashboard’s key dimension or filter criterion is your website’s landing pages. You can see how users from YouTube behave on specific pages of your website including how long they stay there, whether they make a purchase or perform any key events, etc. All this information is summed up in a table at the bottom of the dashboard and you can filter it, of course.

Since it’s a Coupler.io-supported template, the setup flow is very intuitive. Follow the instructions to connect your GA4 account and load data to your dashboard copy in Looker Studio.
What metrics to track on the YouTube template dashboard
Whether you’re building a dashboard from scratch or using a white-label template, make sure you use the proper metrics to analyze and understand your channel performance. Here are 10 key metrics worth tracking on YouTube:
- Watch time – the total number of minutes that viewers have spent watching your video on YouTube.
- Average view duration – the average amount of time each viewer has spent watching your video.
- Views – the number of times people have watched your video.

- Click-Through Rate (CTR) – the percentage of people who clicked on your video after seeing the thumbnail.
- Engagement Rate – the total number of likes, comments, shares, and subscribers per view.

- Subscriber Growth – the number of new subscribers gained over a specific period.

- Top Videos – the videos on your channel that have received the most views, watch time, or engagement.

- Traffic Sources – the information about the age, gender, and location of your audience.
- Audience Retention – the percentage of viewers who continue watching at each moment of the video.
- Revenue and Monetization – the total amount of money earned from various revenue sources on YouTube.
Overall, choosing the right metrics and KPIs for your YouTube template dashboard helps you stay ahead of the competition and continually grow your businesses.
Why use a Looker Studio YouTube template
Analyzing and managing the performance of your YouTube channel is essential for optimizing your content strategy and achieving your goals. YouTube’s built-in analytics offers a wide range of metrics. However, there are certain instances where you might prefer to focus on specific metrics that align with your brand rather than analyzing everything. This is where a dedicated dashboard becomes necessary.
With Looker Studio, you can create a comprehensive dashboard tailored to your needs. For example, you can create a report showing a pie chart of viewers who engage with your video (liking, commenting, or subscribing) or compare the watch time of subscribers vs non-subscribers, etc.
Apart from the ease of presenting custom metrics, there are other reasons why Looker Studio can be used to present your YouTube analytics. Let’s look at some of them:
- Integrating different platforms: If you have a presence on multiple platforms (e.g., social media, ecommerce, SEO, advertising, etc.), by using Looker Studio, you can integrate them into a single dashboard. This enables you to compare performance across platforms.
- Versatile data presentation: Looker Studio offers a range of options for displaying data compared to YouTube. With Looker Studio, you can create appealing charts, graphs, and heat maps that help you better understand and present your data in engaging ways.
- Tailored dashboards: Not all stakeholders in an organization require the same data. By using Looker Studio, you can create dashboards customized for different teams or individuals. For example, a marketing team might want to focus on video reach and engagement metrics, while a sales team may be more interested in how video content drives leads or sales.
- Automated reports: Google Looker Studio scheduling and alerting features allow you to set up automated reports that are delivered to your inbox or shared with relevant stakeholders. This saves you from the time and effort of manually pulling data and creating reports and ensures you have up-to-date information at your fingertips.
- Collaboration and sharing: Looker Studio makes it easy for different teams to access and share visualized data. This helps promote transparency. Whether you’re sharing this data with your digital marketing team or sales team, a dashboard is a great way to present your YouTube analytics and keep everyone on the same page.
Get data-driven insights from your Looker Studio YouTube template
Using a dedicated YouTube dashboard can assist you in making data-driven decisions and optimizing your YouTube channel’s performance. It aids in understanding your audience, tracking progress, and making informed content and marketing choices to grow your channel and achieve your objectives.
While you can construct a Looker Studio YouTube dashboard from scratch yourself, the drawback is that it can be time-consuming. Thus, creating a dashboard from a template is a good starting point since the majority of the work has already been done for you. The Looker Studio (former Data Studio) template featured in this article comes equipped with essential metrics and visually appealing design elements like graphs, pie charts, etc. This makes it easy to understand and interpret your data.
However, if you are enthusiastic about DIY, let Coupler.io help you. Click Proceed in the form below to connect your YouTube Analytics to Looker Studio.

You’ll be able to choose the needed metrics and organize the data in the way you like all within one interface. Then, in a few clicks, your ready-for-analysis data will be loaded to Looker Studio where you can turn it into a dashboard.
Also, you can easily share the dashboard with your team and stakeholders. By using this and other Looker Studio templates designed by Coupler.io, you save valuable time and can channel your energy into optimizing your effort for outstanding outcomes. Check out our Facebook Ads dashboard, PPC report, and other ready-to-use templates for marketing reporting.
Analyze YouTube performance data with Coupler.io
Get started for free