Mailchimp offers built-in campaign overviews and comparative reports. Alternatively, you can export data from Mailchimp and create your own report in a spreadsheet or BI platform. This allows you to use custom visuals, perform complex calculations, create data backups, merge with other digital marketing sources, and automate the reporting process.
But there is no need to do everything from scratch thanks to ready-to-use Mailchimp report templates. Let’s explore the best options that will kick off your reporting in just a matter of minutes.
Top Mailchimp report templates to use in 2025
We have carefully selected templates that provide metrics for campaign summary and performance, audience behavior, email list growth, website traffic, and conversion rates. Each template comes with a built-in connector for easier Mailchimp data integration.
1. Mailchimp analytics dashboard by Coupler.io
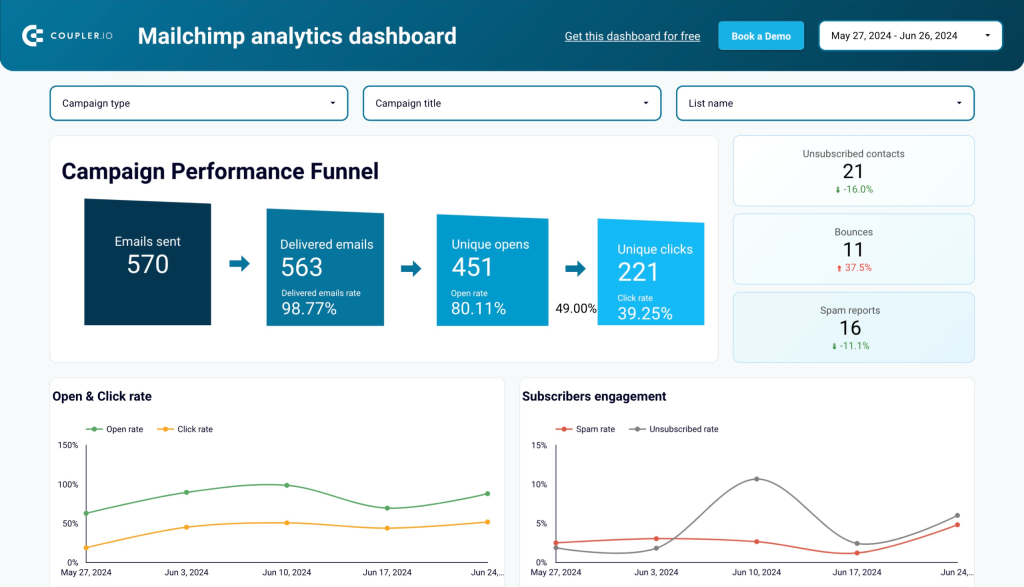
This dashboard template in Looker Studio helps you understand how your Mailchimp campaigns are performing and monitor your audience activity over time. You can compare campaign performance from different perspectives and analyze the metrics associated with each campaign.
What insights does the report provide?
- The Campaign performance funnel shows emails sent, delivered emails, unique opens, and unique clicks. Right below it, you can compare the Open & Click rates and Subscribers Engagement (spam rates & unsubscribe rate).
- There are metrics such as unsubscribed contacts, bounces, and spam reports. You can also monitor the number of emails sent and opened over time. Additionally, there’s a list of campaigns with their performance, issues, and revenue metrics.
- The Audience page provides an overview of subscribed contacts using metrics such as subscribed contacts, unsubscribed contacts, average subscription rate, and average unsubscription rate. It also shows cleaned, unsubscribed, and subscribed contacts since the last campaign was sent.
- You can also analyze separate sections for subscription changes over time, top 5 sources of subscribers, contacts by source, audience activity breakdown, performance for audience by country, and email clients by contacts.
How do you use the report template?
On the Readme page of this Mailchimp report template, you’ll find instructions on how to get started. It involves installing the Coupler.io connector for free and connecting your Mailchimp data with the Looker Studio dashboard.
2. Email marketing analytics dashboard for Mailchimp by Coupler.io
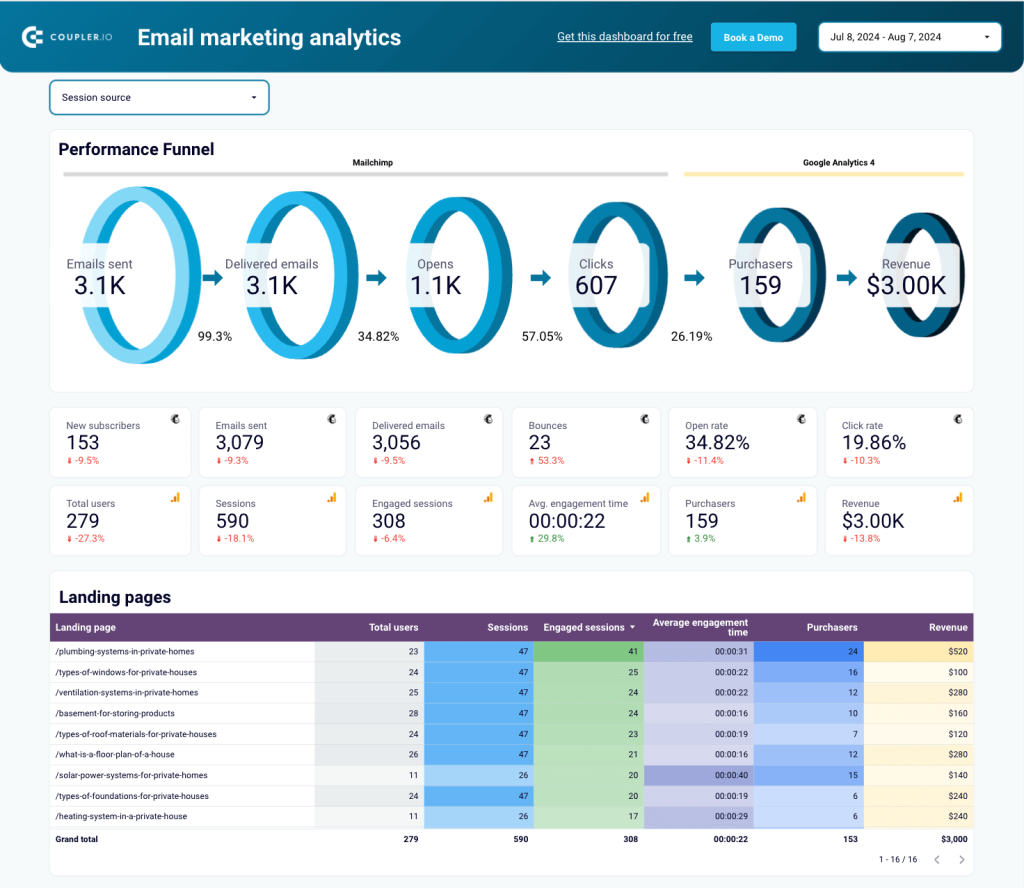
This is a one-page template in Looker Studio that enables you to measure the performance funnel using data from Mailchimp and Google Analytics 4. You can analyze how your subscribers interact with your emails as well as their behaviors on each web landing page that you direct them to.
What insights does the report provide?
- The Performance funnel shows emails sent, delivered emails, opens, clicks, purchasers, and revenue. It provides a good summary of your campaigns.
- Landing pages allows you to analyze the performance of each landing page using key metrics such as total users, sessions, engaged sessions, average engagement rate, purchases, and revenue. This allows you to compare landing pages and identify the best performers as well as those that didn’t convert properly.
- Google Analytics campaign details show all email campaign names and allows you to compare users, engaged sessions, and revenue per campaign. It helps you analyze the performance of the email traffic being sent to your website.
- Mailchimp campaign details can help you monitor the performance, issues, and revenue from each email campaign. It includes metrics such as delivered emails, total opens, unique opens, open rate, total clicks, unique clicks, click rate, total bounces, unsubscribed, spam reports, total revenue, and total orders. You can use this information to determine how well your list engages with each Mailchimp campaign.
How do you use the report template?
Follow the instructions on the Readme page to load data from Mailchimp and GA4 using the built-in Coupler.io connector. It eliminates the need for manual data updates thanks to its automatic data refresh feature. You can schedule the refresh for your report to be as frequent as you like.
3. Mailchimp email campaign performance dashboard for Shopify store by Coupler.io
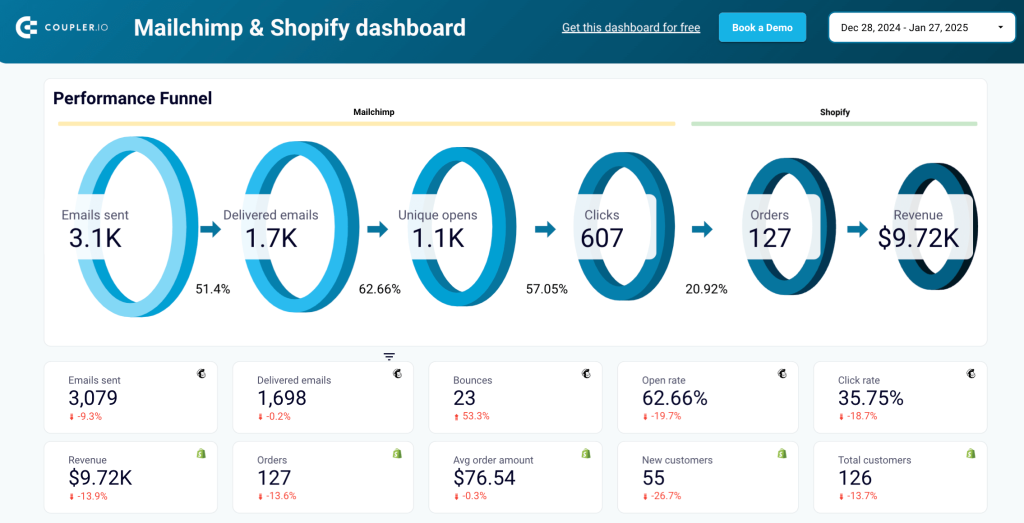
This dashboard template in Looker Studio integrates data from Mailchimp and Shopify to give you a unified view of your email marketing and sales performance. It helps you monitor key metrics like open rates, click rates, revenue, and product sales in one place.
What insights does the report provide?
- The email performance funnel shows the entire journey from emails sent to revenue generated. It tracks key metrics like delivered emails, unique opens, clicks, orders, and revenue, to identify weak points in your email campaigns and optimize each stage for better results.
- Product performance insights like top-selling items and overall sales trends allow you to understand which products contribute most to revenue. They also highlight products with lower performance, so you can adjust promotional strategies or pricing to enhance their appeal.
- Customer acquisition and retention charts track the number of new customers compared to returning customers over a given period. This will help you evaluate the effectiveness of acquisition campaigns and retention efforts.
- Metric comparisons like clicks vs. revenue and orders vs. average order value let you uncover patterns. For example, if high clicks don’t translate to revenue, you can adjust landing pages or product offerings to improve conversion rates.
How do you use the report template?
Follow the instructions on the Readme page to connect your Mailchimp and Shopify accounts using the Coupler.io connector. Once connected, the Looker Studio dashboard template automatically updates your data, allowing you to track performance without manual uploads.
4. Mailchimp + Google Analytics dashboard from Epilocal
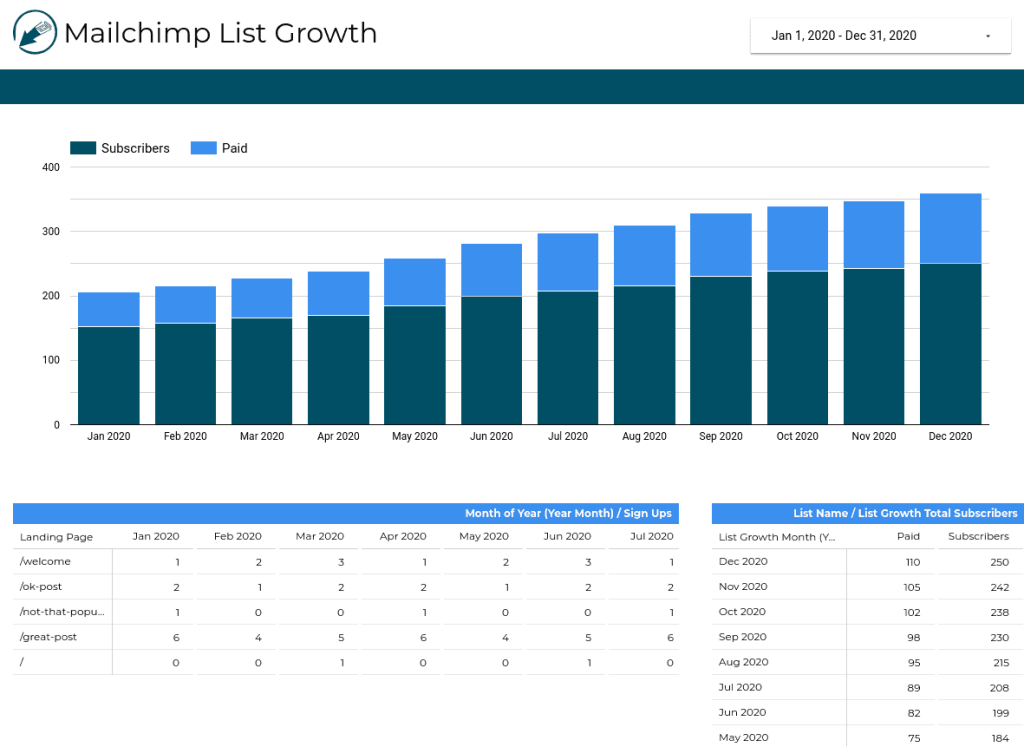
Here’s a report template that enables you to monitor landing pages that drive email signups as well as the metrics associated with the campaigns. You can easily discover important insights and see how your Mailchimp campaigns are driving traffic to your website.
What insights does the report provide?
- The Mailchimp List Growth page shows how subscribers have grown within a specific period, and you can compare paid vs non-paid subscribers. It includes a section that shows the number of signups from each landing page every month. You can also track the list growth of paid and total subscribers for each month.
- Mailchimp Campaigns Summary displays campaign metrics such as emails sent, open & click rate, subscribers, bounces, and unsubscribers. You can compare titles with the number of emails sent and the number of opens. There’s a section that also displays each campaign title and the metrics associated with it. Lastly, you can analyze the metrics for subscriber welcome and paid welcome.
- The Mailchimp Campaign Insights page shows the open rate for each day of the week. It allows you to compare the performance of paid vs total subscribers. Then, you can find the last sent date with the subject line and important metrics.
- Mailchimp Email Traffic helps you see how your email campaigns are driving traffic to your website and allows you to compare them with each other. You can also analyze the total number of sessions gained from each campaign in each month.
How to use the report template?
To gain edit access, go to the template in Looker Studio and click the Make a copy button. Use the built-in epilocal connector to connect your Mailchimp and Google Analytics accounts. The detailed instructions on how to set it up are provided.
5. Mailchimp campaign performance dashboard from Databox
This simple dashboard template helps quickly measure the overall performance of your email campaigns and determine their effectiveness.
What insights does the report provide?
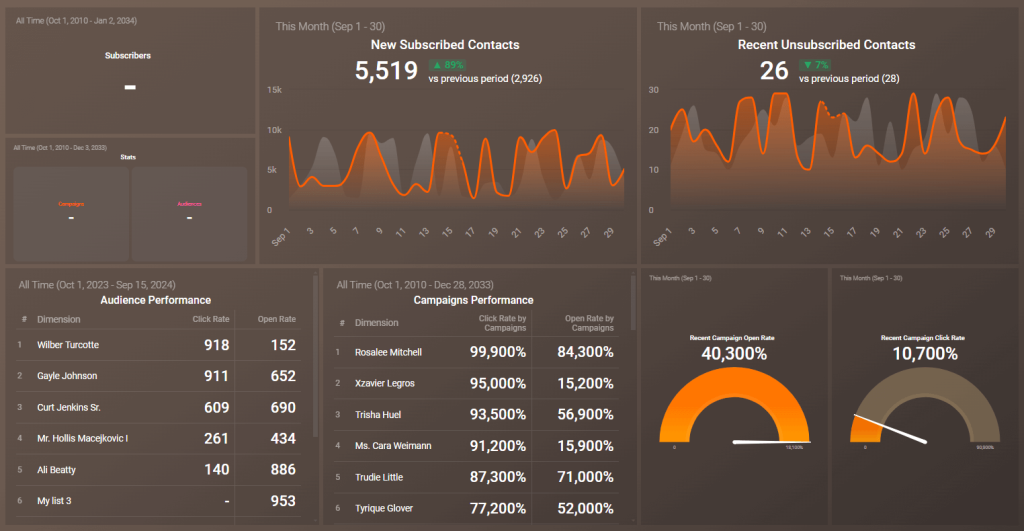
- It displays the total number of subscribers, new subscribed contacts, recent unsubscribed contacts, and stats for campaigns and audiences.
- You can measure audience performance using the clicks and opens for each audience dimension.
- It allows you to track campaigns performance with dimensions, click rate, and open rate for each campaign.
- You can also see the recent campaign open rate and campaign click rate.
How do you use the report template?
On the template, click on Get this dashboard for free. You need to create a free Databox account and connect your data using their built-in Mailchimp connector.
6. Mailchimp performance report by Dashthis
The report template allows you to track the overall performance of your campaigns using the KPIs. You can also track specific metrics for each campaign and mailing list.
What insights does the report provide?
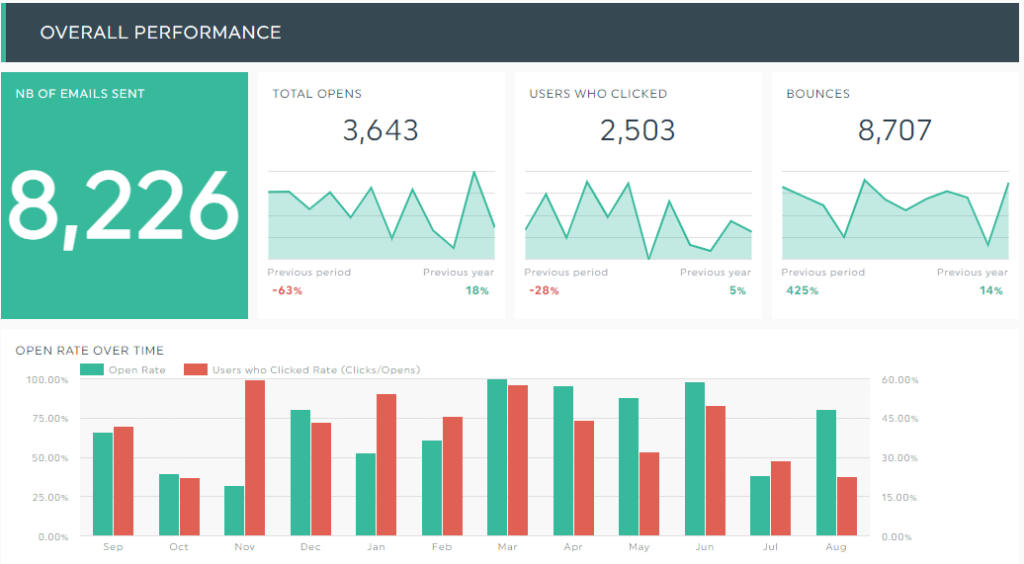
- There are aggregated numbers for emails sent, total opens, users who clicked, and bounces. You can also compare the open rate and click rate over time.
- It helps to display the top campaigns and their individual performance metrics.
- You can also analyze the bounce rate by campaign and the unsubscribe count by mailing list.
How do you use the report template?
On the preview page, click Try it free. You’ll be asked to sign up for a Dashthis account and start a 15-day free trial (no credit card is required) before you can use the Mailchimp report template. Then, you’ll be able to use the custom connector from Dashthis to add your email marketing data.
Bonus: All-in-one marketing dashboard by Coupler.io
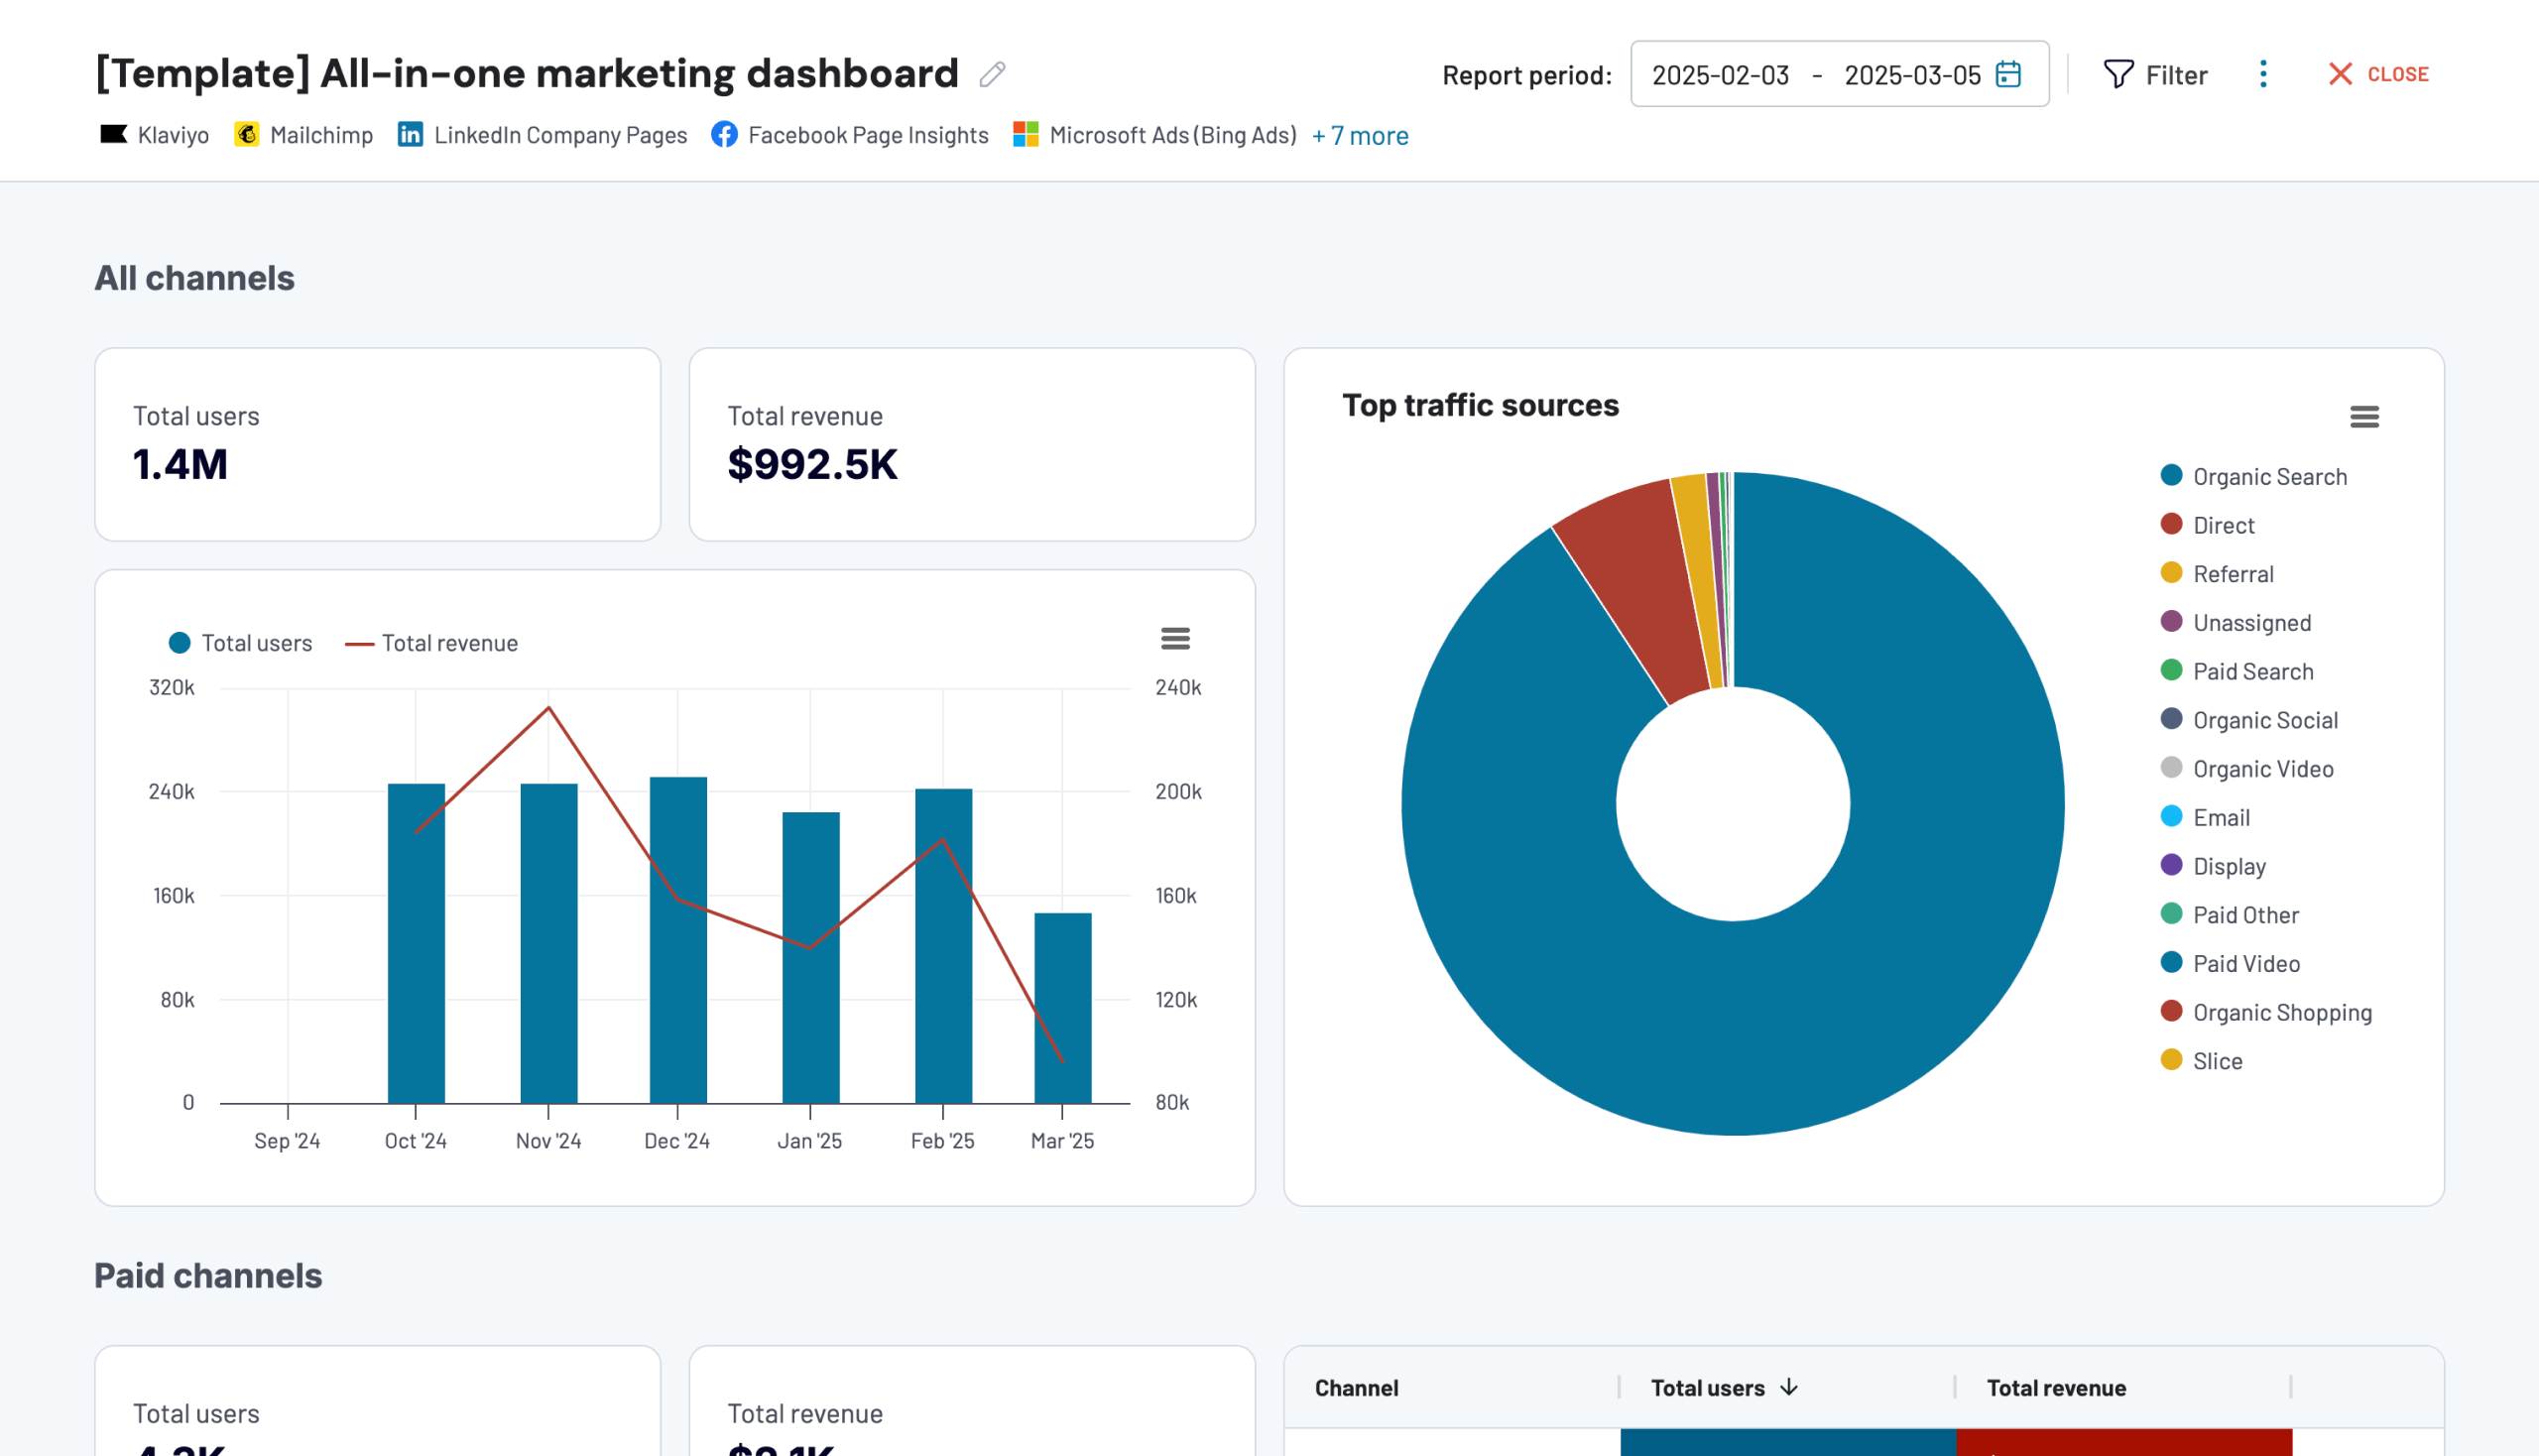
This dashboard provides a complete overview of your marketing efforts across multiple channels. It can collect data from Google Analytics, Google Search Console, paid ads platforms, social media, video channels, and email channels. This tool enables you to conveniently track the performance of several campaigns by using a single interface.
What insights does the report provide?
- All channels overview displays the total users and revenue according to GA4. You can see how each digital marketing source contributes to the overall traffic.
- Paid channels display the users and revenue for PPC platforms such as Facebook Ads, Google Ads, etc. You can use the ads report to track performance using KPIs such as amount spent, impressions, clicks, CTR, CPC, etc.
- Organic search performance provides the total users and revenue as well as SEO metrics such as impressions, clicks, CTR, and average position.
- Social media channels display the users and revenue from social media. You can analyze using metrics such as impressions and page views across different social media platforms.
- YouTube performance shows the users and revenue from it as well as metrics such as views, watch time (minutes), and engagement on your videos.
- Email performance displays the users and revenue from your email marketing platforms. It can serve as a mini Mailchimp reporting template where you can monitor email campaigns with metrics such as emails delivered, open rate, bounces, unsubs, clicks, etc.
How do you use the report template?
The report is available in Coupler.io UI and as a template in Looker Studio. For the latter, check the Readme page with instructions on how to use it. The Coupler.io connector can collect data from multiple marketing sources and load it into the template automatically.
What are the key metrics to track using Mailchimp reporting templates?
There are important metrics that can be used to assess the effectiveness of your email campaigns. It is useful to understand how subscribers engage with your emails as it will help improve your campaigns in the future. Let’s review them below:
- Emails sent – Total number of emails successfully sent to your subscribers.
- Open rate – The percentage of those who opened your email. Formula:
(Emails opened / Emails delivered) * 100- Click rate – The percentage of those who clicked a link in your email. Formula:
(Unique clicks / Emails delivered) * 100- Bounce rate – the percentage of emails that weren’t delivered successfully. Formula:
(Bounced emails / Emails sent) * 100- Unsubscribe rate – the percentage of those who unsubscribed from your email. Formula:
(Unsubscribes / Emails delivered) * 100- List growth rate – The rate at which your email list is growing. Formula:
(New subscribers - Unsubscribers / Total subscribers) * 100- Total revenue – Total amount of revenue generated from email campaigns.
- Conversion rate – The percentage of those who completed an action after clicking on a link in the email. Formula:
(Conversions / Total emails delivered) * 100- Unique opens – The number of unique subscribers who opened your email.
- Unique clicks – The number of subscribers who clicked a link in your email.
How do you build a Mailchimp report template on your own?
A few of the report templates mentioned earlier in this article mainly use a connector from Coupler.io, a reporting automation platform that you can use to automate your data to spreadsheets or data visualization tools for faster reports.
Now, let’s explore how you can use Coupler.io to create custom Mailchimp report templates. The source has been preselected. Select the destination in the form and Proceed.
You’ll be asked to create a free Coupler.io account. Then, you need to complete 3 steps.
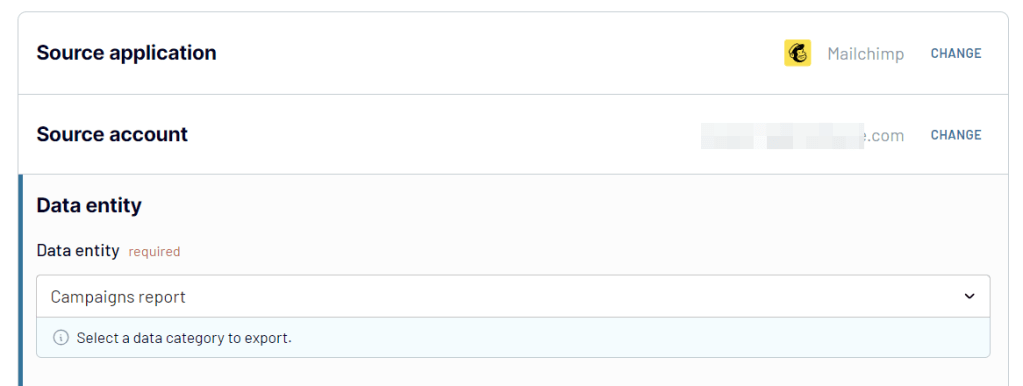
1. Collect data
Connect your Mailchimp account and pick the Data entity (i.e. data category to export). The options available include: Audience (list of contacts), audience activity, audience clients, audience growth history, audience interest categories, audience locations, automations, list of audiences, campaigns, and campaign reports.
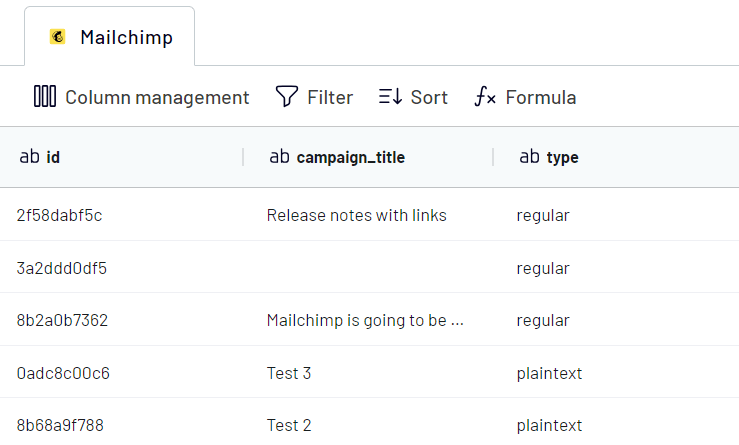
2. Preview and organize data
To organize your email marketing data, you can:
- Reorder, hide, or add more columns.
- Apply filters and sort data using the preferred order.
- Use custom formulas to create new columns.
- Merge data from different accounts or apps.
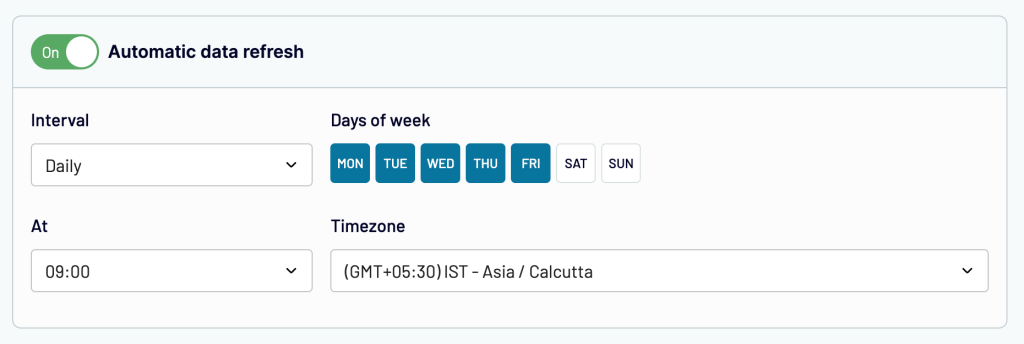
3. Load and schedule data refresh
Follow the in-app instructions to connect your destination account and load your Mailchimp data. Then, you can enable Automatic data refresh and set up a schedule to automatically import fresh and near real-time updates to your report.
After completing these steps, you can use the marketing data to create automated Mailchimp dashboards that you can easily share with teammates, partners, and anyone else you choose.
Report templates vs custom-made dashboards to track Mailchimp performance
The most common way to analyze email marketing performance is by using the native analytics dashboard in the platform. However, this isn’t the most effective method as the reports can be difficult to customize and may not provide comprehensive insights.
It’s much better to export Mailchimp data and analyze it on a more suitable platform such as Google Sheets, Looker Studio, or Power BI. Remember that you don’t have to design a dashboard from scratch since you can use Mailchimp reporting templates. This saves you time and allows you to access your analytics much faster.
An alternative is to use custom-made Mailchimp dashboards for fully customized reporting of your email campaigns. You can specify any desired charts to include in the report and performance metrics that can help to improve your marketing strategy.
A custom dashboard provides maximum flexibility and customization, but it takes time to set up. So if you prefer a faster process, a ready-to-use template might be a much better option.
Automate Mailchimp reporting with Coupler.io and its predesigned templates
Get started for free


