The time-consuming reality of marketing agency reporting
Every client wants to see how their marketing agency uses their budget to understand how their money is being spent. On average, compiling a monthly report for a client takes between 2-5 hours, while more complex reports can take over 8 hours. The reason why it takes so long comes down to a manual, multi-step process that involves:
- Data collection from tools and platforms, such as Google Analytics 4, Google Search Console, advertising platforms, email and outreach tools, CRM apps, etc. The data can be exported as CSV files or loaded to Google Sheets. Not to mention the good-old copy-pasting.
- In addition to numbers and text, reports may also contain visual evidence in the form of screenshots. Marketers also need to attach those with contextual descriptions and explain insights for each data point.
- Eventually, all this extracted data is formatted and organized into client-friendly reports or presentations. They can be either shared online or sent via emails to the clients.
For a mid-sized agency managing 20 clients, reporting tasks alone can take between 100-160 hours per month. If an agency provides weekly reports to their clients, not to mention ad-hoc reporting requests, the time investment increases significantly. You should be prepared to sacrifice up to 25% of your marketing team’s productive hours.
Not only is reporting tedious work, it can negatively impact your business when the process is inefficient. For instance:
- In our survey of 40+ B2B marketing professionals and leaders, 22% said that reporting is a time-consuming task, making it one of the least desirable parts of their job.
- 9 out of 10 marketers say that they spend more time on reporting than creating.
- Meanwhile, 25% of agencies reported that time pressures and stress are the most significant challenges they have faced over the past 2 years.
- 35% of agencies struggle to accurately track the hours they invest in client tasks, such as reporting. This leads to team inefficiencies, issues with billing, and potential revenue loss.
At the same time, two-thirds of marketing agencies consider client retention to be their biggest challenge in 2025. Yet in our own survey, 30% agreed that reporting has a positive effect on client satisfaction and retention.
Here’s what Aaron Whittaker of Thrive Agency had to say about its impact:
[In our experience,] effective reporting directly impacts client retention through demonstrated value. After implementing business-outcome reporting frameworks showing marketing’s contribution to the sales pipeline, our client retention increased significantly. This approach helps our clients understand marketing’s impact on their business goals rather than just activity metrics.
Time is not the only problem
Manual reporting is a time-intensive process that is also associated with other issues:
1. High risk of human error during data collection and calculations. In fact, there is an 18-40% probability that you will make an error while manually entering data into a report.
2. Scattered data that makes gathering accurate insights difficult. For instance, most organizations (around 85%) don’t use centralized data warehouses or customer data platforms (CDPs) to manage their marketing data, which can lead to problems with data quality and reliability during reporting.
3. Inconsistent data and reporting formats across different team members and clients. In a survey on data quality, 95% of respondents said that inconsistent data formatting had a negative impact on client trust and brand perception. Not to mention, it can look unprofessional when your report style changes depending on who compiles it each month.
4. Delayed insights due to time-consuming data collection and organization. For instance, marketing teams use an average of 19 different tools in their work, many of which require manual effort to extract and consolidate data for reports.
5. Reports are typically static, i.e., they lack interactivity and real-time updates. Again, this can cost your team hours of valuable time. Meanwhile, research shows that 50% of clients prefer to review performance data in live dashboards.
6. Increased operational costs due to inefficient resource allocation. According to a Forrester study, marketers waste 21 cents for every media dollar spent (or 32% of their billable time) managing data quality. In essence, misspent time is misspent money.
- One of our own marketing agency clients, SellThru, saved 20+ hours a month by automating their reporting processes. That potentially amounts to thousands of dollars saved every year on manual labor.
Marketing reporting done right – automation as a lifeline
What if I said that instead of spending 100 hours per month on reporting, you could spend just a few minutes to make a coffee ? An automated reporting system transforms how agencies deliver insights to their clients. Instead of static reports, your clients will have access to dynamic dashboards that always display up-to-date information. Here is what you need to ensure efficient marketing agency reporting:
1. Automation and AI enhancements
Data collection is the first aspect of the reporting process you should automate. Why? Because no-code SaaS solutions make it quick and easy to set up – no need for technical input or maintenance. Instead of manually downloading data to create PDF reports, you can set up a continuous flow of data from marketing platforms (e.g., Google Ads, GA4, HubSpot) to a live, shareable dashboard.
For instance, with Coupler.io, you only need to connect your clients’ marketing accounts and configure the data flow settings once. After that, the tool will automatically fetch the data on a regular schedule.
AI also has the potential to take your reporting process to the next level. According to recent surveys, 77% of agencies have already implemented AI in their marketing routines. Here are a couple of examples how to enhance client reporting with AI automation:
- Predictive insights. Use a dedicated AI feature to generate forecasts and estimates based on your clients’ historical data. This can help inform strategic planning and budgeting for different marketing channels.
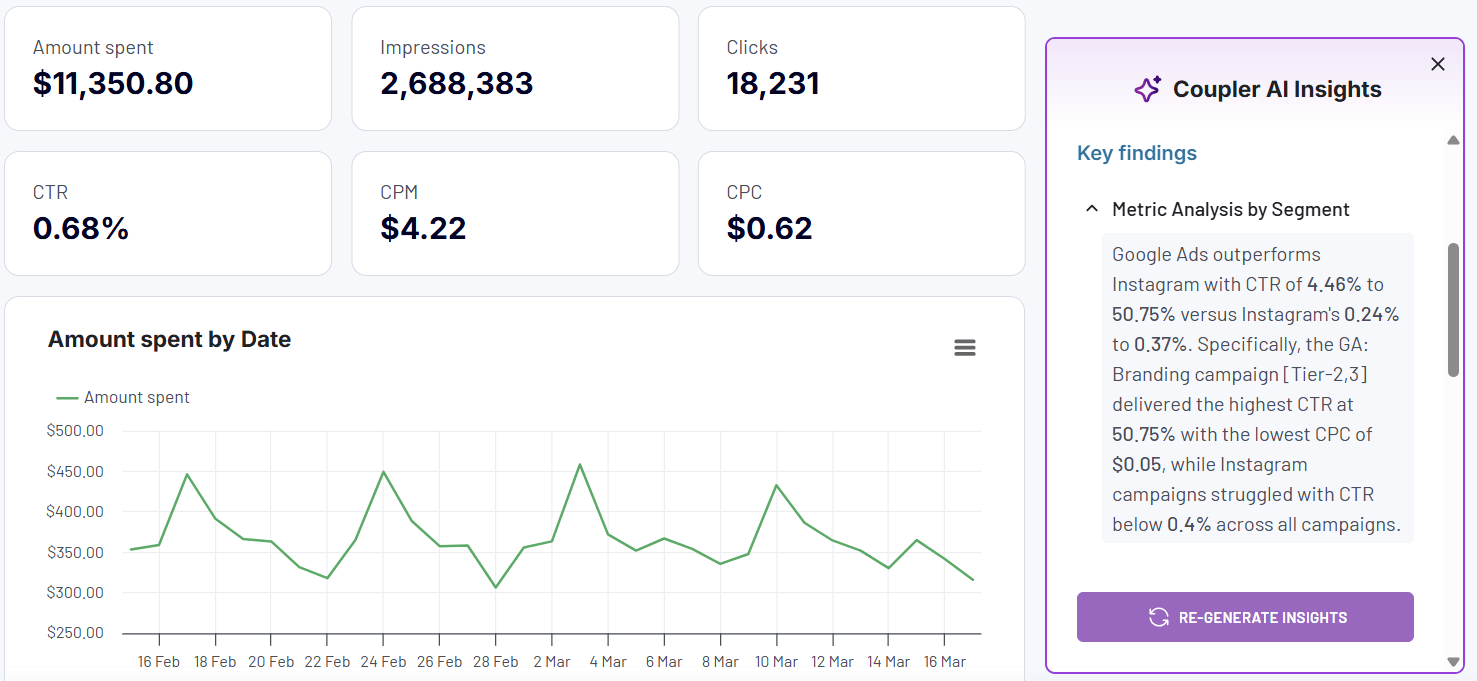
- AI-powered analysis. For instance, key Coupler.io dashboards are equipped with the Coupler AI Insights feature that analyzes marketing data and identifies trends, anomalies, and patterns in audience behavior. It also provides a brief list of recommendations on how to optimize campaigns.
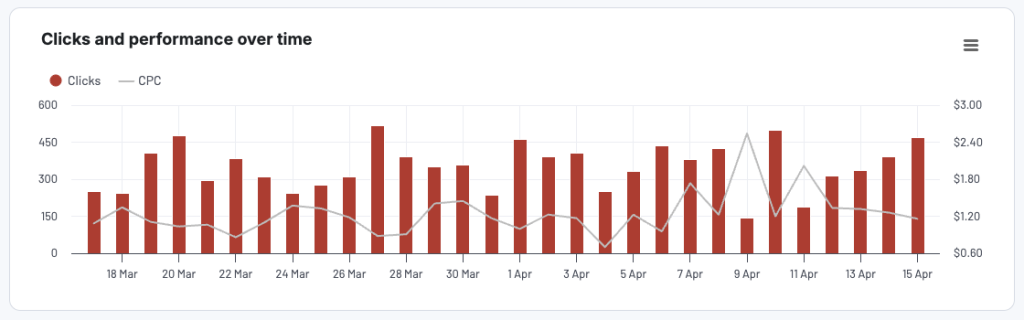
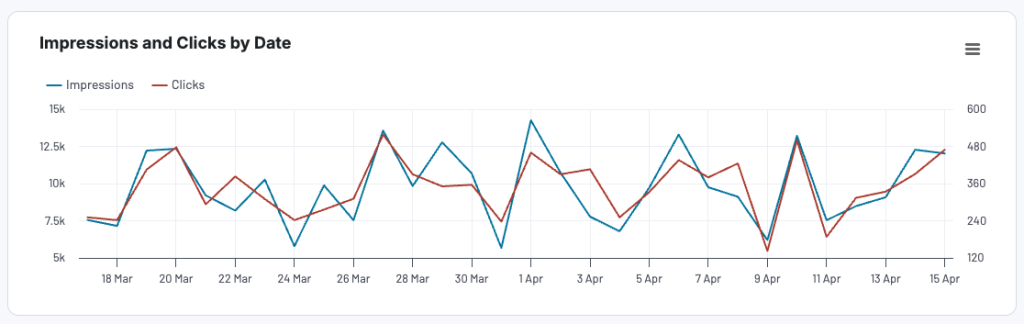
PPC multi-channel dashboard with AI insights
 Preview the dashboard
PPC multi-channel dashboard with AI insights
Preview the dashboard- Setting up automatic alerts. Design an AI algorithm that notifies you of sudden spikes or drops, such as a surge in web traffic or an unexpected increase in ad costs. This can help you quickly resolve any issues that surface in reports, before they take clients by surprise.
Keep in mind that these AI-driven features require advanced technical skills to implement, although you can sometimes avail of them through existing tools, like Coupler.io.
Coupler.io ready-to-use connectors are based on APIs. At the same time, it allows you to create custom integrations with sales and marketing APIs.
2. Data visualization
Ideally, client reports should be clear, engaging, and visually appealing. This is achievable with BI tools like Looker Studio, Power BI, or Tableau, which allow you to visualize marketing data and help clients make sense of the numbers in front of them.
The style and availability of visualization features vary across BI tools, but there are generally six main types.
Types of marketing data visualizations
- Bar charts – handy for comparing the performance of different channels, campaigns, etc., and their changes over a specific period.
- Line charts – allow you to visualize trends and marketing dynamics over time, such as a 6 or 12 month period.
- Pie and donut charts – ideal for making broad comparisons, such as which social media platforms your client receives the most engagement from.
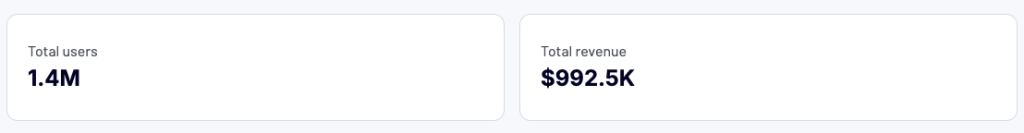
- Scorecards – perfect for highlighting key metrics, such as total revenue or new users.
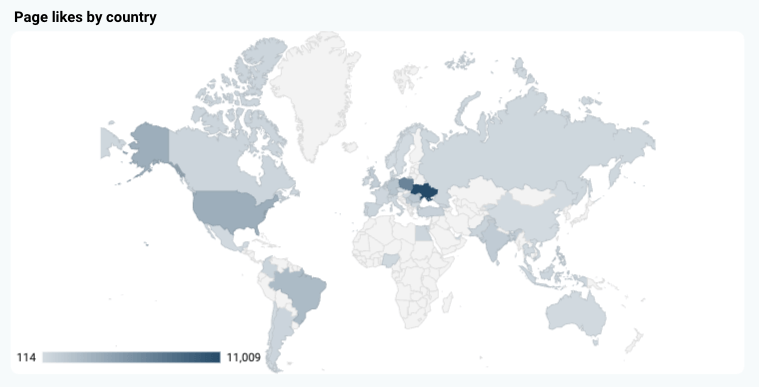
- Maps – allow you to visualize the distribution of web traffic, sales, social engagements, etc. across countries or regions.
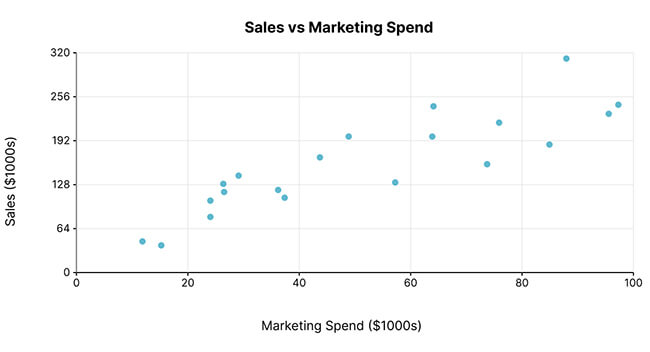
- Scatterplots – useful for demonstrating correlations between data and potential outliers.
How to make reports more engaging
Data visualization is more complicated than creating a couple of pie charts and calling it a day. Here are a few tips on how to create smart, stylish, easy-to-read reports for clients:
1. Start with key takeaways. Place scorecards highlighting predefined metrics at the top of the dashboard. This will provide clients with a high-level summary of progress and results as soon as they open the report.
2. Design for simplicity. Add a variety of visualizations to your report, but avoid overwhelming users with too much information. Aim for a balance of raw numbers, tables, and charts, focusing on the data that is most insightful for your clients. Lastly, don’t forget to choose a complementary color palette and stick to it.
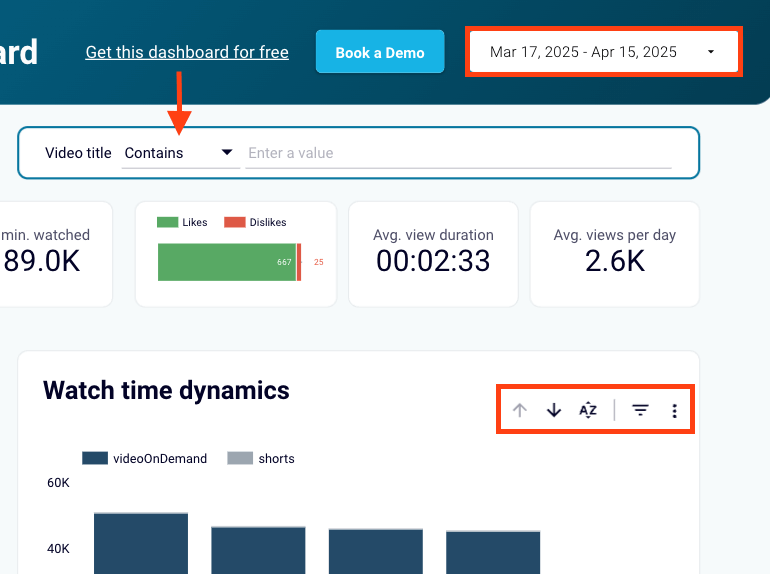
3. Prioritize interactivity. Adding interactive elements to reports instantly makes them more valuable and engaging. For example, date filters allow clients to review historical data and assess progress over time – instead of requesting separate reports from you. Drill-downs let them dive deeper into specific metrics or periods, preventing data overwhelm. Clickable charts make it easier for clients to tailor the report view, leading to faster insights and a more personalized experience.
4. Optimize for mobile. Clients aren’t always viewing reports from their desk – they might check them while commuting, between meetings, or on the go. For these reports to be easily accessible, they must be optimized for mobile. Here are some tips:
- Minimize ‘hover-over’ visualizations to prevent a loss of interactivity.
- Use a responsive vertical layout that adapts to smaller screens.
- Make filters, drop-downs, and buttons big enough to tap.
Explore over 100 ready-to-use dashboard templates by Coupler.io
Get started for free3. Focus on key business results
Efficient client reports must go beyond vanity metrics and display real business impact. For instance, the number of impressions a campaign has generated is low value unless you show how many leads it has brought. So, marketing experts must ensure their reports showcase metrics that let clients understand key business results. Here are some examples:
- E-commerce performance metrics, including purchases, average order value, customer lifetime value, etc.
- Lead generation metrics, including qualified leads, conversion rates, cost per acquisition, etc.
- Customer journey insights from first impression to final conversion.
- Goal completion tracking aligned with business objectives.
- Marketing channel performance and attribution.
Khan Muhammad Imran, Founder & CEO of Brand Ignite marketing agency, explained how they dealt with clients who expected long reports ‘filled with vanity numbers’:
We [built] what we call the ‘Decision Trigger Report’. Instead of handing over long documents with endless KPIs, we give clients one report with three core insights tied directly to decisions they need to make next month. For example, rather than showing ad impressions, we show them which creative drove the most pipeline-ready leads and recommend whether to scale or pause it.
4. Client access to the insights
If you still prepare your reports in PDF format, it’s probably time to update your approach. A recent survey found that 49% of clients prefer to view marketing data in live dashboards instead of spreadsheets or static/printed reports. It gives them more autonomy and saves time on back-and-forth emails and calls. Live dashboards also decrease the risk of sending a report to the wrong client or missing a reporting deadline.
As we mentioned earlier, when clients have self-service access to reports, they can explore data independently using interactive features. For example, they can filter data by the desired period to compare results or check dynamics.
Some data visualization tools even have built-in features for real-time collaboration, allowing you to communicate with clients directly in the report. For instance, platforms like Tableau, Databox, and AgencyAnalytics let you add comments/annotations to visualizations in marketing reports. You can provide context or explain unusual changes without needing to schedule a meeting.
When you do have those meetings, however, live dashboard reports are easier to present and typically adapt to larger screens. The format also ensures everyone has access to the same up-to-date insights at any given moment.
Important measures to consider when giving clients access to reports:
- Permissions management. Set user roles (admin, editor, viewer, etc.) in advance to ensure that only approved stakeholders have editing or sharing permissions.
- Onboarding support. If clients aren’t used to working with live dashboards, a quick video walkthrough can help avoid confusion. You can explain the structure, chosen metrics, and how they can make the most of interactive features.
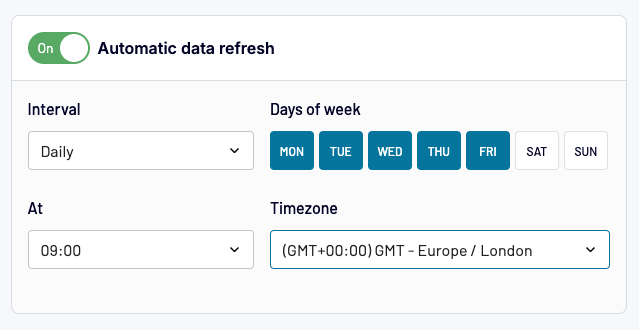
- Data refresh frequency. Be upfront about how often the marketing data will refresh in the report. Agree on a reasonable schedule based on the client’s needs and budget, such as daily, weekly, monthly, etc.
- Notification settings. In platforms that offer alerting features (like Databox or Klipfolio), you can opt for clients to receive notifications when specific actions occur. For example, a traffic spike could trigger a Slack notification sent to clients, prompting them to engage with the report more often.
How to ensure data security and compliance
Safeguarding client data is a core aspect of responsible agency reporting. You must always take into account the privacy and security of both consumers and your clients.
1. Comply with marketing data regulations
How you collect marketing data is more important than how you present it. To avoid expensive penalties, you must follow industry and regional regulations, such as:
- GDPR, which applies to clients and audiences in the EU. Consumers must provide clear consent for their personal data (names, email, IP addresses, etc.) to be processed. They also have the right to be ‘forgotten’ and to rectify incorrect data, among other things.
- CCPA, which concerns clients and marketing audiences in California. Consumers have the right to know what kind of data is being collected on them and how it will be used. They can also have their data deleted and stop it from being sold to third parties.
If you are collecting data on consumers in other regions, you need to be aware of local regulations such as PIPEDA (Canada), POPI (Brazil), and LGPD (South Africa).
2. Establish security measures and protocols
Having clear security protocols in place from the beginning can help you avoid data breaches at your agency. It will give both you and your clients peace of mind and reduce legal risks.
Here are a few suggestions:
- Switch on two-factor authentication (2FA) for marketing tools such as GA4, CRMs (e.g., Salesforce, Pipedrive), reporting platforms, and so on.
- Run security audits to spot vulnerabilities in how data is recorded, shared, and accessed. This will allow you to take action before any serious issues arise.
- Enable regular backups for marketing data stored by your agency and ensure it is retained in a secure location e.g., a data warehouse. Coupler.io can even help you automate this process.
- Invest in team training to prevent in-house phishing attacks and data breaches.
3. Manage user access controls and permissions
Controlling who can and can’t access the data in your client reports is critical. It prevents consumer data from falling into the wrong hands and protects your clients’ privacy, reducing the risk of non-compliance fines and damage to your agency’s reputation.
Always set the correct permissions (e.g., read-only, editor) when sharing a report externally and internally. Don’t forget you will also need to revoke access when a client, stakeholder, or specialist leaves the agency/project.
4. Define data retention policies
Decide on how long you plan to retain consumer and client data. This is important for compliance with key marketing regulations (GDPR & CCPA) and ensures you don’t amass piles of outdated, misleading data.
For instance, you could schedule reviews and deletions every 12-24 months, depending on regional and industry guidelines. Automation features in CRMs can make this process more efficient.
Importance of transparent reporting
A reasonable question any agency marketer may ask is ‘Do my clients need all this?’ Maybe they are totally okay with monthly emails and PDF reports. And there is a simple answer to this:
Client’s trust is built on data
Transparent reporting is the way to build a successful agency-client relationship. According to research, agencies with ‘high levels of transparency’ have an 83% higher retention rate than those without. Ultimately, clients want a complete understanding of their marketing performance. Communicating progress early and often shows that you have nothing to hide.
Here are a few key ways to foster trust through transparent reporting:
- Set clear expectations. Define KPIs at the start of your collaboration to avoid misalignment later on. Focus on actionable marketing metrics (e.g., leads, revenue, etc.) and establish realistic timelines for results delivery to minimize client disappointment.
Daniel Thompson, Founder of Salt Water Digital agency, learned this the hard way:
We used to send out longer 5-6 page reports each month but we found our time was better spent working on the clients campaigns than reporting on them. [So] we’ve taken the less popular route of keeping our reports short and concise. We have 3-4 KPIs we track for every client and unless they specifically ask, those are the KPIs they receive – traffic, conversions, & keyword tracking.
- Make reports easily accessible. Again, live dashboards are the best way to demonstrate progress and results. Clients can get answers to questions in a few clicks and see how their money is being spent in near-real-time.
- Be accountable. Own your mistakes and be open about why certain strategies or campaigns failed. Your clients will appreciate the truth over sugar-coated, half-baked excuses. This honesty and accountability help build a stronger relationship over time.
All-in-one solution for automating marketing agency reporting
So far, we’ve mentioned a handful of tools with automation capabilities, but nothing that simplifies the entire reporting workflow. This is where Coupler.io comes in.
Coupler.io is a reporting and data automation solution designed to save you time on the reporting process. It allows you to visualize insights for clients in minutes and shave hours off your monthly routine. Here’s how it works:
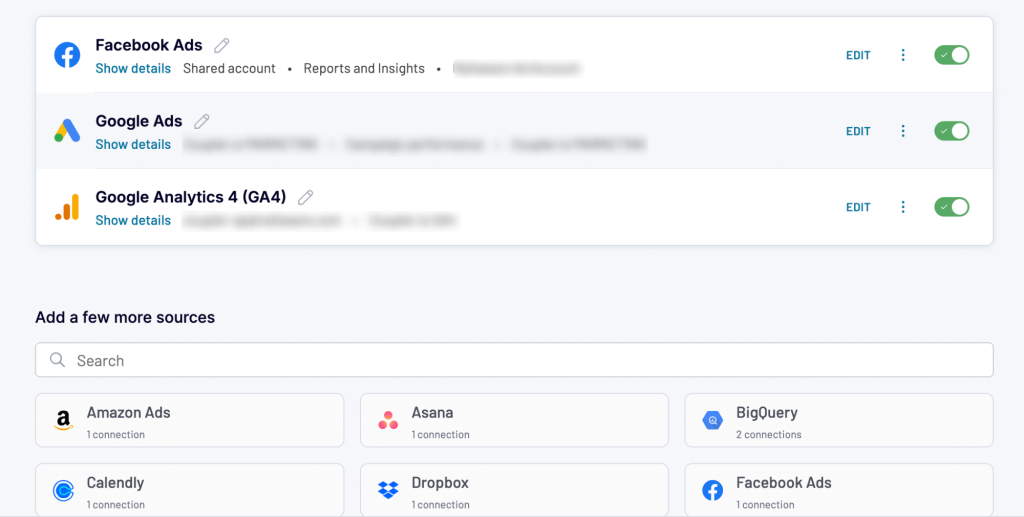
1. Connect your clients’ marketing accounts to Coupler.io, choosing from over 60 integrations for platforms like Facebook Ads, Google Ads, Google Analytics 4, HubSpot, Shopify, and more.
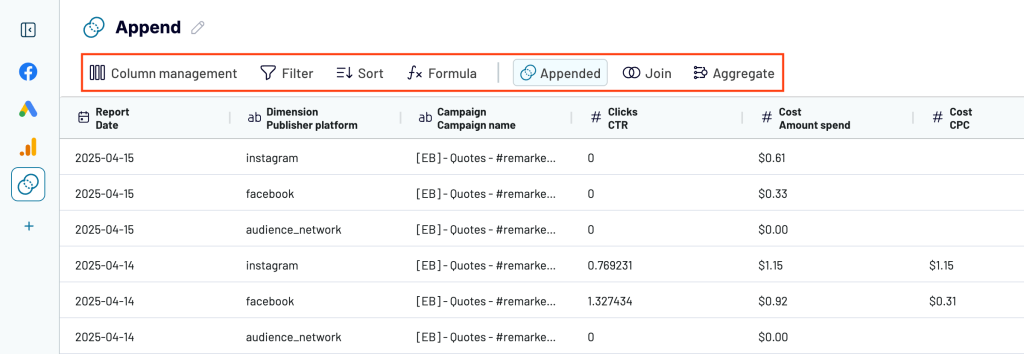
2. Refine the data using built-in transformation features. Filter, sort, aggregate, add or rename columns, and combine data from different platforms into a unified dataset.
3. Load the data to a predesigned template or BI tool, then schedule automatic refreshes. The final result? A shareable dashboard with key metrics that updates daily, weekly, or as often as every 15 minutes.
How exactly does this approach save you time and effort?
- Eliminates manual work, such as downloading and uploading raw data from one tool to another.
- Allows you to make quick fixes or enhancements to your data on the go.
- Takes the hassle out of updating reports every month. You only need to configure the scheduler once to ensure your clients have regular access to fresh insights.
- White-label templates allow you to get started quickly, but you can also create custom dashboards in Looker Studio, Power BI, Tableau, or Google Sheets based on your client’s preferences.
- Reports are shareable via link – no screenshots or PDF downloads required.
- You don’t need coding experience or a technical background to use Coupler.io.
Ready to automate your agency reporting? You can get started in just 5 minutes with a free account.
Marketing dashboard for B2B agencies
Automated, custom-made marketing reports are great assets, but they can be costly to build, improve, and scale. A better alternative is to use predesigned dashboards.
Coupler.io has designed one specifically for marketing agencies. Moreover, it was developed in partnership with Alina Zaiets, the founder and CEO of Marketing Pot, a marketing agency for SaaS and B2B service companies.
Why is this dashboard needed?
The main reason behind this was the need to combine data from different sources into one dashboard, which is convenient for CEOs who are not hands-on in marketing to review.
Imagine a situation when you have, say, 10K traffic but only a few leads. What should you pay attention to in order to identify and resolve this bottleneck?
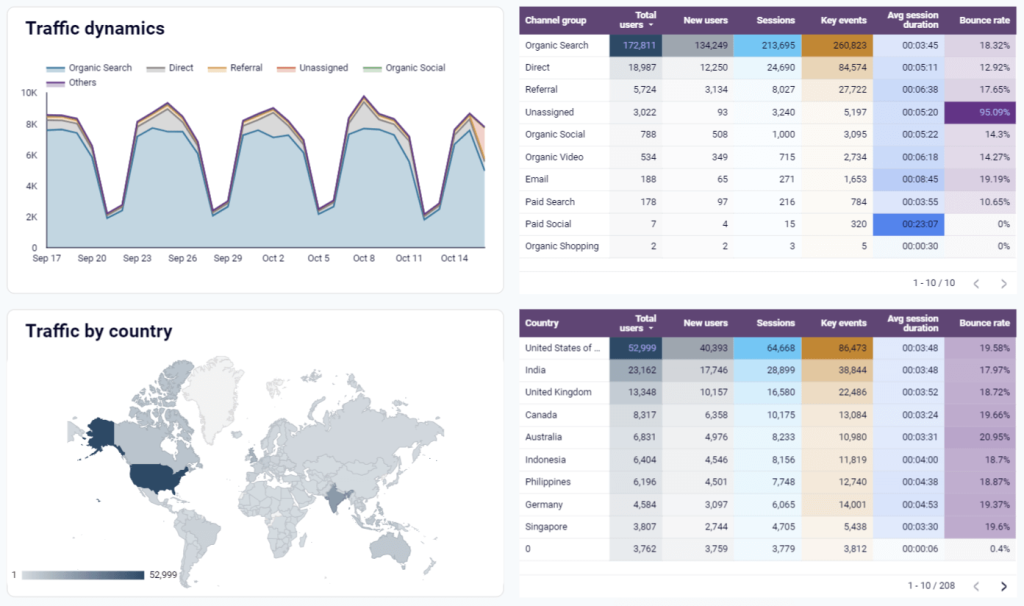
Geography is the first thing to explore. You need to be sure you are focusing on the proper target audience. So, we’ve taken the information about traffic by country from GA4 and added it to the dashboard.
Moving to the next question: What channels does your traffic come from and what pages does it land on?
To analyze this, we’ve added the possibility of selecting the channel and the landing page and reviewing this data separately. This way, you can analyze the user’s intent (as you already know how they reached your page) and consider the next steps.
Also, this information is required when you invest in certain pages, so you follow their exact stats.
What the dashboard includes
The dashboard consists of 4 pages: Overview, Landing Page Performance, Conversions, and PPC Overview.
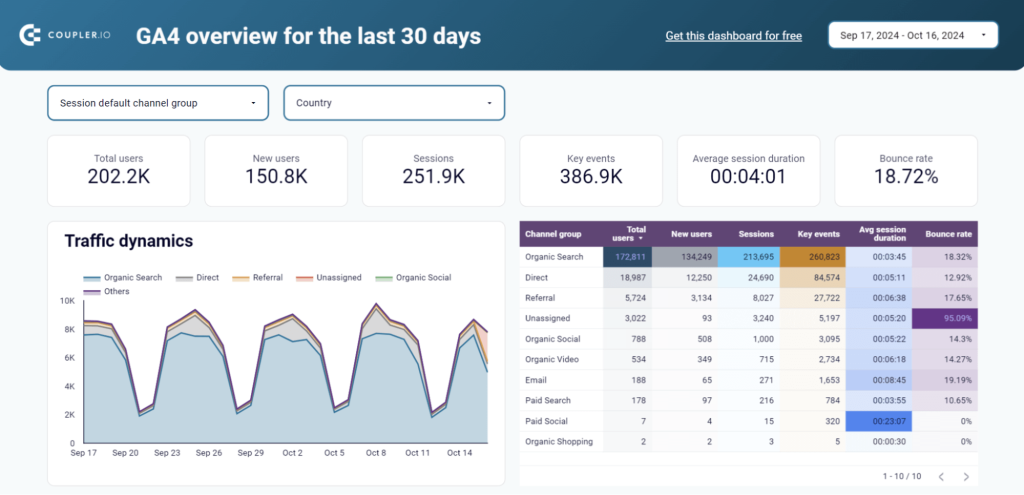
Overview
Basically, on this page you get an overview of channel groups and countries from which you get traffic to your website. It aggregates information from GA4 for agencies, along with other data sources.
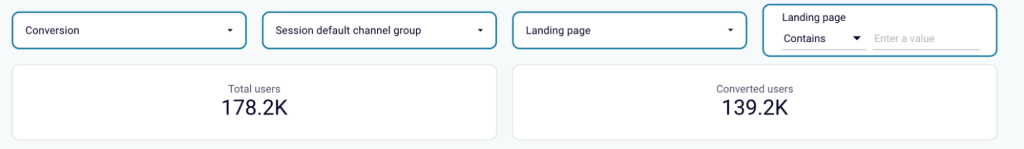
Conversions
On this page, you can see how many total users you have and what number of those got converted. The top panel offers 4 filtering options:
- Type of conversion
- Traffic channel group
- Landing page
The fourth filter allows you to search through groups of landing pages using logical operators, such as Equals, Contains, Starts with, Regex, and In.
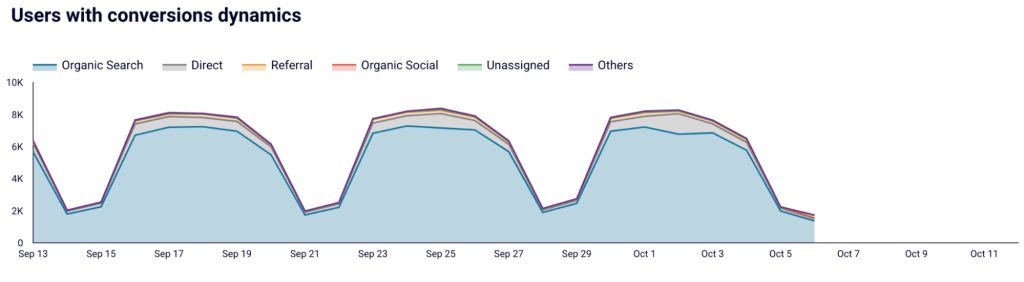
The chart about conversion dynamics shows the impact of marketing efforts, i.e. how many users each source has brought you.
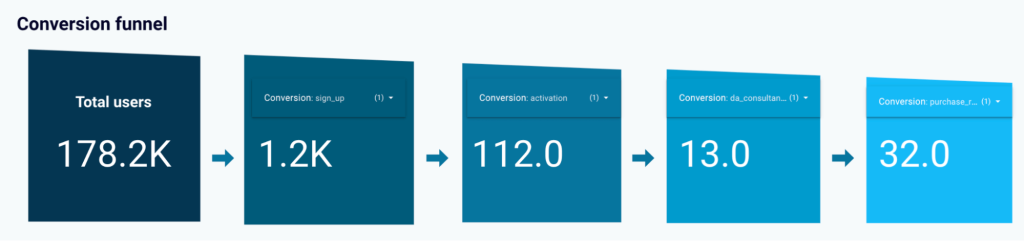
The funnel reporting section breaks down the progression from initial interest to final conversion. It has five stages that you can select based on your conversion events in GA4.
This hierarchical view helps identify bottlenecks and optimization opportunities in the conversion process.
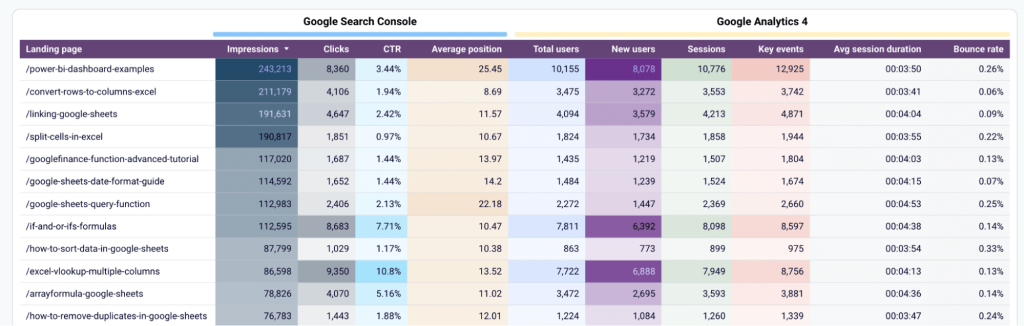
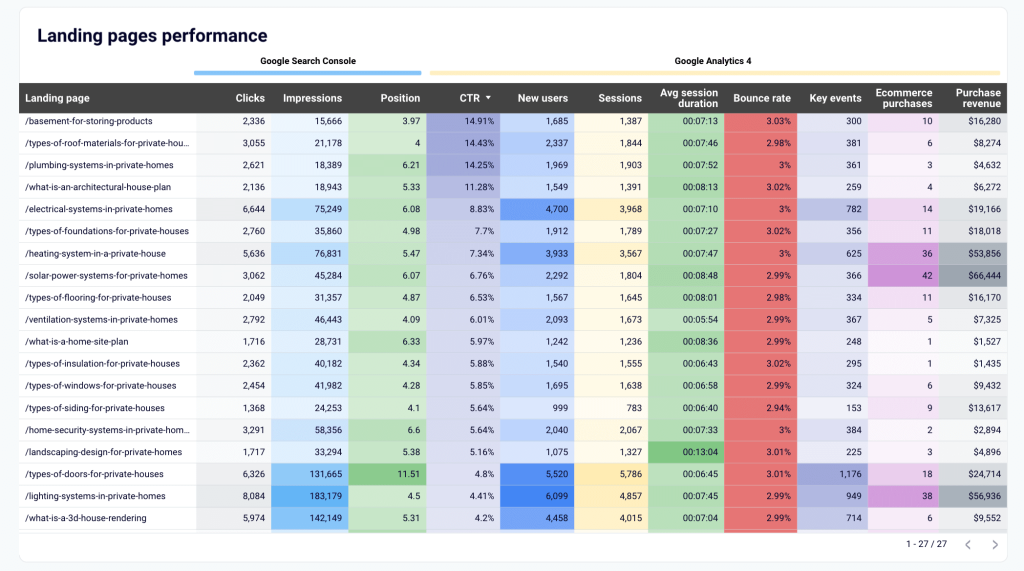
Landing page performance
This section provides a complete picture of landing page performance based on data from Google Analytics 4 and Search Console. This combination of information covers SEO and all other marketing activities.
Of course, you can filter scorecards, charts, and the table by landing page. Here are the key metrics used to analyze performance:
| GA4 metrics | Search Console metrics |
|---|---|
| – Total users – New users – Sessions – Key events – Average session duration – Bounce rate | – Impressions – Clicks – CTR – Average position |
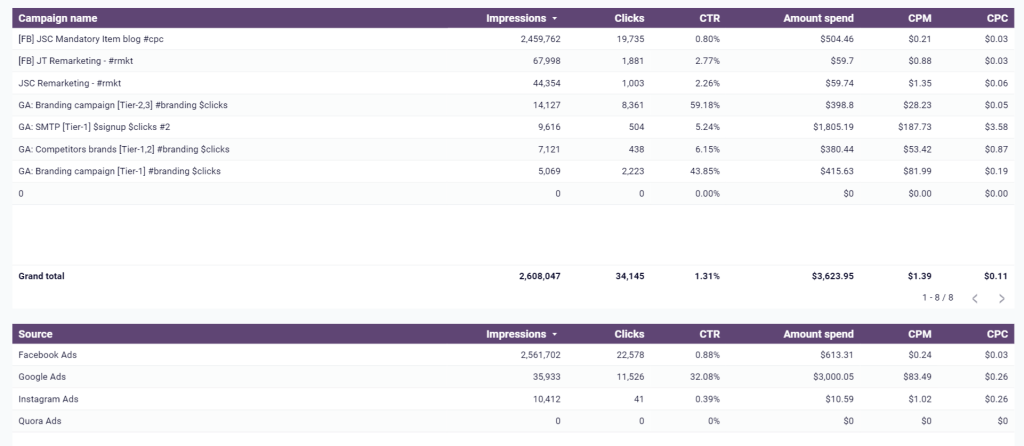
PPC overview
Paid channels are another valuable asset to your marketing efforts for your clients. Therefore, the B2B agency marketing dashboard provides a separate page to overview the performance of direct spends.
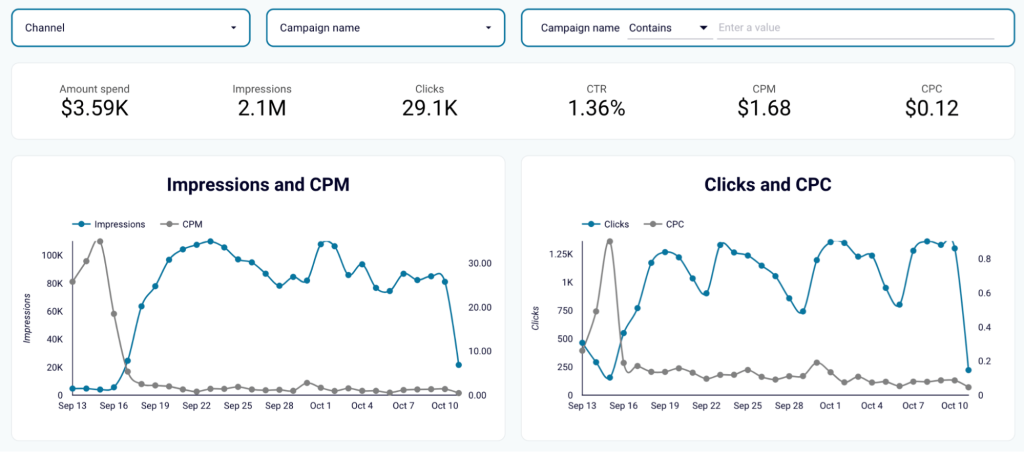
You can connect as many advertising platforms as you need including Google Ads, Meta Ads, Quora Ads, etc.
At the end of the page, you’ll see breakdown tables for campaigns and sources for more granular insights.
Example of a real case you can solve with the dashboard
Let’s look at how the dashboard works using a real example. One company with 15K traffic had only 2-3 MQLs a month. However, the spending on SEO was about $3K/mo. The company also launched PPC campaigns from time to time to test new niches.
Using the dashboard, we revealed the following insights:
- 60% of traffic was from non-target countries, so it shouldn’t even be considered in the analysis.
- There were only 4 pages on the website that generated traffic with commercial intent that was interesting for the company. So, we focused on these pages.
- We’ve cut off the SEO budget used for non-focus pages and some of this budget was re-balanced on behalf of focus pages.
- As a result, we’ve reduced the SEO budget by 30%, improved the positions of target keywords from 11-20th to top-5, and finally, demonstrated a 3x growth of the number of MQLs within 2 months.
All this was possible thanks to the right focus that we’ve achieved using the right dashboard.
Who can use the dashboard?
This B2B marketing dashboard has a custom setup. You’ll need to connect multiple data sources as separate connectors, including Google Analytics, Google Search Console, and the advertising platforms used. However, our team of data experts can implement this for you. Your clients will get 24/7 access to their marketing performance data and the ability to monitor the progress in real-time.
Transparent relationship – checked ?
Feel free to reach out to our data experts who can help you implement this dashboard or design a custom solution!
Automate agency reporting with Coupler.io
Book a demo callOther examples of dashboards for marketing agencies
The dashboard above is a custom-built solution we developed together with one of our partners. Technically, it’s a once-off – but we’ve got plenty of ready-to-use templates just like it. Here are a few examples from our extensive library of 100+ marketing and sales report templates:
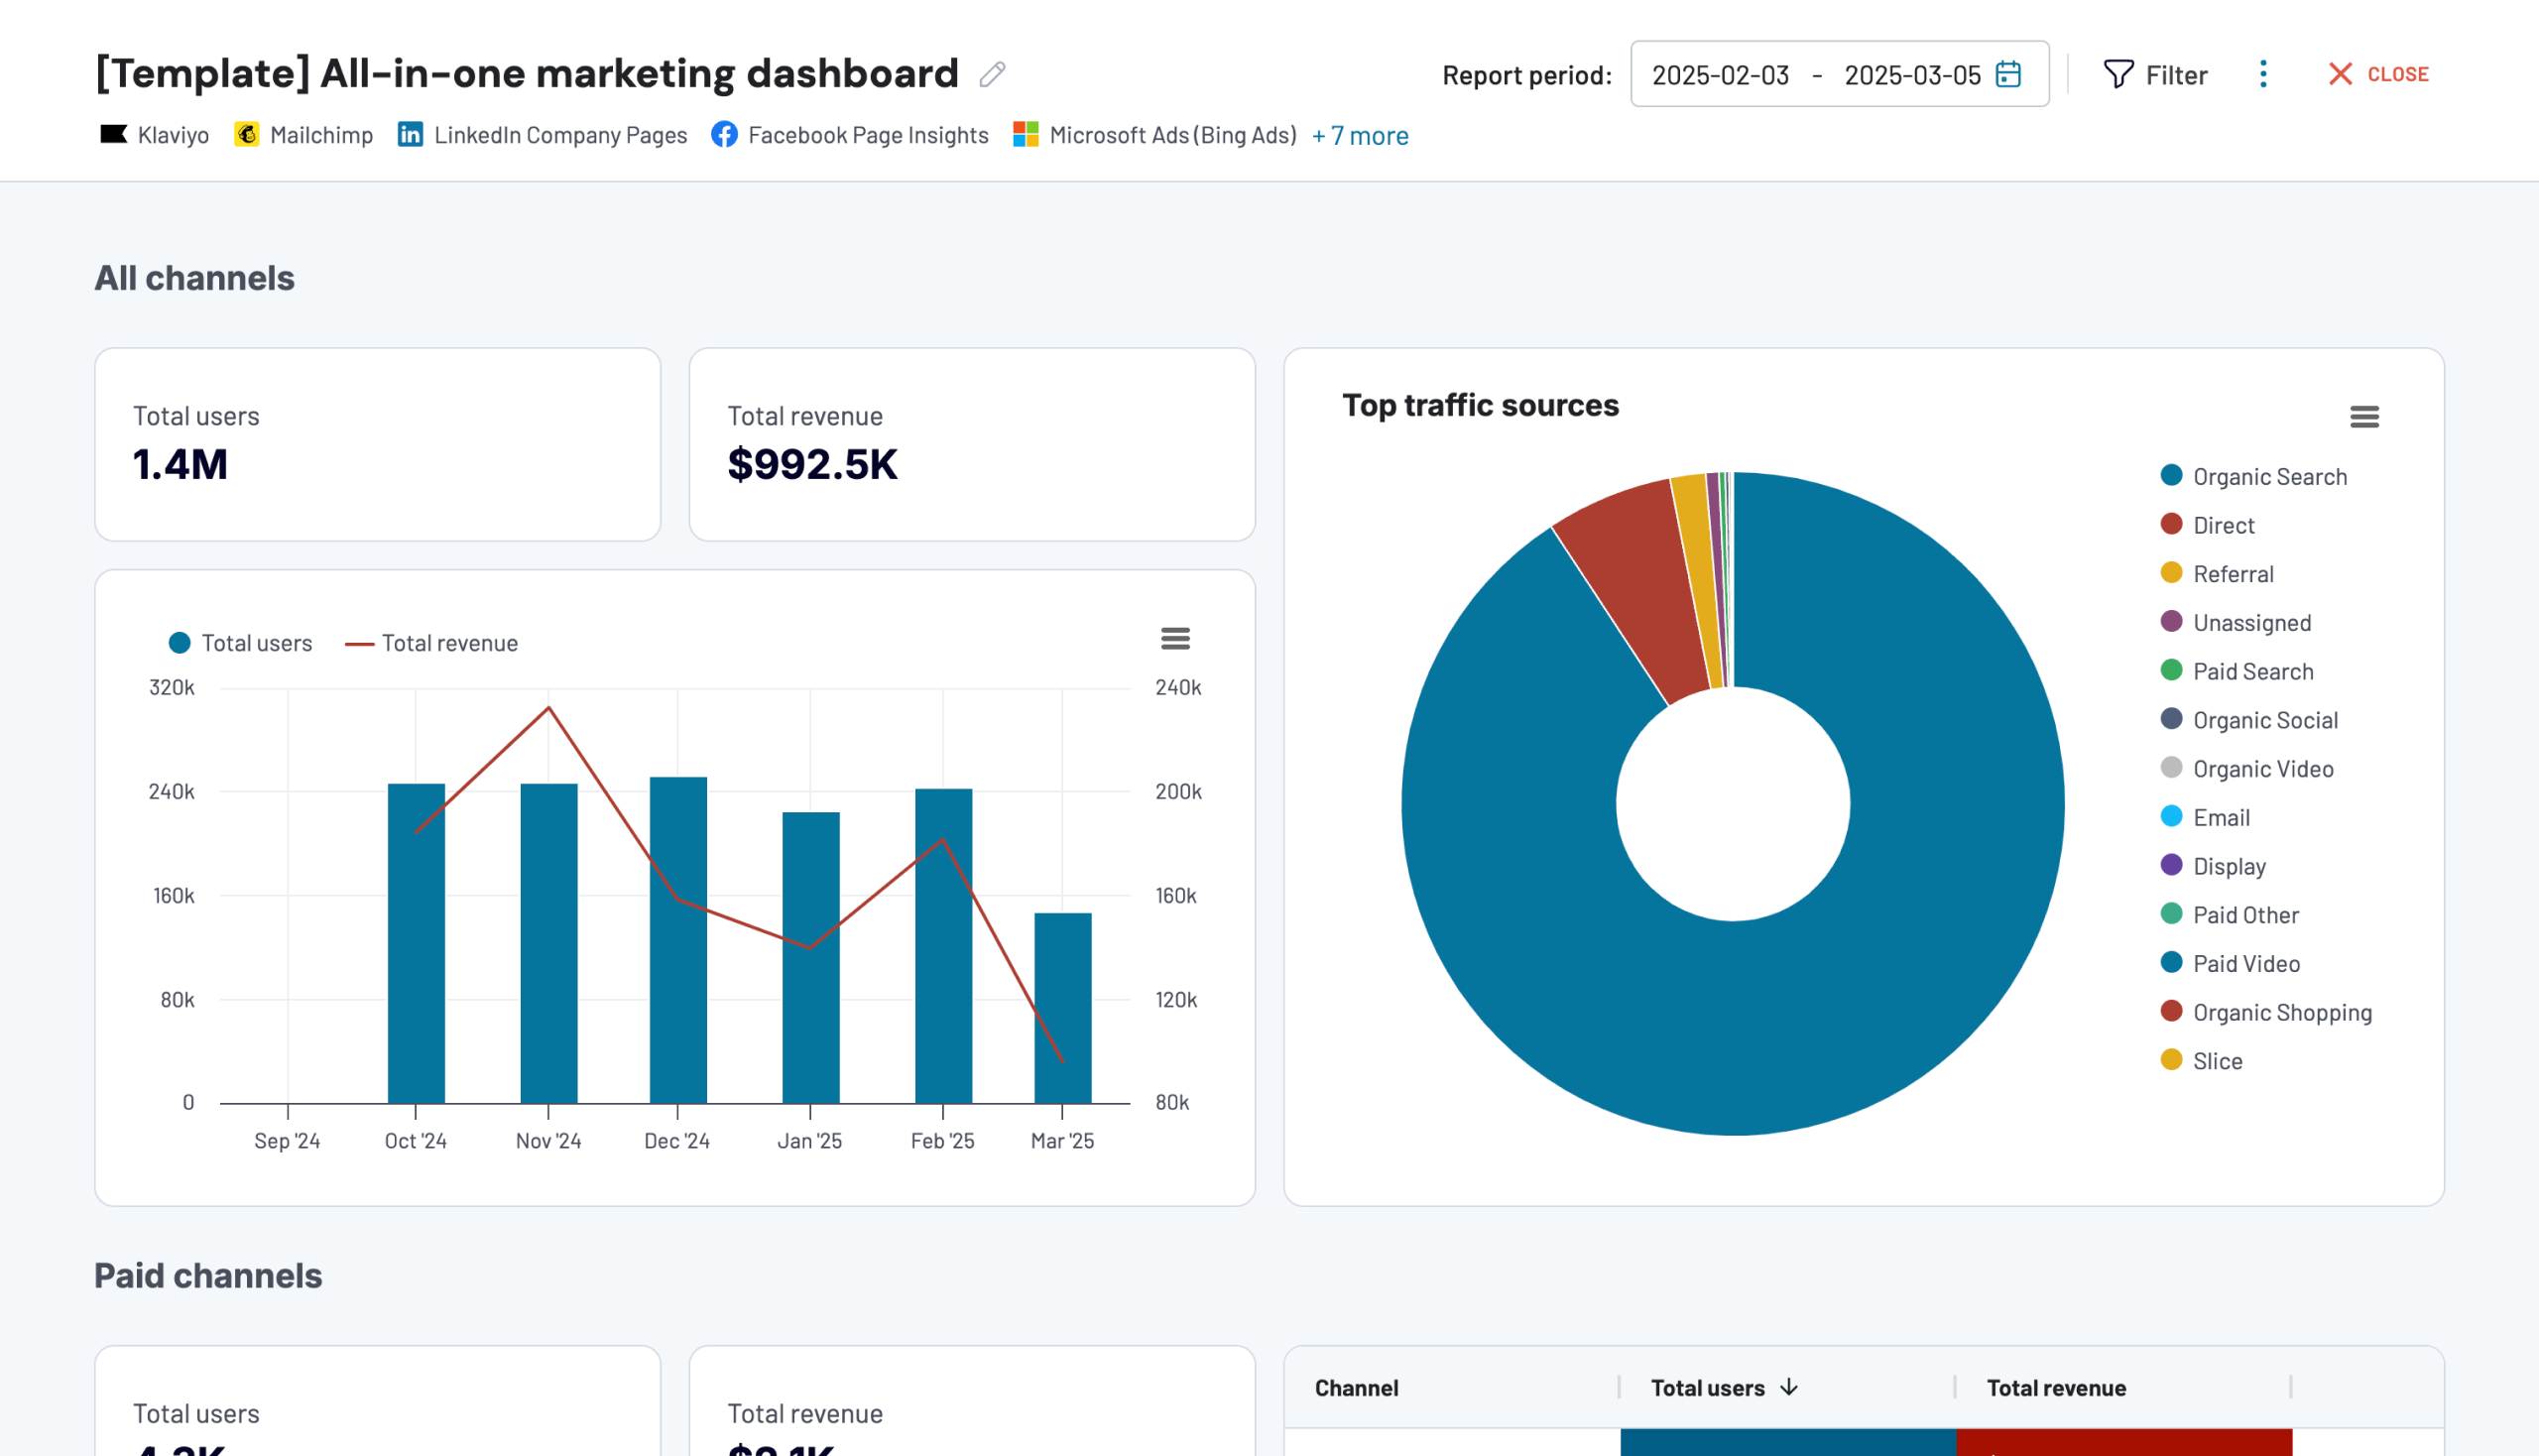
All-in-one marketing analytics dashboard
The all-in-one marketing analytics dashboard provides an overview of marketing performance across multiple channels, such as paid ads, organic search, social media, and email marketing. It consolidates data from several platforms, including Google Analytics, Google Search Console, Facebook Ads, YouTube, Mailchimp, and more.
Insights the dashboard provides:
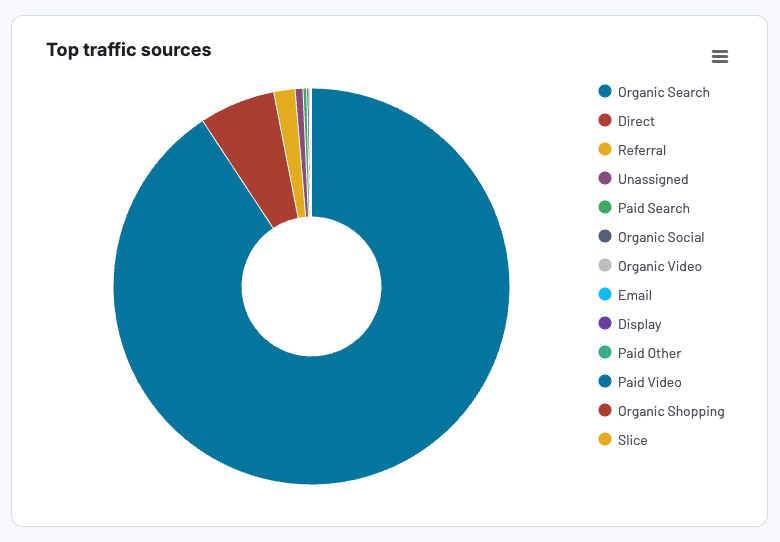
- Cross-channel performance summary. Compare totals and user and revenue dynamics for the past 6 months. A pie chart reveals top traffic sources, helping you decide where to increase/decrease your marketing investment.
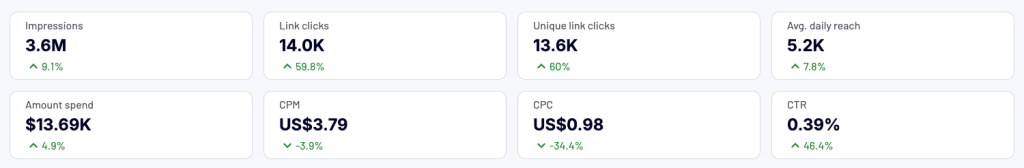
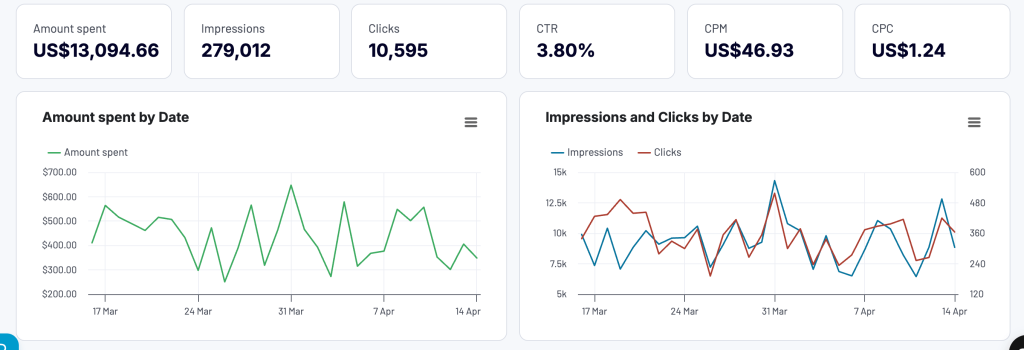
- Paid channels overview. Analyze PPC advertising results with a month-by-month breakdown of performance metrics. Track impressions, clicks, amount spent, etc. and the revenue they generate. Filter by platform (e.g., Google Ads, LinkedIn Ads) to understand which ones deliver the best ROI.
- Organic search performance summary. Evaluate the efficiency of different search engines in terms of how they bring traffic to the client’s website. Monitor key metrics including impressions, clicks, CTR, and average position.
- Organic social media overview. Compare impressions and avg daily reach for Facebook, Instagram, and LinkedIn. Understand which platform drives the most sales for your client’s business.
- YouTube performance overview. Analyze video engagements and views to determine how the client’s channel is performing. Filter by session source to compare traffic and revenue from other platforms (e.g., TikTok).
- Email performance summary. Monitor the effectiveness of your email marketing campaigns in Klaviyo and Mailchimp. Information from key metrics (open rates, bounces, clicks) helps you evaluate the success of your email outreach and optimize for higher engagement.
The data in this dashboard updates automatically – no need for regular manual refreshes or uploads. You can use the dashboard in Coupler.io or get it as a Looker Studio template.
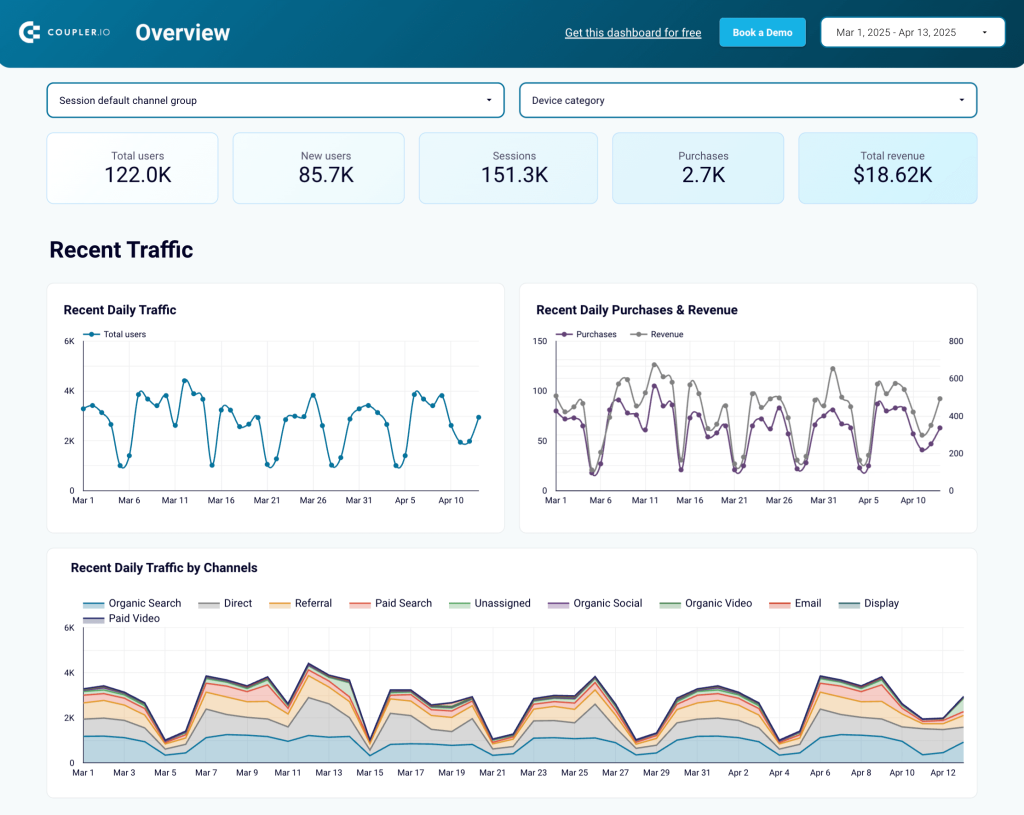
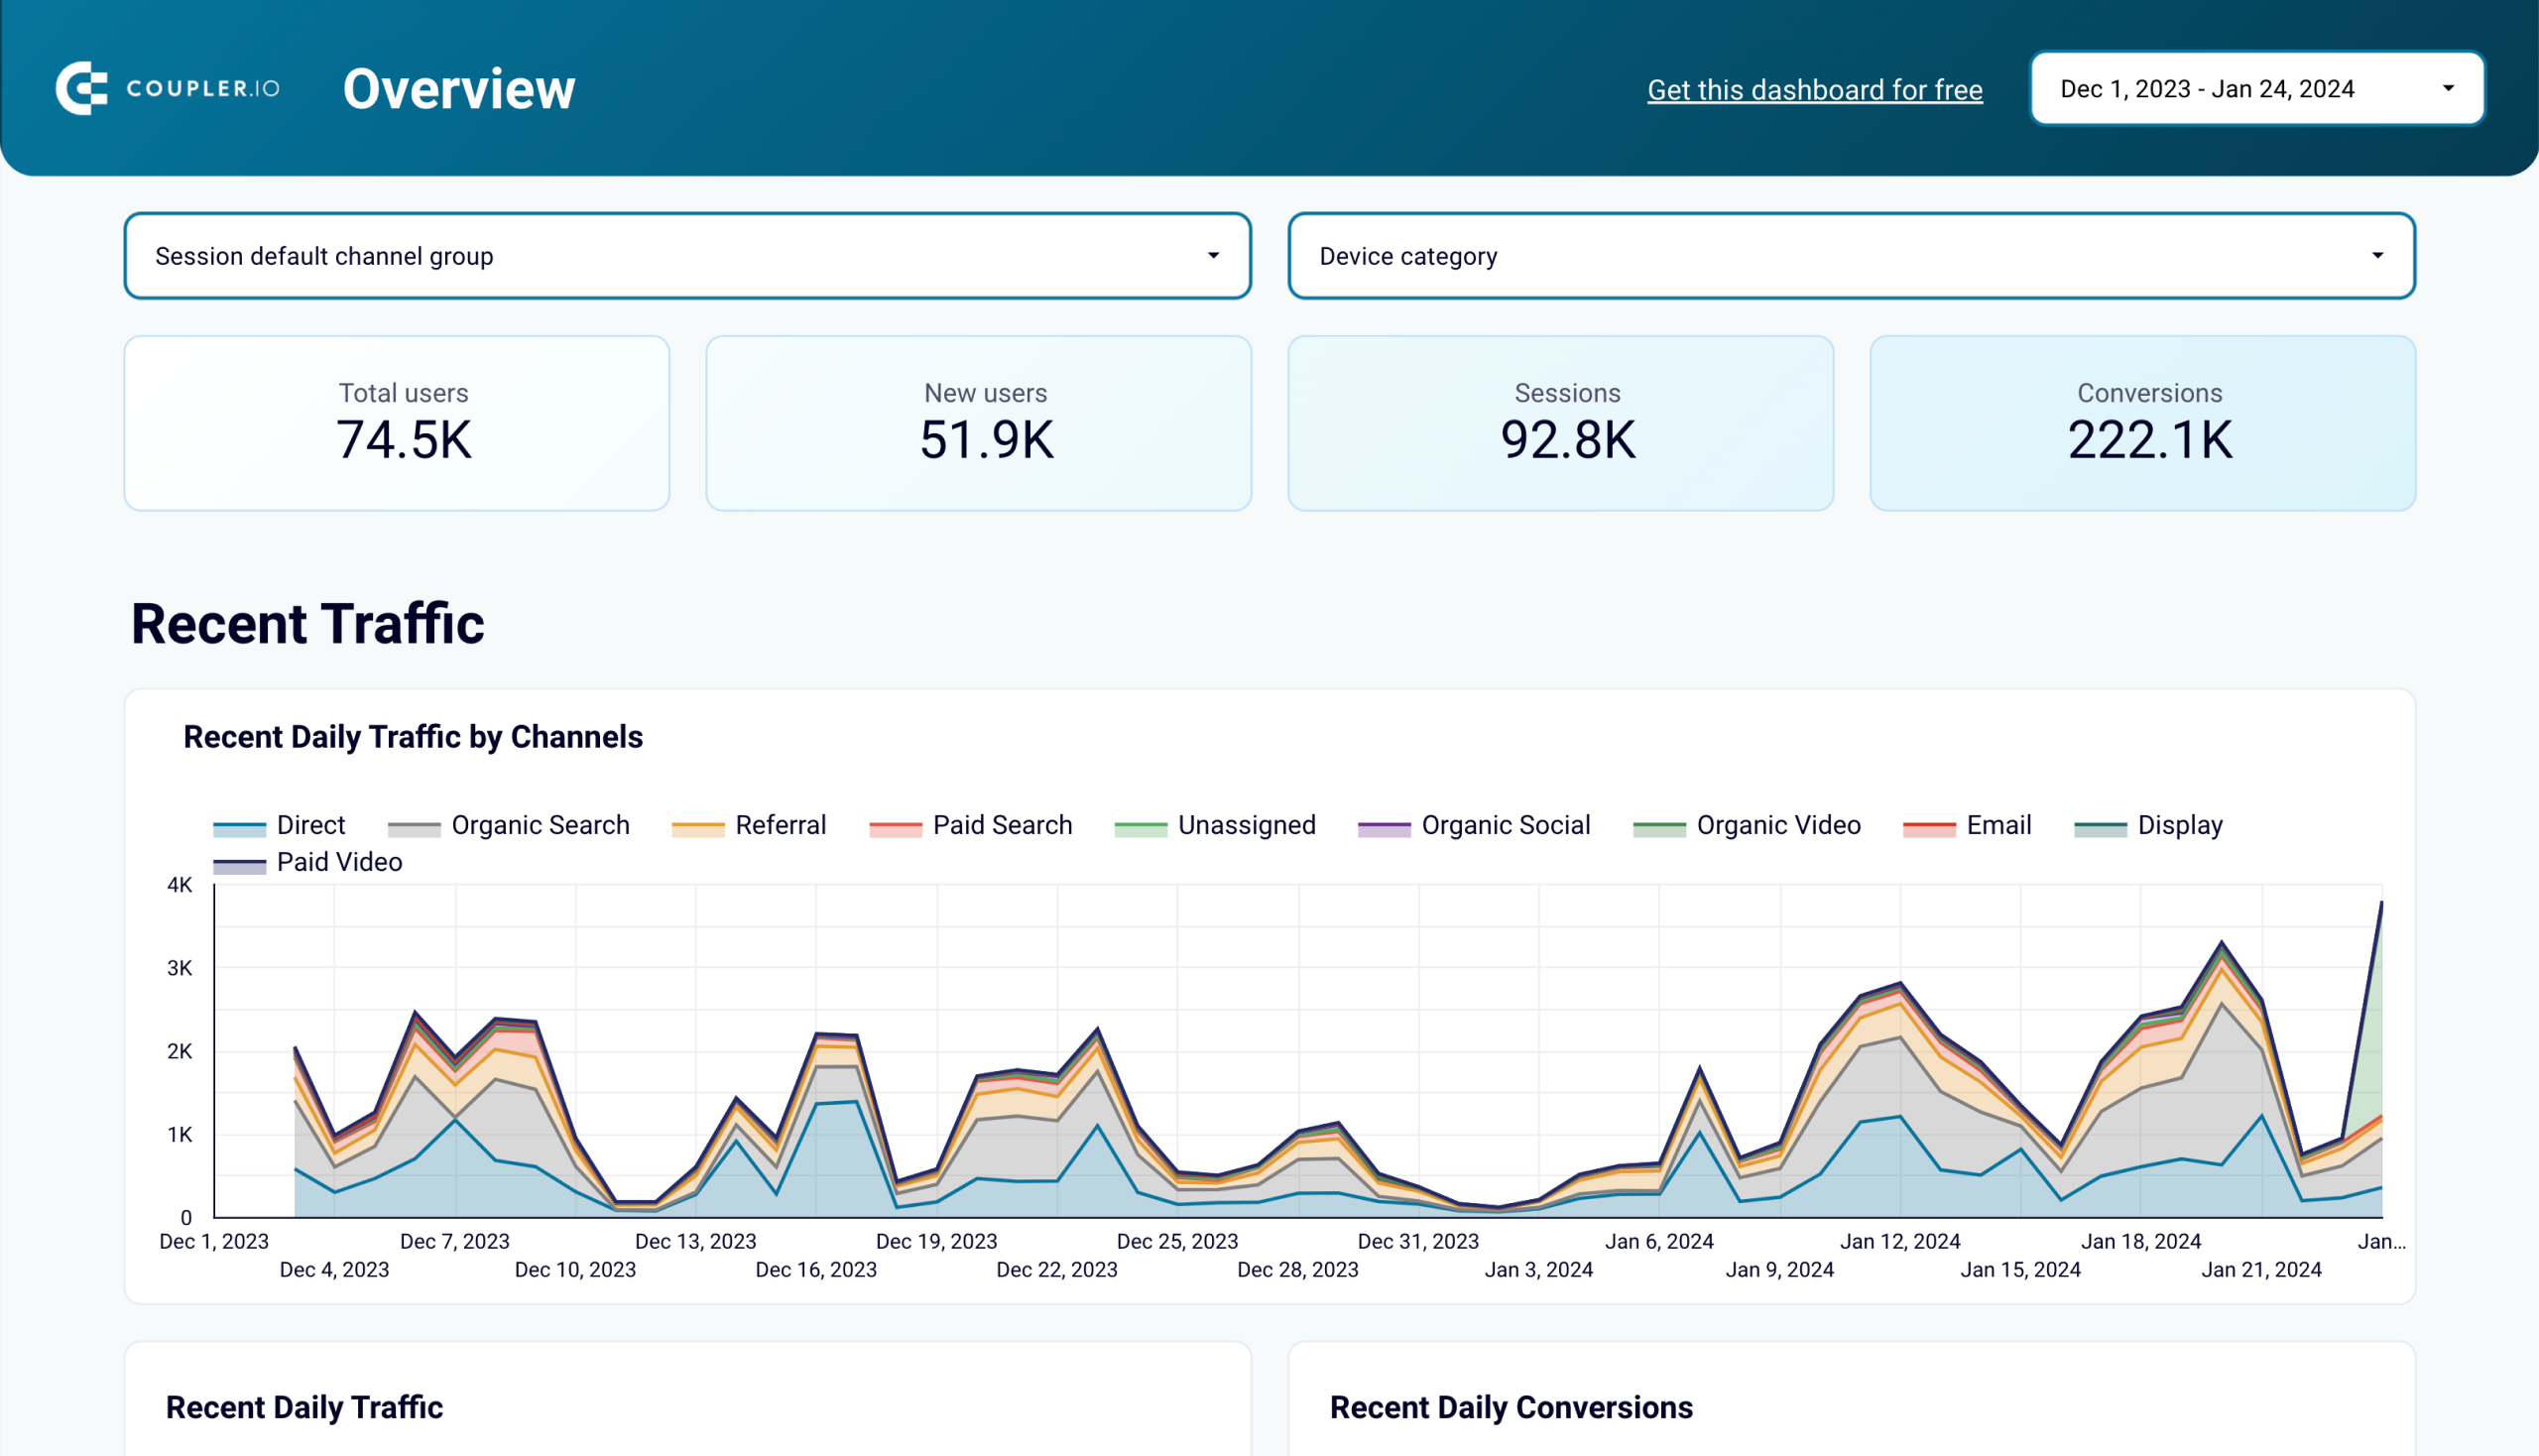
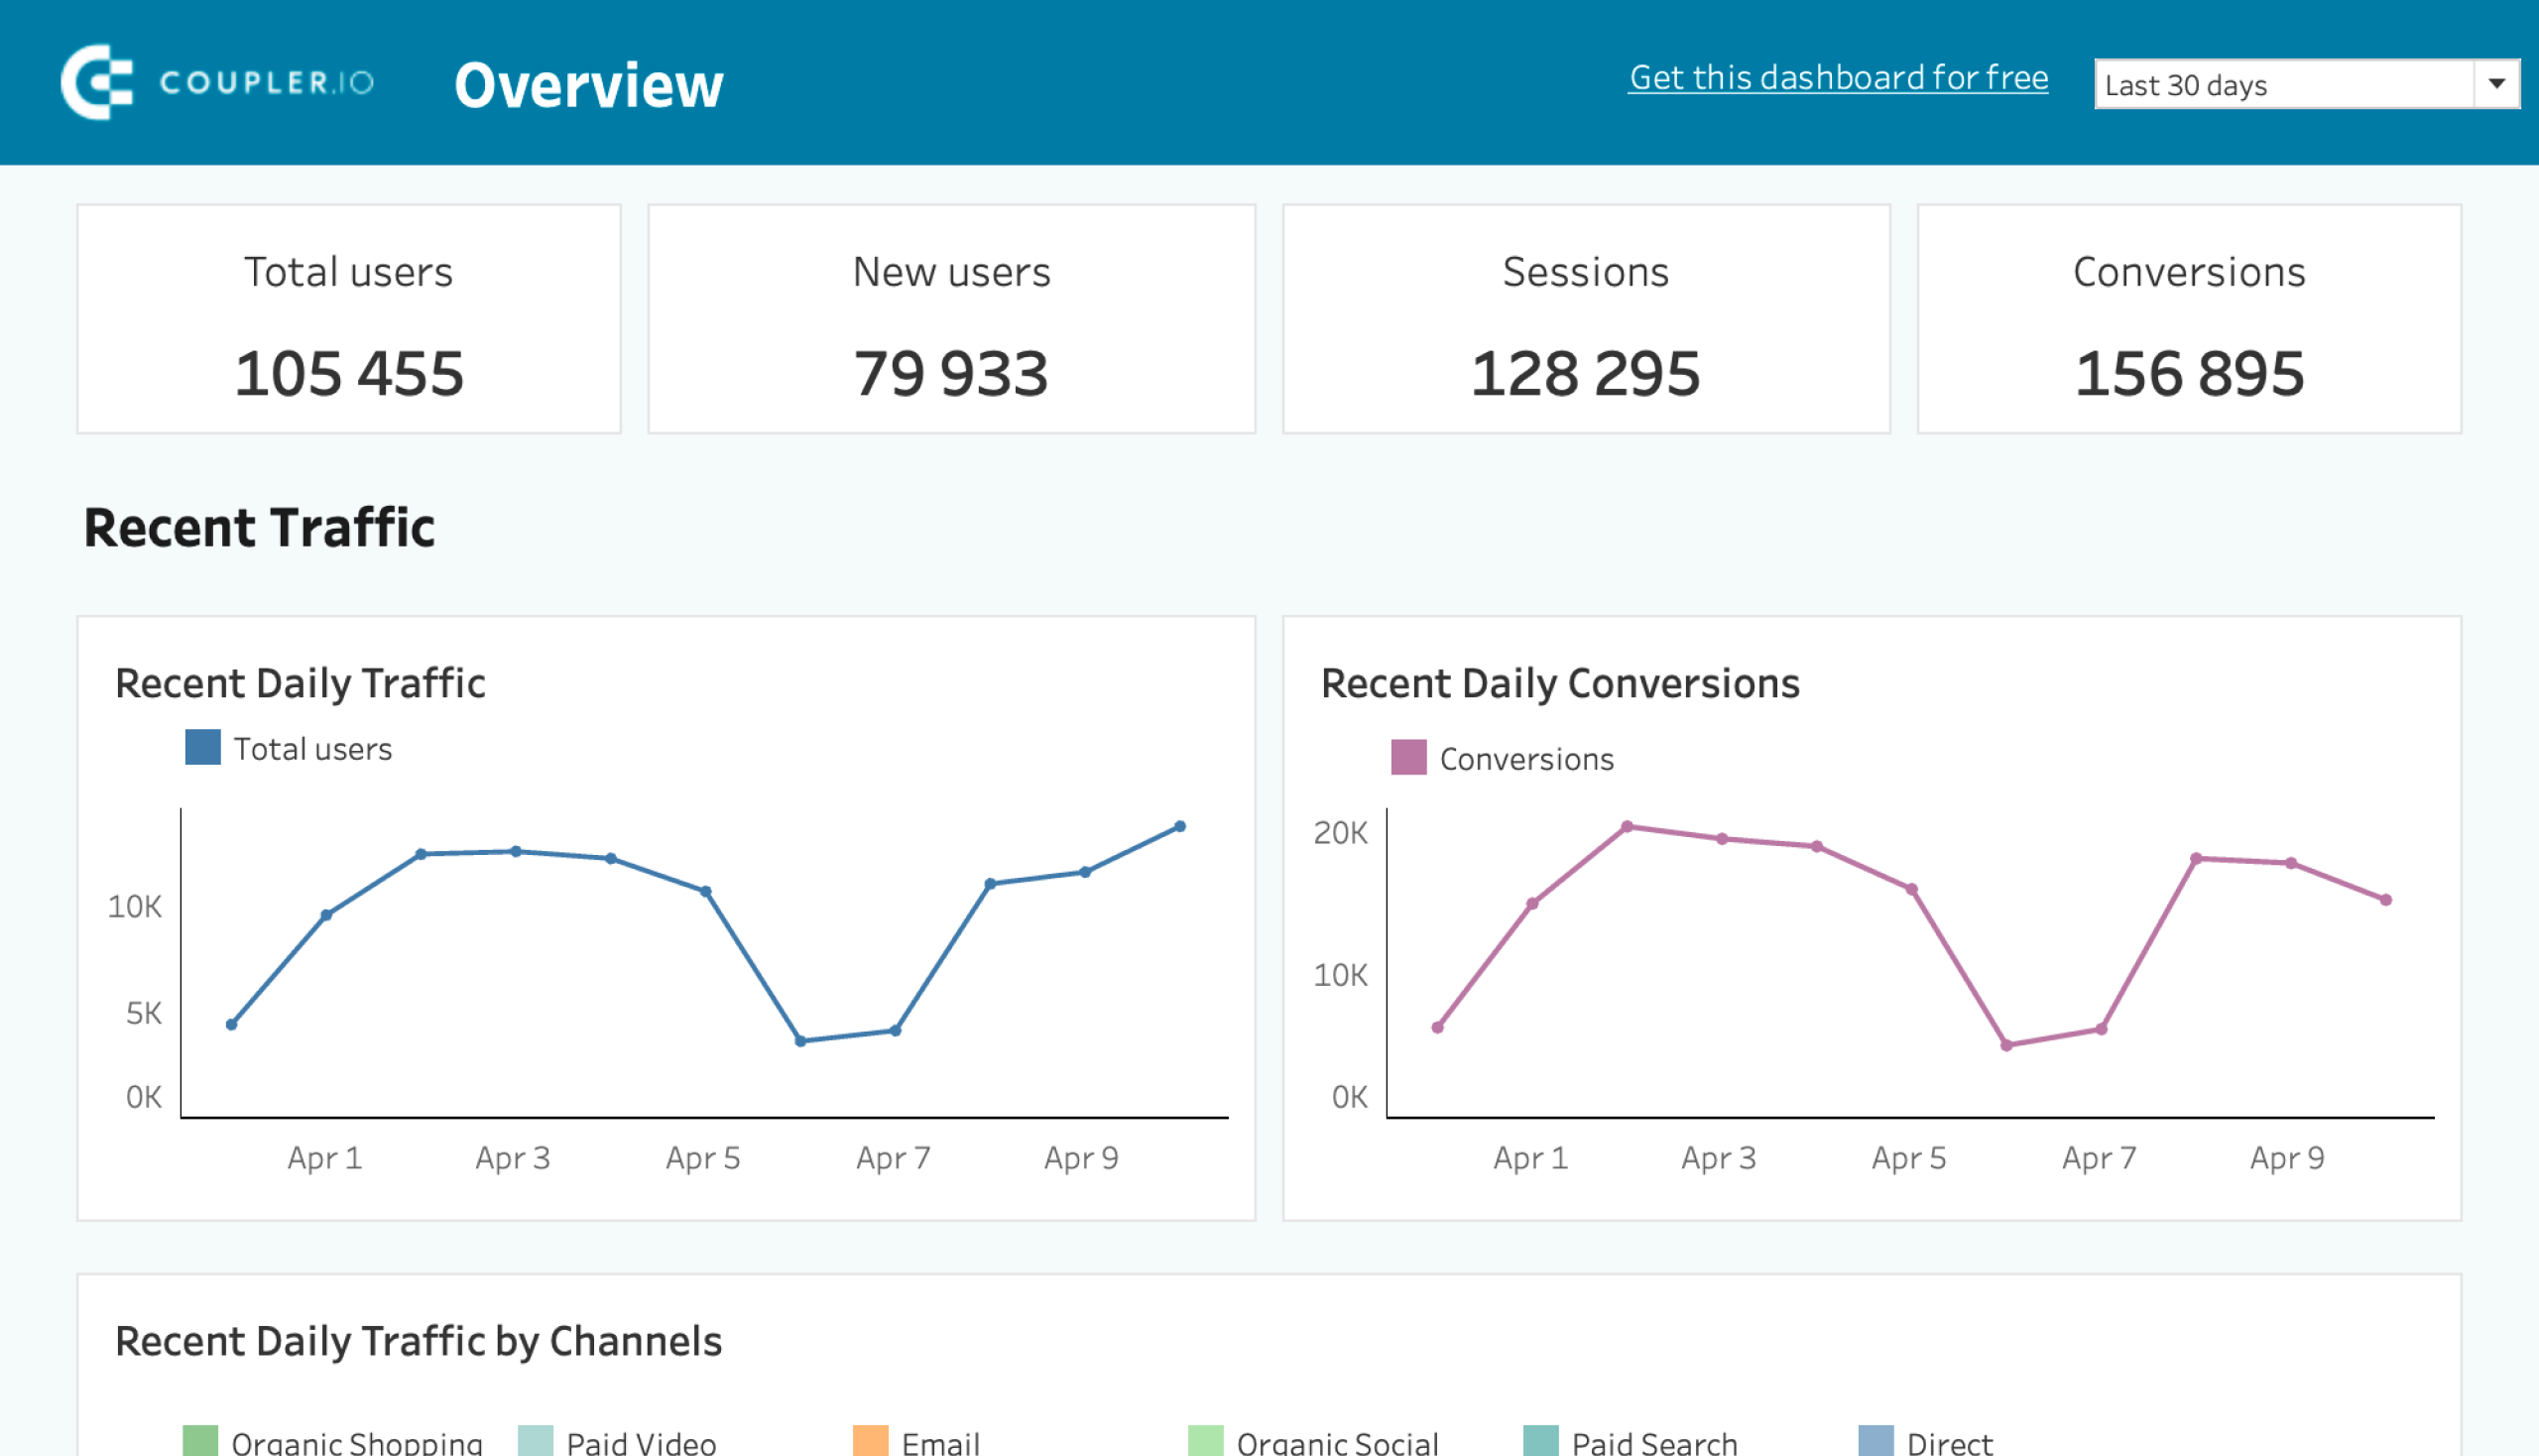
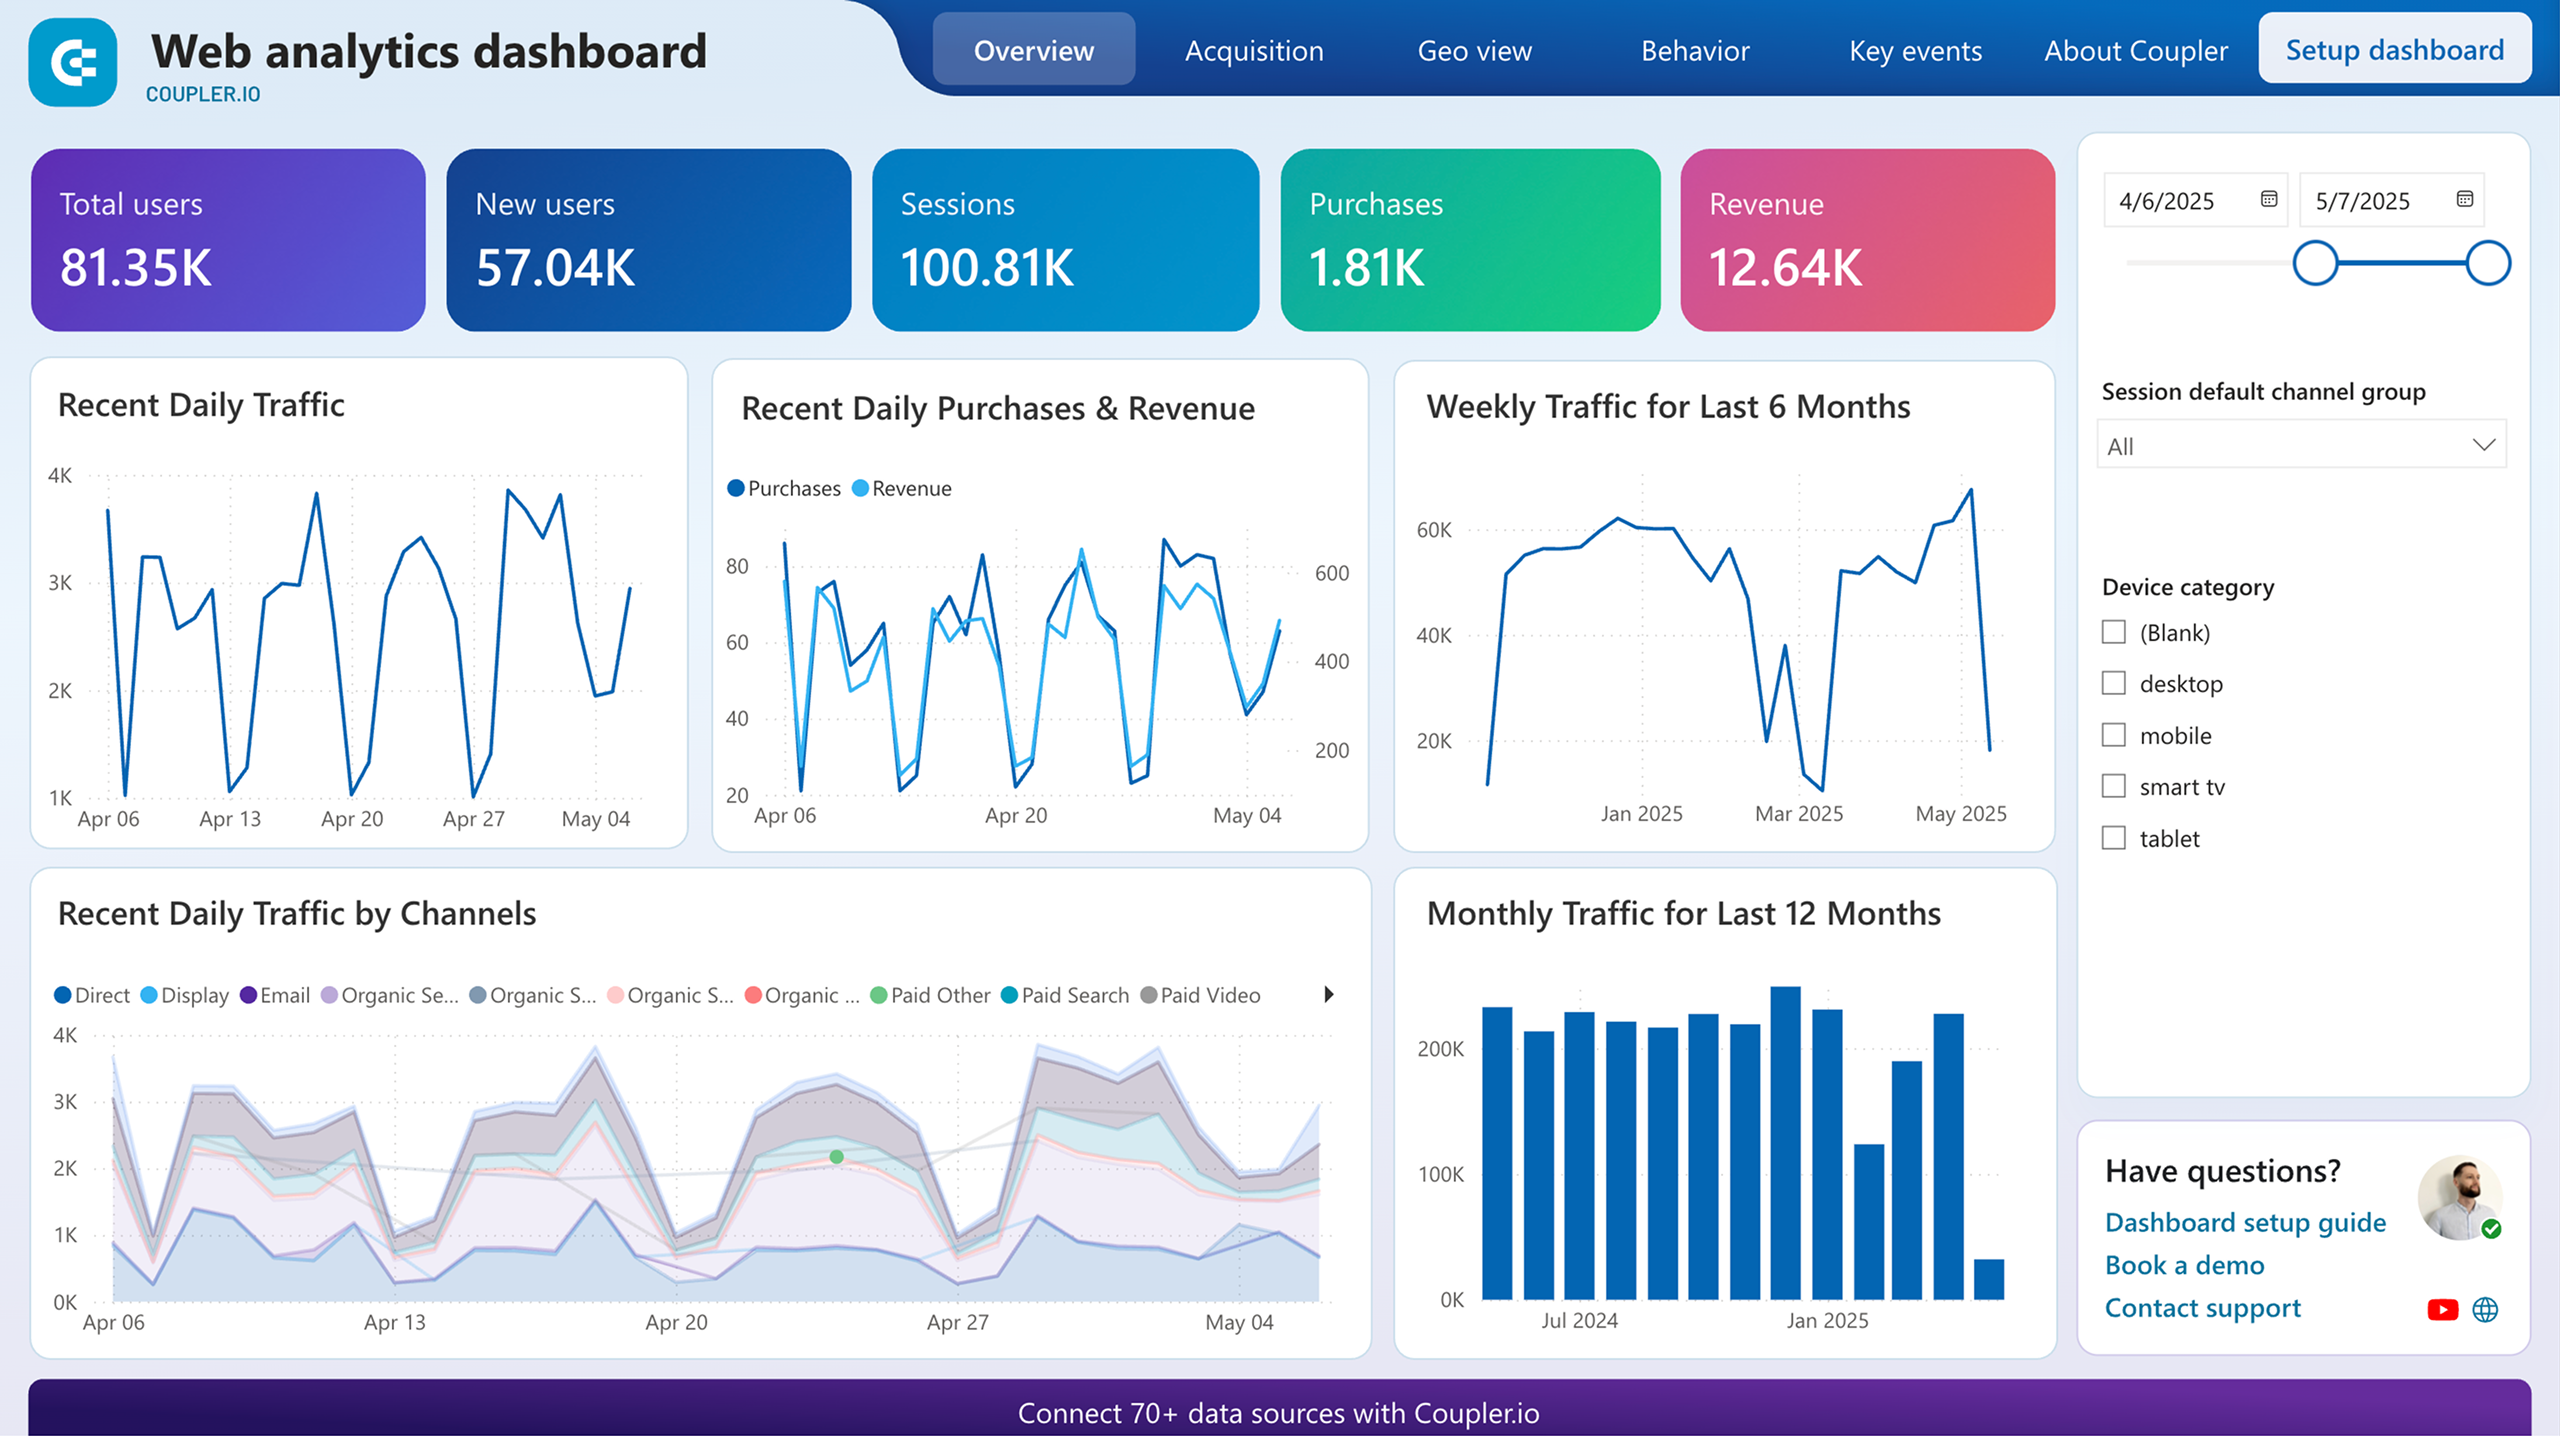
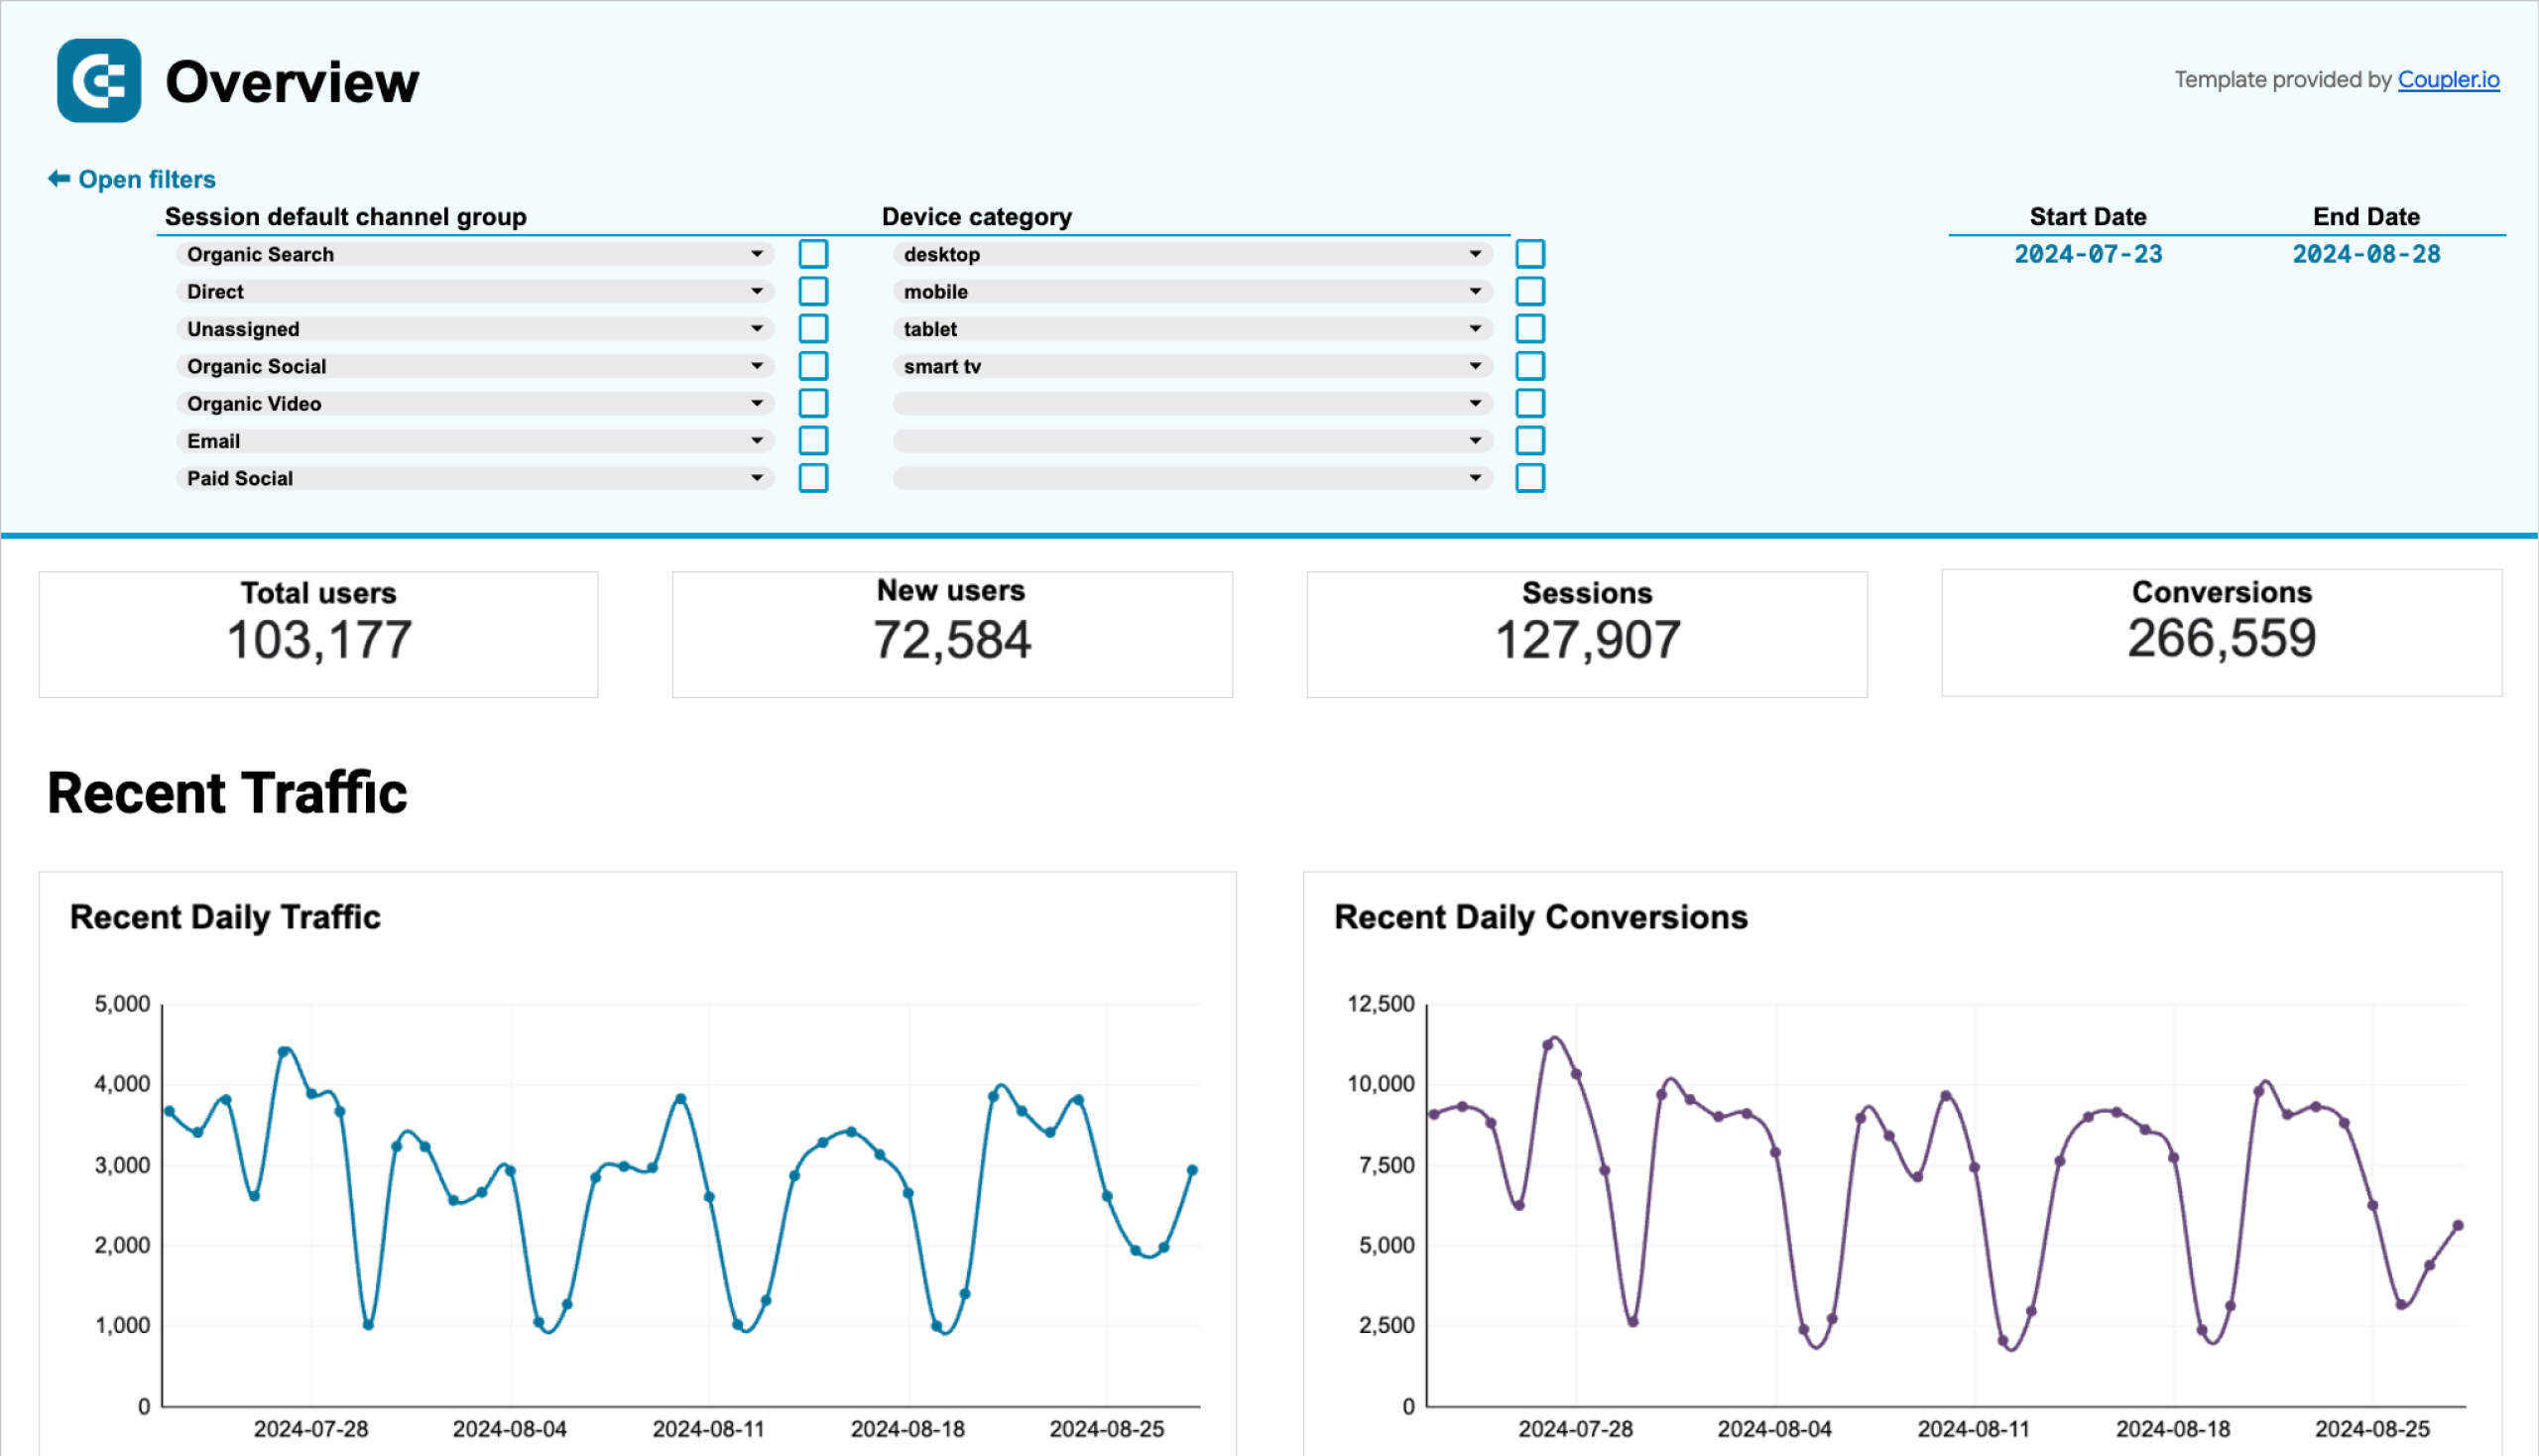
Web analytics dashboard
This 4-page web analytics dashboard template provides daily updates on key product and marketing metrics, such as purchases, active users, and revenue. You can open it every morning to see the growth of your clients’ daily traffic, conversions, user engagement, and much more.
Insights the dashboard provides:
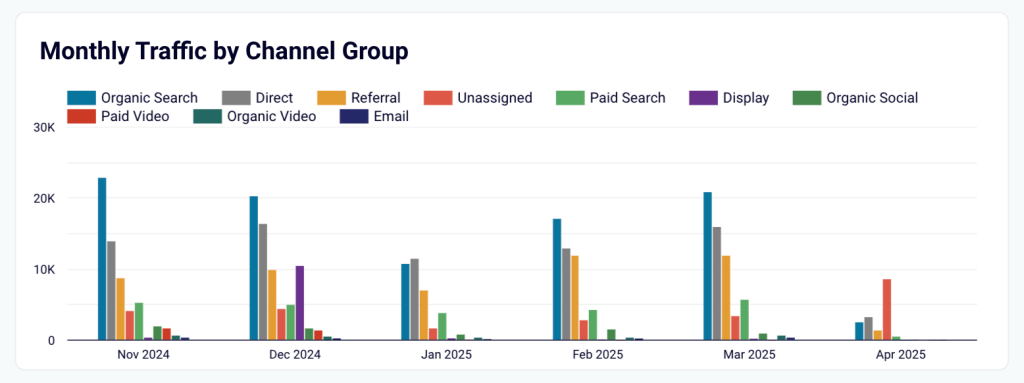
- Main metrics overview. Get a summary of website performance by the number of new users, sessions, purchases, and revenue. Understand which channels (organic search, referral, etc.) attract the most visitors and use the date picker to narrow down your analysis.
- Acquisition breakdown. Dive deeper into marketing channel performance, with the ability to filter by country, device, campaign, and more. Use this information to adjust your marketing investments and acquire more leads for your clients.
- Behavior and audience dynamics. Learn more about your client’s audience through user demographics (gender, city) and common behaviors, such as which landing pages they engage with the most.
- Key events tracking. Monitor key events (i.e., conversions) recorded by GA4. Analyze their dynamics over a 6-month period and by channel group to identify which marketing efforts are driving the most valuable actions.
It only takes a few minutes to sign up for Coupler.io and populate the template with your GA4 data. Find a version of this dashboard in your favorite BI tool:
Web analytics dashboard in Looker Studio
Use the insights based on the data from GA4 to monitor your website traffic and discover which pages resonate most with your audience.


Web analytics dashboard in Tableau
Monitor the performance of your traffic, analyze the conversion funnel, and derive other insights from Google Analytics 4.

Web analytics dashboard in Power BI
Discover insights into your website’s traffic acquisition, audience, and conversions with Google Analytics 4 data seamlessly connected to our Power BI dashboard template.

Web analytics dashboard in Google Sheets
Gain valuable insights into your website’s traffic sources, user interactions, and conversion metrics based on data from GA4.

Google Analytics dashboard for multiple properties
Chances are you’re managing several websites at once, but you haven’t ever compared their performance side-by-side. This dashboard aggregates data from multiple GA4 properties in a single page. You can view traffic and engagement from different sites in one place – no need to jump between multiple tabs in your browser.
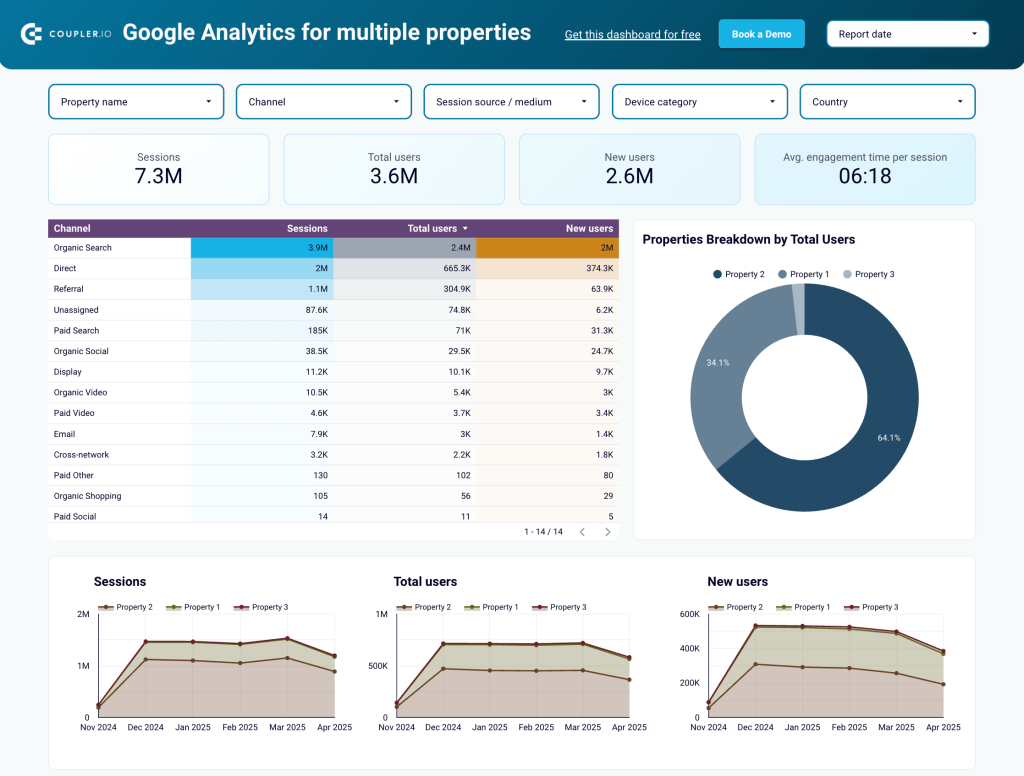
Insights the report provides:
- Total performance overview + filters. Review key metrics including the number of sessions, total users, new users, and avg. engagement time. Use the set of 5 filters to reveal insights such as which devices drive the most traffic to your client portfolio.
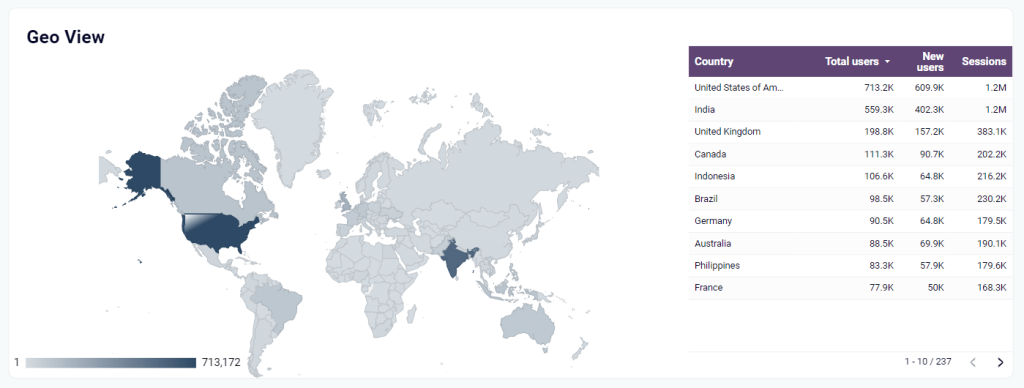
- Performance by countries. Analyze the geo map to understand where the majority of traffic to your client portfolio comes from (e.g., United States). Use this information to guide content localization efforts and tailor marketing campaigns for different clients.
- Monthly performance dynamics. Monitor traffic evolution across websites for the past 6 months. This can help you spot over/underperforming sites and take targeted action to improve overall dynamics.
This dashboard template is available in Looker Studio. To get a copy for your agency, simply create a free Coupler.io account.
Landing page performance dashboard
This one-page dashboard helps you understand how effectively your landing pages drive traffic and convert visitors into customers for your clients. It pulls data from GA4 and Google Search Console and displays key performance metrics for each page, such as impressions, clicks, total users, new users, average session duration, and key events.
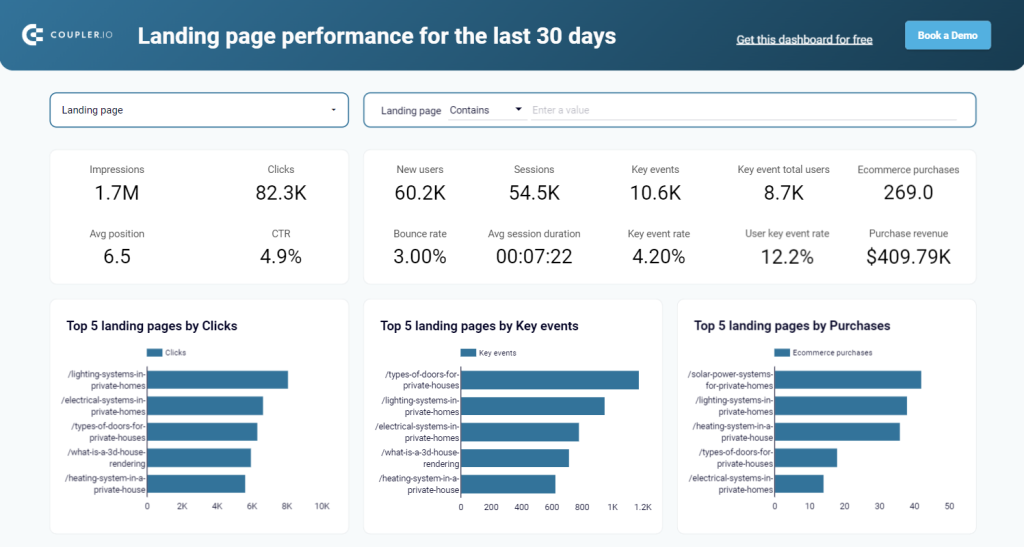
Insights the dashboard provides:
- SEO performance. Review impressions, clicks, and CTR metrics to evaluate the results of your SEO efforts for the past 30 days.
- User engagement dynamics. Track GA4 metrics like new users, sessions, and avg. session duration to assess how visitors interact with your site. This helps you identify areas where the user journey can be enhanced.
- Top 5 landing pages. Monitor the volume of clicks, conversions, and e-commerce purchases your most popular pages receive. Analyze these metrics to optimize product offerings, improve the customer journey, and boost overall revenue.
- Page comparison. Assess the performance of individual landing pages in a simple table visualization. Compare metrics like clicks, new users, purchase revenue, etc. to pinpoint which ones require optimization or further promotion.
This template is available for free with a Coupler.io account. It also updates automatically on a schedule of your choice. Get started in 5 minutes in either Google Sheets or Looker Studio:
Customer acquisition dashboard for HubSpot or Pipedrive
The customer acquisition dashboard for HubSpot reveals how leads move through the acquisition funnel — from ad impressions to CRM conversions. It combines HubSpot data with marketing data from GA4 and all major ad platforms like Facebook Ads, LinkedIn Ads, Google Ads, etc. This can help your agency identify funnel inefficiencies, optimize ad spend, and refine lead-generation strategies to maximize revenue for clients.
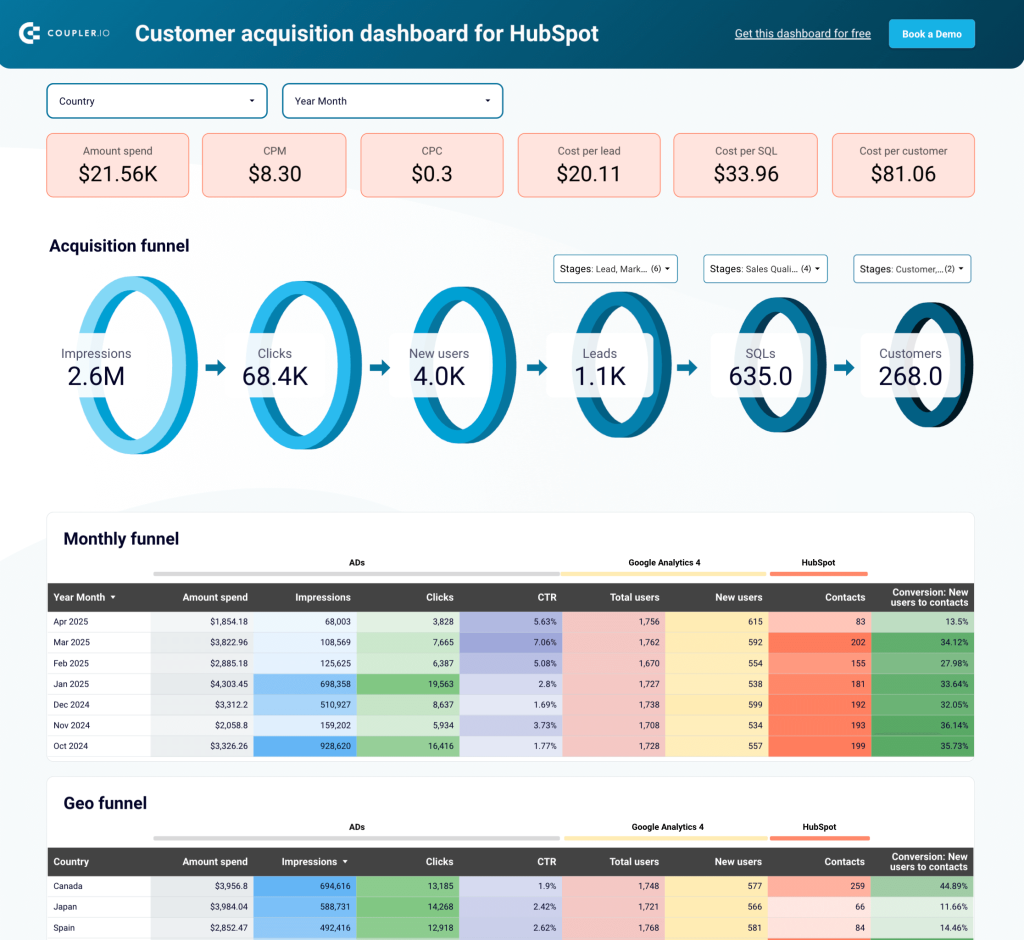
Insights the dashboard provides:
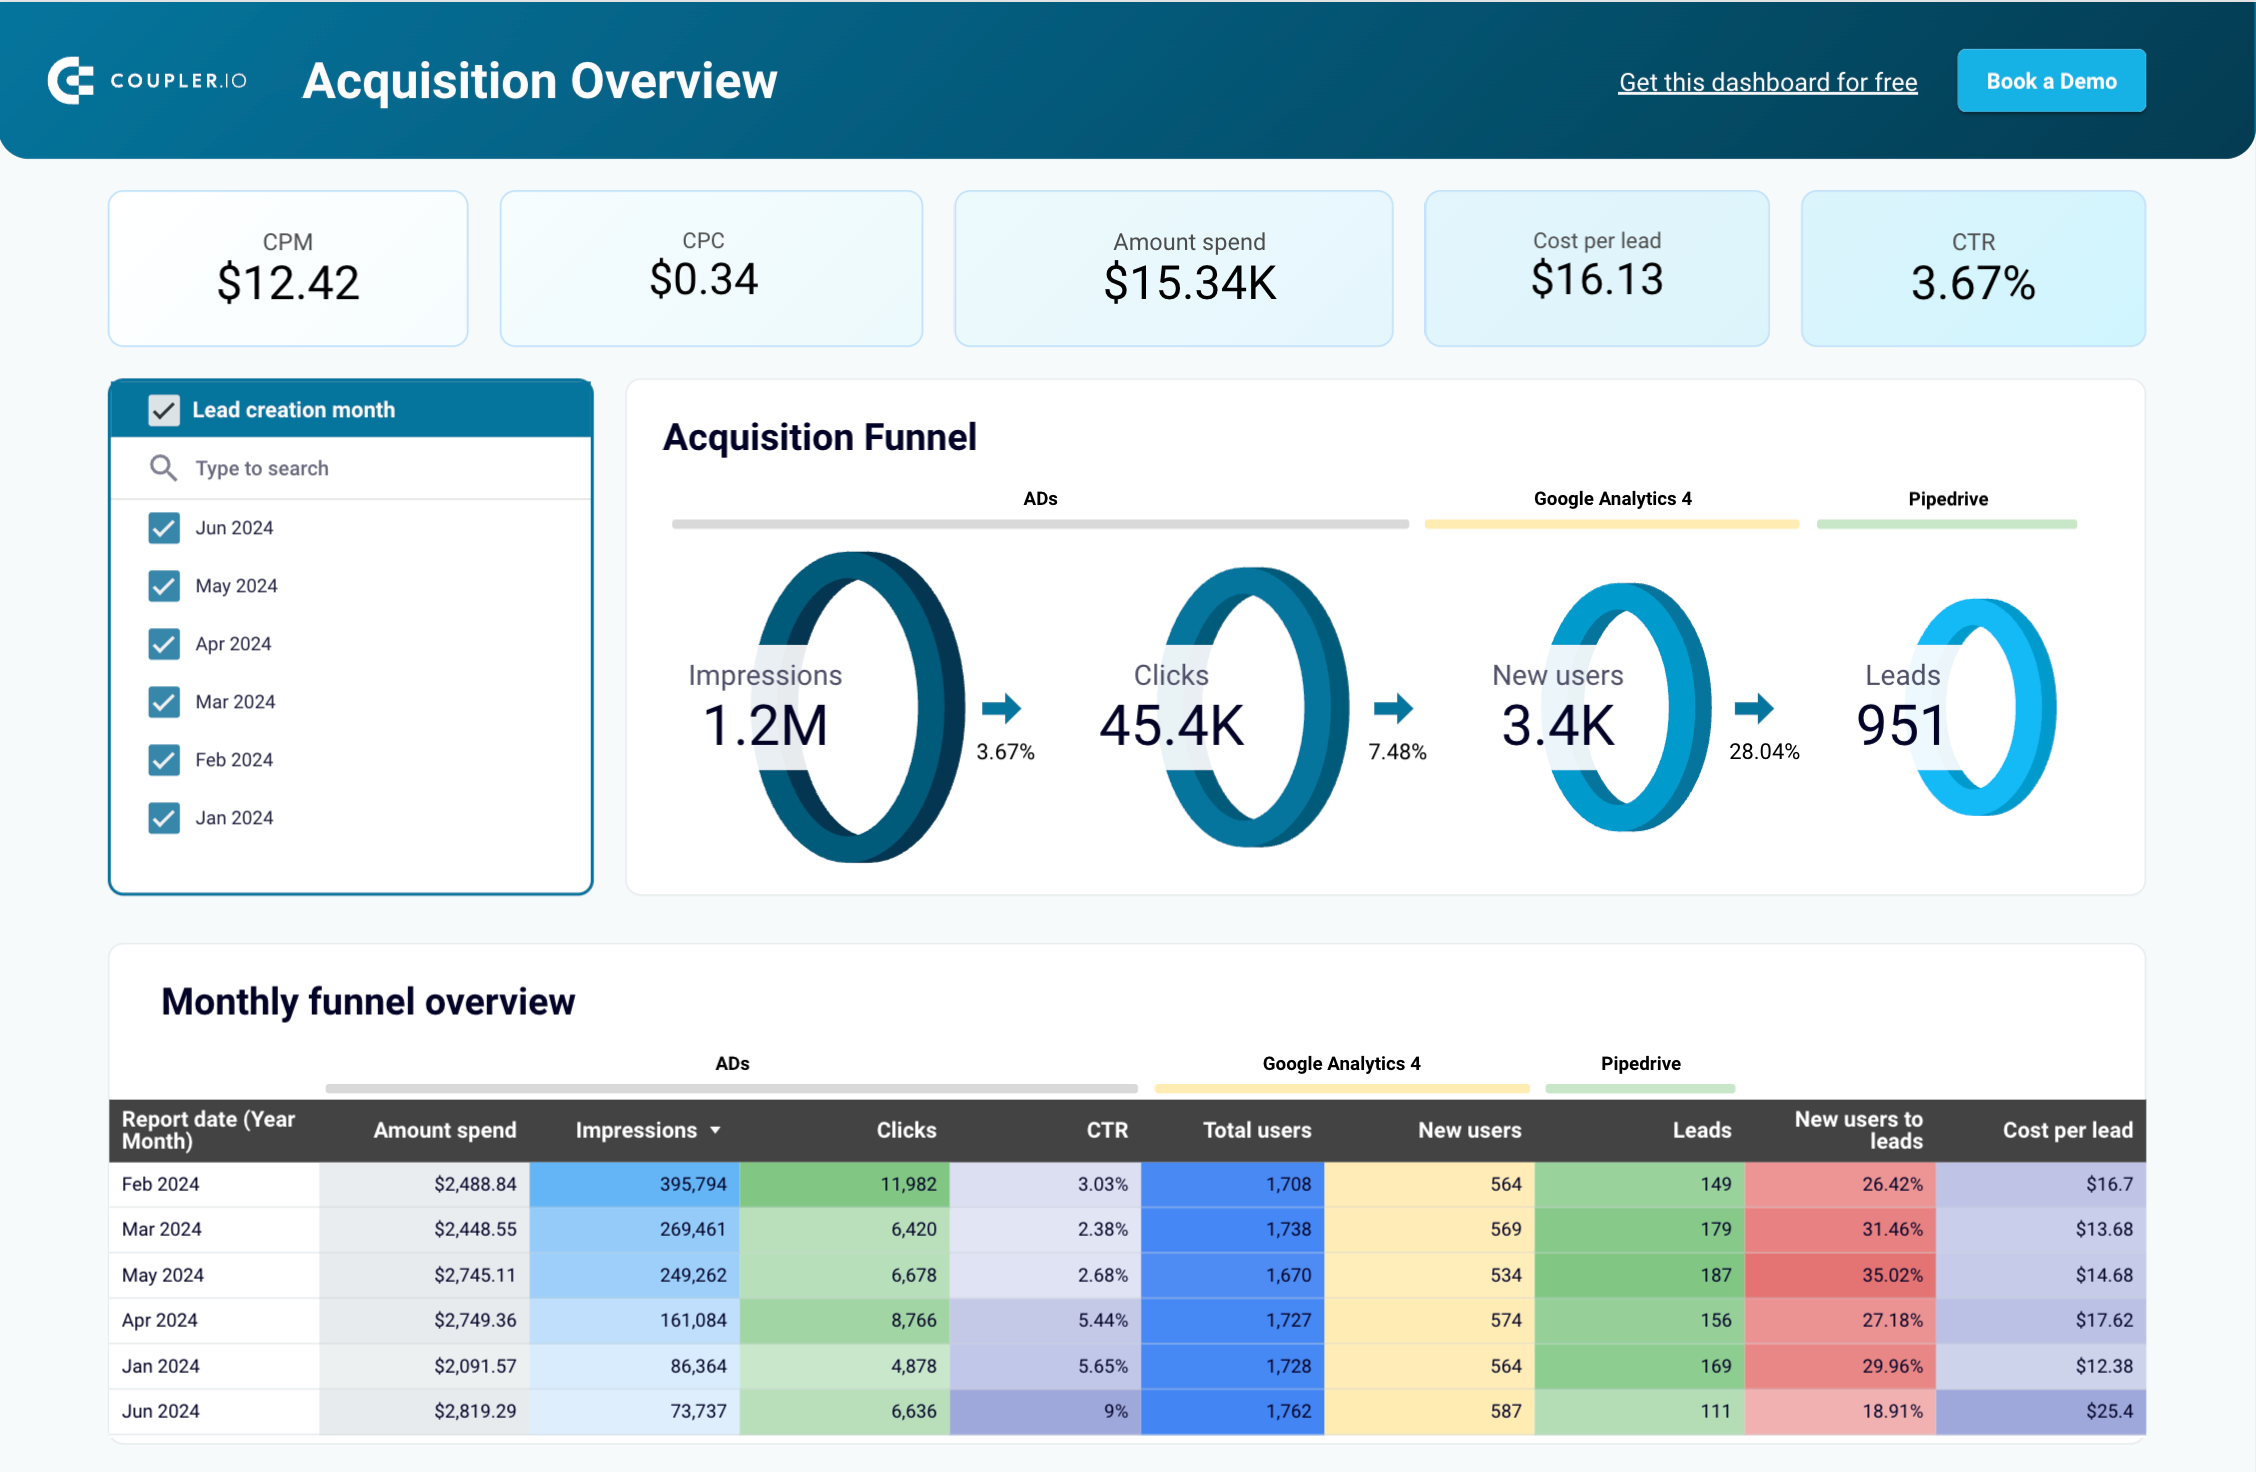
- Multi-source funnel analysis. Track your entire acquisition funnel from impressions to conversions. Quickly pinpoint the stages where most leads drop off and develop strategies to optimize ad targeting, landing page experience, or lead qualification processes.
- Compare conversion rates at different funnel stages against industry benchmarks. Analyze the geo funnel to discover which regions deliver the best ROI in terms of ad spend and conversions.
- Advertising spend vs. conversion efficiency. Compare ad spend against conversions to assess its efficiency across different platforms. Use this information to optimize budget allocation and adapt targeting strategies.
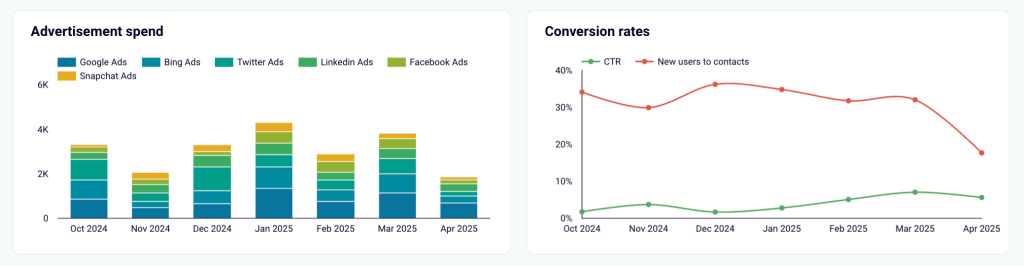
- Detect performance fluctuations over time and correlate them with marketing activities. Use historical trends to forecast future sales based on marketing investments.
A version of this template is also available for Pipedrive. To get a free copy of either one, sign up for Coupler.io and sync your CRM data in minutes.
Customer acquistion dashboard for Pipedrive
Use one dashboard to analyze the effectiveness of your Pipedrive acquisition funnel. Gain insights from data sourced from ad platforms and Google Analytics 4.

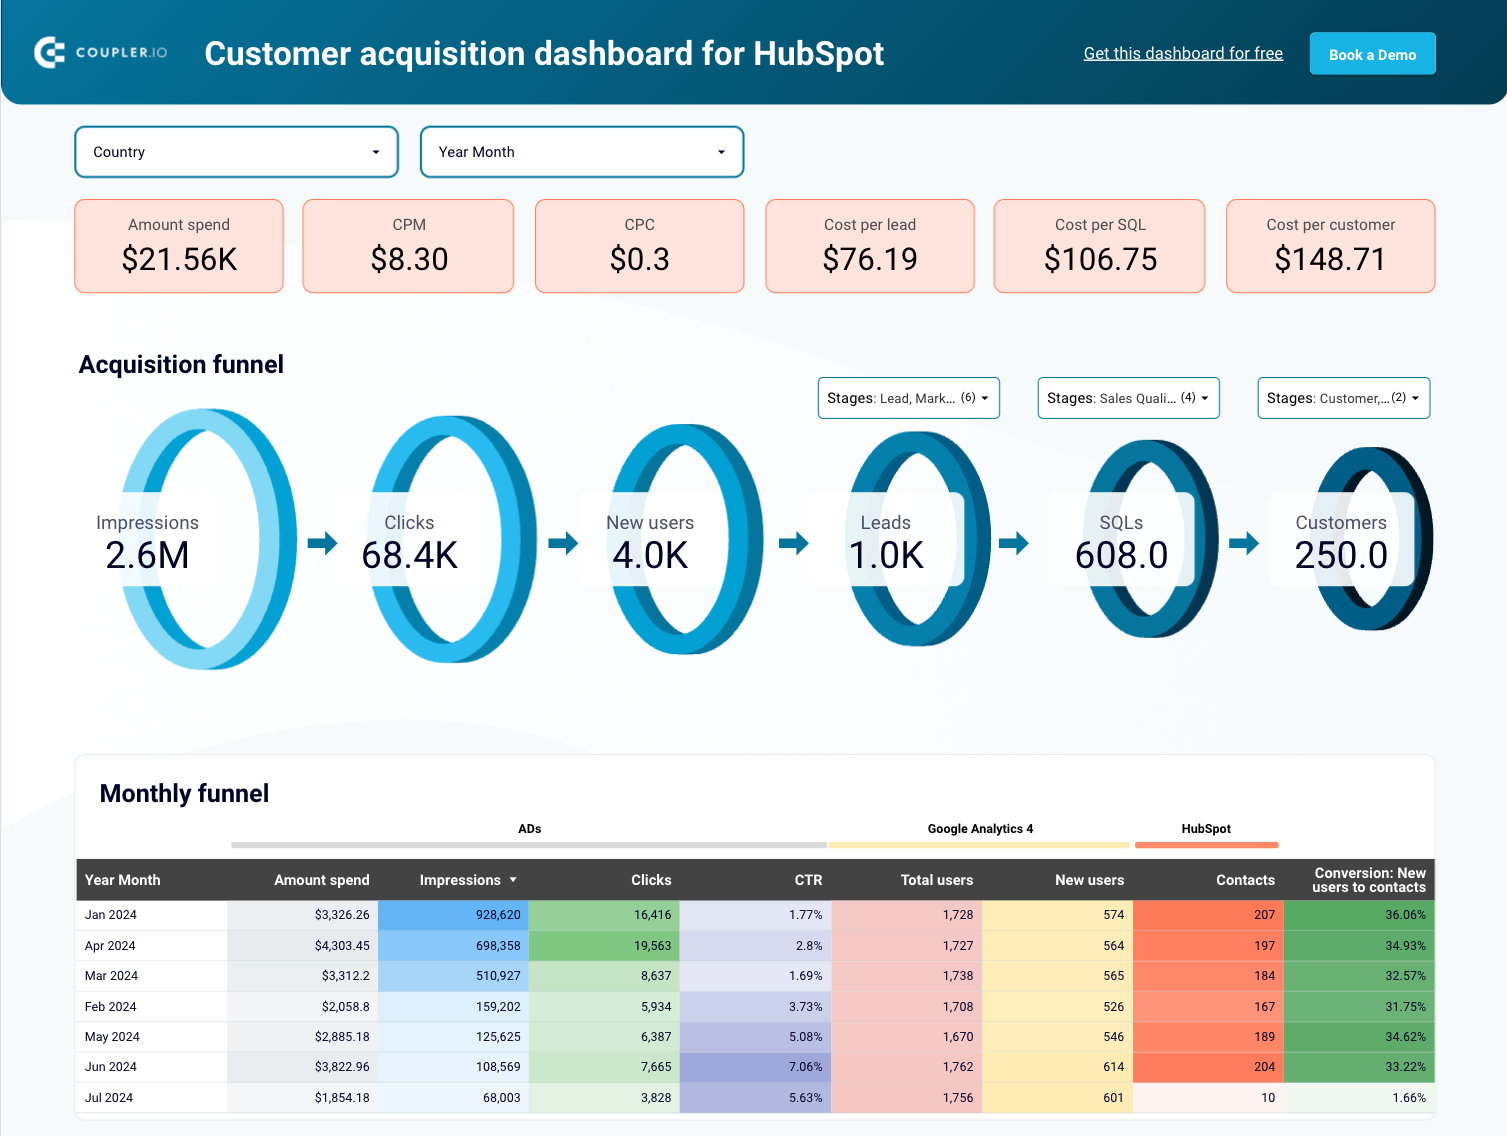
Customer acquisition dashboard for HubSpot
Monitor your acquisition funnel and analyze its effectiveness using the insights from HubSpot CRM, advertising platforms, and Google Analytics 4.

As client preferences and reporting technology evolve, automation has never been so important for agencies. No, it’s not a silver bullet, but it’s a proven way to save time and keep clients happy. Ready to get started with automated reporting? Sign up for free and explore templates or custom solutions with Coupler.io.
Automate marketing agency reporting with Coupler.io
Get started for free


