
Data is king. However, true power lies in processing and analyzing the data to generate insights that ultimately lead to better decisions on future strategies.
This blog post explains what marketing data analytics is, its challenges, steps, and tools. We’ll also explore how it works and how to use it to improve your business results.
How can data analytics improve marketing strategy?
What gets measured, gets improved.
This principle holds true for marketing data analytics too. It helps businesses analyze huge amounts of data and come up with insights that can make marketing strategies more effective, targeted, and responsive.
Now, let’s see how data analytics actually helps in improving your marketing strategy.
- Increases conversion rates with personalization: Most marketing campaigns aim to boost conversions. One way to do this is by creating personalized content that aligns closely with the target audience’s interests. 90% of professional marketers attributed personalized marketing to greater business profits.
Using customer data, marketing analytics comes with unique insights about preferences, behaviors, and buying habits. For example, if a customer searches for a moisturizer and then immediately sees an ad for one, the likelihood of making a purchase significantly increases.
- Increased marketing productivity: By leveraging data analytics in marketing, businesses can streamline their marketing processes and make them more efficient. Analytics tools can automate the collection and analysis of data, freeing up marketing teams to focus on strategy and creative tasks rather than manual data handling.
For example, Clarityseed, a digital data-driven marketing agency used Coupler.io to automate their data integration and reporting. Now, they save 40 valuable hours every month on marketing reporting.
- Improved customer retention: Research shows that a 5% increase in customer retention rates can boost profits from 25% to 95%. Data analytics helps in recognizing what drives customer loyalty and identifying potential churn risks. By analyzing customer interactions, feedback, and purchase history, you can identify areas of improvement in your products, services, and the overall customer experience. Ultimately, data analytics increases profits by improving customer retention.
- ROI measurement: One of the key advantages of data analytics is to accurately measure the return on investment (ROI) of marketing campaigns. By tracking metrics such as click-through rates, conversion rates, and customer acquisition costs, businesses can clearly understand which marketing efforts are paying off.
How to use data analytics in marketing
Even though marketing analytics sounds complicated, it has only 3 major steps to do with your data: collect, organize, and visualize. In this section, we’ll learn about these steps and show how you can implement them all with only one reporting automation solution – Coupler.io.
Step 1: Collect data
Collecting data from different sources can be a huge and time-consuming task for many businesses. And this is only the beginning since then you need to consolidate your data, compare it and perform other transformations. The most efficient approach you can go with is to automate this process with Coupler.io. It lets you collect data from your marketing sources, including website analytics tools, such as Google Analytics, CRM apps, marketing automation tools, and others.
You only need to choose the source and destination in the form below and click Proceed. You’ll need to create a Coupler.io account – you can start for free. If you do not have one, sign up for free.

This will create an importer to collect data from the chosen marketing source to the destination such as a spreadsheet, data warehouse, or BI tool.
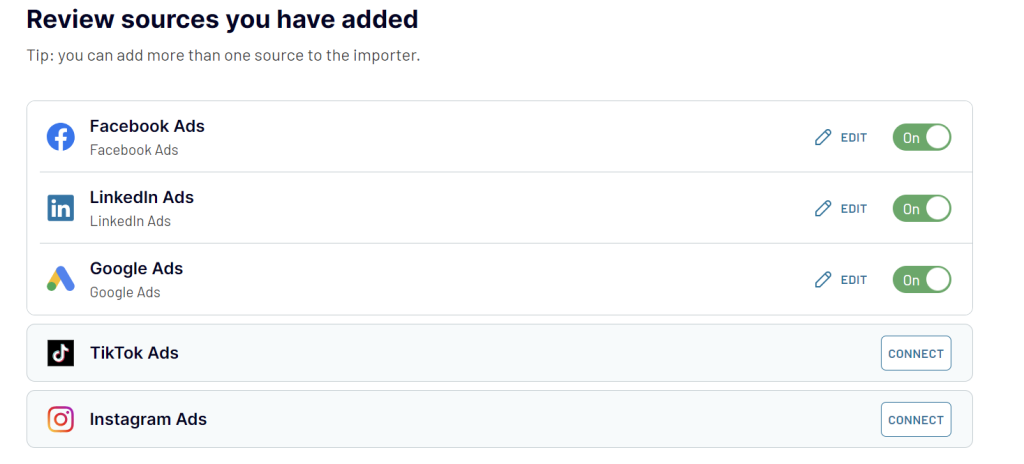
To collect data from multiple sources, you can either create separate importers for each marketing app or even combine data from multiple ones into a single report.

Coupler.io ready-to-use connectors are based on APIs. At the same time, it allows you to create custom integrations with sales and marketing APIs.
Step 2: Organize and transform data
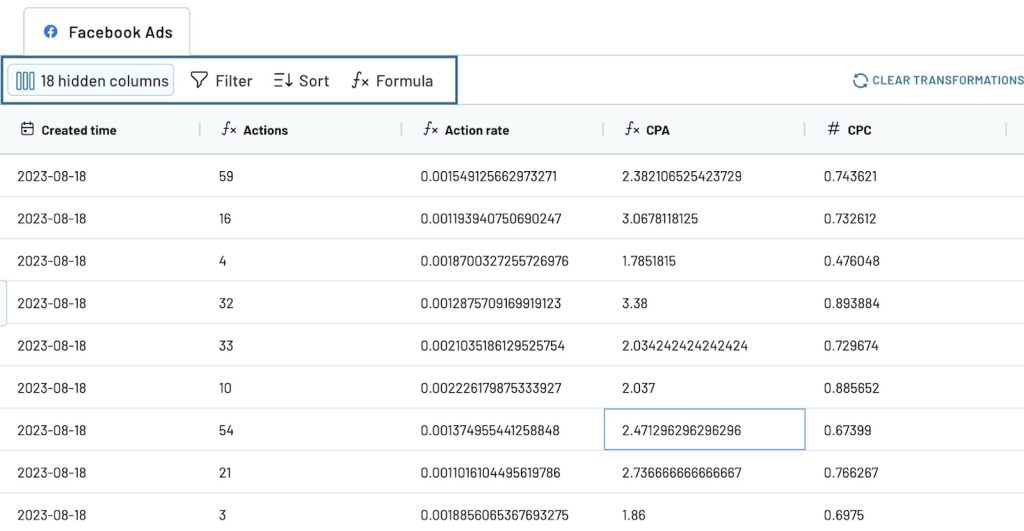
Once all your data is collected, you need to make it analysis-ready. This step may include different approaches to data preparation such as data cleansing, data transformation, and others. Here is how you can organize your marketing data in Coupler.io:
- Column management – hide unnecessary columns to have a clear data view
- Sort and filter – choose to sort and filter based on certain criteria
- Calculated columns – create new columns by adding calculations to the existing columns. For example, the Facebook Ads data has the total number of impressions and total clicks. Now you can create a new column for Clickthrough Rate (CTR)
CTR = Number of Clicks / Number of Impressions

Step 3: Load data and visualize
Now the analysis-ready data can be loaded to the destination where it will be presented in the form of a report. It can be a common spreadsheet report or a dashboard with visualized metrics to gain correlation and insight.
The dashboard that visualizes your marketing metrics provides a bird’s eye view into the health and performance of your marketing team. With the right charts and graphs, you can effectively communicate what is going well and the areas that need improvement. We’ll introduce you to a few dashboard examples in the next section.
It’s also essential to make your report or dashboard self-updating. For this, you can automate the data flow from your marketing apps. Coupler.io allows you to set up a data refresh schedule for your importer so that the data flows automatically to your reports as required.

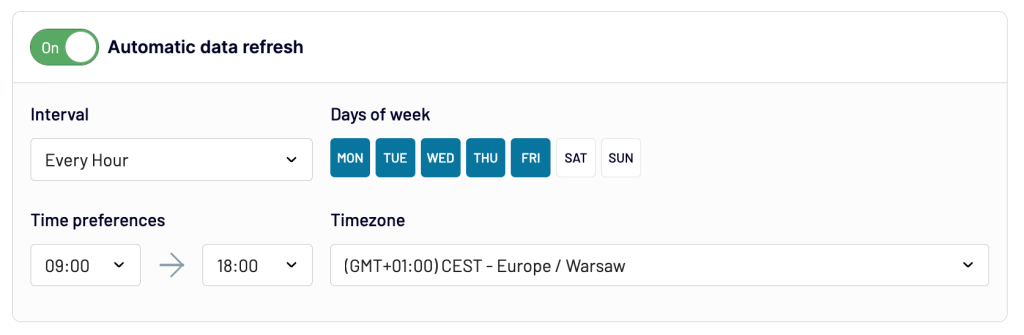
With fresh data in your marketing reports, you are always ready to make data-driven decisions.
Data Analytics in marketing – examples of dashboards and reports
Building a dashboard or report from scratch can be time-consuming. Using dashboard templates from Coupler.io can make it easy to create a custom dashboard as per your requirements.
To analyze the overall marketing data, you need to track data from different marketing channels like Google Ads, Facebook Ads, GA4, Google Search Console, and more. You can use different dashboards for each marketing source or a comprehensive PPC dashboard to dig deep into the marketing data.
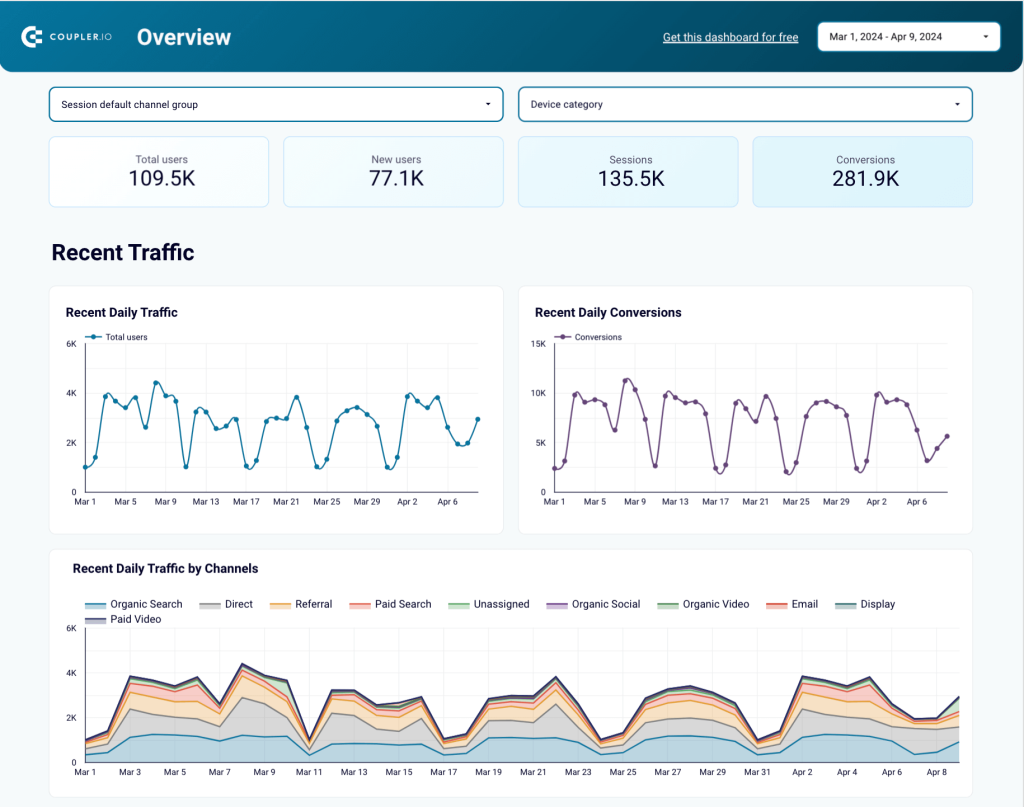
Web analytics dashboard template
The web analytics dashboard provides a clear view of how visitors interact with your website, including their demographics and behavior, for a better understanding and optimization of marketing strategies. It simplifies tracking key metrics and analyzing conversion rates, which helps in identifying areas for improvement. This dashboard gives you insights to turn visitors into customers more effectively.

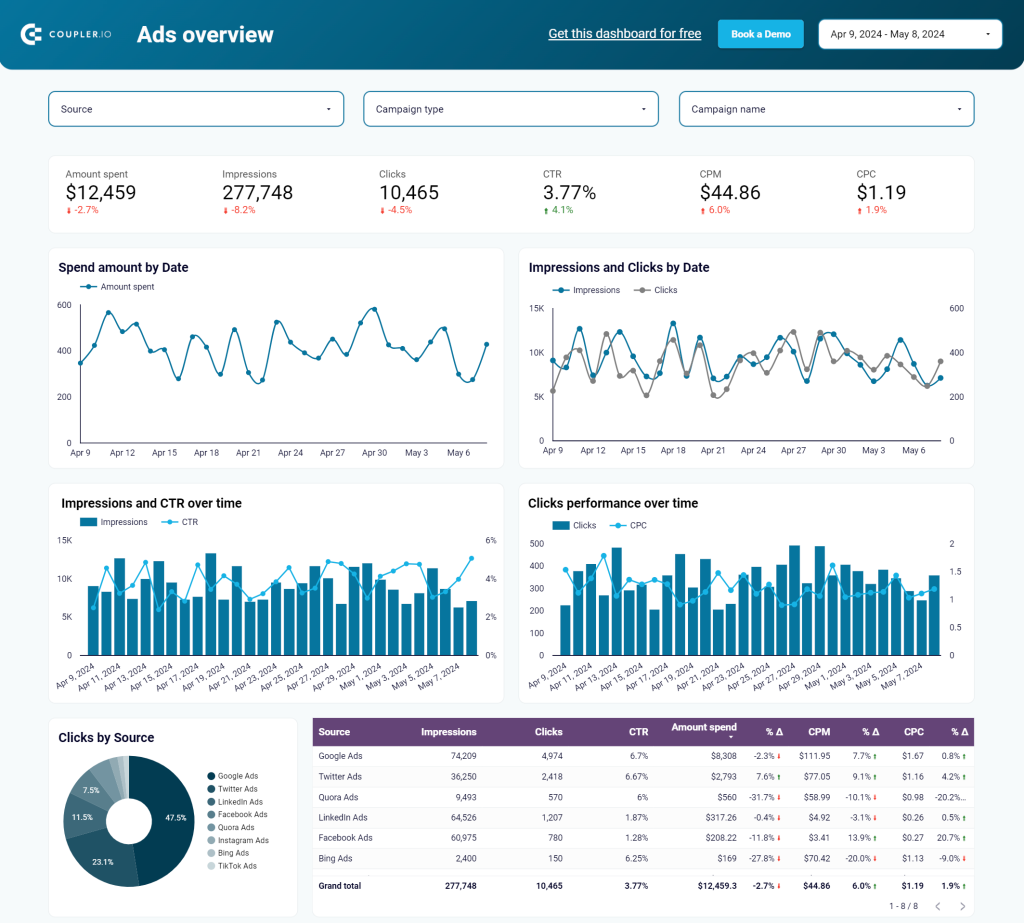
Google Ads dashboard template
It tracks key performance indicators and ensures ad spending stays within budget. The Google Ads dashboard aids in maximizing campaign effectiveness and conversion metrics. It also helps you identify the most profitable campaigns for smarter budget allocation, making it a valuable analytics dashboard for efficient ad management.

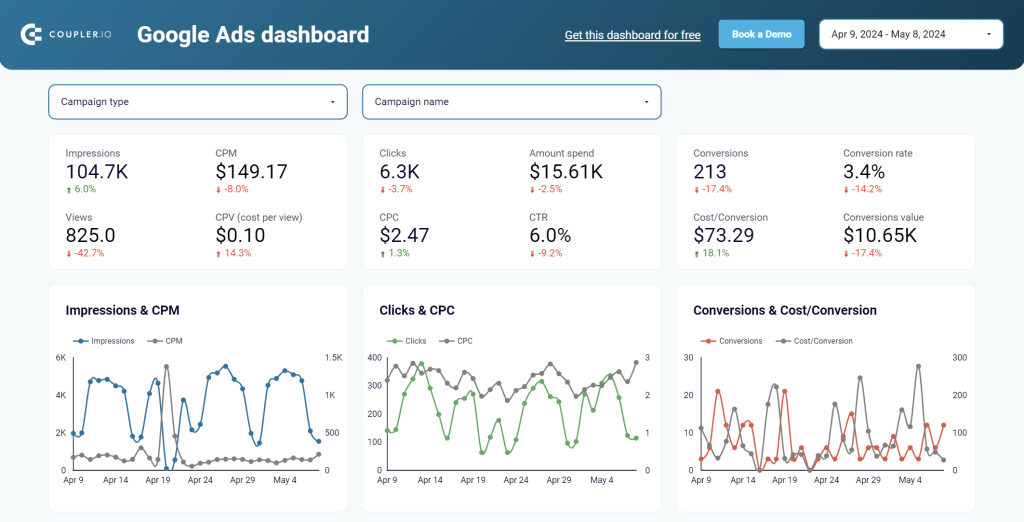
The dashboard template is available for Looker Studio and Power BI.
Facebook Ads dashboard template
The Facebook Ads Dashboard focuses on in-depth analysis of individual campaigns to reveal their strengths and weaknesses. By closely monitoring key performance indicators, it offers insights about how each ad resonates with the audience. With the dashboard, you can fine-tune ad strategies for cost-efficiency, and ensure that your budget is spent on high-performing ads.

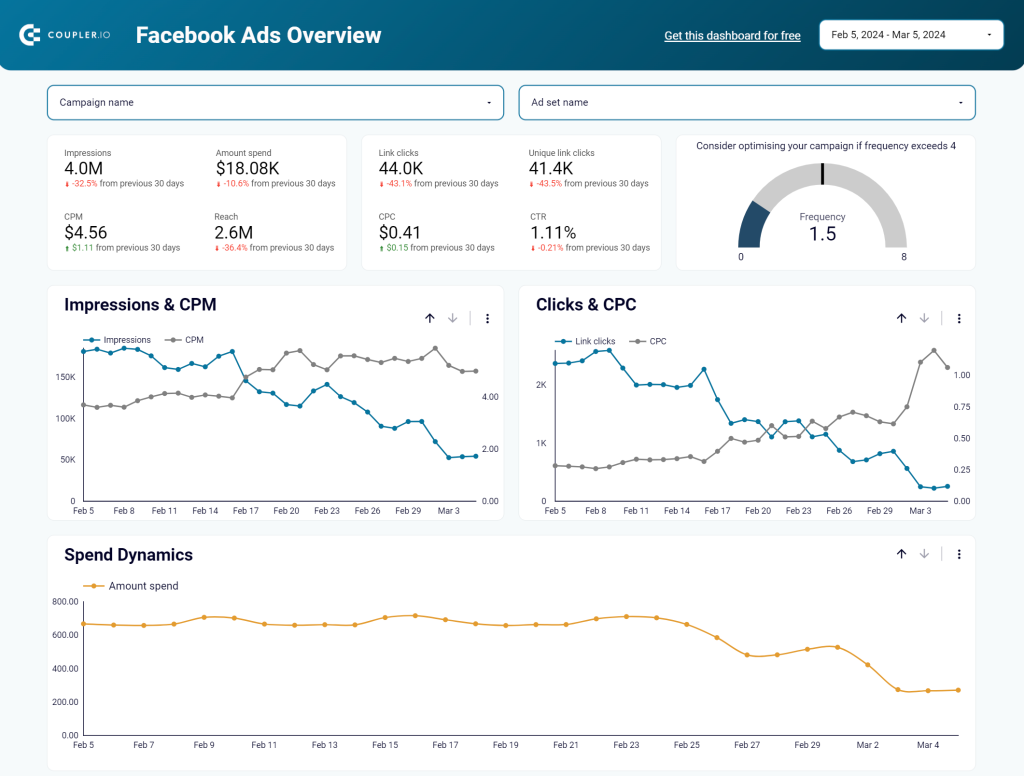
The dashboard template is available for Looker Studio and Power BI.
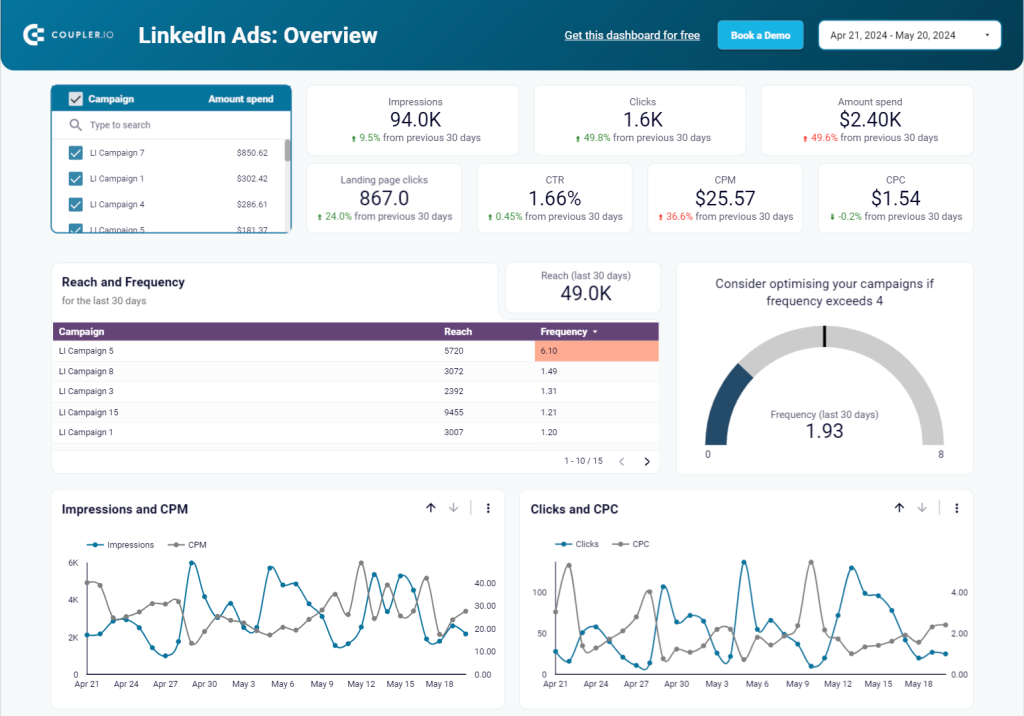
LinkedIn Ads dashboard template
The LinkedIn Ads Dashboard makes managing LinkedIn campaigns easier. It shows how well your ads connect with a professional audience, focusing on B2B effectiveness. You can see which ads are getting clicks, generating leads, and engaging the right professionals. It’s great for tweaking your targeting to reach decision-makers. This tool helps you make the most of LinkedIn’s network – for more details, see our article on LinkedIn Ads analytics.

PPC multi-channel dashboard template
An individual dashboard will help you perform an in-depth analysis of each PPC channel. But if you need a holistic view of the performance of all your digital ads in one place, then the PPC multi-channel dashboard is the right one for you.
Here you can compare the key metrics like CTR, CPC, Impressions, and more for different advertising platforms.

The PPC multichannel marketing dashboard is available for different reporting platforms:


PPC multichannel dashboard in Google Sheets
Use a PPC dashboard designed for Google Sheets to track the performance of your campaigns across multiple advertising platforms.


PPC multichannel dashboard in Looker Studio
Get a comprehensive PPC reporting tool to track the performance of your campaigns launched at multiple advertising platforms.

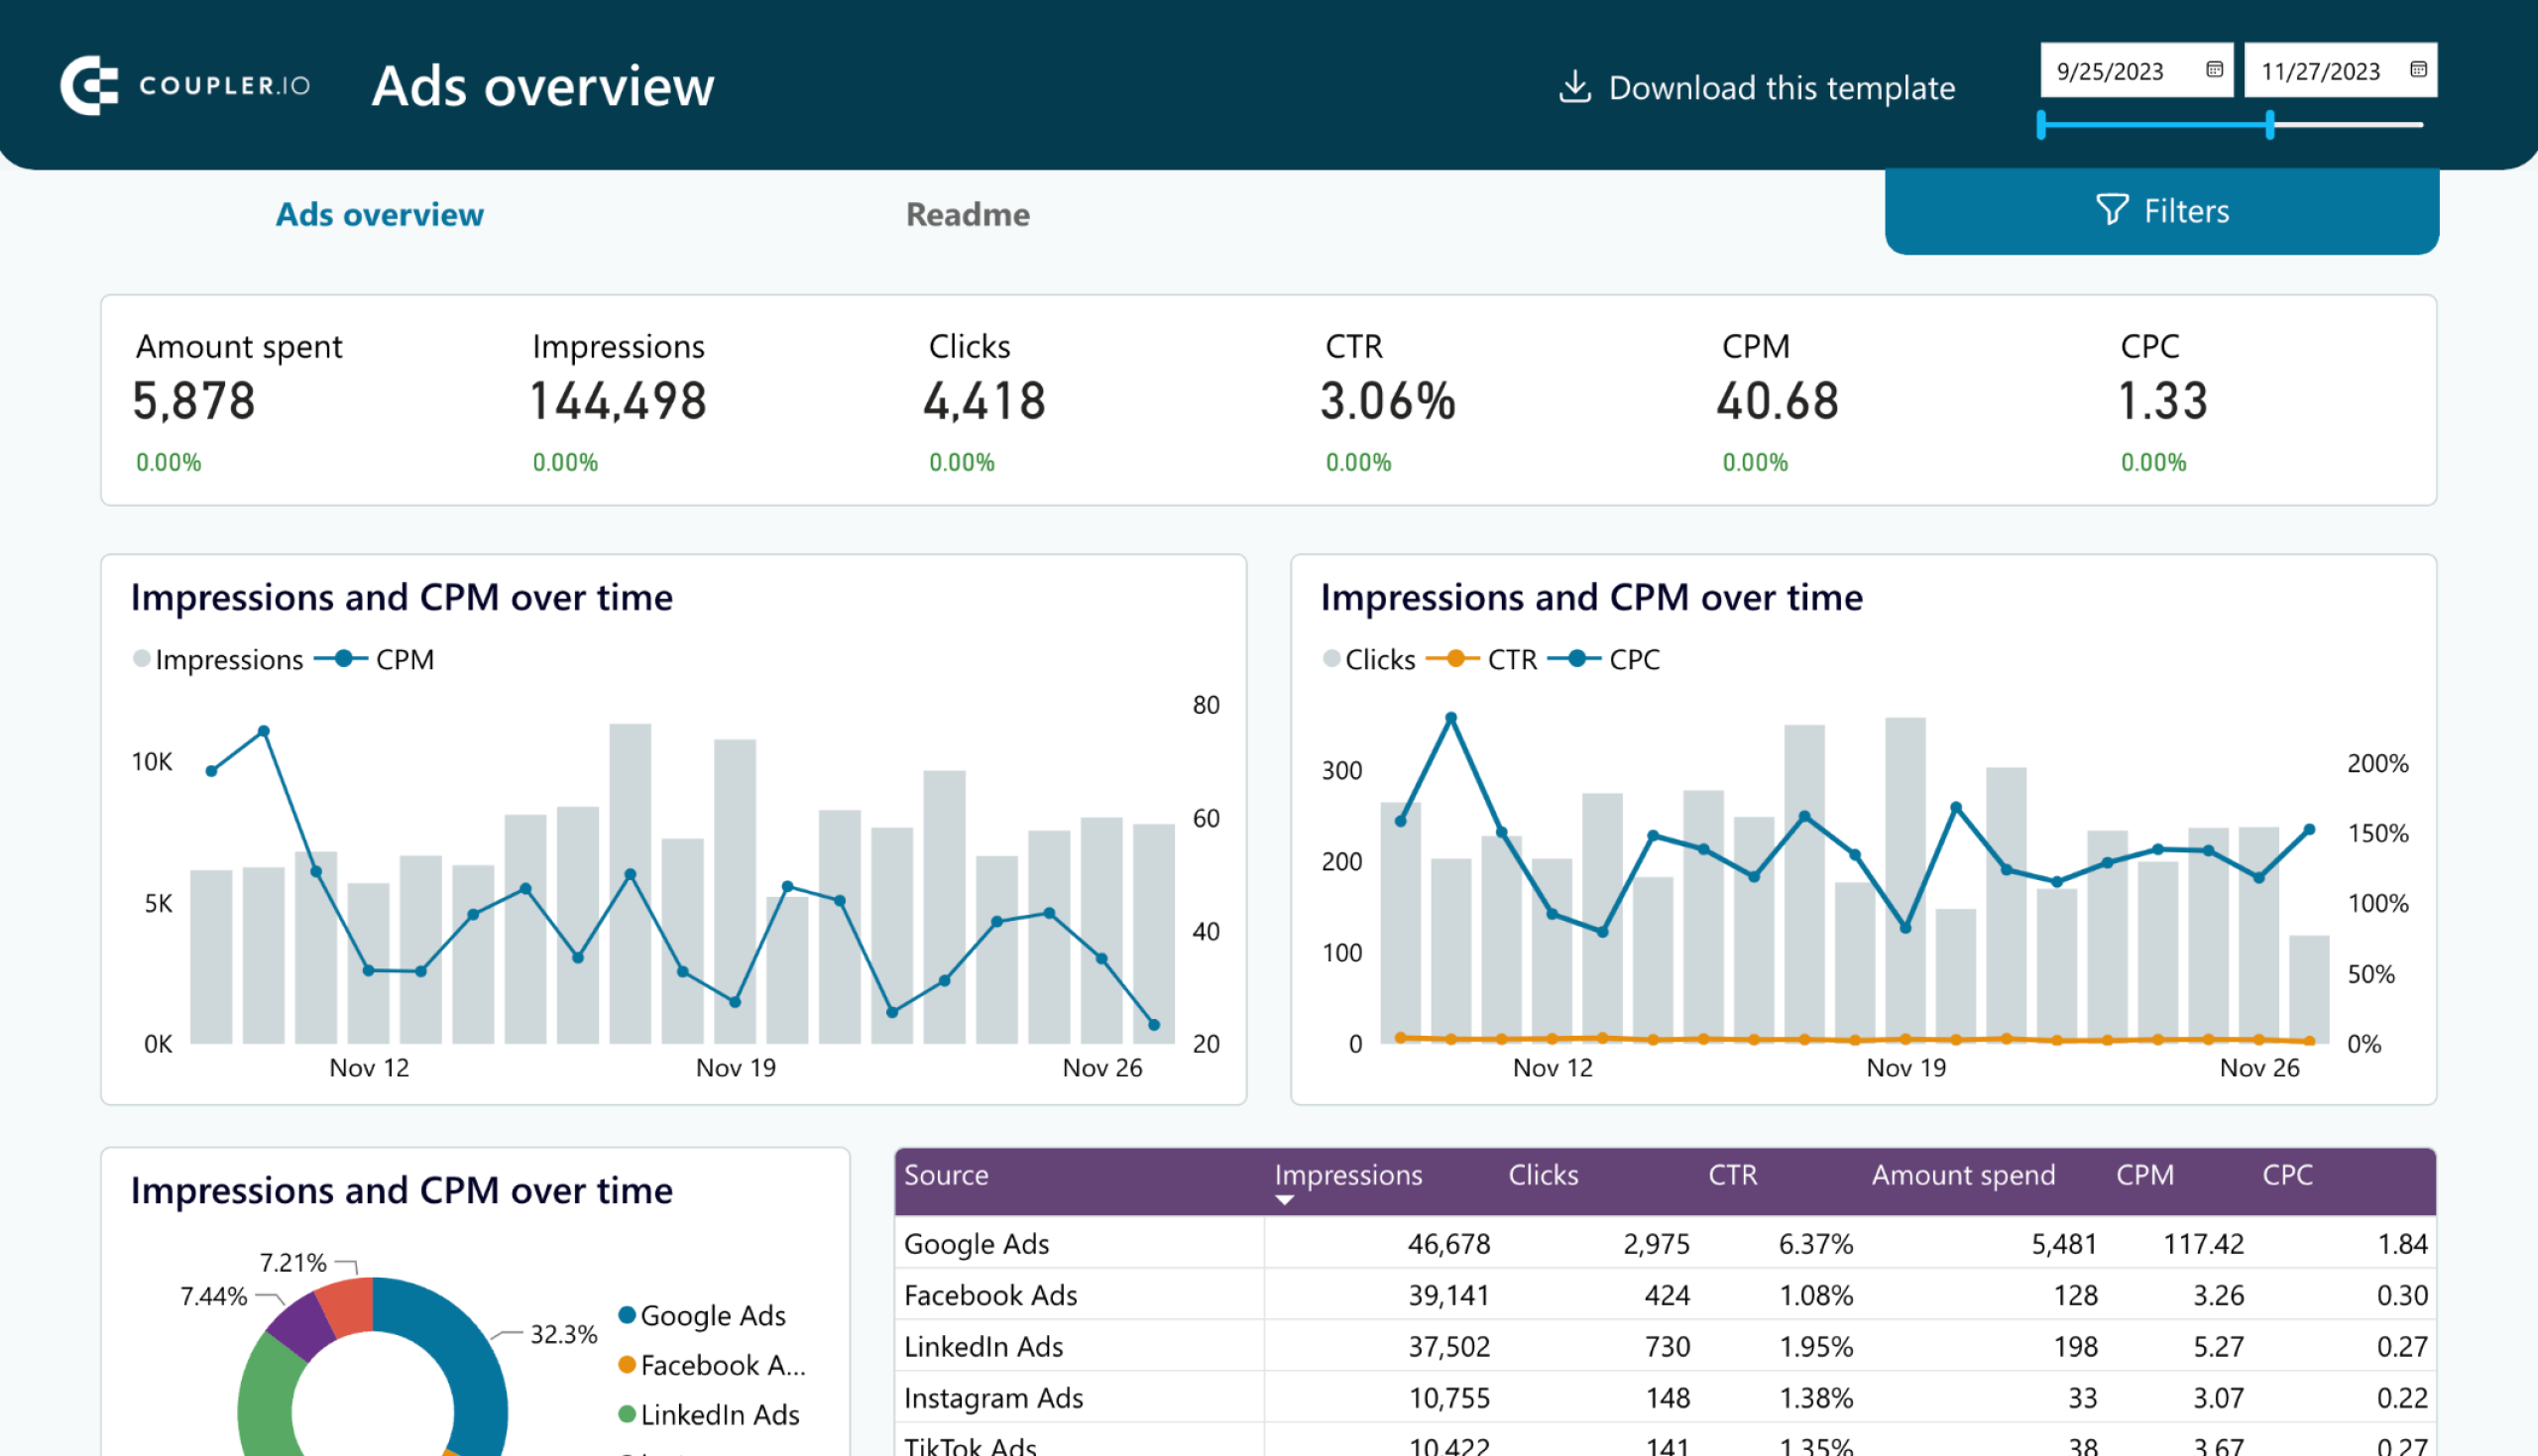
PPC multichannel dashboard in Power BI
Use a Power BI PPC dashboard for tracking and analyzing your advertising campaigns across multiple platforms.


PPC multichannel dashboard in Tableau
Track and analyze the performance of your advertising campaigns across various platforms using a one-stop PPC dashboard in Tableau
Advertising budget forecast dashboard template
This dashboard provides deeper insights into the health of your PPC channel. It has 4 pages, each of which focus on a different aspect of advertising spending and performance.
For instance, there is a full-page overview of key metric dynamics including impressions, clicks, CPC, amount spent, and more. You can compare planned spending to actual spending, dive into the granular performance of each campaign, and uncover engagement and budgeting predictions for the next 12 months. It’s useful for shaping PPC marketing plans and making spending decisions on the go.

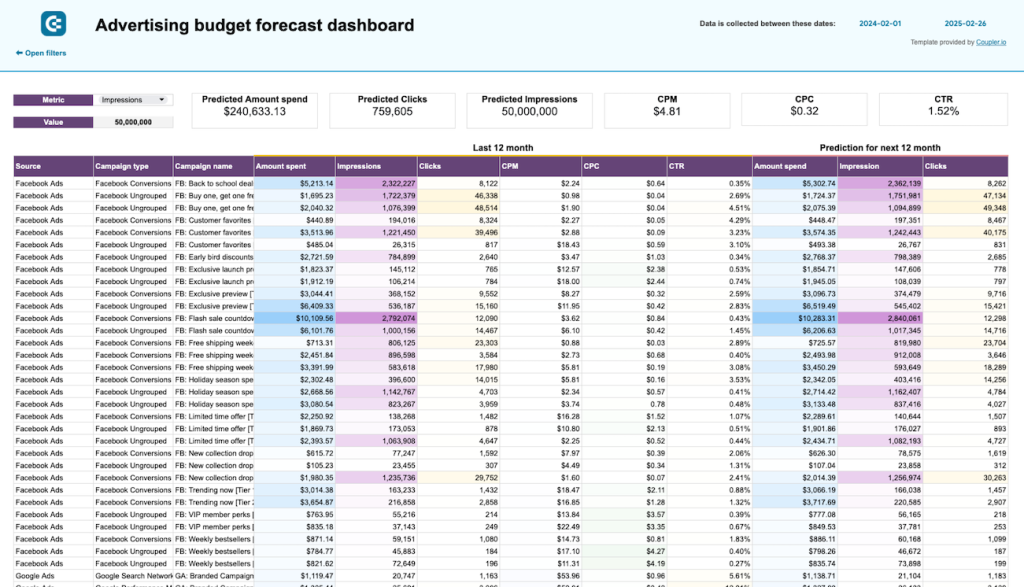
The dashboard template is available for free in Google Sheets with a Coupler.io account.
YouTube dashboard template
The YouTube Ads dashboard tracks the performance of your YouTube campaigns. It gives you a clear picture of which ads are catching viewers’ attention and driving engagement. With this, you can easily see views, click-through rates, and audience reactions. It’s perfect for adjusting your strategies to make sure your ads connect with viewers effectively. This tool helps you use your budget wisely by focusing on the most impactful YouTube ads.
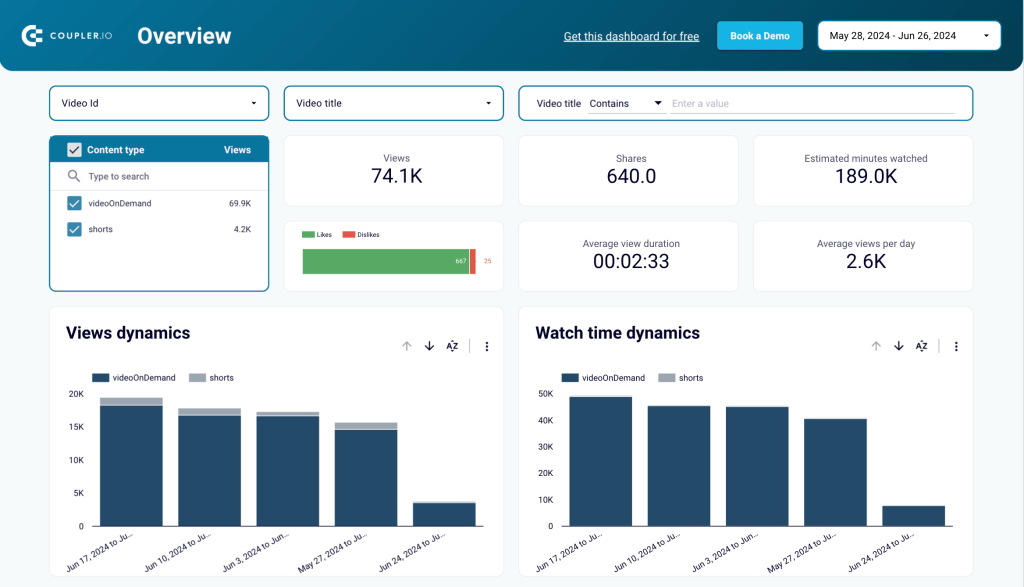
Learn about advertising funnels and how to create one for analysis.
SEO dashboard template
The SEO dashboard efficiently tracks your website’s search engine performance. It monitors click dynamics, top-performing pages, and device-specific performance, including CTR. You’ll also see pages that aren’t doing well, helping you pinpoint areas for improvement. The dashboard keeps an eye on your average position and impression trends, and highlights your top 10 pages by clicks or impressions. This tool is vital for fine-tuning your SEO efforts and boosting your site’s visibility.

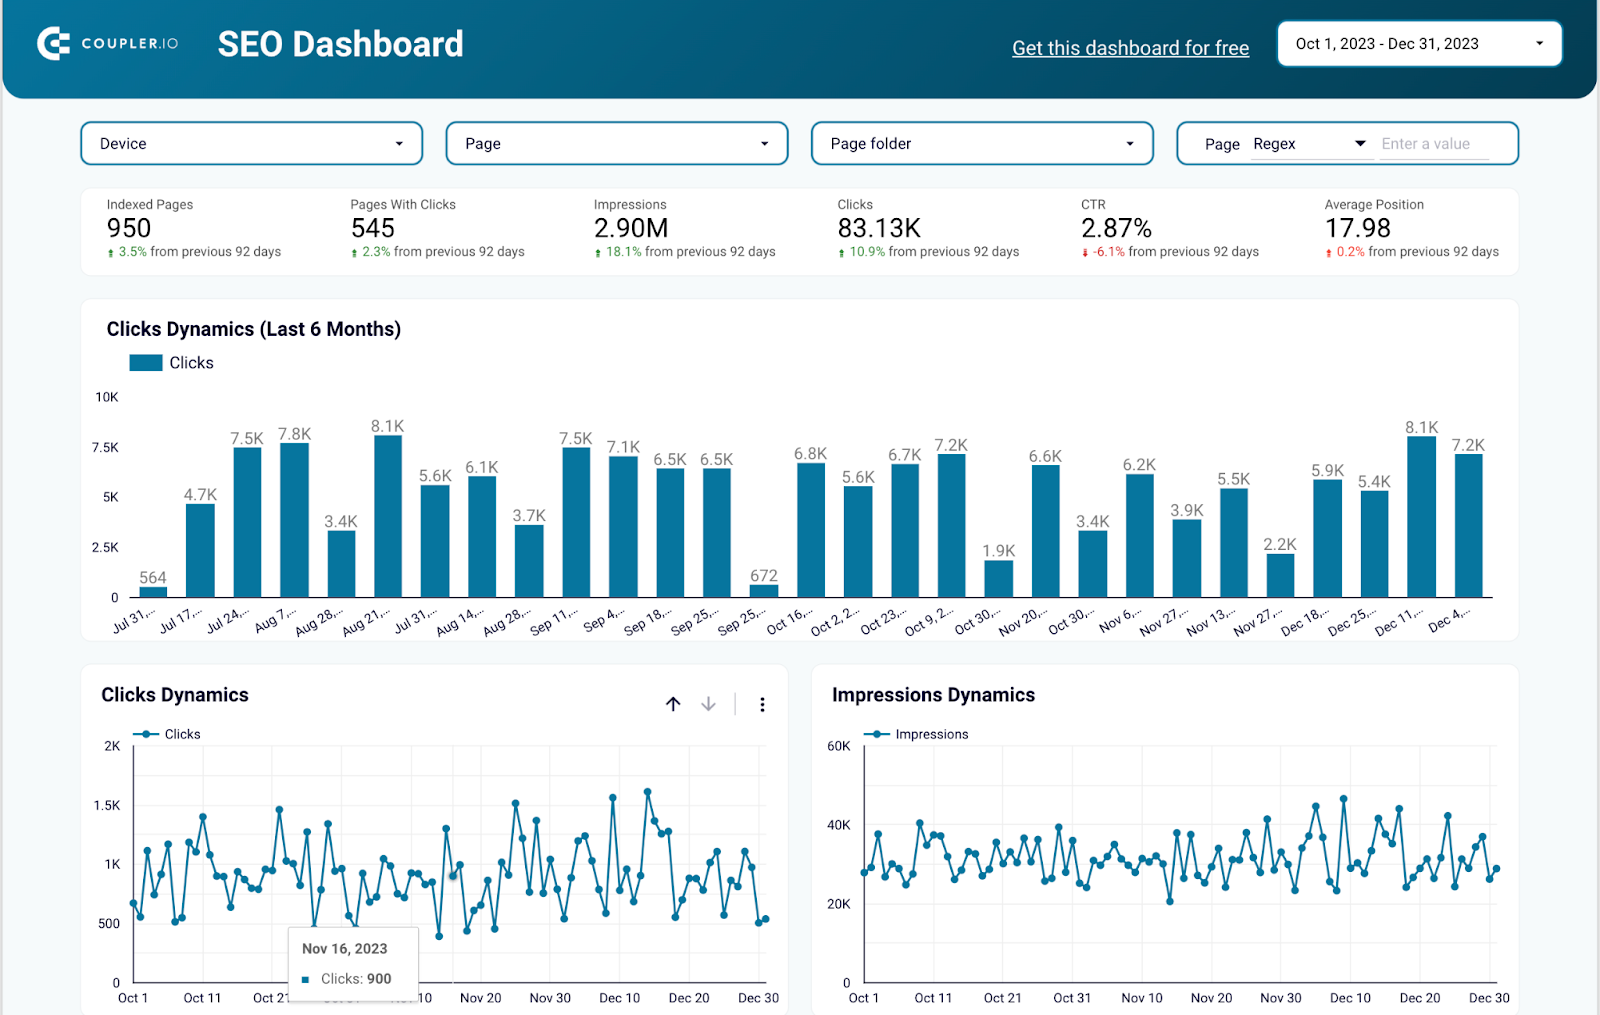
The dashboard template is available for Looker Studio and Power BI.
Alternatively, you can also get help from Coupler.io’s data analytics experts to streamline your analytics process to analyze your marketing data better.
Check our article on 12 best marketing reporting templates to learn what else you can do to streamline your marketing analytics. You can also learn how to leverage first-party data for campaign optimization.
Tools used in marketing data analytics
Marketing funnel analytics is a complex process. However, it can be made easier with the right tools and technology. They can make your life easier and more efficient including:
- Better understand your data
- Automate tasks
- Segment and target your audience
- Provide real-time and more accurate insights
- Enhance collaboration
Now, let’s take a look at a few of the most popular (and useful) marketing analytics tools. We have broken them down into categories for you:
- Website analytics tools
- You can use web analytics tools to capture and track a variety of website metrics, such as total page views, unique visitors, and time on site.
- Some popular web analytics tools are Google Analytics, Adobe Analytics, and Mixpanel.
- Business Intelligence (BI) and data visualization tools
- BI tools help you extract raw data from multiple data sources, transform it, and load it to a destination. The destination is often in the form of a dashboard or other data visualizations.
- Visual data representations (charts and graphs) are used to gain insights.
- BI tools typically include data visualization tools. Some of the popular ones are Tableau, Microsoft Power BI, Looker Studio, Oracle Business Intelligence, and SAP Business Objects.
- Cohort analysis tools
- The goal of Cohort analysis is to see how metrics change over time. The result can be used for better customer retention and precise lifetime value estimates.
- Tools used for Cohort analysis include BI tools mentioned above, KISSmetrics, Heap, and others.
- Social media analytics tools
- Tools that fall into this category can be used to track a variety of social media metrics, including engagement, reach, and impressions.
- Some of the most popular social media analytics tools include Sprout Social and Hootsuite.
- Marketing automation tools
- Marketing automation software helps companies automate and measure marketing tasks and workflows.
- Their common features include lead management, email marketing, campaign management, and analytics.
- Marketing automation tool examples: HubSpot, Marketo, Pardot, AWeber, and MailChimp.
- Search Engine Optimization (SEO) tools
- There are a variety of SEO tools that help marketers improve their website’s ranking in search engine results pages (SERPs).
- Some common ones include keyword research tools and link-building tools.
- Popular SEO tool examples: Ahrefs, SEMRush, Google Search Console, and Moz.
- Marketing attribution tools
- Marketing attribution software collects data on how your audience interacts with your brand and organizes it to reveal the effectiveness of your marketing materials.
- Examples include Amplitude and Twilio Segment.
Check our guide on PPC vs SEO.
The list above is just the iceberg when it comes to cross-channel marketing analytics. How can you choose the right tools? Well, you should start by first knowing what you want from the tools. Then, do some research on the potential options and compare their features, at the same time prioritizing ease of use. Lastly, review them against price points as well, and then you should be in a position to make the right decision for you.
The challenges of marketing data analysis
Creating an analytics process that measures and tracks meaningful things is sometimes complicated for most companies. The challenges to building an effective analytics process are broad in scope. Let’s take a look at some of the significant challenges below.
- The volume and variety of marketing data.
The modern marketing landscape is diverse and complex. Most channels are digital, and campaigns produce content people consume across many devices. While this sheer volume of data is good, marketers find themselves overwhelmed in a data overload situation.
- Lack of resources.
Another common challenge is that businesses need more resources to utilize data analytics properly. Staffing up employees who are trained in analytics will take priority. In addition, marketing data analytics requires time and money, but many businesses do not have the budget or staff to dedicate to data analytics, which can limit its usefulness.
- Lack of knowledge and skills.
Many marketing organizations need more skills to use data analytics effectively. Marketing data analytics requires a specific set of skills, including statistical analysis, data visualization, and technical skills. Understanding the customers and products well is also important. These skills and knowledge are necessary to make sense of the data and glean actionable insights.
- Difficult to identify and track meaningful analytics.
This is one of the toughest challenges for marketers. The metric identification process usually begins with looking at whatever metrics are available or just following existing marketing processes. Instead, it must start with understanding the strategic objectives marketing is pursuing.
Marketers often find themselves juggling different sets of data, blending and calculating numbers to arrive at something that truly indicates how a process is performing. There is usually no easy, direct path to getting the best metrics for an analytics process. Except if you use interactive dashboard templates to create custom marketing reports in minutes. The latter can greatly simplify this task, whether it’s preparing a weekly performance report or building a comprehensive CMO dashboard.
Despite all these challenges, if the data is tracked, analyzed, and visualized in the right way, marketing data analytics can help you improve your overall marketing strategy.
FAQ on marketing analytics
What is marketing data analytics?
Marketing data analytics involves analyzing and interpreting data from marketing campaigns to understand their effectiveness. It helps in identifying what strategies are working and which aren’t. Without this analysis, you’re essentially guessing about the success of your efforts. Analytics provide concrete evidence of performance, making your marketing more efficient and targeted. While some organizations may succeed without it, they often can’t pinpoint why. Analytics take luck out of the equation, offering insights into successes and failures, and guiding better decision-making for future campaigns.
Learn more about the difference between marketing vs. sales funnel.
What is the role of data analytics in marketing?
Data analytics in marketing plays a crucial role in understanding customer behavior, preferences, and trends. It helps in making informed decisions by analyzing customer data, market trends, and campaign performance. By leveraging analytics, marketers can tailor their strategies to better target their audience, optimize marketing spend, and enhance the overall effectiveness of their campaigns. Analytics also enable businesses to predict future trends, measure the ROI of marketing activities, and continuously improve their marketing tactics based on real-time data insights. In short, data analytics is essential for creating more personalized, efficient, and successful marketing strategies.
What is the importance of data analytics in marketing?
Data-driven marketing is one of the key marketing trends. Therefore, analytics in marketing is crucial for driving smarter, data-driven decisions. It offers insights into how products are used, helping to tailor them more closely to customer needs. Analyzing customer trends and preferences enables more effective segmentation and personalization of marketing campaigns. It also improves customer support by identifying common issues. By understanding the impact of different messages and media, marketers can optimize their communications. Analytics also provide a competitive edge by monitoring market trends and competitor strategies. Predictive analytics help forecast future market behaviors, leading to more efficient budget allocation and higher chances of capturing new customers.
Read more about predictive analytics in this separate article on marketing forecasting.
What are the benefits of data analytics in marketing?
Data analytics is becoming increasingly important in today’s business world. Here are some reasons why:
- Enhanced Customer Insights: Gains a deeper understanding of customer behavior and preferences.
- Optimized Marketing Strategies: Improves campaign targeting and effectiveness.
- Increased ROI: Helps allocate resources more efficiently, maximizing returns.
- Competitive Advantage: Provides insights into market trends and competitor strategies.
How to analyze marketing data?
Analyzing marketing data can be simplified into three key steps:
- Collect data: Gather data from various marketing sources, using platforms like Coupler.io to consolidate it in one place. For example, you can collect data from GA4 to track and analyze AI traffic.
- Organize and transform data: Clean and organize this data, managing columns and creating calculated metrics like Clickthrough Rate (CTR).
- Visualize and automate reporting: Use BI tools like Looker Studio or Google Sheets to visualize the data. Automate the data refresh for up-to-date reporting, aiding in timely, data-driven decisions.
How to interpret marketing data insights?
Interpreting marketing data insights involves a few key steps:
- Clarify Goals: Start by aligning your analysis with specific marketing objectives.
- Focus on Key Metrics: Zero in on relevant metrics that directly relate to your goals, such as engagement rates for brand awareness campaigns.
Learn more about brand marketing vs. performance marketing.
- Spot Trends and Patterns: Identify consistent behaviors or changes in data, like a spike in referral traffic.
- Decision Making: Use these insights to inform strategic decisions and refine marketing tactics.
- Continuous Monitoring: Regularly review data to stay adaptive and responsive to market changes.
Data analytics for marketing decisions – final words
Marketing data analytics is vital to making informed business decisions. By understanding what marketing data analytics is and how to use it, you can make better decisions that lead to increased revenue.
While there are challenges to collecting and analyzing marketing data, Coupler.io can help you easily overcome them. As it supports various marketing apps, it becomes easy to combine and transform data into a single report.
Automate marketing reporting with Coupler.io
Get started for free