A marketing funnel is a tool that helps turn views and clicks into actual product purchases. It helps a marketing team map the customer journey and provide the right materials for decision-makers at each step.
But it’s not enough just to have a funnel. Maintaining it takes work, and like any other funnel – sales, onboarding, SEO – it can easily spring a leak. However, with regular tracking and analysis, businesses can prevent those holes and bottlenecks from impacting their bottom line.
Before delving into the mechanics of analyzing and optimizing a funnel, it’s important to understand its structure. While most marketing funnels consist of 3-5 stages, the specific configuration may differ depending on the framework being used. The following are the most popular ones.
Types of marketing funnel frameworks
AIDA model
AIDA stands for Awareness, Interest, Desire, and Action. It is a popular marketing funnel framework that focuses on content and communication. Here’s a breakdown of each stage with corresponding content and goals.
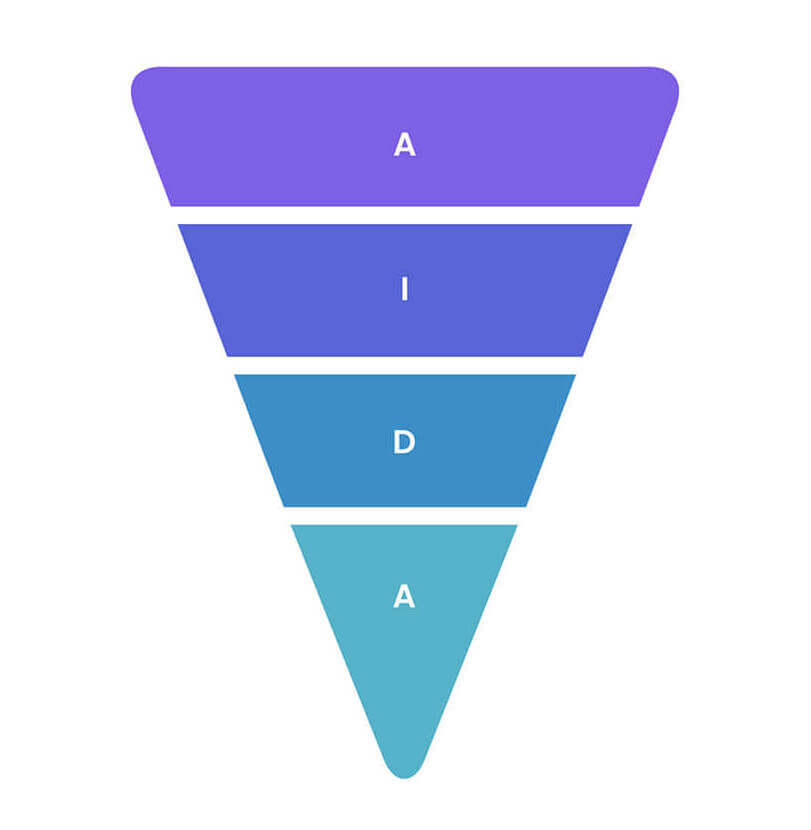
Awareness. The goal at this stage is to capture your audience’s attention and inspire them to explore your solution further. You can achieve this by creating content such as paid ads, social media campaigns, and influencer collaborations.
Interest. At this stage, the prospect is intrigued by your product or service and wants to understand how it can solve their problem. Provide content like explainer videos, expert blog posts, ebooks, or webinars to keep them engaged.
Desire. Here, prospects start to compare your solution to market alternatives. You can provide social proof such as client testimonials and case studies to highlight product benefits. Comparison guides and product demos (if necessary) can also be helpful.
Action. This is where the prospect makes a decision (to sign up or purchase). Content should be more direct and sales-oriented. Think CTAs, free trial promotions, sign-up discounts, and so on.
AARRR model (Pirate metrics)
AARRR represents a well-known framework for marketing funnels where stages are determined by business metrics instead of a prospect’s desired actions. Let’s delve into them.
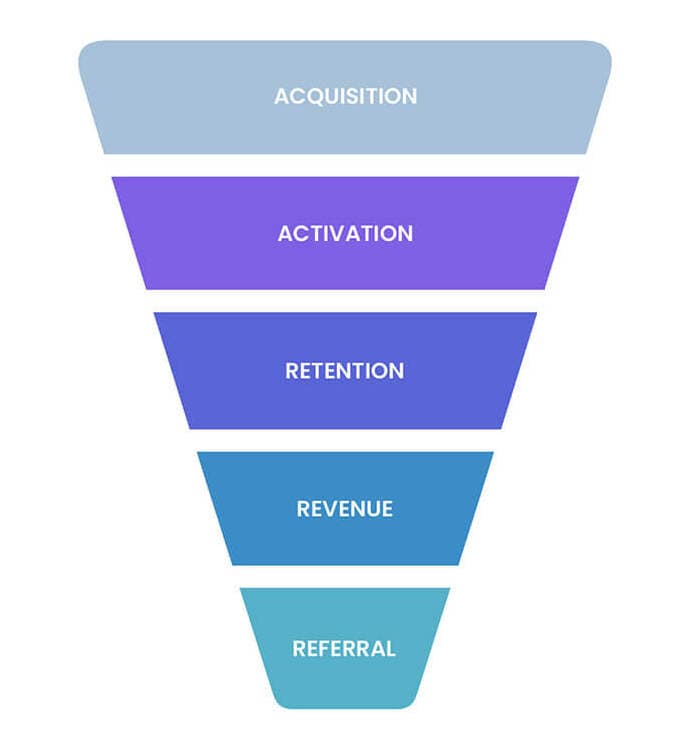
Acquisition. This stage is where you attract potential customers and get them to sign up for your product. All of the usual awareness-generating tactics apply: running paid ads, creating SEO-optimized content, etc. The main goal is to acquire new users.
Activation. This is where users make their first major interaction with your product. To encourage continuous engagement, provide materials like onboarding tutorials, knowledge base, and video demos.
Retention. Now that you have users, it’s important they understand the value of your solution and experience its benefits. Resources such as how-to guides, personalized newsletters (by segment), social media campaigns, and public roadmaps can be helpful in achieving this.
Revenue. At this point, the goal is to turn users into paying customers, so you need to emphasize added value. You can promote tiered pricing and personalized discounts to encourage users to upgrade.
Referral. This final stage is where customers become loyal users of the product. They recommend the product to their friends, talk about it in online forums and conferences, and generally advocate for your brand. Here, you can create referral programs as incentives and actively engage with these users through webinars and live events.
As previously mentioned , AIDA and AARRR are the most comprehensive funnel frameworks for marketing activities. However, there is another model worth mentioning: Awareness, Consideration, Conversion.
Although this framework has fewer stages, it follows the same logic as the previous two examples. It’s all about mapping the customer journey from the moment they discover your product to their decision to purchase.
But here’s the kicker: it doesn’t matter what framework you use, as long as the funnel reflects the behavior and motivations of your target audience. A funnel is not a static marketing tool – it’s a way to visualize, plan, and track your marketing activities. Most importantly, it provides valuable insights into your customers’ needs and allows you to adapt your strategies accordingly.
Learn about the structure and purpose of ads funnels for marketing.
So, let’s talk about how you can do that with accurate funnel tracking.
Key metrics for marketing funnel analytics
Every framework has its own set of critical actions and conversion points, meaning that there’s no ultimate list of marketing funnel metrics. While we can give suggestions, it’s ultimately up to you to determine the metrics that best represent your marketing goals and deserve the most attention.
For example, tracking impressions may not be crucial if your brand reputation and social media presence are already strong. Instead, you might want to focus on the conversion rate from free trials to paid plans.
Keeping this in mind, let’s examine the key metrics for the AIDA and AARRR frameworks, their significance, and where to find the relevant data.
AIDA metrics
| AIDA | Metric | Description | Source |
|---|---|---|---|
| Awareness | Impressions | The number of people who were introduced to your branded content. For instance, they saw your ad in their Instagram feed. A high amount of impressions shows that your content is popular and impactful. | Ad platforms |
| Brand awareness | The level of familiarity your target audience has with your brand. It can be measured with KPIs like share of voice (SOV), earned media coverage, and similar. | Social listening tools, Google Trends, keyword and SEO tools | |
| Interest | Website traffic | The amount of people who visit your site every day, month, quarter, etc. An increase in traffic indicates that your content is motivating your audience to take action. | GA4 |
| Social media subscriptions | The followers you gain on your social media accounts. | Social media platforms | |
| Newsletter signups | The number of people who signed up for your newsletter after being prompted. | Email marketing tools, CRM | |
| Desire | Specific page views | Unique visits to pages on your website. For example, more views on pricing or contact pages can mean that prospects want to learn about your solution. They may also be considering a purchase. | GA4 |
| Ebook downloads | The number of people who downloaded your ebook by clicking on a CTA button or entering their details. | GA4, CRM | |
| Action | Demo requests | Demo requests are how often a prospect reaches out for a demonstration of your product. Lots of demo requests indicate prospects are genuinely interested in your product offering. | GA4, CRM, Calendly |
| Free trial/product signups | Free trial sign-ups are pretty self-explanatory. They mean a prospect has chosen to test your product, which is a sign that they could become an active and paid user soon. | GA4, CRM, product database | |
| Product activation | Refers to the first significant action taken by a new subscriber. It helps you understand if newly acquired users will stick around and bring value to your business. | Product database, email marketing tools |
AARRR metrics
| AARRR | Metric | Description | Source |
|---|---|---|---|
| Acquisition | Free trial/product signups | A prospect has chosen to test your product, which is a sign that they could become an active and paid user in the near future. | GA4, CRM, product database |
| Activation | Product activation | Refers to the first significant action taken by a new subscriber. It helps you understand if newly acquired users will stick around and bring value to your business. | Product database, email marketing tools |
| Retention | Lifetime value | The total value (measured in revenue) a customer brings to your business throughout their subscription. High lifetime value equates to greater customer loyalty and indicates that your marketing spend is well allocated. | Product database, billing system |
| DAU/WAU/MAU | The number of people who interact with your product in a significant way over a set period (day, week, or month). The more active users you have, the better your customer experience is. | Product database | |
| ARPU | Stands for average revenue per user. It’s an estimation of how much money each new customer brings to your business. | Product database, billing system | |
| Revenue | Number of transactions | The number of sales or upgrades that were made within a specific period (day/month/year) | Billing system, CRM |
| MRR | An acronym for Monthly Recurring Revenue or the amount of money you can expect to make each month. | Billing system | |
| Sales | The amount of money generated by product purchases within a certain period. Not to be confused with revenue. | Billing system, CRM | |
| Revenue | The total amount of money generated by transactions related to your product/service. This is a crucial metric for any marketing team. It proves that your efforts convert into actual sales. | Billing system, CRM | |
| Referral | Referral | Measures how satisfied and loyal your customers are. Some actions that indicate loyalty are UGC content, reviews on sites like G2, etc. | Surveys, social listening tools, product database |
| Engagement | The total number of likes, shares, comments, and button clicks your campaigns generate. | Email marketing tools | |
| Upsale | The rate at which your customers upgrade to higher-paid subscriptions. | Product database, billing system |
It is important to note that certain metrics, such as conversion rate and activation, cannot be universally measured.
For instance, one company might consider conversion as the sign-up for a free trial, while another might see it as the purchase of a subscription. As a result, one action generates immediate revenue, while the other does not.
Similarly, the concept applies to activation. For a B2B company like Salesforce, activation could occur when a new customer adds their first contacts to the CRM. For a project management platform, activation might be when a customer sets up their first Kanban board or project flow.
Learn more about data activation and how to leverage first-party data for marketing funnel optimization.
Conversion rates that matter for your funnel
Let’s get back to conversions. Most funnels have several conversion actions, but not all are equally important. Here are a few that drive results:
- Traffic to sign up/trial. Measures the percentage of visitors to your site who sign up for one of your product plans or trials. To increase it, motivate visitors to try out your solution by providing free trials, CTA buttons, social proof (awards won, short testimonials), and outlining your product benefits on the homepage/landing pages.
- Sign up to product activation. The rate at which your new subscribers make the first major interaction with your product. You can improve it by offering helpful materials like in-app or video tutorials, welcome email sequences with simple CTAs, and live demos.
- Sign up to purchase. This is the percentage of product users who eventually buy a subscription. To boost it, offer limited-time discounts, freemium plans, and referral programs.
- Traffic to purchase. Measures the rate at which website visitors convert into paying customers. Increasing this type of conversion requires a combination of all the marketing activities we’ve already outlined, plus more, depending on your product.
Keep in mind that the list provided is not exhaustive. When analyzing funnels for specific channels, such as paid ads, it’s important to track additional conversions. For example, you should track the conversion from impression to click, impression to sign up, click through to sign up, and so on.
Also, remember that conversions like sign-ups are not meaningful without activation. It’s crucial to understand how potential customers will interact with your product and the obstacles they might face. This understanding will allow you to create stronger marketing campaigns from the outset and more accurately measure the impact of your team’s efforts.
How to analyze marketing funnel performance
Funnel analysis isn’t a once-a-quarter task. It’s more of an ongoing process that you should engage in every week or at least a few times a month. Here are the activities with the highest potential for making a difference:
Identify the leaks
Leaks in your marketing funnel can have a significant impact on your profits, so it is crucial to identify and resolve them early. This involves analyzing each stage of the funnel to uncover any frequent or unexpected drop-offs.
The most convenient way to check for leaks is to consolidate all your marketing funnel data in a single dashboard. Here’s an example of a marketing funnel dashboard built in Google Sheets. This is part of the funnel showing the flow from signups to activation. With color coding, a monthly drill down, and side-by-side comparisons of daily vs total signups, it’s easy to identify where drop-offs are occurring.
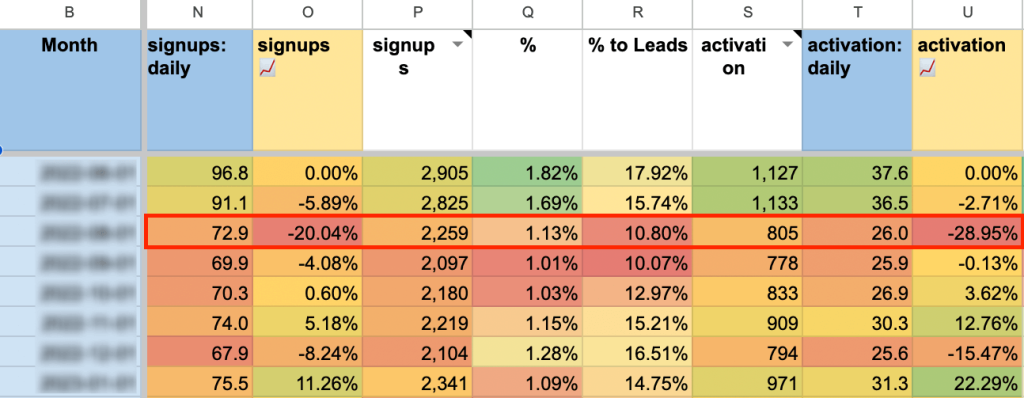
With this information, you can proceed to make strategic changes (e.g. implement a new onboarding tutorial) and check its impact over the following month(s). Keep in mind, though, that seasonal trends can sometimes cause drop-offs, and action isn’t always needed.
P.S. Later, we’ll explain how to visualize and optimize your funnel with free dashboard templates from our team. But for now, let’s focus on other ways to analyze the marketing funnel.
Compare conversions against industry benchmarks
It’s often difficult to determine if your current CTR for paid ads is a cause for concern. Similarly, figuring out if your conversion rate is sustainable or if your free trial is meeting expectations can be challenging.
The truth is, there’s no definite answer. What may be considered a great result for one company could be just average for another. The outcome depends on a range of factors such as your industry, how established your business is, and how your team defines and measures actions like conversion and activation.
However, it can be useful to compare your figures with the latest industry benchmarks. Here are some benchmarks for B2B SaaS:
- Around 5% of website visitors sign up for a free trial. It can be as high as 15%, depending on business variables like product type and experience.
- Prospects who signed up for an opt-in free trial (no credit card details required) convert to paid users at an average rate of 18.2%. It is slightly lower when the traffic source is paid (17.4%).
- Conversion rate from lead to marketing qualified lead (MQL) stands at 39% according to research by First Page Sage. This is the rate at which a prospect who has signed up for your newsletter or research report converts into a viable sales prospect (i.e. requests a demo).
- 6% is the average CTR for search advertising (Google Ads). For social media advertising (aggregation of all platforms), it’s much lower at 0.98%. Meanwhile, email marketing CTR stands at around 2.6%.
- The typical activation rate for B2B SaaS is 33%, according to research by Lenny Rachitsky and Yuriy Temin, who surveyed companies like Canva, Grammarly, and Duolingo.
Examine segment behavior
In order to boost engagement and conversions, it’s important to comprehend how various audience segments react to your marketing efforts. This entails analyzing customer data to pinpoint patterns and potential trends.
While every business categorizes its audience in a unique way, let’s consider a B2B SaaS as an example. Segments for this type of business may be defined by:
- Customer profile (based on professional roles and pain points)
- Company characteristics (e.g. maturity, workforce size, max budget)
- Stage of the customer journey (free trial vs new paid vs legacy user)
- Feature usage
- Geography
Your goal here is to find the top-performing segments and tailor your marketing funnel efforts around them. For instance, let’s say you have a fintech company. Accountants are one of your key customer profiles and your content strategy is heavily focussed on accountancy topics. Later, a segment analysis reveals that the majority of your signups via the blog are coming from your finance leadership segment. In this case, you should pivot and create more content for that specific audience.
Similarly, a geographical analysis can help you personalize your funnel content. If you see that a high number of your website visitors are from non-English speaking countries, it might make sense to localize some of your marketing campaigns. For example, you could launch translated versions of your most popular landing pages. You could also create localized SEO content and social media ads to help boost conversions.
Learn more about cohort analysis Google Analytics.
Evaluate channel engagement
When you first start building your funnel, it can be difficult to pinpoint which marketing channels will bring ROI without effective marketing attribution in place. Typically, there is an experimentation phase where you test multiple platforms at the same time to see what works. Analyzing engagement helps you understand which channels are worth investing in further and which should be abandoned.
For example, let’s imagine you run an AI tech consultancy and your core audience is startup founders and CEOs. Based on that profile, you may have chosen to promote your services on channels like email, social media (LinkedIn and Twitter), and SEO (company blog). But after three months of building these processes and accounts, you’re not seeing the results you expected. What can be done?
First, it’s important to identify which channels are the most valuable. Instead of focusing too much on vanity metrics like follower counts and email open rates, concentrate on tangible results such as sign-ups via a blog post. Understand what’s working well with the content and scale it.
On the other hand, poor engagement doesn’t always mean a marketing channel is the wrong fit for your funnel. It could be that:
- You haven’t tested the channel for long enough (about six months)
- Your content isn’t getting enough views
- You’re not targeting the right segments
- You’re focussing your channel efforts at the wrong funnel stage
How to optimize your marketing funnel after analysis
We’ve already touched on what to do when you see low engagement, conversions, or sign-up rates. The general advice is to change the focus of your content, adjust your brand messaging, and so on. But how does such optimization look at each stage of the funnel? Let’s explore some examples here, using the AIDA framework as a guide.
If you’re planning to take any major risks with your branded content or web design, it’s a good idea to create hypotheses first. The if/then framework can help you measure the business impact of your experiments. Every proposed change or addition should be linked to an actionable metric, e.g. if we create solution pages based on our ideal customer profiles (ICPs), then we will get more signups.
Increase awareness
It takes time to build brand awareness from scratch. Sure, you can always get a quick boost in impressions and engagement with paid ads on social media. It’s a valid way to grow, but unless it’s part of a wider plan, this activity won’t bring you a steady flow of qualified leads.
That’s why investing in your content marketing and content distribution pipelines is key to increasing your reach.
Activities and campaigns to try:
- Creating high-quality SEO content for underserved queries
- Getting featured on sponsored podcasts or collaborating with influencers
- Experimenting with paid ads on platforms like Facebook, LinkedIn, or Twitter
Spark interest
Focus on enhancing communication within your website and marketing materials. Ensure that your value proposition is clear and customer-oriented so that people understand what to expect from your product.
How will you help your potential customers save time or money? How will you assist them in achieving success in their role or increasing their company’s sales? These are the questions that you should address in your marketing materials.
You can conduct customer development sessions to gather first-hand insights from your target audience. Then, use a storytelling approach to address their challenges in your messaging.
Activities and campaigns to try:
- Testing different headlines, slogans, and CTAs on your landing pages
- Setting up a newsletter where prospects can learn more about what you do, or inviting people to subscribe to your social media pages
You can also experiment with creating solution pages for your website, based on your ICPs. Here’s an example from the Coupler.io website:
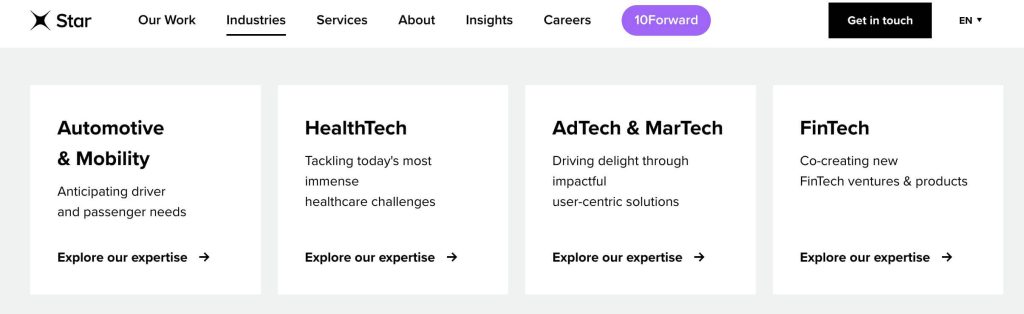
Alternatively, you could try launching industry pages to demonstrate how your company solves challenges for different B2B niches. This makes sense if you are marketing several products at the same time and need to personalize the messaging by industry. Here’s how the engineering company Star does it:
Cultivate desire
To capture more leads at the desire stage, it’s crucial to emphasize why your solution is better than market alternatives. You may already do this with comparison articles and promotions around product features and free trials. However, you can go further by incorporating social proof into your ads, emails, and website content.
Activities and campaigns to try:
- Promoting case studies structured on the ‘problem, solution, result’ framework
- Requesting testimonials and publishing them on your most visited pages
- Launching remarketing campaigns on social platforms, targeting those who showed interest in your awareness ads
- Crafting email campaigns that highlight your success cases (and how you can achieve a similar outcome for the target profile)
Prompt action
Optimizing for the action stage is about instilling a sense of urgency without getting too salesy. You need to engage with your warm leads, remind them of the value of your solution, and incentivize them to sign up or buy.
Activities and campaigns to try:
- Creating email sequences with offers of limited-time discounts, invitations to a demo, etc.
- Setting up remarketing campaigns to bring leads back to your pricing or contact pages
Tools for marketing funnel analytics and optimization
1. Coupler.io
With Coupler.io, you can create reports in spreadsheets or BI tools to track funnel metrics. It lets you export data from your CRM and marketing platforms to visualize the funnel flow and make decisions on the fly.
For example, you can use the customer acquisition dashboard template to combine data from your HubSpot, ad platforms (Facebook, Google, LinkedIn, etc.), and GA4 accounts.
This allows you to analyze the customer decision journey stages from impressions to new customers, monitor marketing spending and ROI, and track conversion changes. The ‘geo funnel’ table also lets you assess performance by country for improved budget allocation.
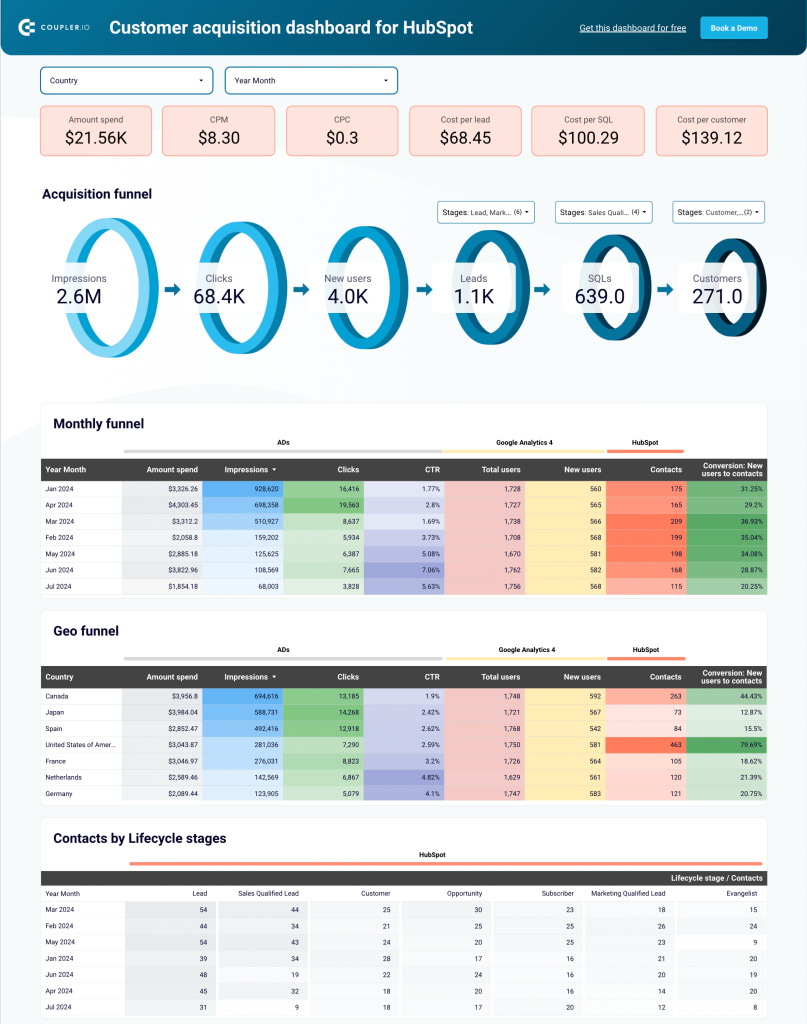
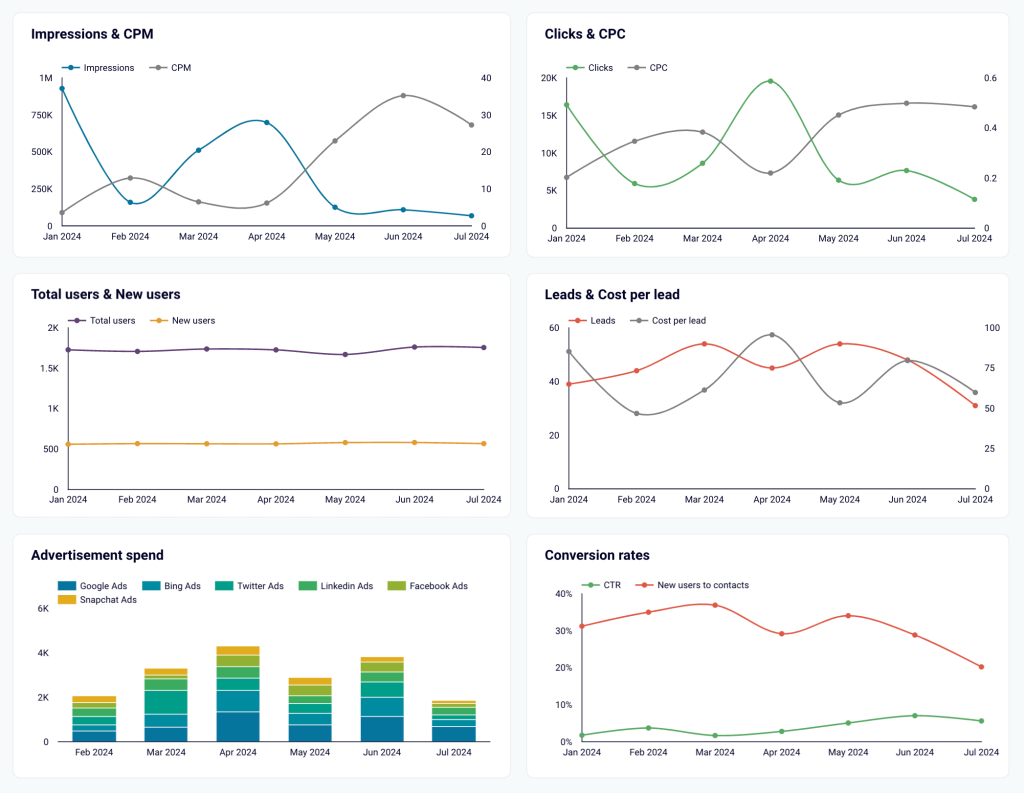
Additionally, there are graphs to compare trends in key metrics, such as CTR to new customers. This is helpful for when you want to quickly check your numbers against industry benchmarks, or understand which funnel stages require more investment.
The best part? Setting up the template only takes a few minutes. You just need to connect your accounts, and the built-in connector by Coupler.io will populate the marketing funnel report with your data. Additionally, you can configure the data to refresh on a schedule, ensuring that you always have the latest funnel insights at your fingertips.
If you use Pipedrive as your CRM instead of Hubspot, be sure to check out the Pipedrive version of this dashboard template.
Need more advanced marketing funnel analytics? Our team can create a custom dashboard based on your preferences. Feel free to book a short call with our team.
2. Heatmaps and session recordings
Product experience tools like Microsoft Clarity or Hotjar help you understand how customers interact with your website. More specifically, you can use them to evaluate the impact of your messaging and CTAs, track conversion flows in near real-time, and investigate the root causes of activation drops.
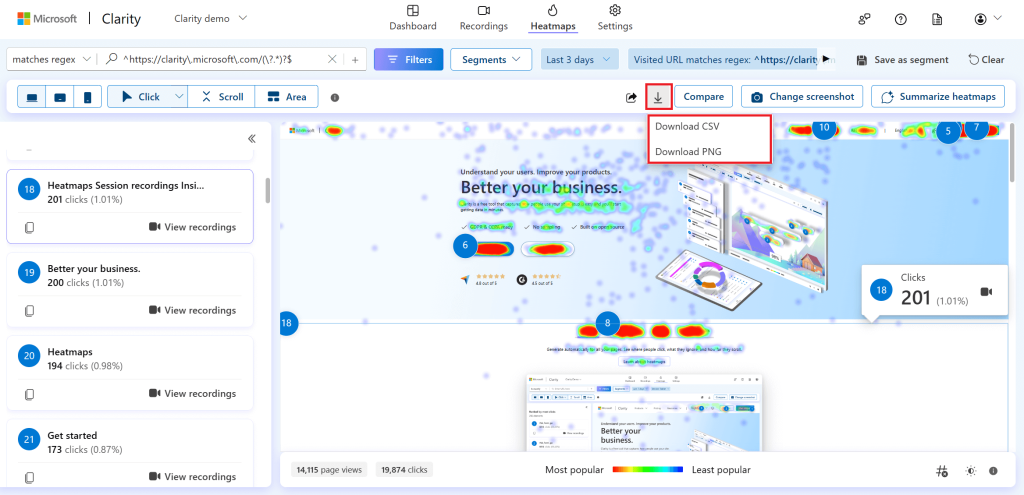
For instance, suppose you have identified a low conversion rate from sign-up to product activation while analyzing the funnel.
A heatmap of the activation page can show which CTA buttons are clicked on the least. Meanwhile, a session recording can provide insight into the aspects of activation that users may be struggling with – for example, how to finalize the Kanban board and share access with the team. With this information, you can make specific design or messaging optimizations.
3. Surveys
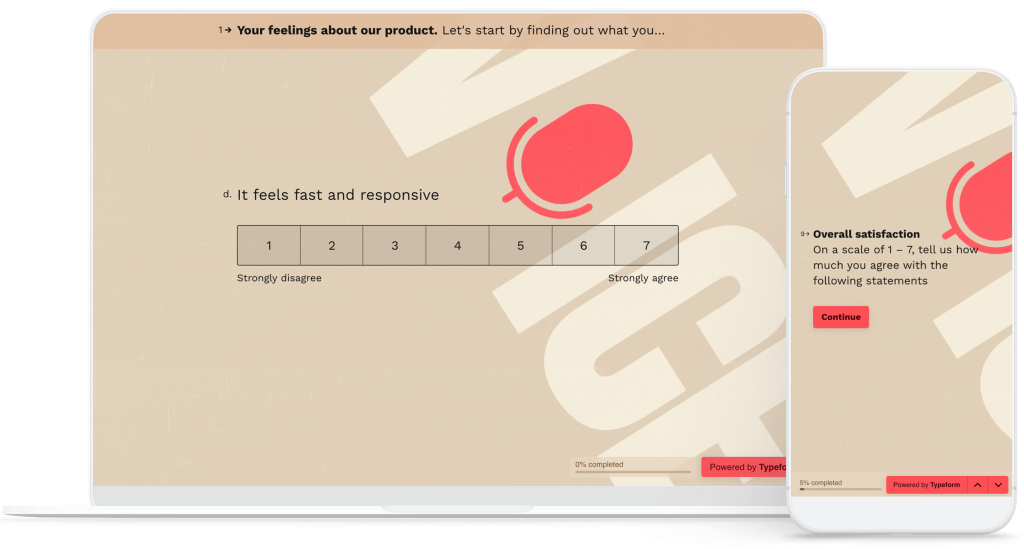
The next step is to use a feedback-gathering tool like SurveyMonkey or Typeform. If you’ve already tried using heatmap insights to improve your sign-up to activation rate but haven’t seen the results you want, a survey can help. It allows you to collect direct feedback from new users and gain insights into their challenges and confusion.
In this scenario, you should send the survey to users who didn’t complete the product activation process. Ask them what they found difficult about the setup process. To encourage survey completion, keep the questions brief. Offer multiple-choice answers but also provide opportunities for users to provide more detailed feedback.
4. Chatbots
Chatbots are another handy tool for driving conversions. Moreover, the increased adoption of AI chatbots is one of the top marketing trends this year. Getting back to the example of a low sign-up to activation rate, a chatbot – when implemented on the relevant product page – can help you address customer concerns in real time. If a user is having trouble setting up, they can ask the chatbot for guidance and be directed to helpful articles in the support center or even connect with a support specialist for a faster resolution.
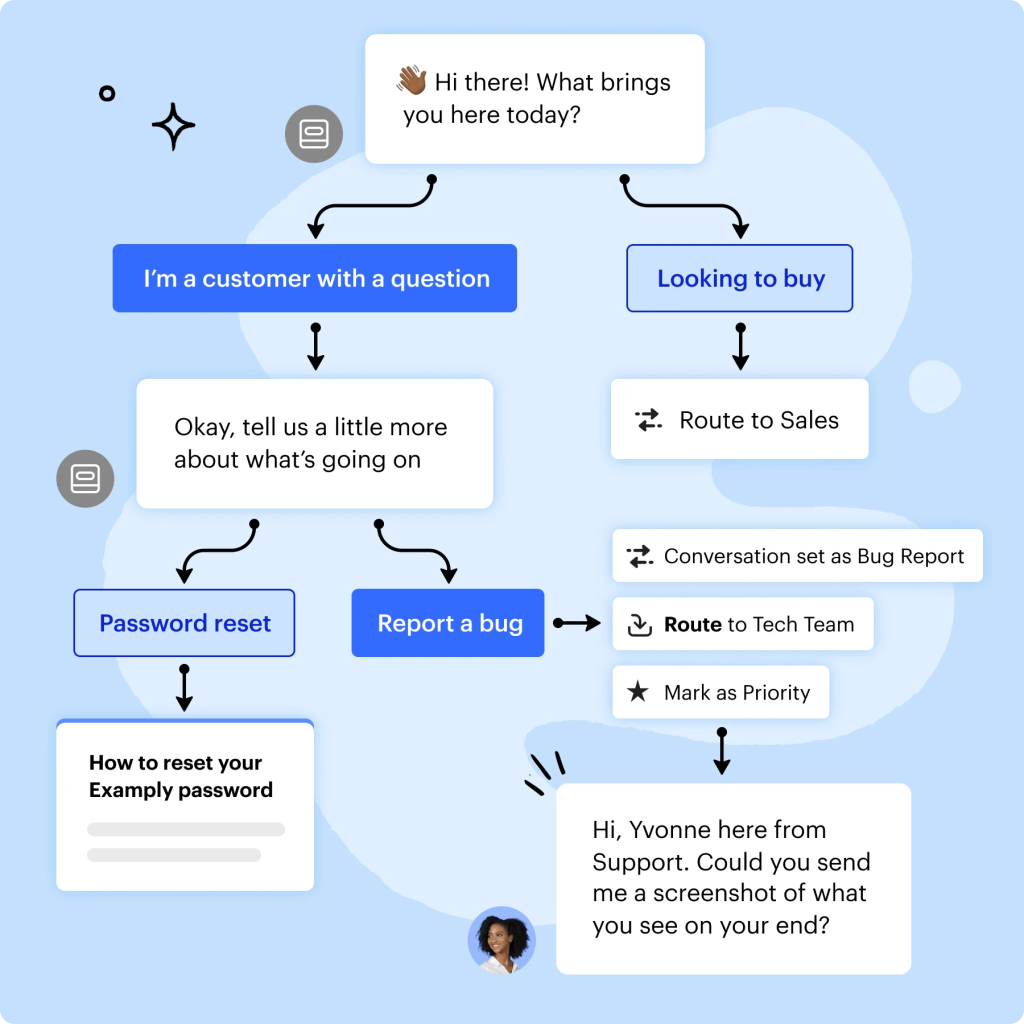
Consider using no-code tools such as Intercom or HelpScout to develop custom scripts and interconnected knowledge bases. Certain chatbots, like Intercom’s Fin, are equipped with advanced AI capabilities, which can be particularly beneficial for efficiently addressing customer inquiries and issues, especially when dealing with a larger user base.
Lastly, you can try optimizing your pages with popups and call-to-action buttons. When combined with the above tools, it’s a solid approach to improving conversions – in this case, a low signup to activation rate. With a platform like OptinMonster, you can create a popup prompting users to complete activation. A simple CTA can help draw users back to the page and remind them of what they have to gain.
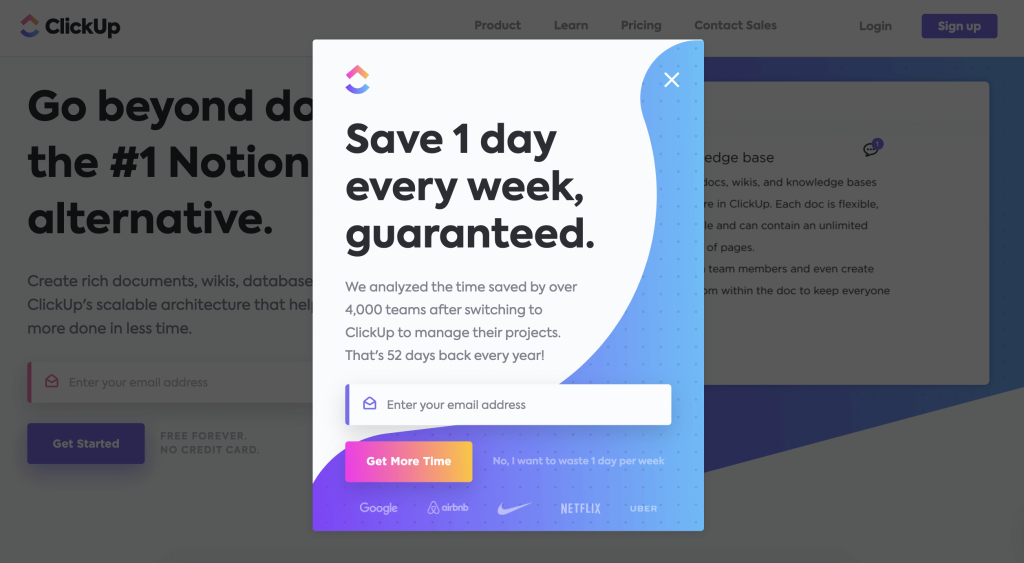
If your goal is to increase product signups or newsletter subscriptions, make sure to highlight a tangible benefit in the popup copy. For example, ClickUp’s ‘Save one day a week’ and the clear call to action: ‘Get more time.’ You can also use popups to offer product discounts, free ebooks, or other helpful resources for prospects at the consideration stage.
Examples of a marketing funnel report (+ free templates)
So far, we’ve discussed the marketing funnel in its broadest form. But you can also break the funnel down into smaller parts and visualize the flow for different ad channels, website events, and so on. Here are a few examples:
LinkedIn lead generation funnel
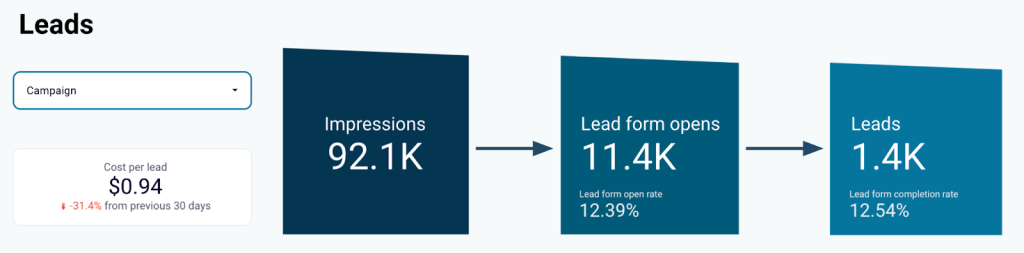
If you regularly run ad campaigns on LinkedIn with a lead generation objective, this Looker Studio funnel visualization can help you analyze drop-offs from ad impressions to qualified prospects. It pulls data from LinkedIn’s built-in lead gen form, showing the difference between the form open rate and form completion rate.
Basic Google Analytics 4 funnel
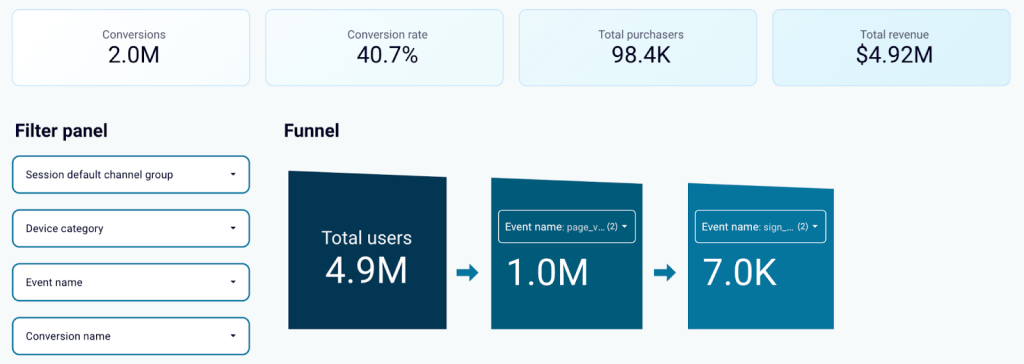
GA4 is an essential tool for keeping track of traffic to sign-up conversions, key purchasing stats, and much more. But this simple three-part funnel lets you analyze site conversions that hold the most value for your team. For instance, you can check how well your website visitors convert into warm leads, sign-ups, or activated users. Use the filter panel to tailor the funnel to your desired metrics.
Learn how you can track AI traffic in GA4.
Twitter ads funnel
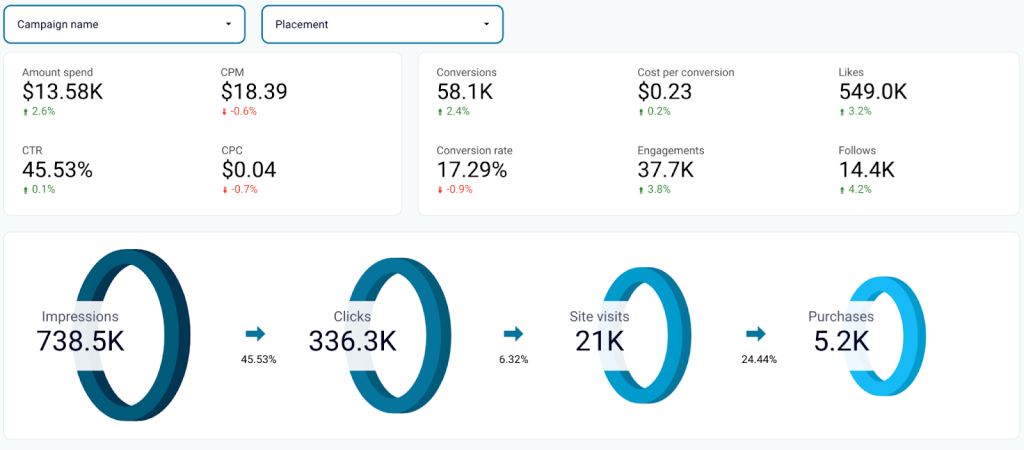
This Twitter ads funnel lets you track the user journey from impressions to purchase. It visualizes the impact of your ad campaigns on product revenue, making this dashboard ideal for marketing funnel reporting and analysis. Additionally, you can filter by campaign and ad placement to check the results of your most recent ad promotions.
Email marketing funnel
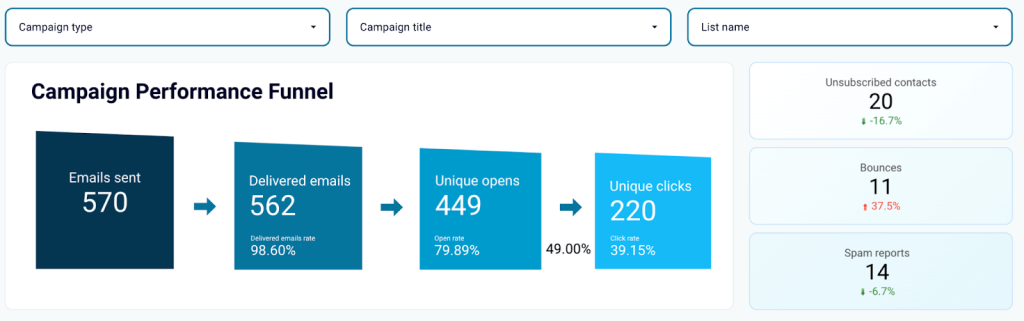
The main advantage of this email marketing funnel dashboard is the capability to filter by campaign type and name. It’s easy to analyze the results of multiple campaigns in one place and monitor conversion changes after optimizations. As a bonus, you can see the number of bounces, spam reports, and unsubscribes for each campaign. This can help you understand what’s going wrong and identify areas that may need more significant improvements.
To use this funnel template, choose the right version for your email marketing tool:
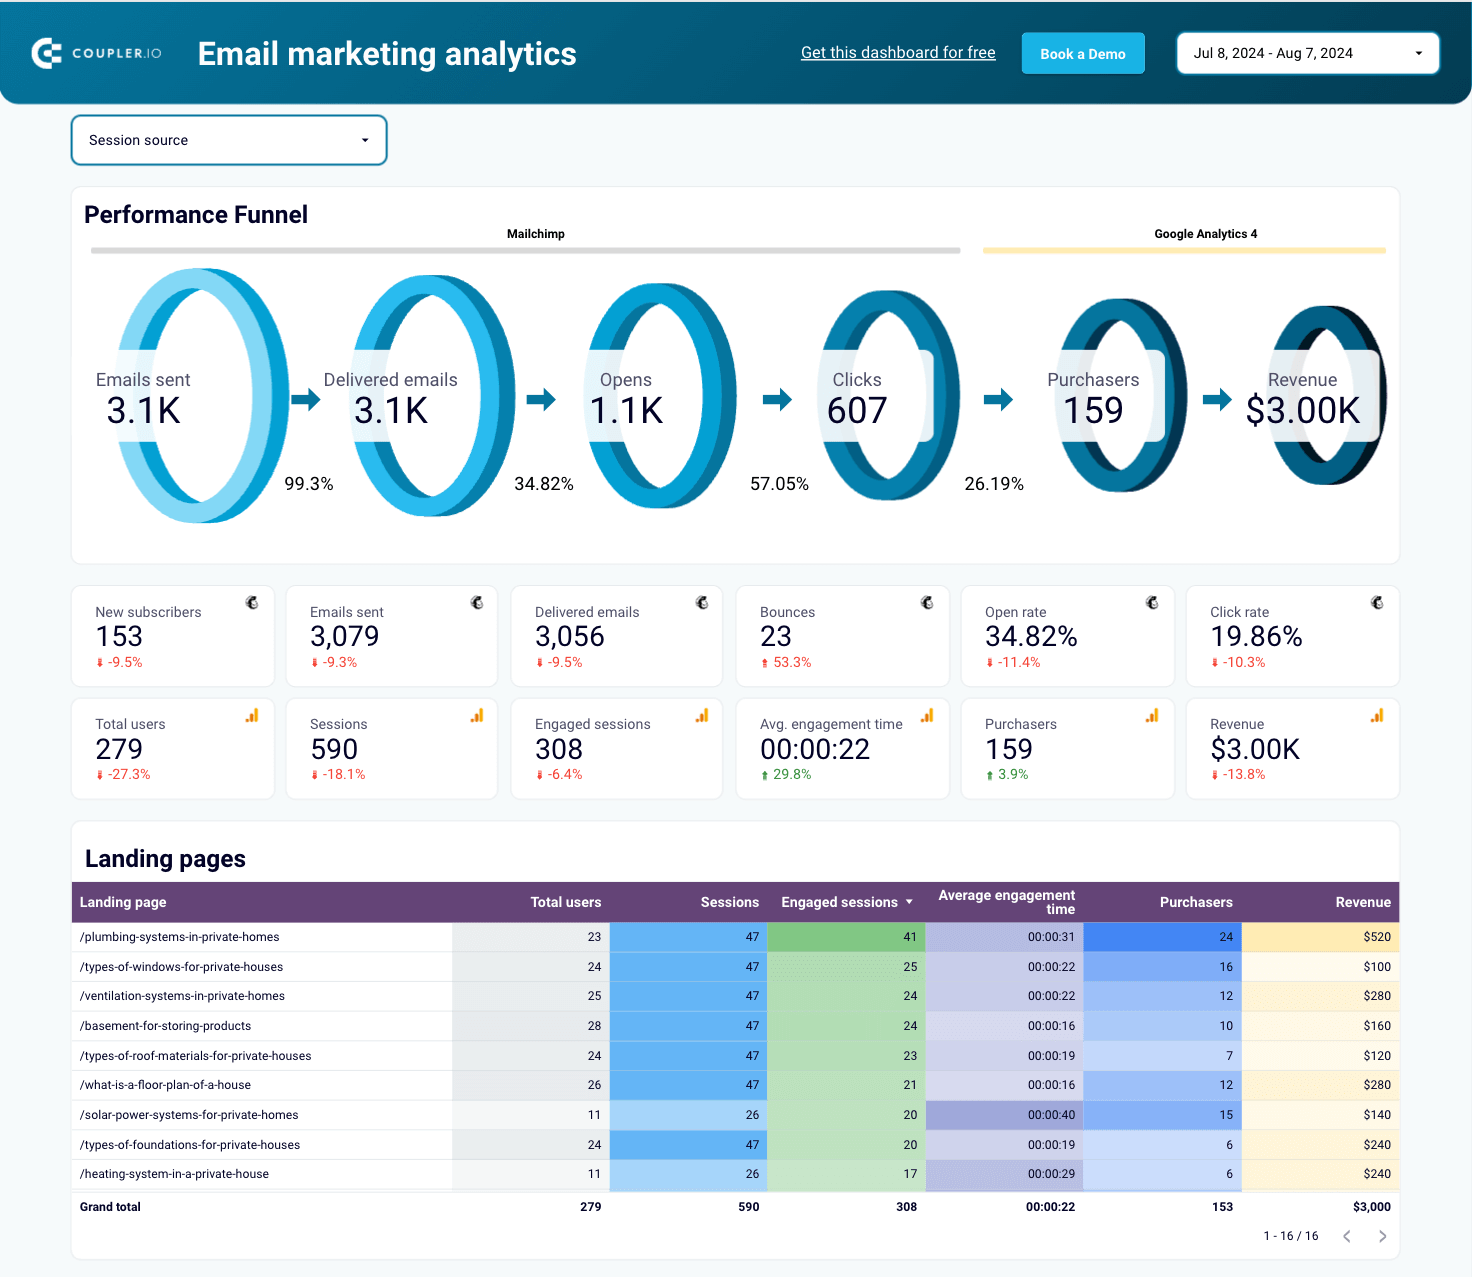
Mailchimp Email Marketing Analytics Dashboard
Track the performance of your email marketing efforts with our dashboard, combining Mailchimp and GA4 data.


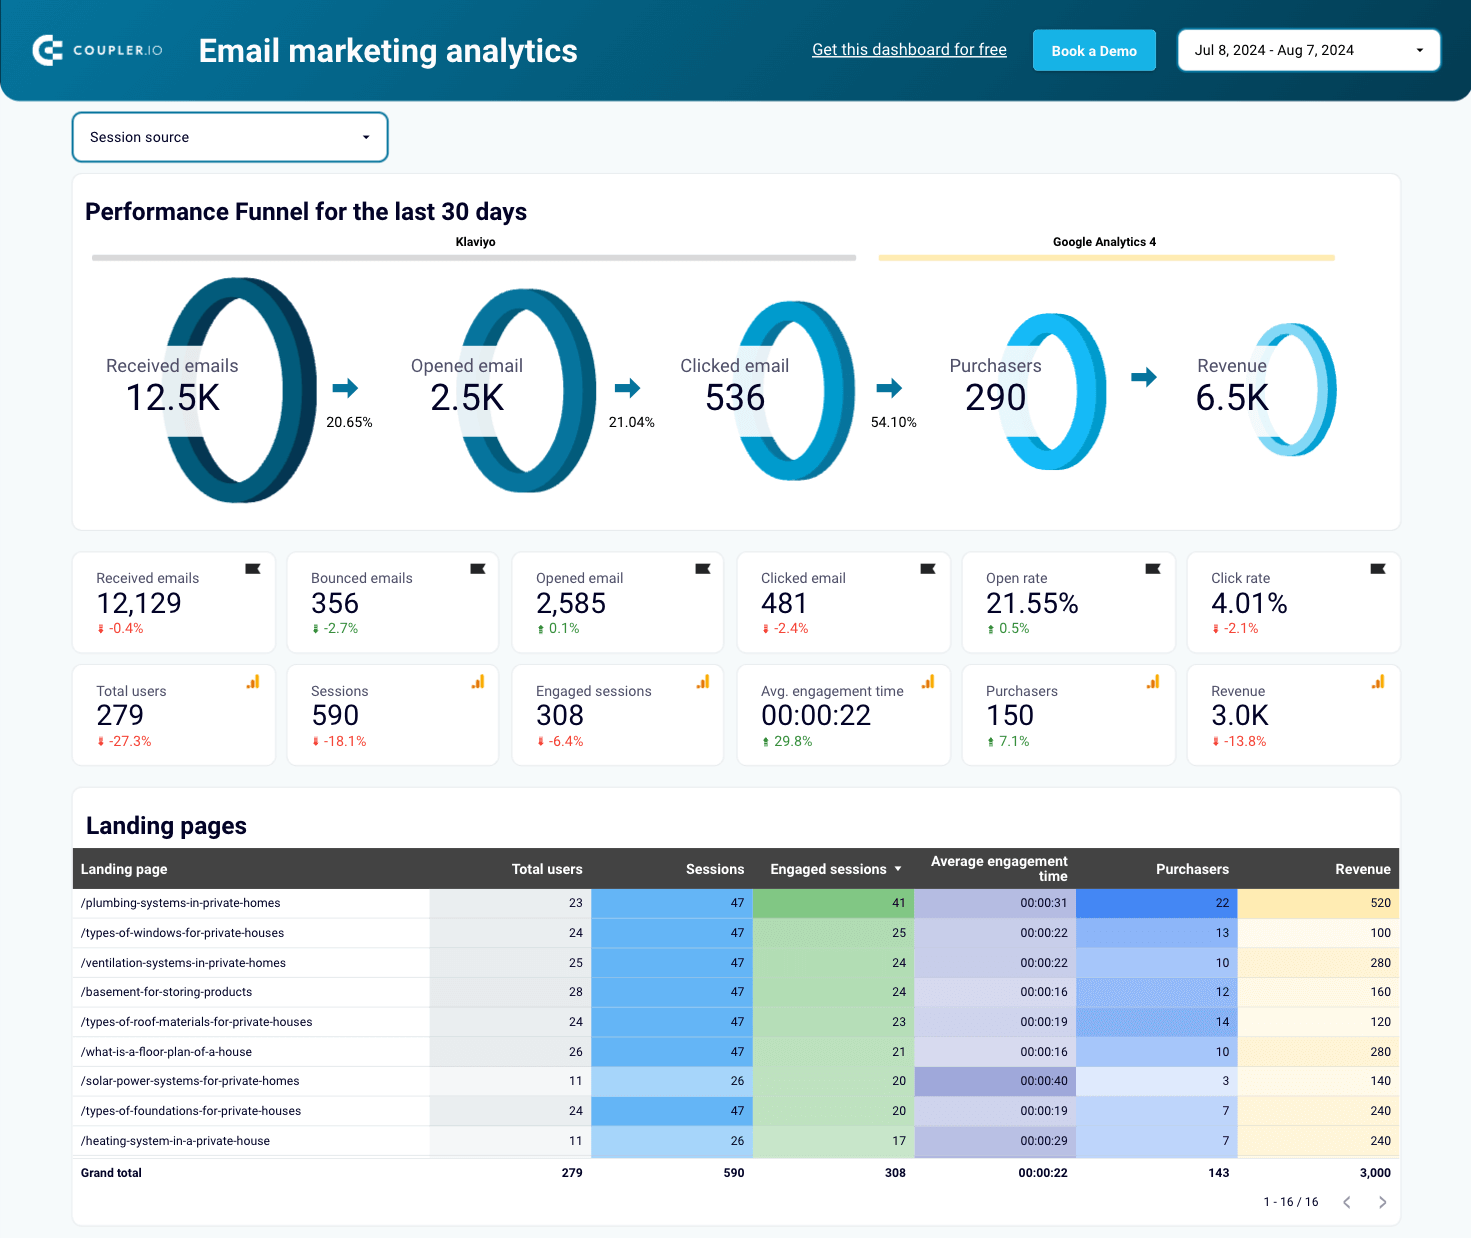
Klaviyo Email Marketing Analytics Dashboard
Monitor the perfomance of your email marketing campigns in Klaviyo and get an overview of your marketing funnel using data from GA4.

Wanna be fancy? Marketing funnel alternatives
The funnel’s linearity makes it difficult to quantify the impact of past campaigns, seasonal trends, and referrals on your future sales. It also isn’t suitable for measuring results from inbound marketing campaigns. That’s why some teams opt for alternatives like…
Inbound marketing flywheel
The flywheel was developed by HubSpot to represent the key goals of an inbound marketing strategy. It’s a cyclical take on the funnel, made up of three interconnected elements: Attract, Engage, and Delight.
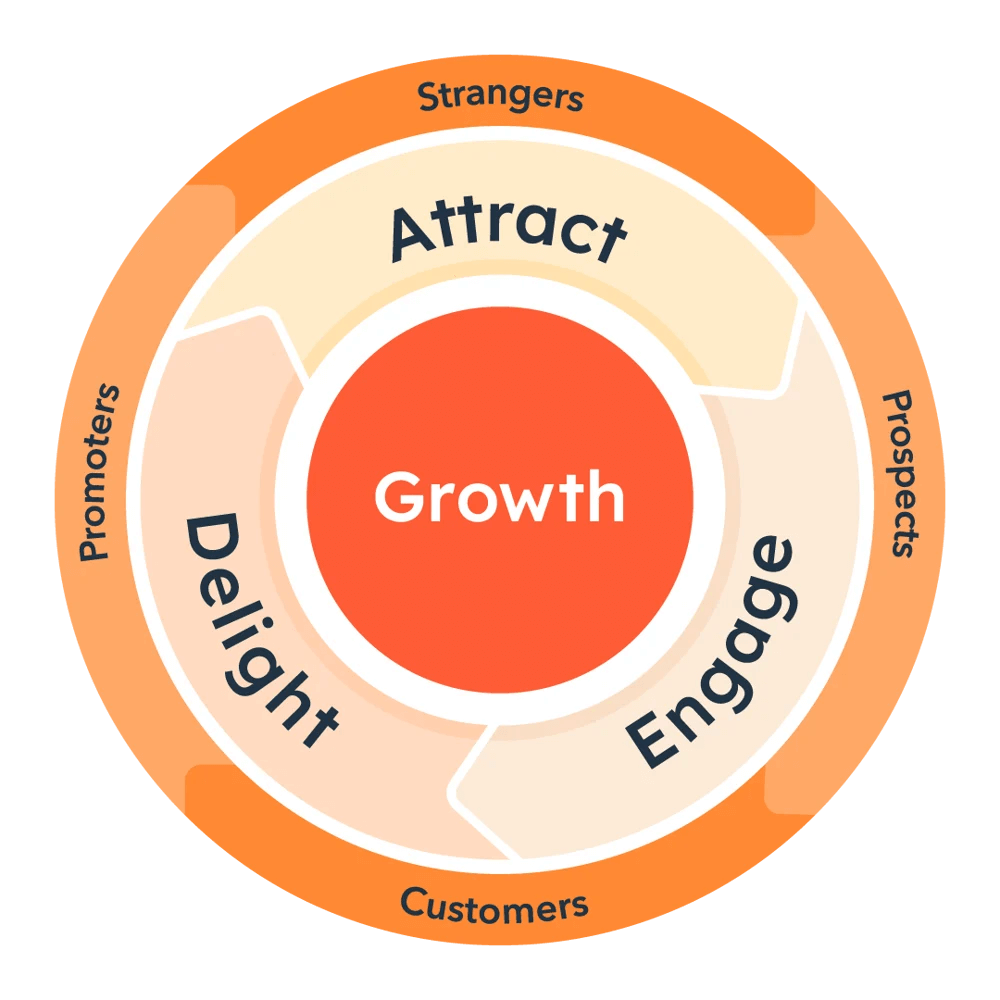
During the Attract phase, you generate helpful content to create interest in your product. In the Engage phase, you capture the attention of potential customers with unique and personalized content. Finally, in the Delight phase, you highlight the value of your solution. You engage with customers on external platforms, provide them with exclusive discounts and opportunities, and encourage them to spread the word about your product.
The flywheel’s objective is to convert ‘strangers’ (cold audience) into promoters (loyal users). In this way, it functions similarly to a funnel, but without a final stage. Instead, promoters fuel business growth and decrease the necessity for costly awareness campaigns.
Circular customer journey
The Circular Customer Journey was developed by McKinsey and Co as an alternative to the marketing funnel. Like the flywheel, it aims to capture the nonlinearity of customer decision-making. It also accounts for the influence of customer advocacy on the sales cycle.
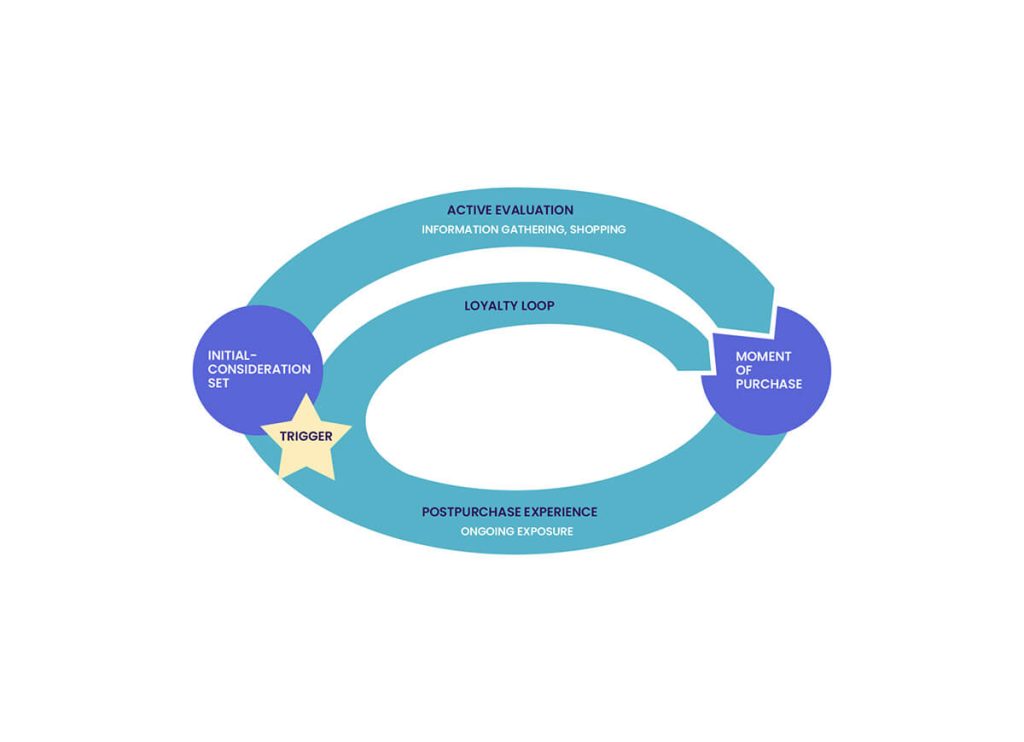
In the Circular Customer Journey, there are four/five actions a prospect takes when searching for a solution to their problem. First comes the ‘trigger’ – a need that compels them to start looking. Then comes:
Initial consideration – potential customers are exposed to touchpoints during the search (e.g. social media ads) and consider a set of brands.
Active evaluation – they gather more information about those brands and get closer to a decision.
Moment of purchase – the prospect decides to buy from the brand that (they believe) will best solve their problem.
Post-purchase experience – the new customer builds expectations about the product and brand based on their recent experiences. This influences their future decisions (e.g. to upgrade their plan).
The ‘loyalty loop’ represents the impact of a positive customer experience on the entire marketing funnel. Product demand remains consistent because customers keep using and recommending it to their networks. Like the flywheel, this continuous cycle aims to generate inbound leads and minimize the need for costly marketing campaigns.
Not sure if a marketing funnel – or its alternatives – is the right fit for your business? In a separate article, we delve into the key differences between marketing funnels vs sales funnels. You can also read about the structure and purpose of the ads funnel for marketers.
Why it’s essential to analyze your marketing funnel
The funnel gives structure and purpose to the efforts of a marketing team. Most importantly, it helps you interpret prospects’ needs at different stages of the user journey. With a marketing funnel analysis, you can:
- Address critical gaps in your marketing materials
- Identify opportunities to further engage with your audience
- Uncover bottlenecks to prevent loss of revenue
Funnel analysis also helps you answer questions like:
- How well do we cater to customer needs at each journey stage?
- Are we targeting the right audience? What about the correct segments?
- Why are we getting so few signups or conversions to paid plans?
- How much value do customers get from our solution?
- Where can we implement tools to be more efficient?
Funnel visualization is essential for accurate tracking and analysis. Get started with one of the free dashboard templates above or talk to our Coupler.io team for a personalized solution!