Marketing Mix Models (MMMs) are powerful tools for understanding the impact of your marketing efforts. If you feed them the right data, these models can deliver accurate forecasts and predict sales.
You don’t need to be an advanced data analyst to implement them; some MM models can be built using Google Sheets and simple automations.
This article will explain what MMMs are and guide you on how to implement these models in a simple way.
What is the Marketing Mix Model?
Marketing mix modeling, also known as Media mix modeling, is an approach that uses statistical analysis methods to understand how marketing activities impact sales.
The most common MM models use multivariate regression analysis to evaluate media spending across online and offline channels. They also consider external factors influencing business performance.
This allows you to measure the impact of different marketing campaigns on sales conversions.
Marketing Mix Model vs. Multi-Touch Attribution Models
While both Marketing Mix Models and Multi-Touch Attribution (MTA) Models are used to measure marketing efforts, they differ in several ways.
The main question that MTA answers is, “What sales can we expect if we increase social media marketing budgets by 5%?”.
In contrast, MM models answer more complex questions such as, “Which channel brings the best ROI?” or “What would be the impact on MRR of a 20% off Black Friday campaign?” or “How would changing price for product X impact growth and sales in the next two years?”
This is because MMMs provide a macro-level analysis relying on historically aggregate data, usually spanning two to three years.
They can factor in macroeconomic data such as seasonality, competitor’s actions, and pricing or economic conditions.
MMM analysis is used for long-term strategic planning and forecasting sales on offline and online channels.
In comparison, Multi-Touch Attribution Models use user interaction data such as clicks or ad impressions across multiple digital marketing channels. MTA models are granular marketing analytics that rely on attribution tracking across multiple digital touchpoints.
They enable you to easily track individual customer journeys and optimize the marketing strategy in the short term.
MMM vs MTA comparison table
Here’s a quick overview of how MMM and MTA models compare:
| MMM | MTA | |
|---|---|---|
| Data type | Aggregate | User level |
| Data needs | Historical sales and marketing data | User interaction data (clicks, impressions, etc.) |
| Time frame analyzed | Daily data points for two to three years | Daily, Weekly, Monthly |
| Channels | Online and offline | Online |
| Used for | Long-term strategic planning | Short-term tactical optimizations |
| Focus | Less granular, focus on overall impact | Highly granular, focus on touchpoints impact |
| Cost | Complex models can be expensive to build | Basic data is available through free tools |
| Implementation | Time-consuming | Instant |
| Ease | Need experts and tools to implement | Easy to set up |
| Accuracy | High accuracy and reliability when using good data | It relies on cookie data and is becoming less accurate due to privacy policies |
However, MTA models have the downside of data availability.
Privacy regulations restrict the collection and use of personal data, and we can expect third-party cookies to be phased out in the near future.
This makes tools like Google Analytics less reliable and accurate in tracking user actions and reporting on attribution in the long run. No wonder they are starting to use machine learning to make predictions instead of relying solely on tracked data.
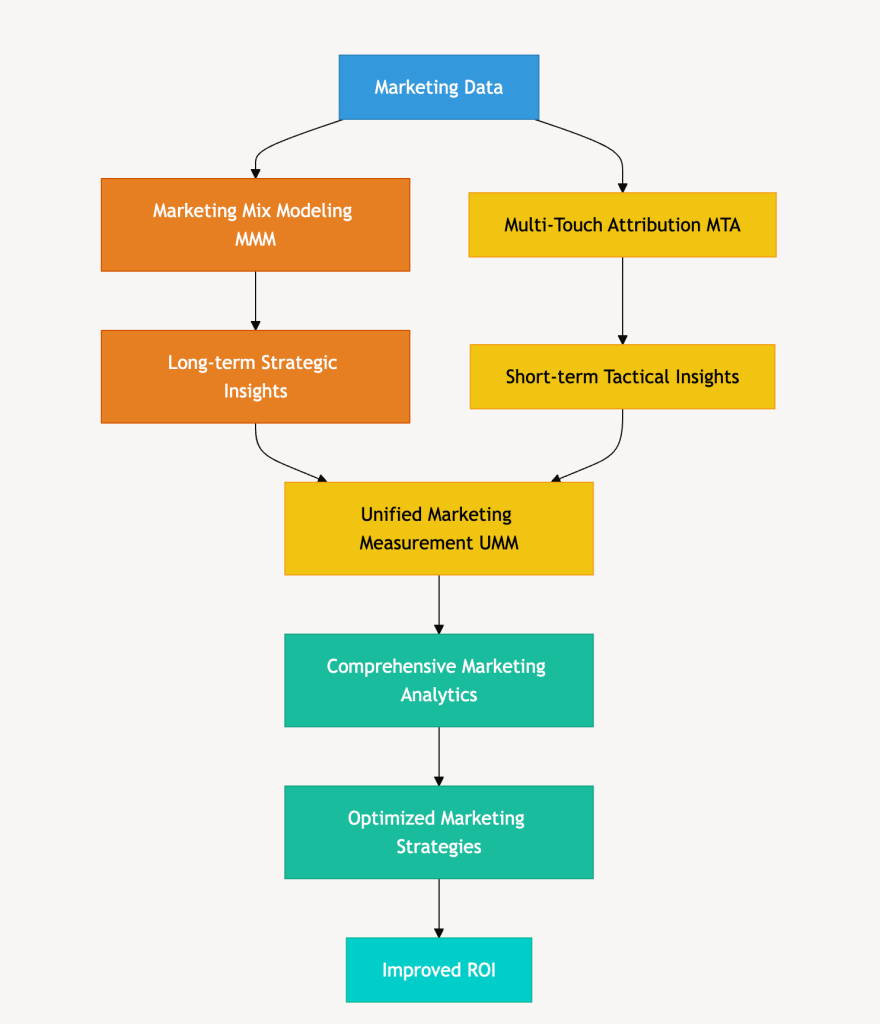
Because of this, marketers are increasingly adopting the concept of unified marketing measurement (UMM) to better track the impact of marketing campaigns.
MMM vs. MTA vs. UMM
Unified Marketing Measurement (UMM) combines input from Marketing Mix Modelling (MMM) aggregated data with user-level data from Multi-Touch attribution (MTA).
This can give you a more comprehensive view of marketing performance.
Let’s say you’re running an out-of-home (OOH) campaign to promote a new product while also running branded paid search campaigns.
An MMM helps you analyze the OOH campaign and its impact on sales, while the MTA shows the impact of the paid campaigns on individual customer journeys leading to sales.
When you combine data within UMM, you’ll be able to understand if the OOH campaign influences the branded paid campaign.
How does MMM help marketers?
Marketing Mix Modeling can be a powerful ally to marketing teams in maximizing ROI and predicting revenue.
Using MMM, marketers can:
- Assess marketing effectiveness: Determine which marketing channels impact sales and other KPIs the most. Marketing funnels are quite useful in this regard.
Learn the difference between marketing funnel vs sales funnel.
- Optimize budget allocation: Switch to data-driven decision-making by understanding the most effective way to use a set budget to maximize ROI.
- Forecast revenue growth: Using historical data, predict potential outcomes and impact of marketing activities and tactics.
- Perform cross-channel analysis: Evaluate both offline and online media channels at the same time.
Who is MMM for?
At first glance, an MMM can benefit everyone. However, there’s one thing to keep in mind: MMM requires large historical and external data sets to avoid the classic “Bad Data In, Bad Decisions Out.”
This makes MMM models commonly used by consumer packaged goods (CPG) brands, e-commerce, and big pharma. Moreover, syndicated data is more readily available in these industries, which can improve the accuracy of the models.
To understand the long-term marketing effectiveness of both online and offline channels, MMM is best used by:
- Large enterprises that need to predict sales and understand price elasticity.
- Multi-channel retailers and e-commerce companies that need to understand the impact of a complex marketing mix.
- Fast-Moving Consumer Goods (FMCG) companies that don’t have a significantly higher offline presence than online.
- Analytics teams that need in-depth analysis of marketing tactics and their impact on sales to inform stakeholders and decision-makers.
Variables and events to include in your MMM
As mentioned earlier in this article, MMMs are statistical models that require large historical data sets to produce relevant results.
Your model is only as good as the data you feed into it. Choosing the right variables is important for accurately predicting business performance.
Each model you build should focus on the relevant variables to help answer a specific question.
Every MMM model works with two types of variables: dependent and independent.
Dependent variables are the business outcomes or results you want to predict. These can include business performance metrics like sales volume, revenue metrics, market share, brand equity, customer acquisition, or profit.
These are categorized as “dependent” because their values are assumed to depend on or be influenced by the independent variables in your MMM.
Independent variables are the factors that will impact the dependent variables. These usually include marketing activities and external factors that will affect the performance.
Here are some examples of independent variables to consider including:
- Marketing variables: Media spent by channel, promotional activities, ad impressions, CTRs, and sales events.
- Marketing mix elements: Price points, distribution metrics, product availability, promotions.
- Special events: One-time campaigns or market and industry events.
- External factors: Seasonality, economic factors, industry trends, competitive activities
Let’s look at an example of an e-commerce fashion retailer planning its winter collection launch. Their MMM might include:
- Marketing data: Social media ad spend, influencer campaigns, email marketing frequency.
- Marketing mix elements: Base sales, product pricing, website conversion rates, and brand awareness.
- Special Events: Celebrity collaboration launch, website redesign rollout.
- External: Temperature data, competitor sales events, fashion week timing, Black Friday campaigns.
How to plan the implementation
Implementing Marketing Mix Models can quickly become complex depending on the data you want to analyze and the questions you want to answer.
Let’s break the process down into a few steps to help you understand how to start.
Plan the questions you need to answer
Start by identifying specific questions you want your MMM to answer. It’s important to focus on one question at a time, as this will determine the type of data you need and the model’s accuracy.
Here are some examples of questions a Marketing Mix Model can answer:
- What’s the channel with the best return on investment (ROI)?
- How do seasonal factors impact sales for a specific product?
- What’s the best budget allocation across channels?
- How do price changes impact demand?
- Will a 20% or 30% promotion maximize ROI for a Black Friday campaign?
Once you determine your model’s objective by understanding the main question you are trying to answer, move on to the next step.
How accurate do you need the model to be?
Before investing in statistical modeling tools, start by understanding your needs. Sometimes, a simple spreadsheet analysis can be enough to assess the effectiveness of different marketing initiatives quickly.
You can look at three levels of accuracy to determine the type of solution that might be best for you:
- High accuracy needed to make strategic decisions: This is usually the case for big retailers that need to analyze large data sets and it requires investment in advanced modeling.
- Moderate accuracy needed for budget planning: This applies to smaller e-commerce shops or SaaS businesses that need to forecast and optimize budget allocation across online and offline campaigns. Using standard statistical tools to build simple models would work best.
- Basic accuracy is needed to understand which channel has the highest ROI: This is for businesses that want to move from multi-touch attribution models and better understand how to allocate budget across different channels. Exporting your data into spreadsheets and using linear regression functions is a simple way to start.
Start with a simple model that answers your most pressing business questions. As your team gains experience and confidence with MMM, you can look into more complex models.
Data collection and transformations
After choosing a question to answer and the complexity of your model, it’s time to collect data.
Focus on narrowing down the data points and identifying the sources from which to obtain them. For instance:
- Data points: Incremental sales, marketing spend by channel, price points, weather, and events.
- Data sources: Ad platforms, Analytics tools, CRMs, Media agency reports, Weather APIs, economic databases, and industry reports.
Marketing mix models need granularity. You can collect daily, monthly, or weekly data points based on the accuracy of the predictions you are looking for.
Most MM models work best when you input daily data, providing multiple data points to understand trends (not the current marketing trends but still) and fluctuations.
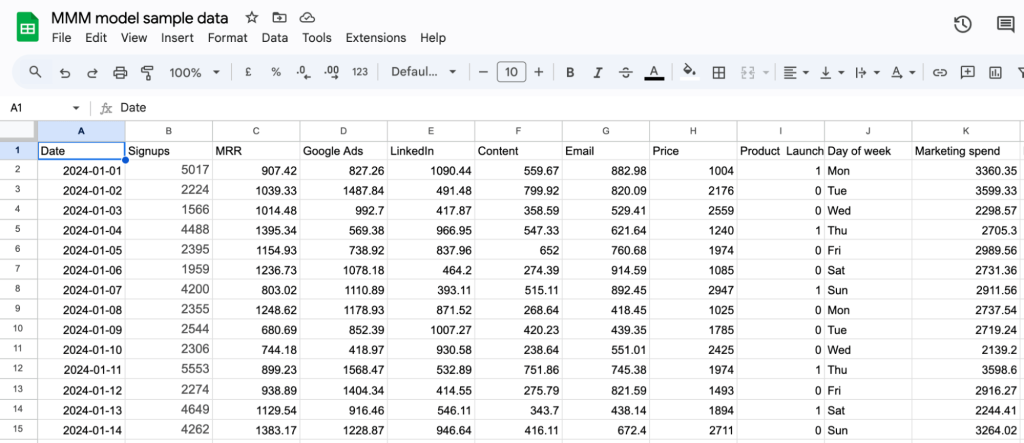
Let’s say you run a small SaaS business and want to understand the marketing impact on monthly signups.
Here’s a basic model that you can run inside a Google Sheets using:
- Dependent variable: Daily signups
- Independent variables: Marketing spending by channel, price changes, product launches and day of the week.
You’ll start by extracting key metrics with daily data points into a spreadsheet, adding each variable in a separate column.
You can automate this part using a data automation tool like Coupler.io (we’ll cover tools in more detail in the next section).
In the example spreadsheet below, we’ve used columns A to H to input data on Date, Signups, MRR, Google Ads, LinkedIn, Content, and Email.
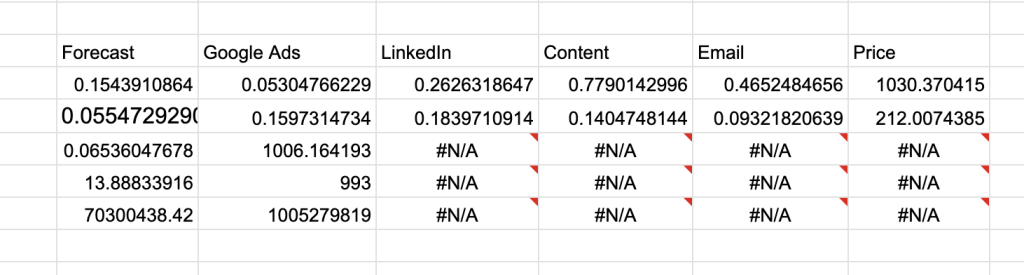
Then, use linear regression formulas to get answers. For example, using the Linest function in Google Sheets, we can make simple predictions for each channel.
=LINEST(B2:B1000, D2:H1000,True, True)
Based on the data in the spreadsheet, we can conclude that Content is our most profitable channel. For every $1 spent, we get 0.77 signups, compared to Google Ads, which generates 0.05 signups.
Model development and optimization
MMMs aren’t a “set it and forget it” tool. You’ll want to test the model by comparing predictions with actual results and look for major discrepancies. Missing data or incorrect data might lead to misleading predictions.
You can also test different time periods, consider removing metrics that don’t impact results, and add others that might.
The list can go on. The important thing to keep in mind is you need to update the data monthly and continuously adjust the model to account for changes.
The goal isn’t perfection. Focus on making your model good enough to inform better marketing decisions, then make iterations gradually based on actual needs.
Tech stack for MMM
There are multiple tools you can use to implement a Marketing Mix Model. The tools you choose should align with your needs and skills.
For example, a basic tech stack can include tools like:
- Tools for modeling: These can be used to collect data and implement MMMs, such as Google Sheets for simple forecast analysis or Google’s Meridian (previously LightweightMMM) to analyze ad performance.
- Marketing data input sources: Third-party tools used for marketing campaigns and analytics data collection, such as Google Analytics and other ad platform analytics.
- ETL and data automation: Tools that automate real-time data pipelines between input sources and modeling tools, such as Coupler.io.
When you need to forecast sales data for multiple channels and consider different variables, you can look at enterprise solutions service platforms or custom solutions provided by analytics agencies:
- Enterprise tools: Cassandra, Nielsen Marketing Mix Modeling, and Uber’s Orbit for analyzing and predicting time series data.
- Custom solutions: Some specialized agencies can create custom models based on your needs, but these will be more expensive.
Challenges in implementing MMM
While a powerful tool for predicting various marketing activities, MMM can be challenging to deploy at scale. Here are the most common challenges:
Data quality and availability: MMM needs at least two or three years of granular data to output reliable results. Inconsistent tracking, different data formats, or data gaps can negatively impact results.
How to overcome:
Start by implementing data consistency best practices. This includes naming conventions for events across multiple channels as well as the granularity of the data you collect. Next, utilize data automation tools to collect and transform your data for better MMM analysis.
Complexity: You’ll need specialized knowledge to develop and optimize MMM models to answer your questions.
How to overcome:
Before getting into complex models, start experimenting with simple forecast formulas inside Google Sheets. Compare and forecast results for only your main channels before trying to implement complex models.
Expensive: Outsourcing MMM analysis or building the models in-house can be expensive for SMBs and time-consuming.
How to overcome:
Use free tools like Google’s Meridian and only consider scaling and outsourcing MMMs when your business really needs complex statistical forecasts. If you’re an SMB investing your marketing budget primarily in online channels, experimenting with simple models in house will be enough.
Best practices to increase the accuracy of MMM
To counteract the challenges mentioned above, there’s a series of actions you can implement:
- Collect proper data: Use consistent naming conventions, document data sources and formats, and set up automated data collection to extract and transform data as needed.
- Start with simple spreadsheets: Focus on key channels first and build more complex models later.
- Test different statistical techniques: Different questions will need different techniques. For example, you can use linear regression functions to forecast results or correlation functions to uncover correlations between data.
How to initiate MMM in your organization
You now have a basic understanding of how marketing mix models work. We recommend you start by exporting and transforming the data from a few channels and play with standard regression analysis functions in Sheets.
This will help you understand if you have enough data for more complex models and identify what else to consider.

Automate marketing reporting with Coupler.io
Get started for free