Pipedrive doesn’t offer powerful analytical and reporting features sufficient for compiling business development plans. Therefore, marketers and sales managers opt for customized reporting outside of Pipedrive using BI solutions such as Looker Studio or Power BI. Here, they can not only visualize their data but also create interactive dashboards to monitor their pipeline performance and share the results with stakeholders.
Having said that, it’s not an easy task to connect Pipedrive to Power BI since there is no native connection between these services. Though, we have good news for you – there are other methods for bringing them together. Find three hands-free methods describing setup for Power BI Pipedrive integration.
Ways to connect Pipedrive to Power BI
In real life, you can decide how to get from Boston to New York, for instance, with one of the transportation means. You can go by car, by bus, by train, or by plane. Some courageous personalities can also consider going on foot or by bicycle. That’s a joke, of course!
As digital world concepts are similar to the offline world – there are usually several options for fulfilling a specific task. So, we present three practical ways to integrate Pipedrive data into Power BI, and it’s up to you to decide which one suits you best.
Power BI to Pipedrive integration with Coupler.io
If speed is a priority for you, then use a third-party automation platform that allows you to extract data from Pipedrive and send it seamlessly to Power BI. It’s effortless to set up and exploit with no coding needed.
Pipedrive data transfer to Power BI using ODBC driver
This procedure involves the installation and configuration of the ODBC driver, which helps to establish a direct connection between Pipedrive and Power BI. Such an approach is similar to the first one, as it involves an extra tool, but it has certain OS-related limitations as it’s only Windows-compatible.
Pipedrive Power BI connection via API
Data engineering or technically savvy marketers can use Pipedrive API to connect a CRM to Power BI. This method implies writing customer code but nevertheless provides some flexibility.
How to connect Power BI to Pipedrive with Coupler.io
The fastest and easiest way to connect these two platforms is by using Coupler.io’s Power BI connector. It’s a reporting automation platform to turn your raw data into meaningful reports. To construct your Pipedrive Power BI pipeline, create a Coupler.io account for free using the form below. We’ve already preselected Pipedrive as a source and Power BI as a destination, so click PROCEED. Once you log in to Coupler.io, you’ll need to configure the connections.
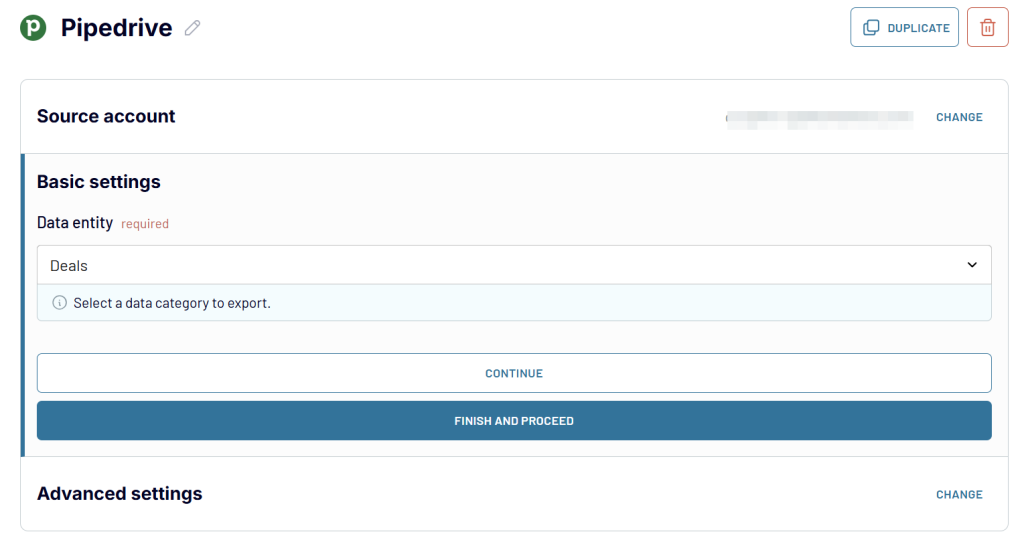
Step1. Extract data from Pipedrive
- Connect your Pipedrive account and select the data entity of interest – Deals, Leads, Persons, and so on.
After having completed the setup for Pipedrive, you can add more data sources to combine with the data from Pipedrive. These could be other Pipedrive accounts, analytics apps, advertising platforms, accounting software, and more. Use this option to perform a comprehensive analysis based on data from various sources.
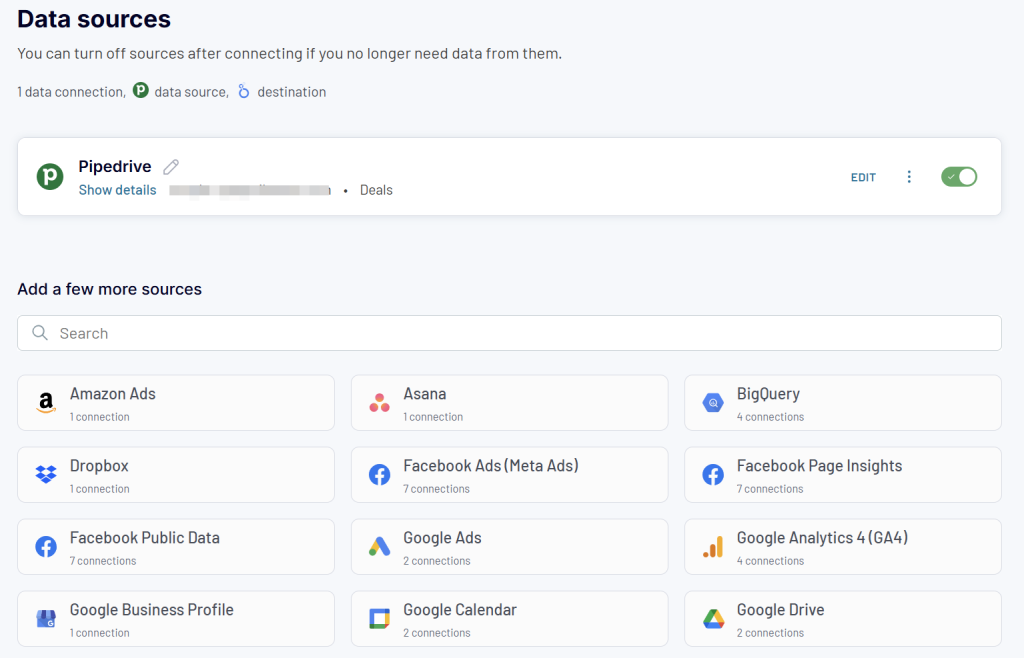
In our article, we review only the setup of Pipedrive as a source, so let’s proceed to the next step of configuring Pipedrive Power BI integration.
Step 2. Data Transformation
In most cases, data from cloud apps isn’t always 100% ready for analysis in Power BI or other similar tools. It usually requires some transformation and cleansing for the sake of more precise analysis and prediction. If you feel that your Pipedrive data needs to be brushed up, then click TRANSFORM DATA.
Coupler.io offers several data transformation options that you can check out in this interactive form:
That’s where the source setup finishes, so click PROCEED to jump to Power BI connection settings.
Step 3. Load to Power BI and automate refresh
First, make sure that Power BI Desktop is open on your computer. Then, follow the instructions provided in Coupler.io to complete Pipedrive Power BI integration. In brief, you should:
- Click Generate link to create an integration URL address from Coupler.io.
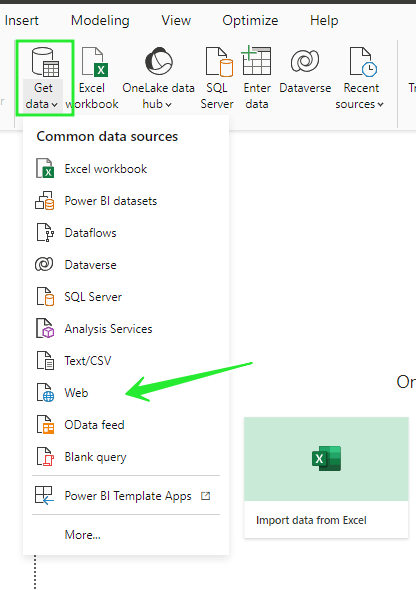
- Copy the link and go to Power BI desktop. Select the Get data tab and click Web from the drop-down menu.
It’s the right time to insert the previously copied URL and start receiving data from Pipedrive. The process is automatic, so you will see the resulting tables in Power BI.
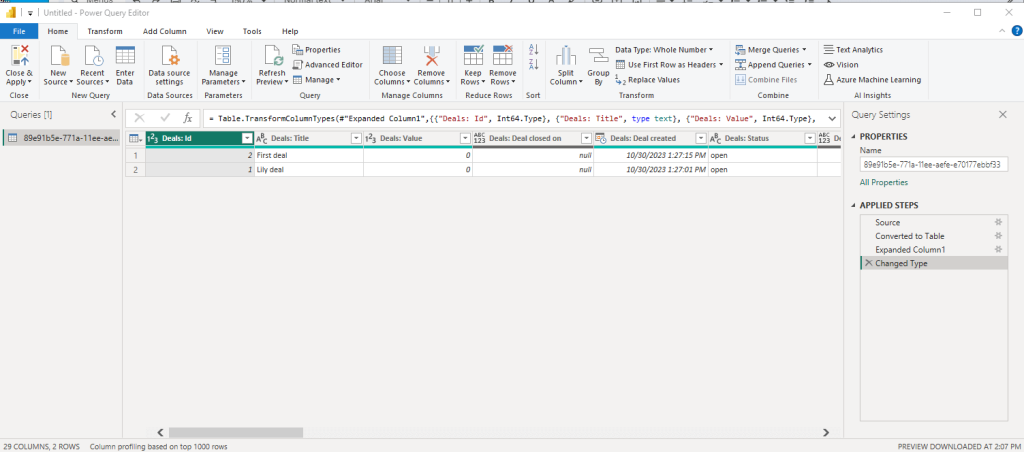
So you see that the needed Pipedrive data is already there in several seconds!
Now, it’s possible to get insights from your business data and see how your business performs and what perspectives it has for the future.
Note that this setup isn’t only about a one-time data transfer from Pipedrive to Power BI. You can run the integration automatically on a regular basis. Just enable the Automatic data refresh option in the Schedule section and specify the frequency at which you want the Pipedrive data to flow to Power BI. Given that the minimum interval is 15 minutes, this could be a great advantage for companies dealing with big data.
Ready-to-use Pipedrive dashboard template in Power BI to accelerate your analysis
Once your Pipedrive-Power BI integration is complete, you’ll have access to raw CRM data that needs to be transformed into meaningful business insights. Rather than spending weeks building dashboards from scratch, consider these professionally designed templates that have been refined through hundreds of real-world implementations:
Pipedrive CRM dashboard in Power BI
This comprehensive sales pipeline dashboard transforms your raw Pipedrive data into a complete sales operations command center. The dashboard provides a multi-layered view of your sales performance, combining deal-level analysis with team productivity metrics and pipeline health indicators.
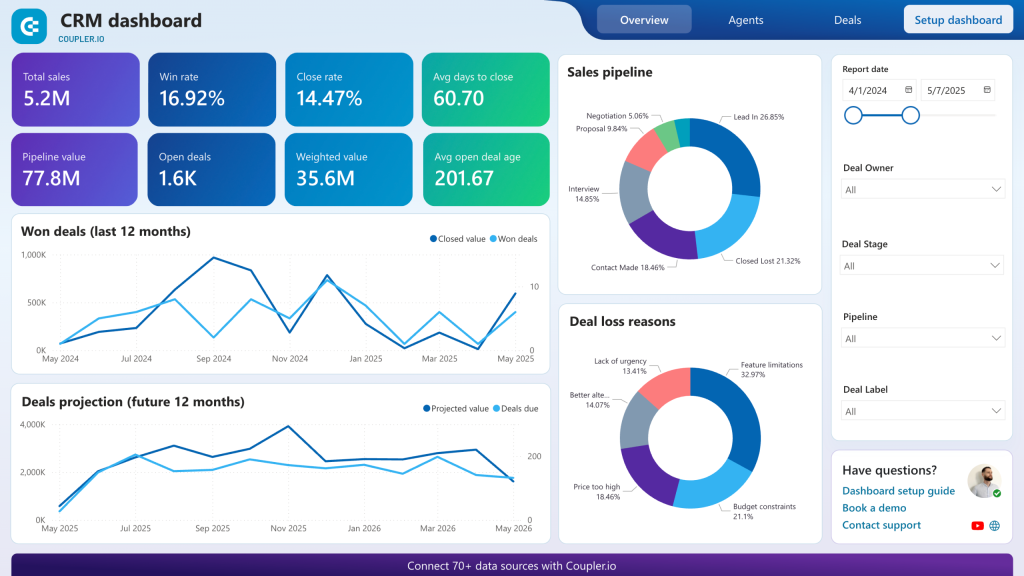
What insights the dashboard provides:
- Unclosed deal analysis – Deep-dive into stalled opportunities by filtering deals by owner, deal type, revenue potential, current stage, and win probability. The dashboard reveals patterns in where deals typically get stuck, helping sales managers proactively address bottlenecks before they impact quarterly results.
- Best-won deals breakdown – Identify the characteristics of your most successful deals, including company types, decision-maker profiles, and industry verticals that generate the highest revenue. This analysis helps refine your ideal customer profile and focus prospecting efforts on the most promising opportunities.
- Deal and revenue trend analysis – Track performance dynamics across different time periods to uncover seasonal patterns and correlations with marketing campaigns, product launches, or team changes. The dashboard shows both deal volume and revenue trends, helping forecast future performance.
- Sales funnel performance monitoring – Visualize your pipeline with customizable stage definitions and conversion rate analysis. The dashboard identifies where deals most commonly drop off and calculates the time deals spend in each stage, revealing process inefficiencies.
- Team performance comparison – Compare individual sales rep performance across multiple dimensions including win rates, deal sizes, time-to-close, and pipeline velocity. The analysis helps identify top performers’ strategies and coaching opportunities for other team members.
How to use this dashboard: Simply connect your integrated Pipedrive data and follow the setup instructions in the included Readme tab. The dashboard is equipped with Coupler.io that automatically populates with your live data, giving you instant visibility into your sales operations.
Customer acquisition dashboard for Pipedrive in Power BI
This advanced analytics dashboard bridges the gap between your marketing investments and sales outcomes by combining Pipedrive CRM data with marketing analytics from Google Analytics 4 and major advertising platforms. The result is a complete view of your customer acquisition funnel from first touch to closed deal.
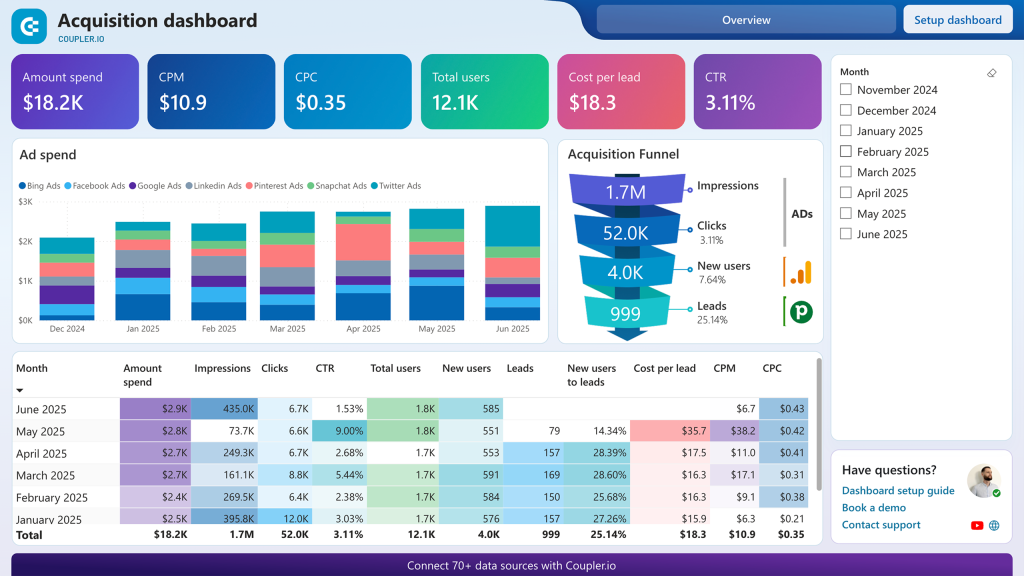
What insights you can get:
- Multi-source acquisition funnel visualization – Track the complete customer journey from initial ad impressions through website visits to CRM lead creation and final deal closure. The dashboard shows conversion rates at each stage and identifies where prospects are dropping out of your funnel, allowing you to optimize underperforming stages.
- Benchmark comparison and performance analysis – Compare your funnel conversion rates against industry standards and track performance fluctuations over time. The dashboard correlates conversion rate changes with specific marketing activities, campaign launches, or budget adjustments, helping you understand what drives performance improvements.
- Cross-platform advertising efficiency analysis – Evaluate the return on investment across different advertising channels including Google Ads, Facebook Ads, LinkedIn Ads, and other platforms. The dashboard shows which channels deliver the highest-quality leads that convert to closed deals, not just website traffic.
- Lead quality scoring and source attribution – Analyze which marketing sources generate leads that progress furthest through your sales pipeline and close at the highest rates. This insight helps you reallocate marketing budget from volume-focused channels to quality-focused ones that drive actual revenue.
- Predictive sales forecasting – Use historical data patterns to forecast future lead volume and deal closure rates based on current marketing investments. The dashboard helps you model different budget scenarios and their impact on your sales pipeline over time.
How to use this dashboard: This dashboard works with your Pipedrive integration plus connections to GA4 and your advertising platforms through Coupler.io. Follow the Readme tab instructions to connect your marketing data sources with your CRM pipeline stages.
Coupler.io offers more dashboard templates for instant analytics for CRM, sales, marketing, finances, etc. They are available in Power BI and other platforms, including native Coupler.io dashboards. Sign up for free and check them out with no credit card required.
Automate reporting with Coupler.io
Get started for freeSet up Pipedrive data transfer to Power BI using ODBC driver
An ODBC driver is a desktop app that implements Microsoft’s standard Open Database Connectivity to access data sources via lower-level APIs. Microsoft’s Power BI can use an ODBC driver to extract data from Pipedrive. To make this happen, download the CData ODBC driver for Pipedrive.
You know that all Windows-compatible products are easy to install by following several simple steps. Wizard is rather intuitive and guides you through the process of installation, so there shouldn’t be any issues with that. Right, when everything is ready, you’ll just have to take some steps to make things work.
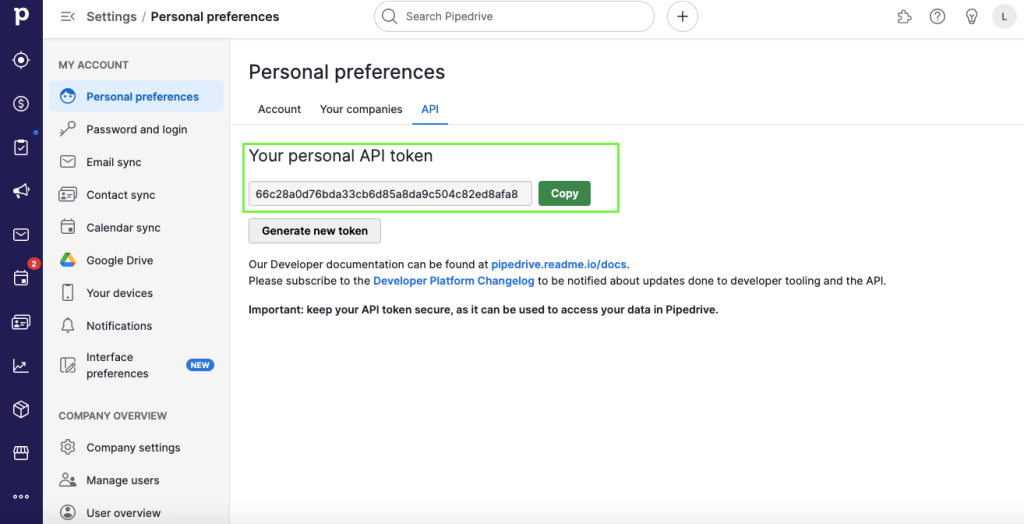
Before we proceed, copy your personal API token from your Pipedrive personal profile.
First, go to the folder where the ODBC driver is installed and open the ConfigureODBC.exe file. Go to the Advanced tab to specify the company domain URL and insert the previously copied API token, as shown below. Then, test the connection to make sure that everything works as it should.
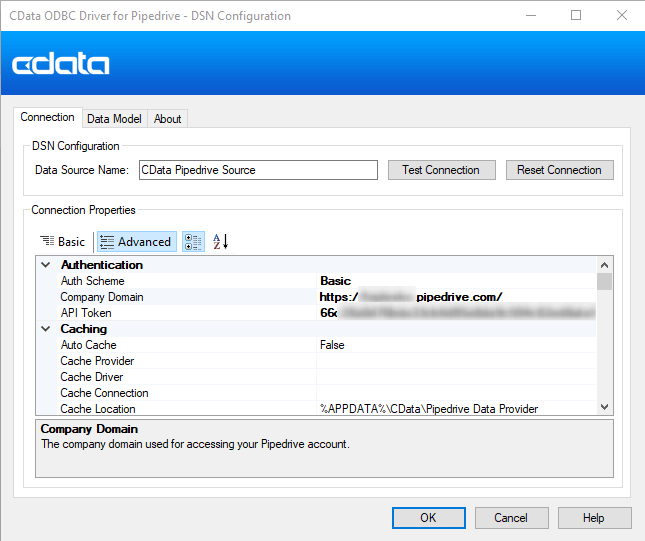
Doesn’t seem to be rocket science, right?
Step 2. Connect to Power BI from Pipedrive with ODBC driver
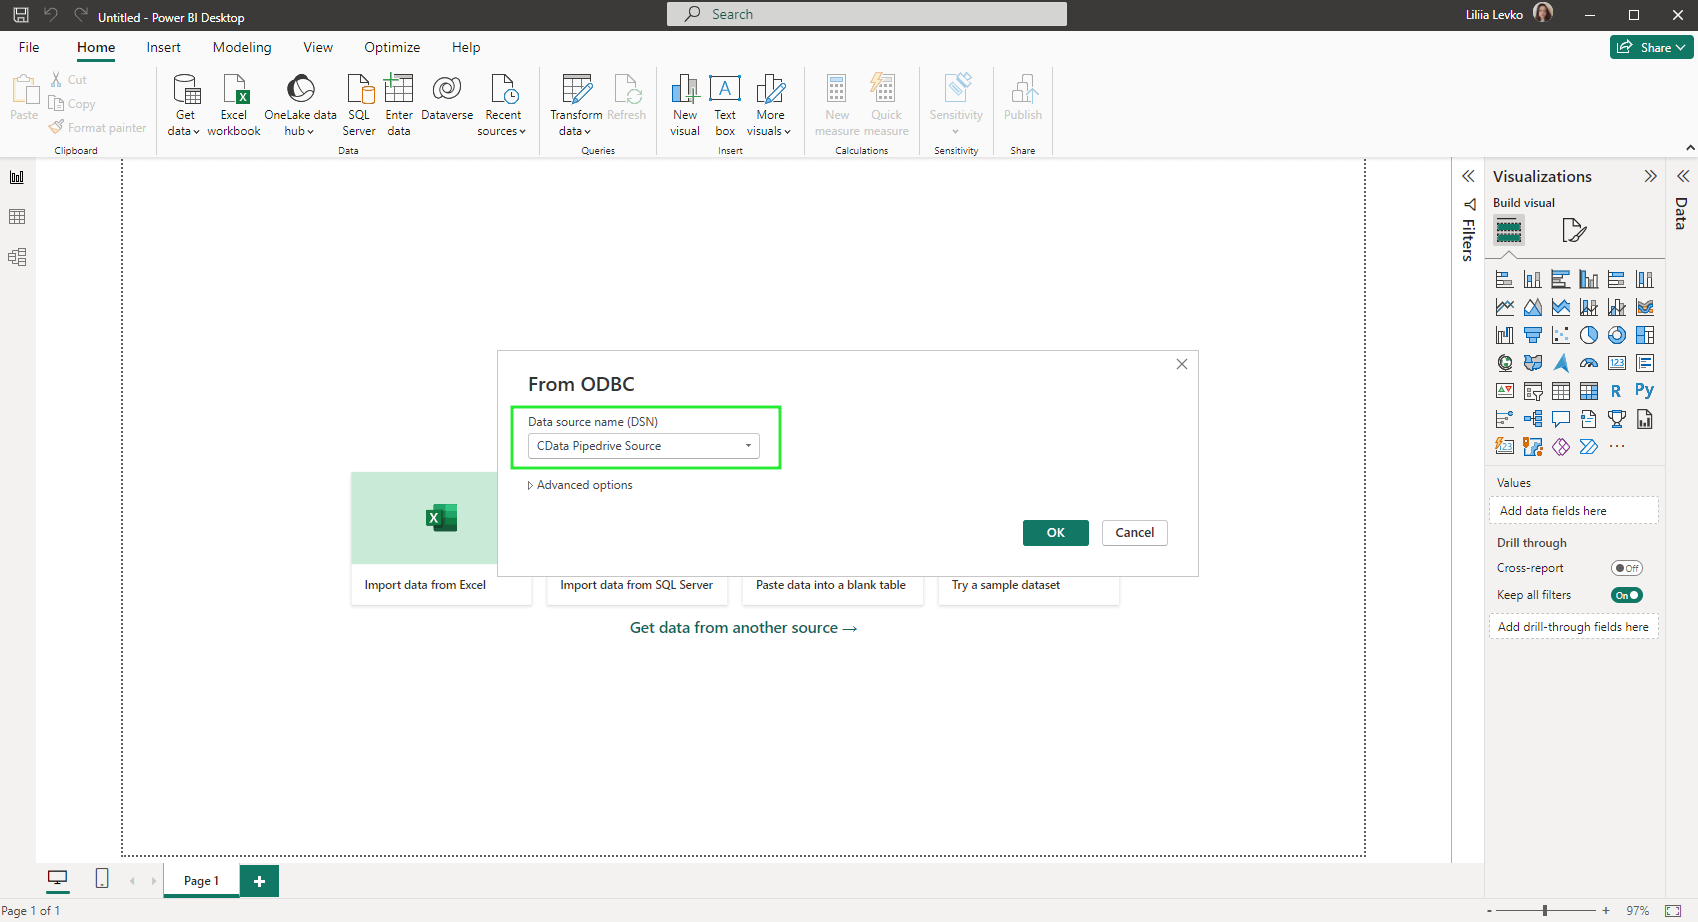
In Power BI, go to Get data -> More… and type ODBC in the search bar. You will see a list of apps that you can connect to using ODBC, so select CData Pipedrive Source from the list.
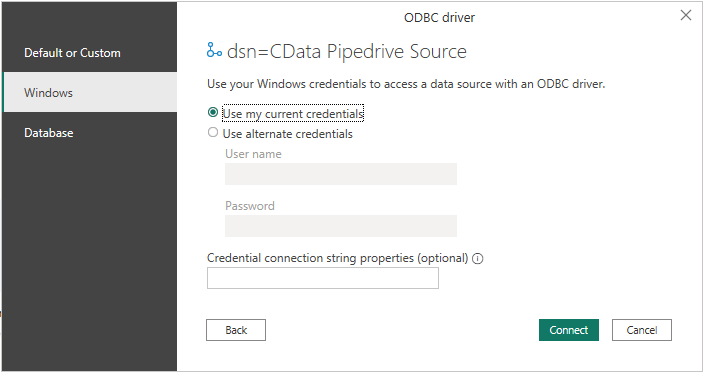
Then, the system will ask you to indicate the preferred way to connect to Pipedrive: using either Windows login details or Pipedrive credentials. Just a piece of advice – use the Windows credentials, as this will simplify and automate things further.
Finally, when Power BI and Pipedrive are connected, you’ll see the data schema folder in the Navigator window. Select the desired tables for data preview and import.
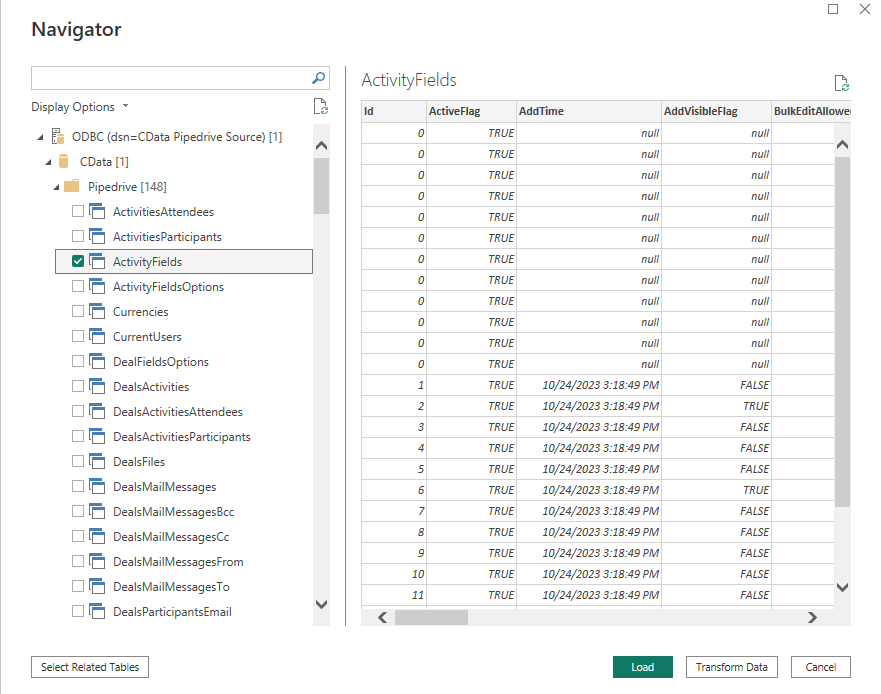
Power BI also allows you to make operations over data upon loading to prepare it for analysis. This step isn’t obligatory, but it’s just for you to keep in mind that this option exists.
Well, this method is obviously more tedious than integration with Coupler.io.
Power BI Pipedrive integration using API
After having observed such high-level methods with no coding, it’s time to explore other layers of the technical stack to connect Pipedrive to Power BI. Most marketers and sales managers don’t heavily rely on API integration, though if you want to dive deeper into this method and know its benefits, let’s proceed.
Pipedrive app provides RESTful API to be used by developers for extracting the data from a CRM. There are also helpful tools, such as Postman, that assist developers in building APIs. So, make sure you have explored the basics of Pipedrive API and installed Postman on your computer.
- Follow this link to open and add the Pipedrive API collection to your workspace on Postman.
- In your Pipedrive personal profile, find your personal API token.

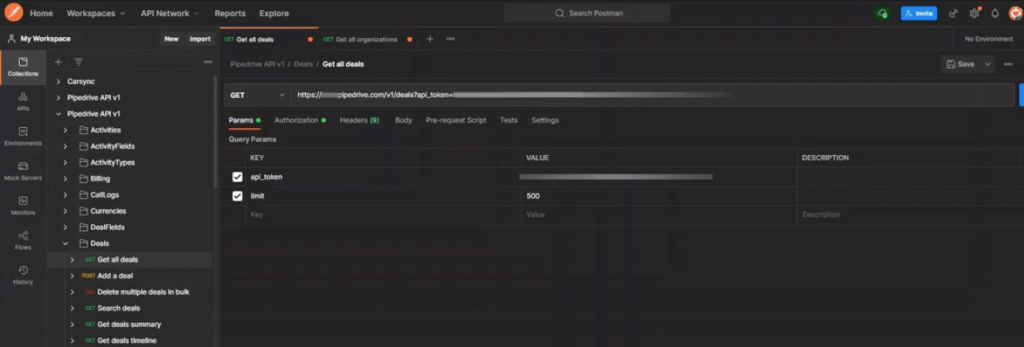
- In Postman, choose the collection and the object of your interest. Let’s take Deals, for example.
- Insert your personal API token in the corresponding parameter field, adjust the organizational Pipedrive URL, and indicate other parameters for the selected object. Copy the URL address.
The table with the populated data appears so you can start working on your analytical tasks right away!
As you’ve seen, creating APIs manually to connect Pipedrive to Power BI could be a pain because it’s necessary to keep in mind many minor details and coding. But those who want to obtain superior flexibility are welcome to try this method out. APIs broaden the spectrum of functions to perform on data, so you can even merge or get a deal summary.
How to select the best way for Power BI Pipedrive integration
Well, now it’s time to make a decision on how to organize the Pipedrive Power BI integration. Remember that each of those approaches will connect sources, though it’s the speed of data load that matters, and so the productivity of your business does. For that, let’s get back to our travel metaphor and associate them with each of the three ways of Pipedrive to Power BI integration.
- Creating APIs is like going by car – you can adjust your route to the desired extent. However, the journey isn’t that fast, and overall, you’ll feel exhausted.
- Sending Pipedrive to Power BI using an ODBC driver as an intermediary is similar to the bus trip. It might not be very convenient and suitable for everyone, but it still takes you to the right destination.
- And finally, the fastest and the easiest way is to use Coupler.io – it’s like taking a plane. So, you get to the destination fast at a fair price, which gives you the possibility to spend time on creative and business development tasks.
Accelerate your data travel between Pipedrive and Power BI!
Automate Pipedrive data export with Coupler.io
Get started for free


