Data filtering is crucial when you need to extract valuable insights from complex datasets. There are a couple of DAX filter functions that you can use but we’ll focus on Power BI All Except here. Let’s discover its syntax and show how to apply this function to your data.
Let’s define: What is All Except in Power BI?
The All Except function lets you remove all context filters except for those that have been applied to specific columns. If you have an expression to evaluate, you can apply All Except to modify the filter context for the table and only calculate for the columns mentioned.
What is the difference between context filters and normal filters?
- A normal filter is applied directly to columns in your data model. It displays particular data in visuals based on certain criteria. You can apply via filtered measures using functions such as FILTER and VALUES. But it’s much easier to use slicer or navigate to the filters pane and apply filters on each visual or page.
- On the other hand, a context filter is applied based on the context of your report. The two types of context filters – rows context and filter context. Row context is filtering applied at the row level, while filter context is the overall filter context applied to a visual or calculation. You can modify context filters by using DAX functions to control how calculations are evaluated in your Power BI report.
What are the function’s syntax and parameters?
Here’s the syntax for Power BI All Except:
ALLEXCEPT(<table>,<column>[,<column>[,...]])
The parameters of this function include:
table– The table from which to remove all context filters while preserving those on columns being mentioned.
column– Any column specified in the function arguments.
Return Value
A table with all filters removed except for the filters on the specified columns.
Parameter Rules
- You can only use All Except as an intermediate function that changes the set of results when another calculation is being performed.
- In DirectQuery mode, you won’t be able to use the function in calculated columns or row-level security (RLS) rules.
What are other functions to remove filters in Power BI?
| Syntax | Description |
ALL(Table) | Removes all filters from the specified table. It returns all the values but removes all context filters that may have been applied. |
ALL(Column[, Column[,...]]) | Removes all filters from specified columns but all other filters from other columns still apply. You can use it to remove filters from one or more columns within the same table. |
REMOVEFILTERS(Table/Column) | Removes all filters applied to the specified table or columns. It returns all values without any context filters. |
REMOVEFILTERSALL(Column[, Column[,...]]) | Removes all filters applied to the specified columns while keeping filters on other columns intact. |
CALCULATE(expression, REMOVEFILTERS(Column[, Column[,...]])) | Calculates a result while temporarily removing filters from specified columns. |
ALLSELECTED(Table/Column) | Returns all values, ignoring any filters except for those applied by slicers or explicit filter functions like ALLSELECTED. |
REMOVEFILTERSExcept(Table, Column[, Column[,...]]) | Removes filters from the specified table except for those applied to the specified columns. |
REMOVEFILTERSALLEXCEPT(Table, Column[, Column[,...]]) | Removes filters from all columns except for the specified columns in the specified table. |
How to perform advanced filtering with Power BI All Except?
To apply filters and hence remove them using the All Except DAX function, you need data. You can get the data to Power BI using the native connectors. However, they do not support most of the cloud services. In this case, you can use Coupler.io. It’s a reporting automation platform that lets you connect over 60 apps to Power BI including GA4, Google Search Console, advertising platforms, and so on. It also provides automatic data refresh that updates your dataset on a set schedule.
To add data to Power BI with Coupler.io, select your data source in the form below and click Proceed :
If you’re using Coupler.io for the first time, then create an account for free. After that, you need to:
- Connect your source app’s account, and select the data you want to load to Power BI.
- Preview and organize the data, if needed. You can filter and sort data, change how columns are arranged, and use formulas to calculate values for new columns.
- Load data to Power BI and schedule data refresh.
With your data ready in Power BI, it’s quite easy and straightforward to apply the function. Here are the steps:
- Select New Measure from the menu bar. You can find it under the Home tab.
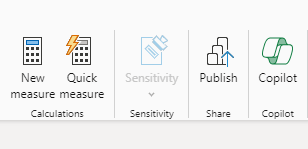
Or you can also locate it right under the Modeling tab.
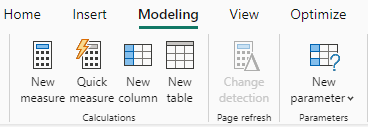
- Write your DAX expression
Make sure to enter a name for your measure or column before writing the function. And remember that a DAX expression usually comes first before the All Except function.
All Except Power BI use case examples
Use case 1: Remove context filters on a sales dataset
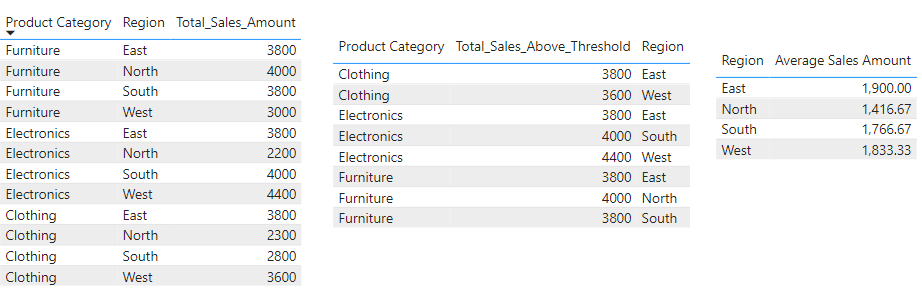
Here’s a sales table with columns for product categories in different regions and their corresponding sales amounts. You can use All Except DAX to only perform calculations on columns mentioned within the function’s arguments and exclude all other columns.
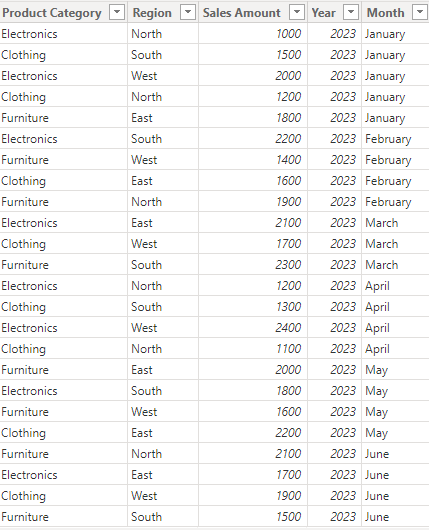
We’d like to analyze this dataset in a couple of ways. First, we can calculate the total sales amount for each product category.
Total_Sales_Amount = SUM('Sales'[Sales Amount])
Next, we can add a filtered measure that evaluates whether the total sales amount for each product category exceeds the specified threshold. The FILTER DAX function applies a normal filter to the Product Category column to only include those categories where the total sales amount is greater than 3500.
Total_Sales_Above_Threshold = CALCULATE ([Total_Sales_Amount], FILTER (VALUES ('Sales'[Product Category]), [Total_Sales_Amount] > 3500)
Lastly, we can create a measure that calculates average sales amounts across all regions but removes the context filters on all other columns. It modifies the filter context to only include the Region column and then calculates within that specified context.
Average Sales Amount = CALCULATE(AVERAGE('Sales'[Sales Amount]), ALLEXCEPT('Sales', 'Sales'[Region]))
This report shows the new measures respectively (left to right):
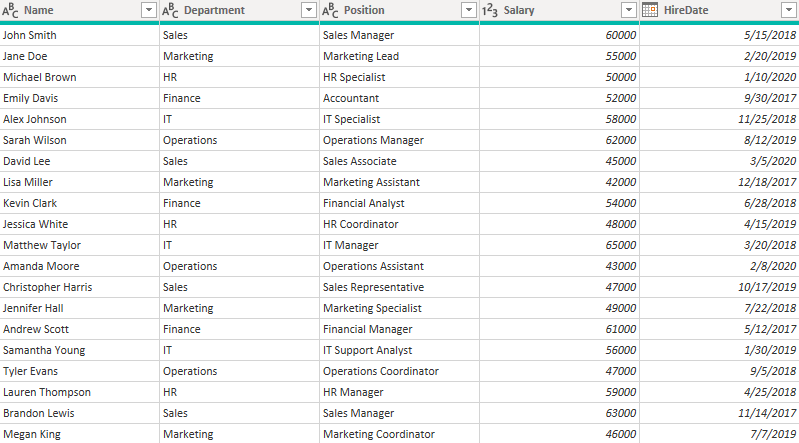
Use case 2: Remove context filters on an employee records dataset
Here is an Employee Records dataset for which we’ll make some examples of using the ALL Except function.
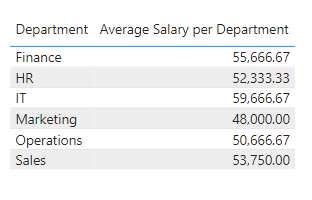
You can calculate the average employee salary for each department by preserving the context filter for the Department column. Here’s the formula:
Average Salary per Department = CALCULATE (AVERAGE ('Employee_records'[Salary]), ALLEXCEPT ('Employee_records', 'Employee_records'[Department]))
The result:
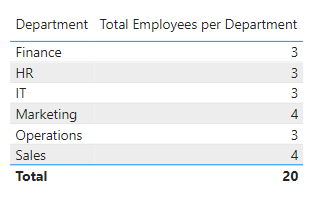
Similarly, you can calculate the total number of employees in each department with:
Total Employees per Department = CALCULATE (COUNTROWS('Employee_records'), ALLEXCEPT ('Employee_records', 'Employee_records'[Department]))
The result:
Note: When you create a new measure, it only adds a column to your table. Before you can use it for analysis, you need to add a visual such as a table, matrix, bar chart, etc. Then, you’d add the specified column(s) and the new measure to the visual for display.
What are the possible uses of the All Except function?
You can use it to calculate within a particular context:
- Preserve filters: You can use All Except to preserve filters on specific columns while removing filters from all other columns. It allows the DAX expression to only be evaluated for those columns that are within the modified filter context.
- Compare values: After calculating data based on certain dimensions i.e. context filters on specified columns, you can compare the values across different visuals. This helps to take a closer look and also check for consistency in your dataset.
- Create dynamic measures: You can use Power BI All Except to remove filters so that your measures can focus on one or more columns. It can be used together with other DAX functions and allows you to change the context filter as required.
- Precise analysis: With this function, you can analyze each dimension carefully and understand the detailed insights. It enables you to focus each measure or visual on a few dimensions rather than analyzing every data column at once.
Best practices of Power BI All Except
The function allows users to preserve context filters and improve data analysis. Let’s discuss some tips that can help you ensure its accuracy and efficiency.
- It’s possible to use multiple columns in the preceding expression and also in the All Except function’s arguments. Make sure you understand your data model and how the columns are related before attempting to apply the function.
- Know when to use the function and when not to use it. Many DAX functions can definitely be used alone to create a simple calculated column. They include SUM, AVERAGE, RANKX, IF, COUNT, CONCATENATEX, RELATED, FORMAT, etc.
- You can experiment by using various expressions to create complex calculations while adjusting the context filters to exclude irrelevant columns. This allows you to calculate values for specific dimensions and focus your analysis on them.
- It’s a good idea to document your DAX measures, especially those using the All Except function. This can help you remember the logic at a later time and allows others to understand the calculations and the filter context being preserved.
- Make sure to test your measures or calculated columns in a visual. You should verify the accuracy of your calculations and whether it aligns with the specified columns. This ensures that your DAX measures have no errors whatsoever.
Optimize selective data filtering in Power BI with All Except
Power BI All Except is a versatile function that allows you to control the filter context in your DAX calculations. It removes context filters on all other columns but preserves those on specified columns. This way, you can analyze precise data in complex and large datasets.
This DAX function is often used within a CALCULATE function to evaluate an expression and also modify the filter context for the table. The first argument has to reference the base table, while subsequent arguments should be references to one or more base columns. Although you can use All Except in measures or calculated columns, it cannot be used in table expressions and column expressions.
In Power BI, there are functions to work with filters, such as ALLSELECTED, KEEPFILTERS, REMOVEFILTERS, and the ALL function.
But before you can filter data, you need to import it into Power BI. Instead of doing this manually, use Coupler.io. It allows you to connect 60+ data sources to Power BI and schedule data refresh in your reports.
Connect your data sources to Power BI with Coupler.io
Get started for free


