Is your data stuck in a time warp? Or are you looking to fully utilize time intelligence in your reports? Well, the missing piece might be a well-crafted calendar table.
This guide offers you 3 methods to create effective calendar tables in Power BI, along with customization tips and best practices. Let’s build your time machine for data exploration!
What is a Power BI calendar table?
A calendar table is a crucial component for time-based analysis and reporting within Power BI. It is a dedicated table that includes a comprehensive list of dates, usually spanning over a significant period, such as several years, months, days, etc. Calendar tables are often referred to as date tables.
They help you organize and manage time-related data. Power BI calendar tables let users:
- Filter data by date range: Drill down into specific periods (e.g. focus on sales from Q4 2023).
- Group data by time: Analyze trends by month, year, or even fiscal quarters.
- Create time-based calculations: Calculate year-over-year comparisons or rolling averages.
Key features of a Power BI calendar table
- Date range: Contains a continuous sequence of dates over a specified period, ensuring no gaps in the timeline.
- Hierarchical structure: Includes columns for various date parts such as year, quarter, month, week, and day, facilitating detailed and aggregated analysis.
- Fiscal calendars: Supports custom fiscal year definitions, which are crucial for businesses with non-standard fiscal years.
- Holidays and weekends: Optionally incorporates information on holidays and weekends, aiding in more accurate working day calculations.
- Time intelligence: Enables advanced time intelligence functions like year-over-year comparisons, moving averages, and cumulative totals.
How to create a calendar table in Power BI: 3 easy methods/Step-by-step guide
You can create a Power BI calendar table using 3 easy methods:
- Default auto date/time option
- DAX function
- Power Query
To create a calendar table using any of the methods above, you need to connect your data source and load the dataset. Before that, make sure the date column encompasses a continuous range of dates or a calendar year. Also, there are no gaps or missing days.
To load the dataset, go to your Power BI desktop ?? Get Data. Next, select your data sources like Excel, CSV, JSON, Google Sheets, MYSQL database, etc., and connect it to the Power BI.
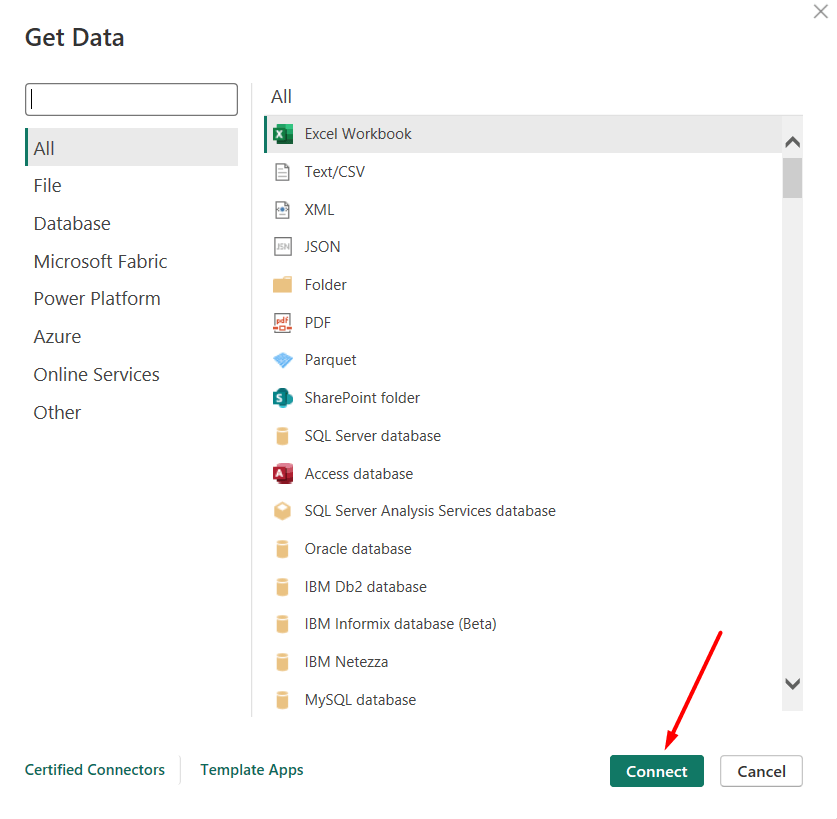
However, Power BI doesn’t support some data sources by default like PPC platforms, marketing, and business intelligence tools etc. To add these sources, you can use Coupler.io.
Coupler.io is a reporting automation solution compatible with over 60 cloud apps, including Google Analytics, Hubspot, Google Ads, and many others. You can sign up for a free Coupler.io account (no credit card required) and effortlessly establish connections with your preferred apps. Try it yourself right away.
Simply select your source in the form below and click Proceed.
Then complete the connection setup following the in-app instructions. At the final step, you can automate data refresh on a schedule to make your Power BI report always up-to-date.
Connect your data source to Power BI with Coupler.io
Get started for freeMethod 1: Make automated calendar tables with auto date/time function
In Power BI, there’s an automatic built-in Calendar Auto Date/Time function to create a calendar table. This function helps to hierarchize all date fields and simplify time intelligence tasks such as filtering, grouping, drilling down, etc.
To create an automated calendar table in Power BI, you need to enable the time intelligence setting.
- Navigate File ? Options and Settings and click on Options
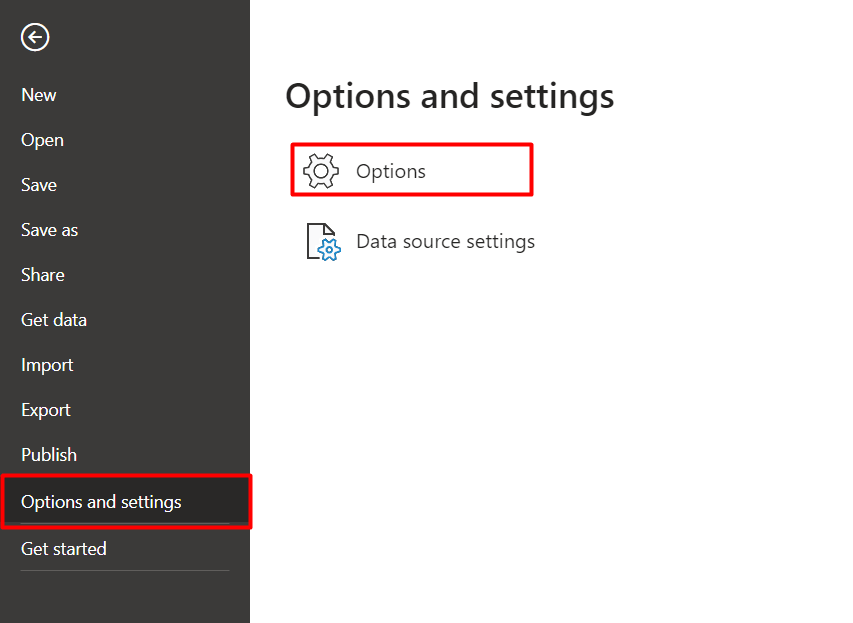
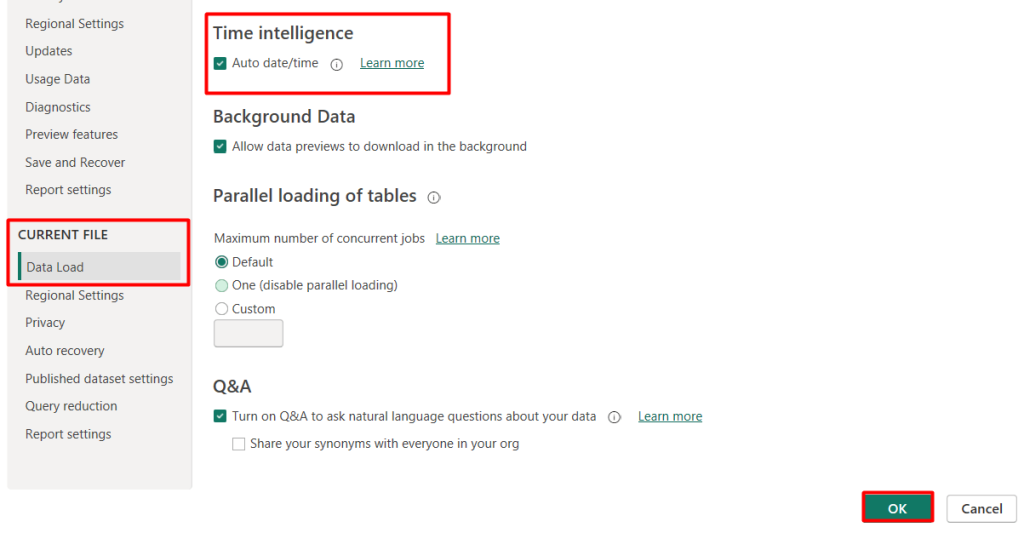
- Go to the CURRENT FILE section and click on Data Load. You can see the Time intelligence option.
- Enable the check mark of the Auto date/time box and click Ok.
Now, you need to simply grab a field containing time intelligence data e.g. Date and drop it on the Value input option. You can see all the associated columns, such as Year, Quarter, Month, and Day.
This function automatically creates a calendar table with rows and columns in Power BI canvas.
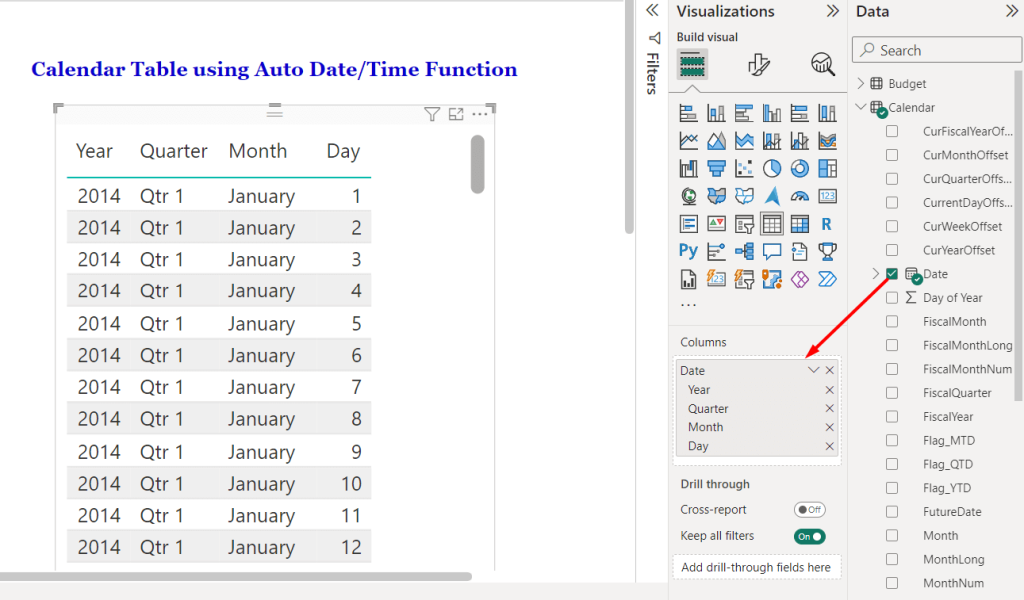
This default auto date/time functionality eliminates the need for manual calendar/date table creation. Overall, it ensures consistent date handling across the dataset in Power BI.
Method 2: Create a calendar table in Power BI using DAX functions
The auto date/time function is convenient but can be limited by performance issues and a lack of customization options for advanced scenarios. In that case, you can use the Data Analysis Expressions or DAX function to create a calendar table in Power BI.
DAX is a powerful formula language used in Power BI for custom calculations and data analysis. There are 2 ways to make a calendar table using the DAX expression: CALENDAR and CALENDARAUTO DAX.
Both DAX expressions offer precise control over date ranges while making calendar tables. Using the DAX function, you can add custom columns beyond just the date, such as year, month, quarter, or day of the week, enriching your analysis.
Let’s see how to write the DAX expressions to create personalized and advanced calendar tables in Power BI.
Create a Power BI Calendar table using the CALENDARAUTO function
To create a new calendar table, navigate to the Report View by clicking the icon on the left pane of your Power BI dashboard.
- Go to the Modeling tab in the ribbon and click on New Table
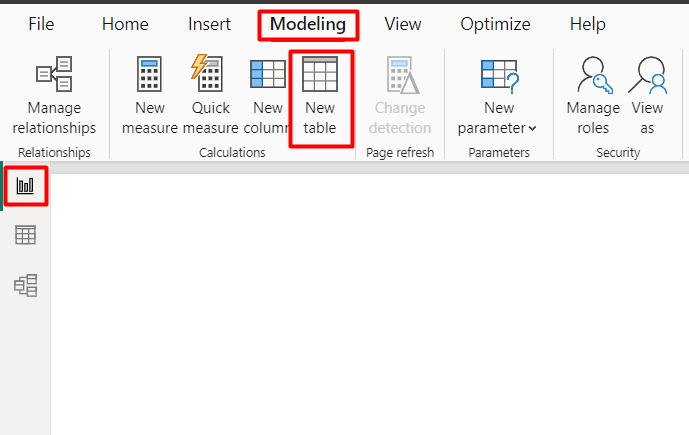
- Write the preferred table name, e.g. Calendar_DAX Table, enter the following CALENDARAUTO DAX formula, and click enter:
Calendar_DAX Table = CALENDARAUTO()
This will scan other tables in your data model and figure out the date range and create a new table accordingly.
Next, go to Table View and you can see a new calendar table named Calendar_DAX Table in the Power BI report.
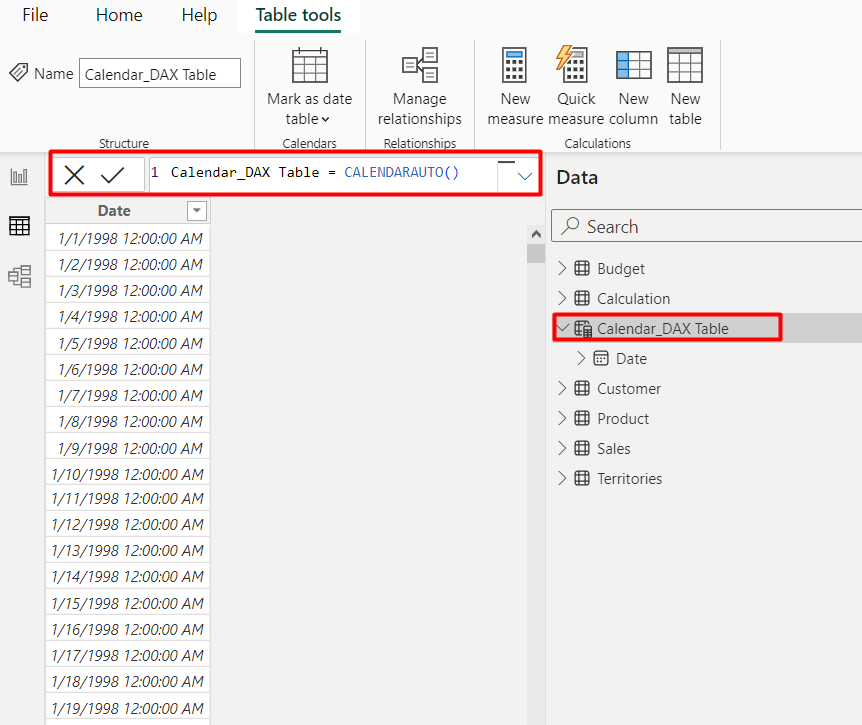
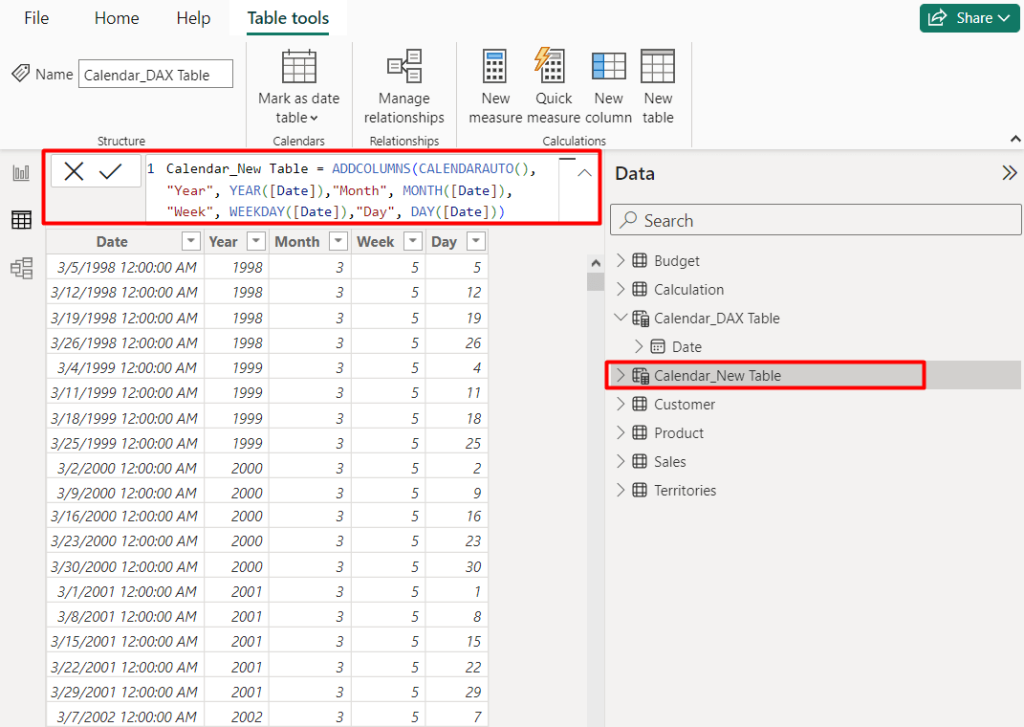
As this CALENDARAUTO DAX has one parameter of [FasicalYearEndMonth], it returns a single column of date/time values. However, you can use the ADDCOLUMNS function to add customized columns as per your needs.
For instance, you want to create a calendar table containing year, month, week, and day columns. You can write the following expression to create a customized calendar table for the entire date range:
Calendar_New Table = ADDCOLUMNS(CALENDARAUTO(),"Year", YEAR([Date]),"Month", MONTH([Date]),"Week", WEEKDAY([Date]),"Day", DAY([Date]))
Power BI calendar table using CALENDAR DAX function
To add more control over your data model, you should go for the CALENDAR DAX function. This allows you to define a specific date range, e.g. sales translation with starting and ending dates.
You can also use this DAX expression to extract additional components like year, quarter, month, week, day of the week, or even fiscal periods. These columns can be crucial for filtering, grouping, and creating time-based hierarchies in your reports.
Here’s how you can create a Power BI calendar table with the CALENDAR DAX function:
- Navigate to your Power BI desktop app. Create a new table like the previous method.
- Set the preferred name, such as Calendar_Table, and enter the required start date and end date.
Calendar_Table = CALENDAR("1/1/2022", "12/31/2023")
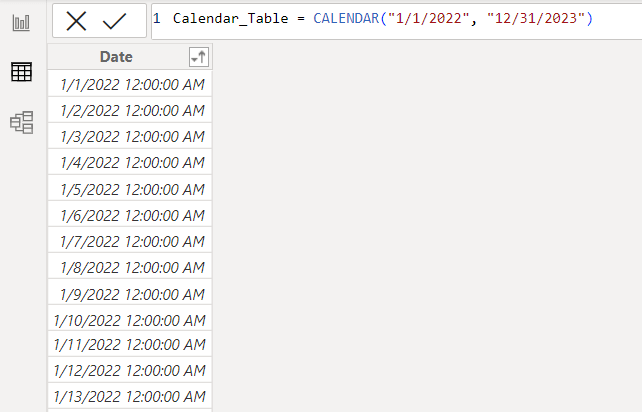
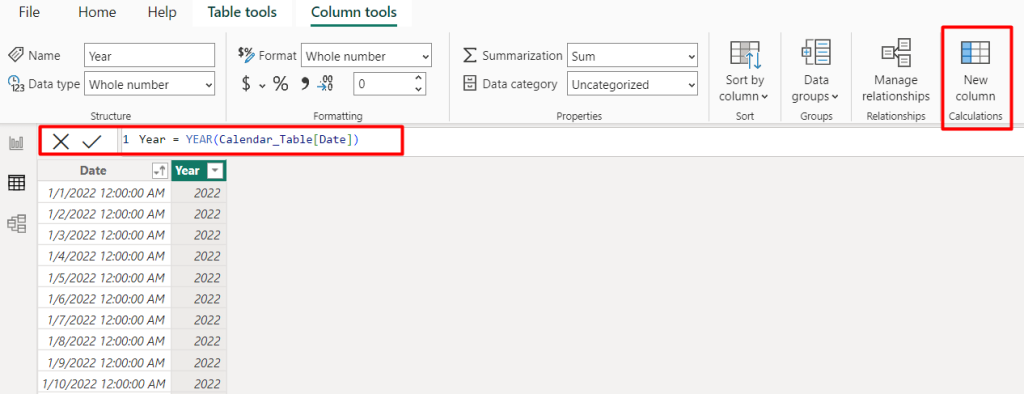
This creates a single-column calendar table with the given date range. You can also add additional columns based on your needs. To add a single column, click New column.
Next, write the DAX function for the new column. For example, if you want to show the year column, you can write the following expression:
Year = YEAR(Calendar_Table[Date])
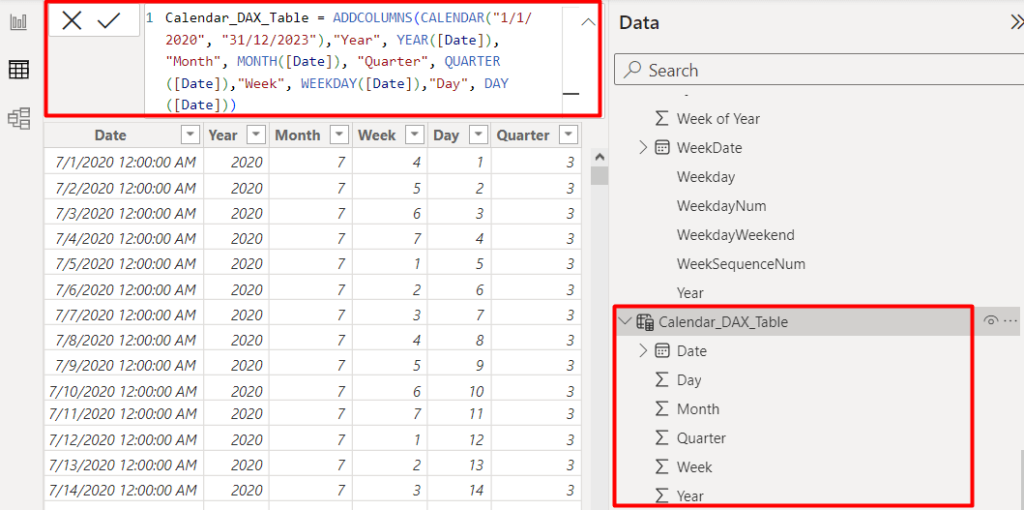
To add multiple columns in your calendar table with a definite date range, you can use the ADDCOLUMNS functions like the below example.
Calendar_DAX_Table = ADDCOLUMNS(CALENDAR("1/1/2020", "31/12/2023"),"Year", YEAR([Date]),"Month", MONTH([Date]), "Quarter", QUARTER([Date]),"Week", WEEKDAY([Date]),"Day", DAY([Date]))
The newly created Power BI calendar table shows the year, month, week, day, and quarter columns for the given date range of 1/1/2020 to 31/12/2023.
Method 3: Create a custom and dynamic calendar table using Power Query
Crafting a custom calendar table using Power Query provides more flexibility and control over your data analysis, additional date-related columns, and potential future adjustments.
This method is also known as M-Query or mash-up language. This way, you can effortlessly filter, group, and combine data from multiple sources for accurate and insightful exploration.
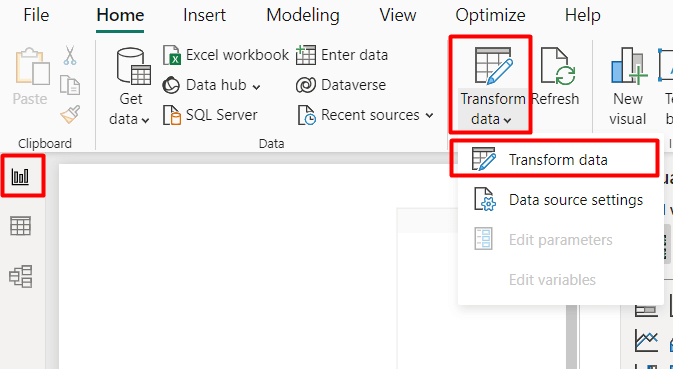
To use Power Query, go to your Power BI canvas and load your data model or start with the imported model:
- Click on Report view then select Transform Data from the top pane. This opens a new window with all other queries.
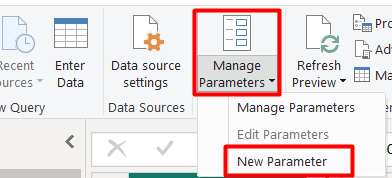
- Next, navigate to Manage Parameters ? New parameters. You need to create 2 parameters for start and end date of your calendar table
- Enter a new parameter as StartDate
- Add a description (optional), e.g. sales campaign starting date
- Select the data type as Date (mandatory)
- Write the starting date as per your calendar requirement and click OK
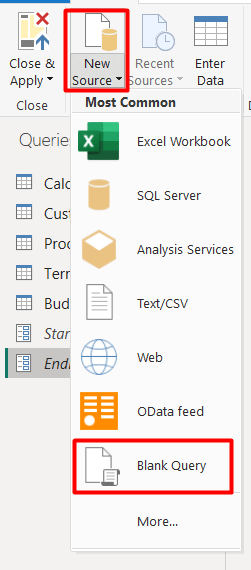
Now, you need to create a new query file. Navigate to New Source ? Blank Query
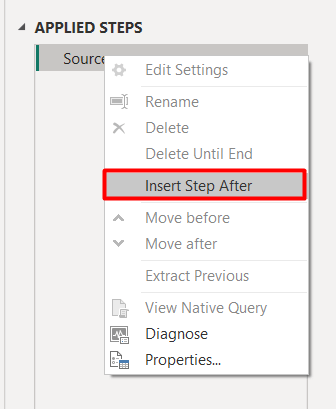
Write the name such as Calendar_PowerQuery_Table. You need to define the starting and end date of your calendar table. For this, right-click on Source .? Insert Step After
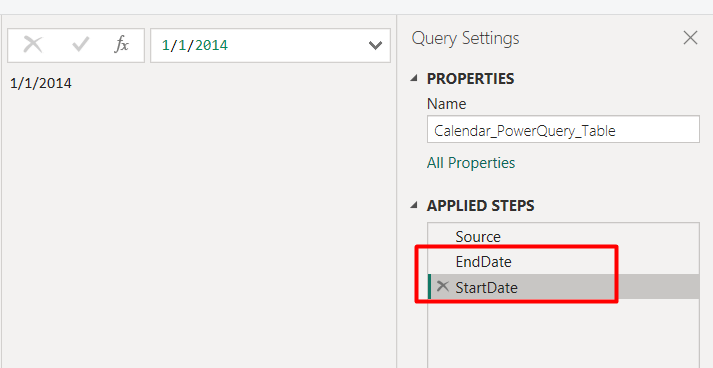
Next, create 2 new files and define the start and end date range as StartDate, EndDate
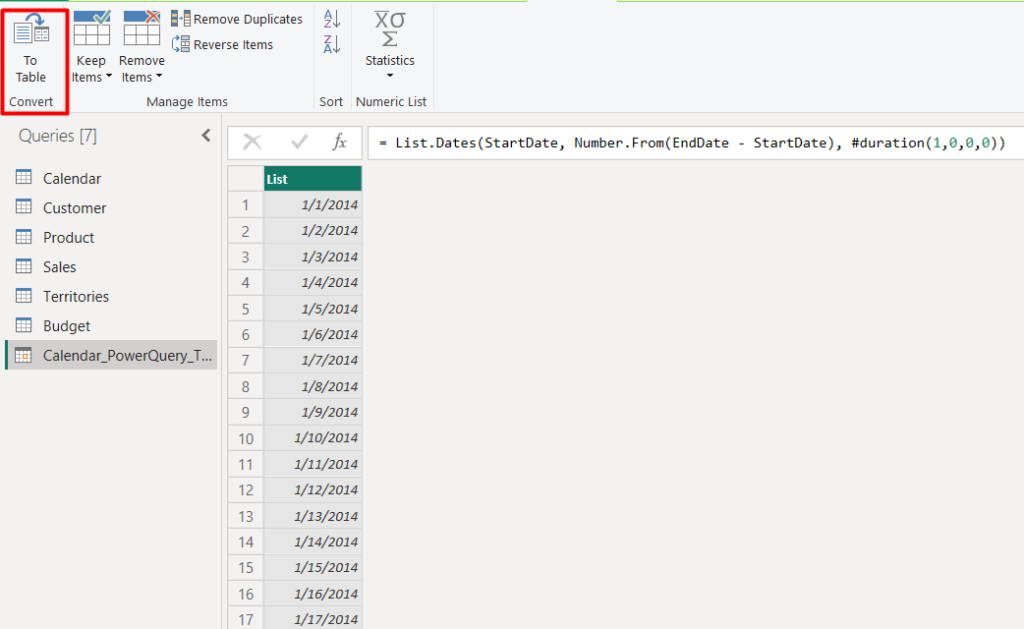
Next, you need to generate a list of the dates. Create another query file, then write the following power query:
Fx = List.Dates(StartDate, Number.From(EndDate - StartDate), #duration(1,0,0,0))
Now, convert this list of dates into a table by clicking Convert To table.
Now, simply rename it as Date and set the data type as Date. Otherwise, the Power Query won’t work for your time-based analysis.
Now, you can create new columns to this calendar or date dimension table dynamically to add other components like year, month name, month number, week, week number, day, the start of month, end of week, quarter of the month, etc.
- Click Add column
- Click Date ? Select various date attributes for the calendar from the drop-down options
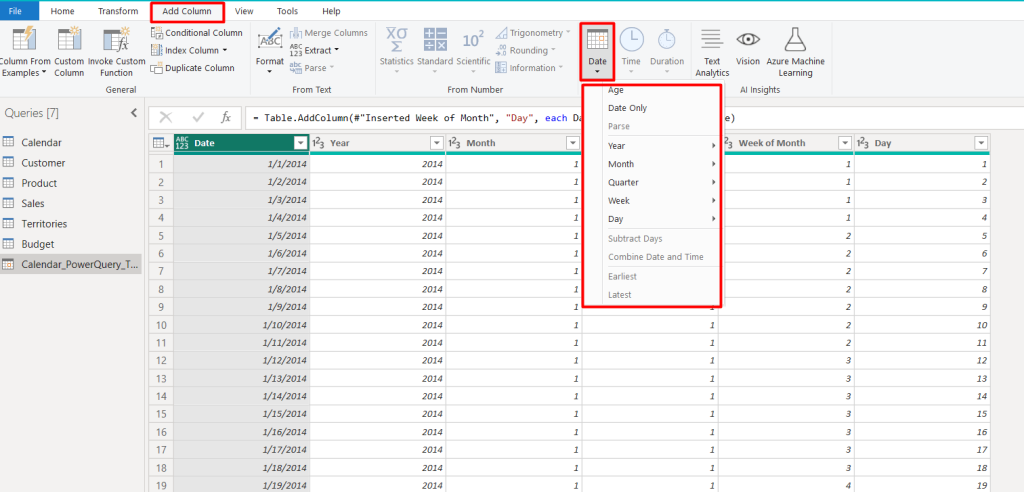
This approach gives you dynamic date ranges and customizable date attributes for comprehensive time-based analysis.
How to customize Power BI calendar table
You’ve built your calendar table in Power BI – congratulations!
But the journey doesn’t end there. A well-customized calendar table is the heart of powerful time intelligence in Power BI. You can personalize your table, transforming it from a simple date list to a dynamic analysis tool.
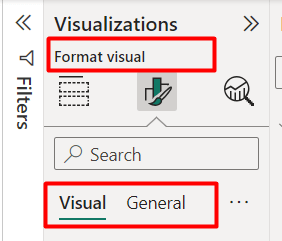
Power BI offers customization options and they are the same whatever method you follow to build the calendar table. Simply drag and drop the calendar table into your Power BI dashboard. You can see the Visualizations pane on the right side of the Power BI dashboard.
Go to the Format visual tab. Here, you’ll find 2 options for customizing your calendar table such as Visual and General.
Visual settings
In the Visual settings, you can see 10 different styling options. Let’s see how you can utilize the Visual settings to personalize the calendar table in Power BI.
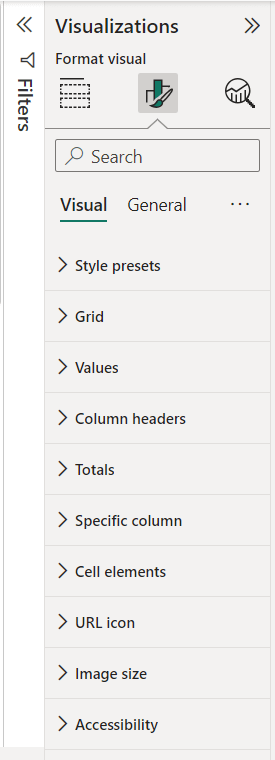
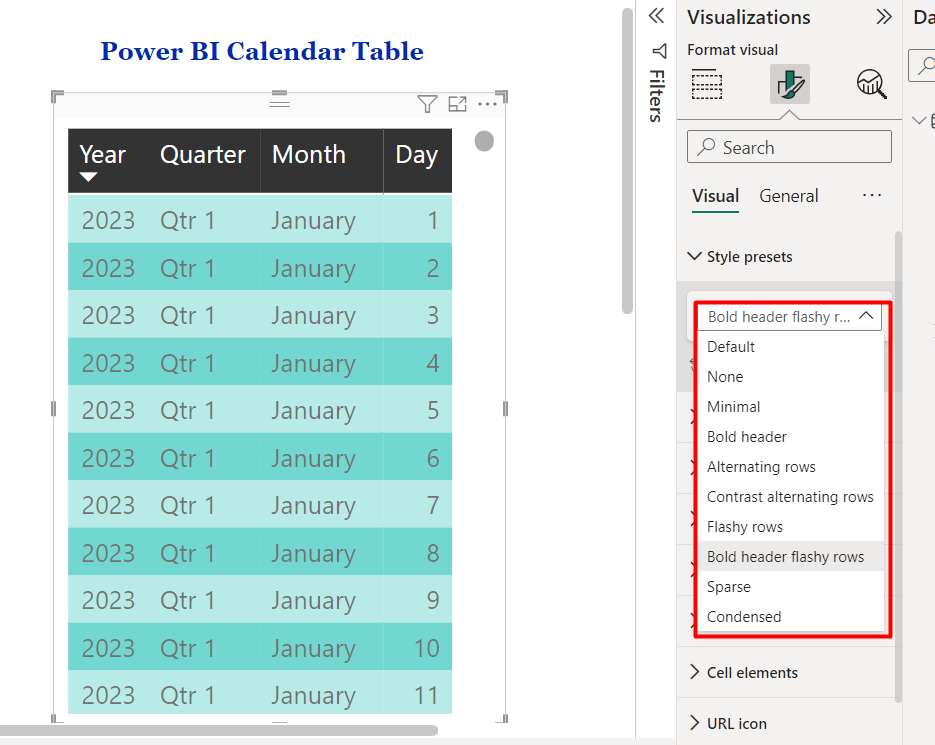
1. Style presets: You can swap the default calendar table look with a variety of pre-designed styles for a quick and easy makeover.
You can choose from options such as Minimal, Bold header, Alternative rows, Bold header flashy rows, and so on. These styles will control overall aesthetics and give a consistent appearance.
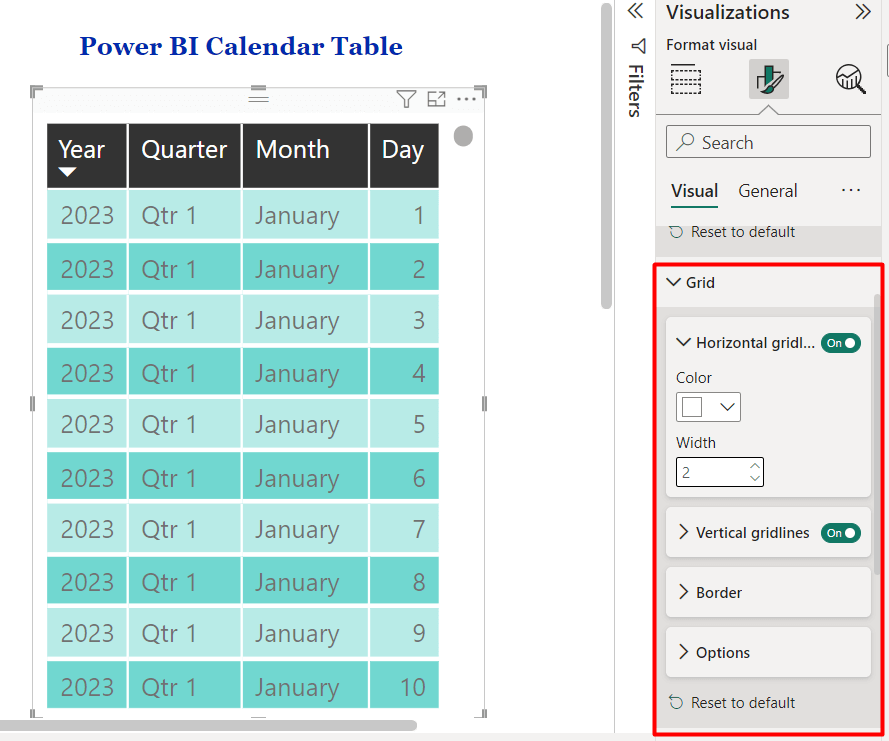
2. Grid: You can turn on the horizontal/vertical grid option to fine-tune the table’s overall appearanc. Also, there are settings for adjusting line thickness, background color, and cell borders.
In our case, the grid color is white and the width is 2px. You can simply customize the gridlines border, padding, and font size to enhance the readability and structure of your table.
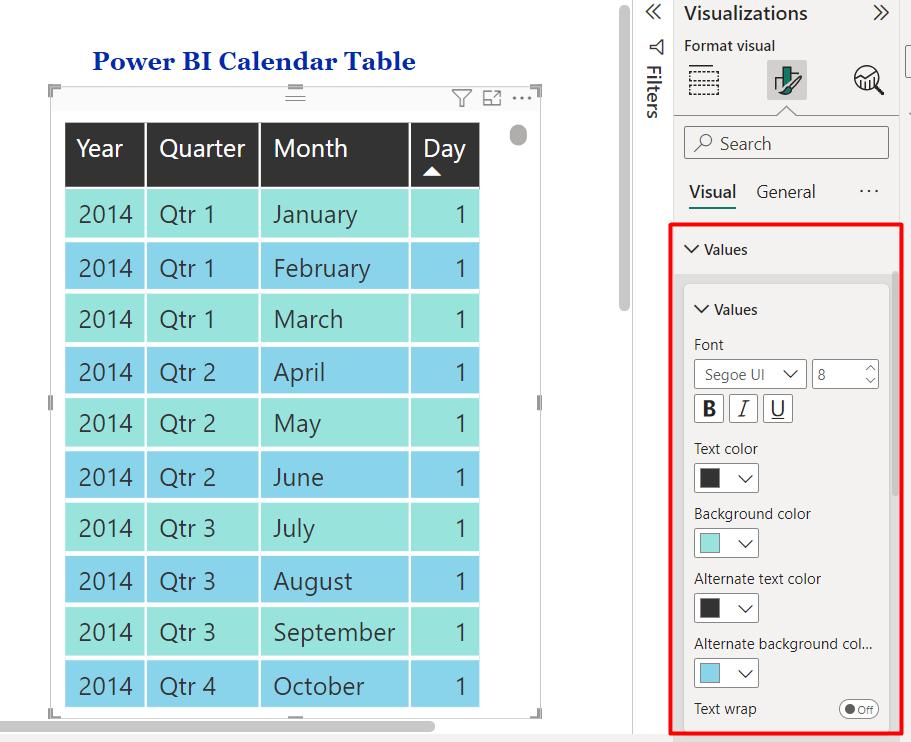
3. Values: In the Values section, you can control how your data is displayed within the cells. You can change the font family, font size, and font style (bold/italic/underline).
You can also adjust the font color, background color, and alternative text color to enhance the clarity of your Power BI calendar table.
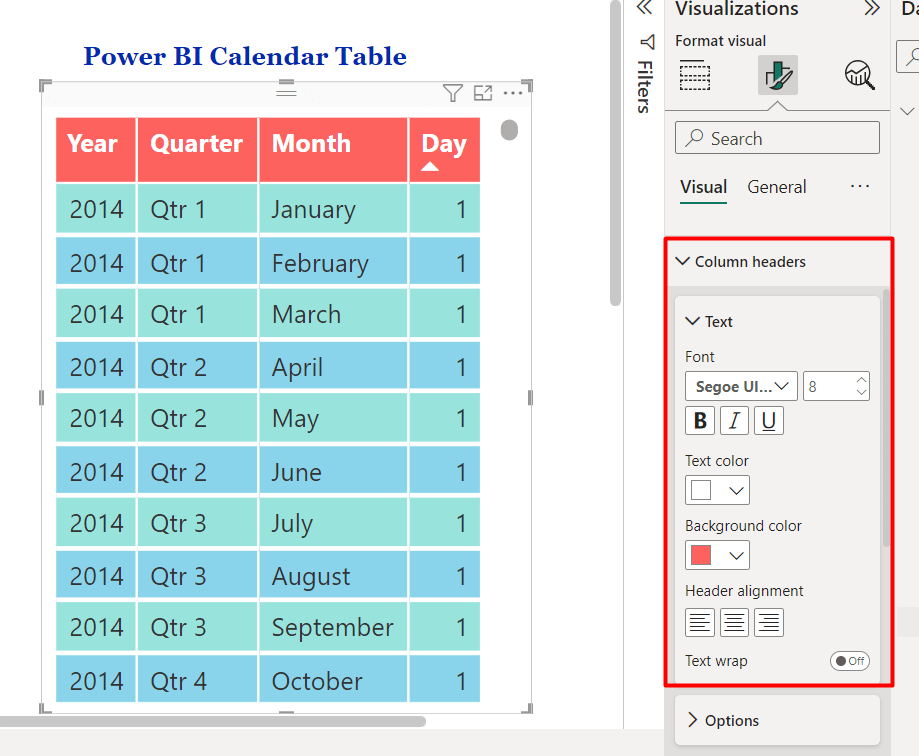
4. Column headers: Style the column headers to differentiate them from the rest of the table. Simply change the font style, size, color, and alignment and auto-size width settings to make table headers distinct and easy to read.
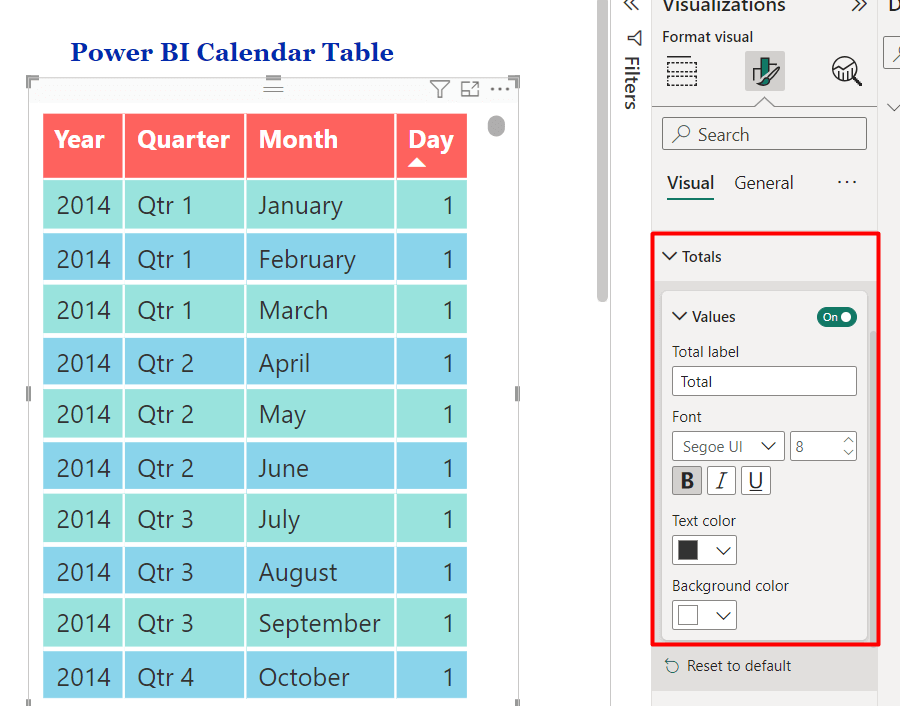
5. Totals: You can format the total rows or columns to emphasize summary data. Adjust the font family, size, weight, color, and background to make totals stand out and easily noticeable.
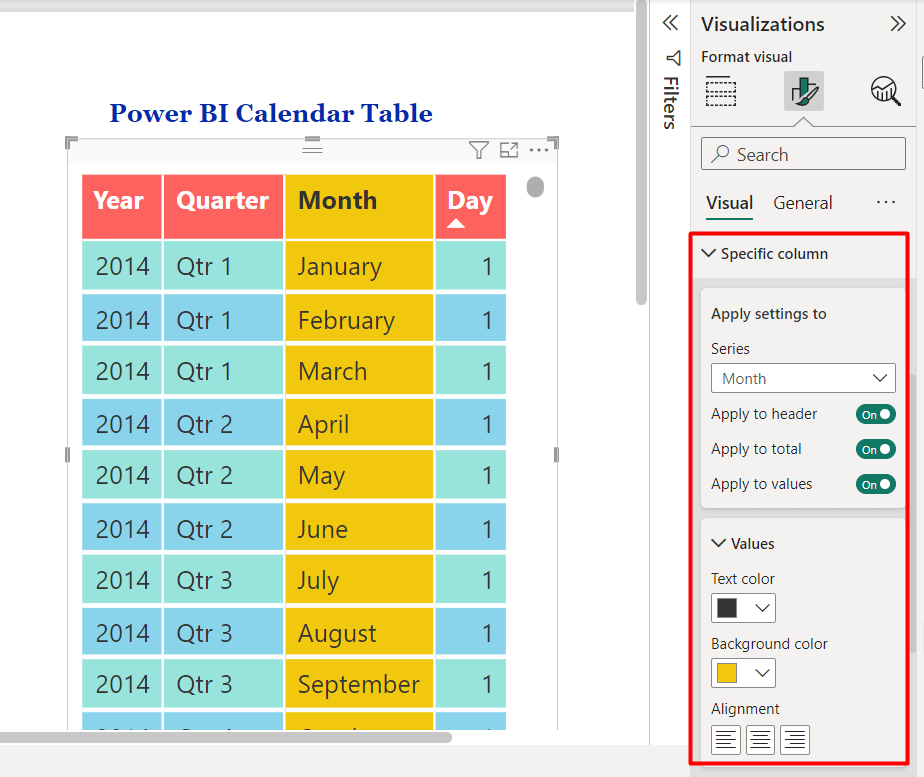
6. Specific column: In case, you want to highlight or focus on specific column(s), you can use this settings. You can apply unique formatting to individual columns for better differentiation or emphasis.
Select the column, e.g. year, month, then customize background colors, text alignment, and other properties for selected columns to highlight key data.
7. Cell elements: Cell elements is an interesting and useful setting for calendar table customization in Power BI. You can fine-tune the appearance of individual cells within the table using simple conditions.
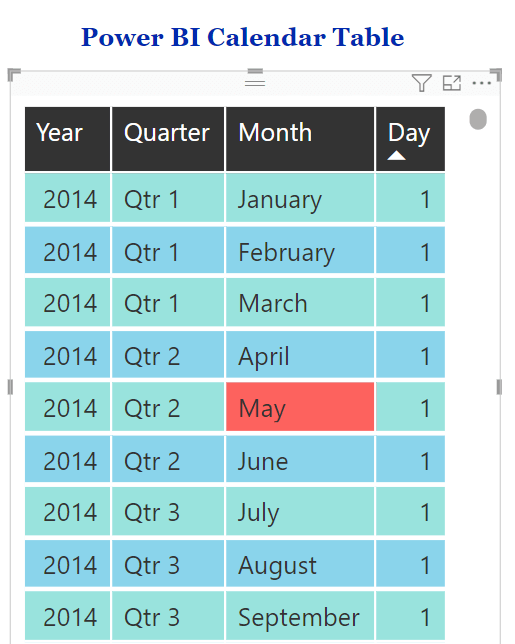
For the above table, when the value of the month “May” arrives in any cell, the background will automatically be red. To do this, turn on the Background color toggle and a window will appear. Write the value, e.g., May, and set the color as red. Then click Ok. These properties will change based on the given values.
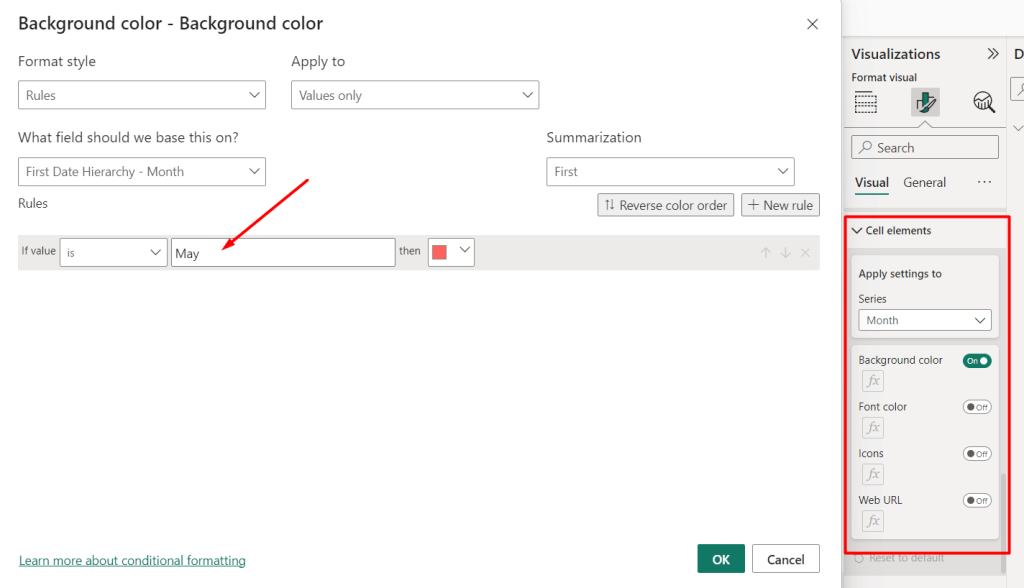
You can similarly change the font color, size, icon, and web URL by using similar conditions. This feature is highly useful for highlighting specific time intelligence with responsible sales or revenue factors.
8. URL icon: This setting allows you to customize the appearance of the URL icon. It helps to make the table visually appealing and easy to identify.
9. Image size: In case you use images or charts along with the calendar table in the Power BI dashboard, you can customize their height and width as per your needs.
10. Accessibility: Make your table inclusive by configuring color contrast and referring to rows with screen readers in mind.
General Settings
You can use a variety of general settings to enhance both the functionality and visual appeal of your data. Adjust the calendar table properties such as height, width, position, padding, and layer order. Add a title to provide clarity and context to the calendar table’s content and purpose.
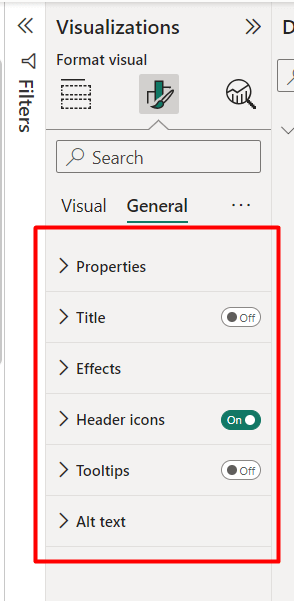
Adding header icons also improves visual comprehension and navigation. Also, here is an option to include tooltips for additional context without overwhelming the main view.
In addition, you can include alt text to ensure accessibility. This allows screen readers to describe the table’s content and structure for users with visual impairments.
How to use calendar table in Power BI
The calendar table in the Power BI model goes beyond simply displaying dates; it transforms your reports into powerful tools for time-based and insightful analysis. Let’s explore how this essential table empowers your data exploration:
Time-based Analysis
You can utilize the calendar table as a time slicer and analyze data over specific time periods such as days, weeks, months, or years. This allows for trend analysis, seasonality detection, and performance tracking over time.
Date-Based Filtering
With a calendar table, you can easily filter data based on specific dates or date ranges for targeted analysis and exploration. For instance, you can create dynamic date filters for a sales dashboard. This allows users to filter data by specific date ranges such as “This Month,” “Last Quarter,” or “Year-to-Date.”
Date Comparison
Employ the calendar table to compare data between different time periods. By creating calculated measures or columns, you can compare year-over-year performance, month-to-date metrics, or other custom date comparisons.
For example, comparing year-over-year sales performance through the Power BI calendar table to assess the growth of a financial year and identify areas for improvement.
Date Intelligence
Utilize the calendar table to perform date intelligence calculations, such as calculating the number of working days, identifying holidays, or determining the fiscal calendar. These calculations enhance data analysis and reporting capabilities.
Customized Report Making
The Power BI calendar table is the foundation for dynamic reports. Combine Power BI data into date-based insights to build powerful and interactive reports to address specific audiences. You can also integrate dataflow and data-based insights with other key performance indicators to enhance the report’s depth and relevance.
Best practices for creating calendar tables
To maximize the utility and reliability of calendar tables in Power BI, it’s essential to follow some best practices.
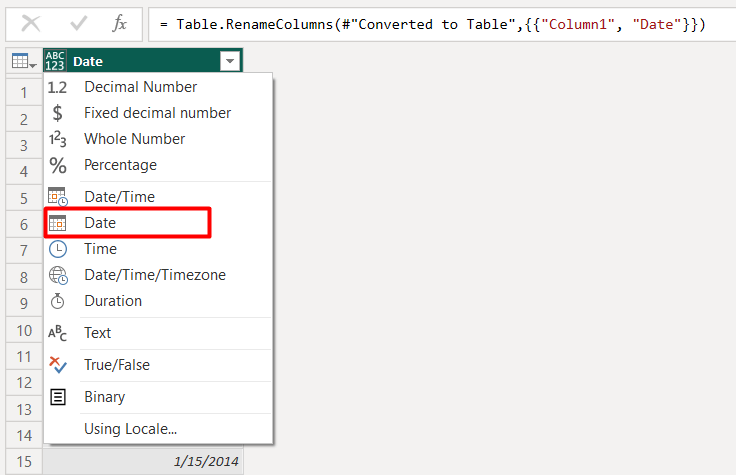
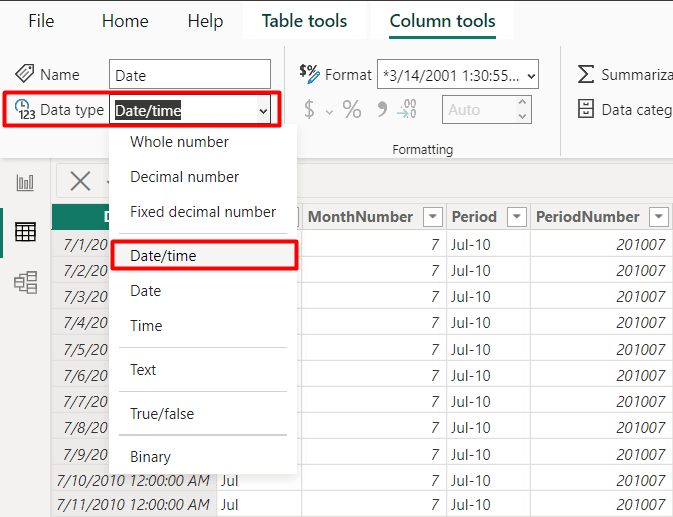
Set data type as Date
Ensure the “Date” column in your calendar table is correctly defined as a date data type in Power BI. This allows for proper date-based calculations and analysis. For this:
- Select the column containing the dates
- Click on the Date type
- Select the Date/time option from the drop-down
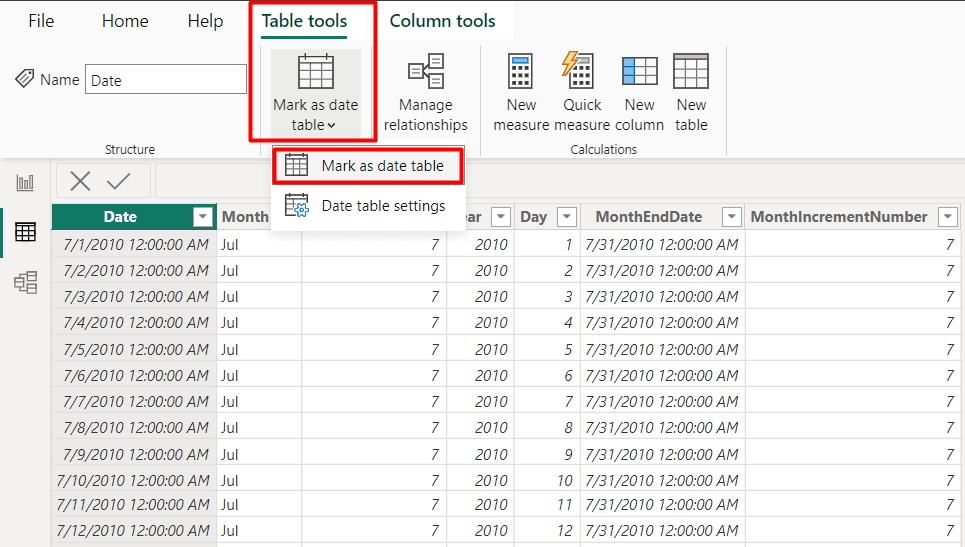
Mark as date table
After completing a calendar table, you should mark your calendar table as a date table. This will enable time intelligence features and streamline date-related calculations.
- Navigate the Table tools option on the top bar
- Click on Mark as date table
- Select Mark as date table from the drop-down
Regular data refresh and update
Implement regular data refresh and update schedules to ensure that the calendar table remains up-to-date with the latest data. This ensures accuracy and reliability in time-based analyses over time.
With Coupler.io, you can connect your data source to Power BI and enable automatic data refresh on a schedule. The interval for the data refresh can be set as frequently as every 15 minutes, ensuring your analyses reflect the latest information.
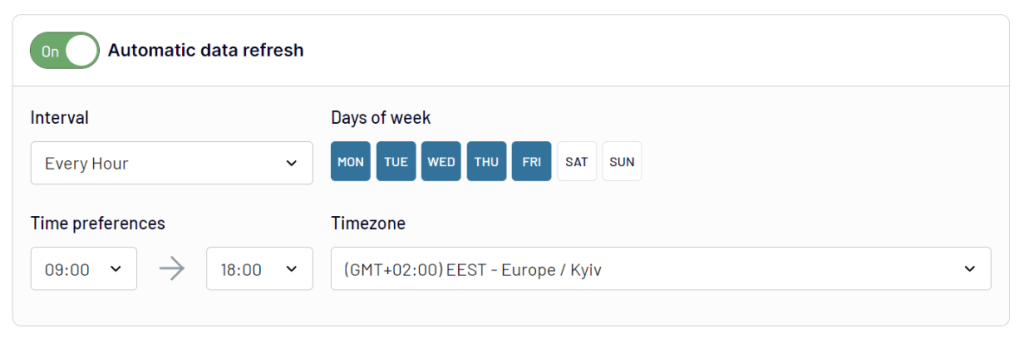
Pro tip: If your data spans different time zones, decide on a consistent time zone for your calendar table. This helps you avoid confusion and ensure accurate time-based analysis.
FAQs
What is the best method to create a calendar visual in Power BI?
While it depends on your specific needs, the DAX CALENDAR function is generally considered the best method for creating a calendar visual in Power BI. It’s beginner-friendly and offers precise control over date ranges and custom calculations for time-based analysis.
Are the date table and calendar table the same in Power BI?
Yes. In Power BI, the terms “date table” and “calendar table” are often used interchangeably to refer to a table that contains a sequential list of dates and associated attributes, facilitating time-based analysis and reporting.
What are the benefits of using calendar tables?
Calendar tables provide a structured framework for analyzing temporal data, enabling time slicing, dynamic date filtering, comparative analysis, and date intelligence calculations. All of these are beneficial for trend analysis, forecasting, and decision-making in Power BI reports.
Build relationships between calendar tables and other tables
Establishing relationships between calendar tables and other tables is essential for robust time-based analysis and reporting in Power BI. By linking calendar tables with relevant data tables, you can find out the full potential of time intelligence functions and perform insightful analyses.
Let’s build a relationship of other Power BI tables with calendar tables.
Go to your Power BI dashboard, and click on the Model View icon. Here, you can see all the data tables and manage their relationships.
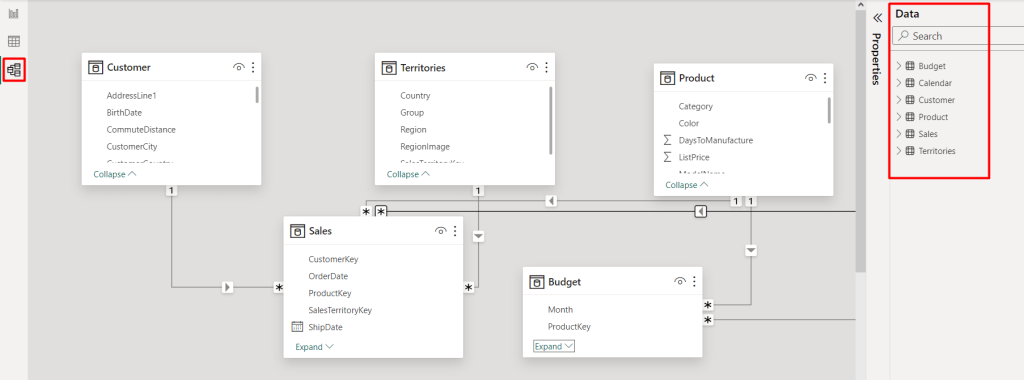
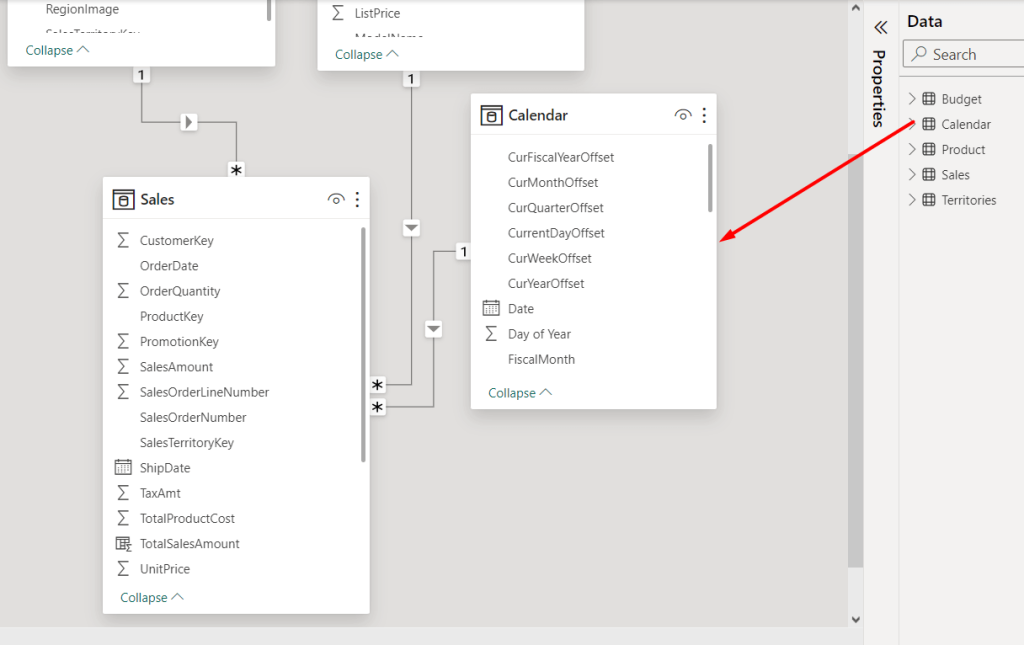
Next, select the required table, e.g., Calendar table. Then, drag and drop it inside the Power BI dashboard. Move and adjust the relationship with the other table like the Sales table.
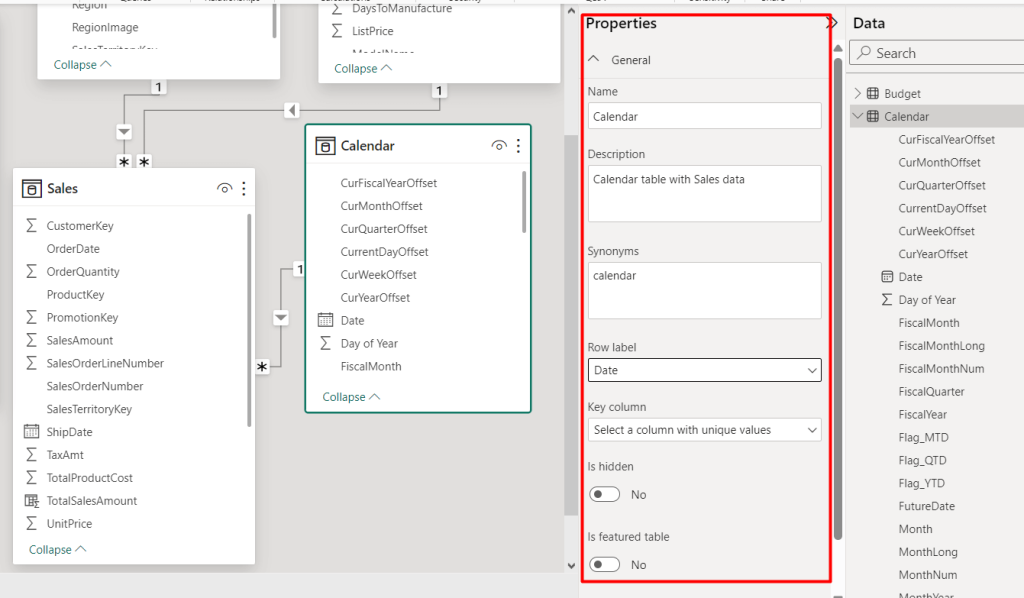
Next, click on Properties to customize the relationship between tables. You can change the name and add descriptions and synonyms for better understanding.
You can select the row label, e.g. Date, from the drop-down. You can choose any specific column to highlight unique values. You can also make the calendar table relationship featured or hidden if required.
Next, you can configure a relationship by clicking on the Manage Relationship option. Here, you can add a new relationship with another column, edit the existing one, or delete them.
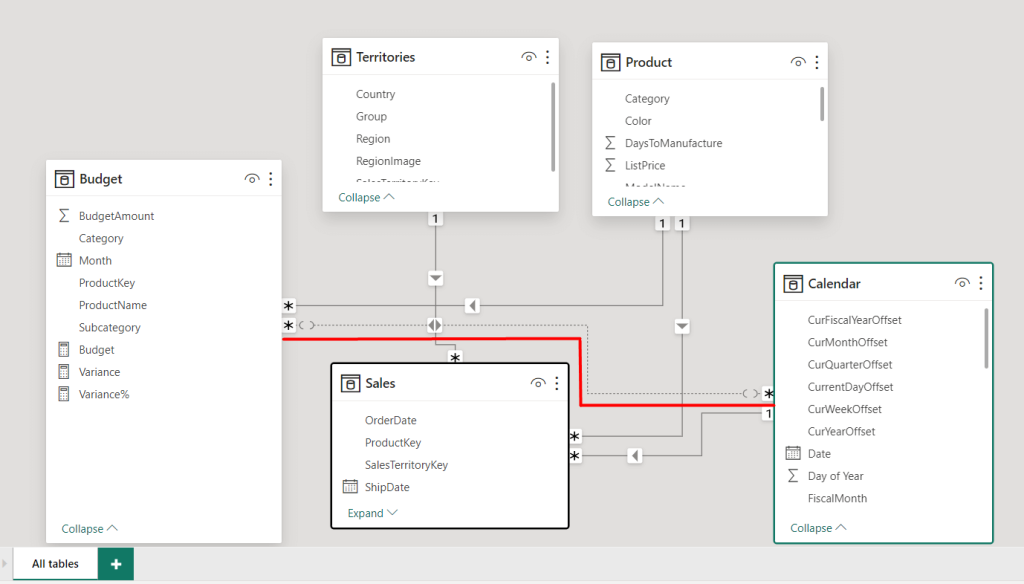
For instance, to create a new relationship (e.g. calendar table and budget table), click on Manage Relationship. Then, click on New. A small window will pop up.
Next, select the table and column for both tables you want to create the relationship.
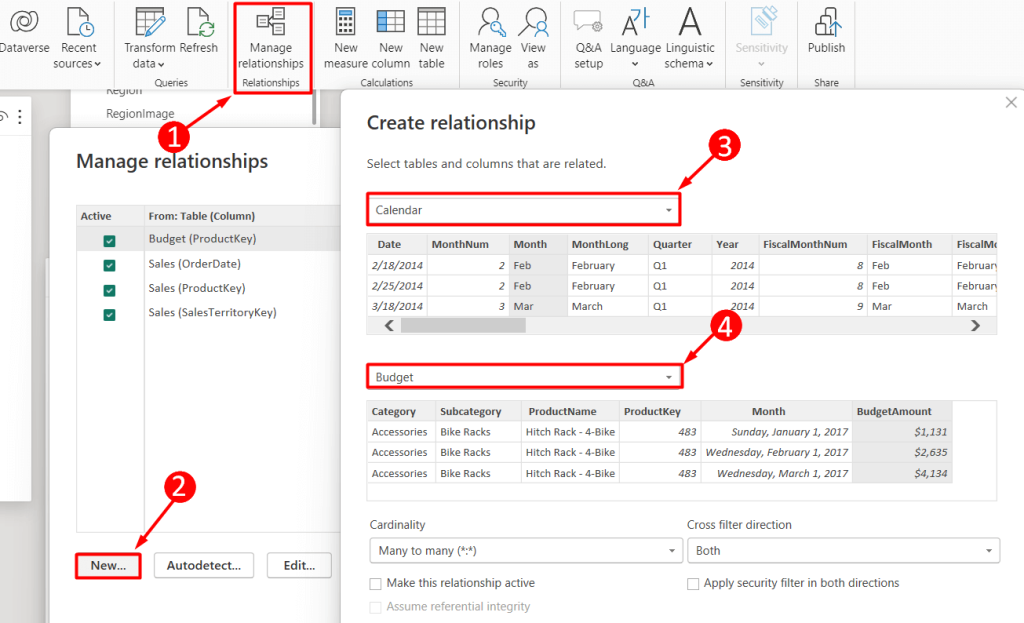
You can also adjust the Cardinality (one to one, many to many, etc.) and Cross filter direction as single or both. After all adjustments, click Ok. You can see the newly established relationship between 2 tables in the Power BI report canvas.
Overall, implementing a calendar table significantly enhances Power BI’s time intelligence features. Following this comprehensive tutorial, you can now create effective calendar tables in Power BI.
So why are you waiting? Transform your Power BI reports into insightful and dynamic explorations of your data over time.


