Is there a COUNTIF function in Power BI?
No, there is no built-in COUNTIF function in Power BI, which means you cannot directly use the function in Power BI as you can in Excel.
COUNTIF is one of the most popular Excel formulas, which lets you count the number of values in a range that meet specific conditions. It also calculates the number of rows based on certain conditions.
Although you can not use the COUNTIF in Power BI directly, you can use a DAX formula to implement the same logical function.
How to use COUNTIF in Power BI using DAX?
You can apply COUNTIF in Power BI to custom columns as well as measures, depending on your needs.
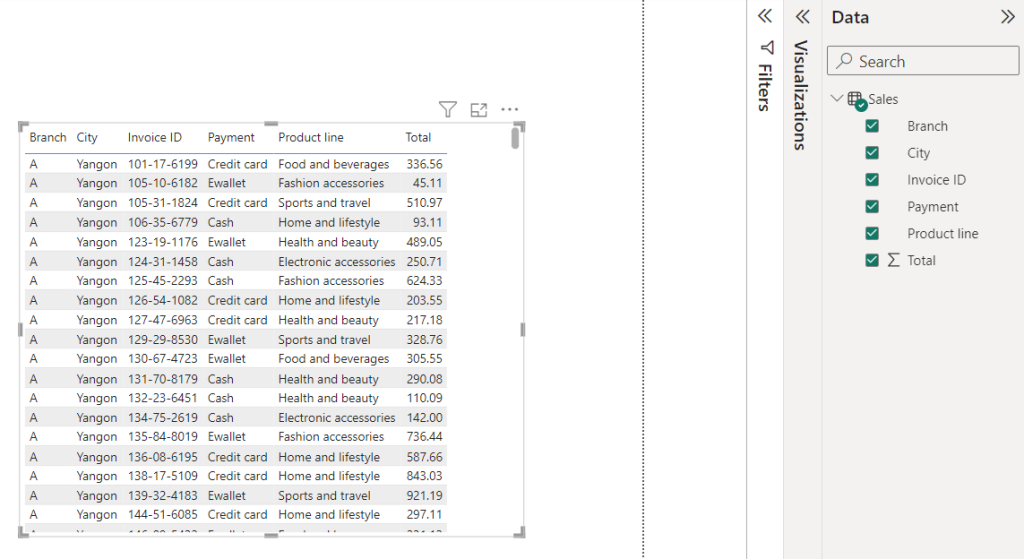
Let’s say you have the following sales data in Google Sheets that contains entries of sales orders. And you want to get the number of orders for each city using COUNTIF in Power BI.
To do that, you need to create a new column in the data model and apply a custom DAX formula for the COUNTIF Power BI function.
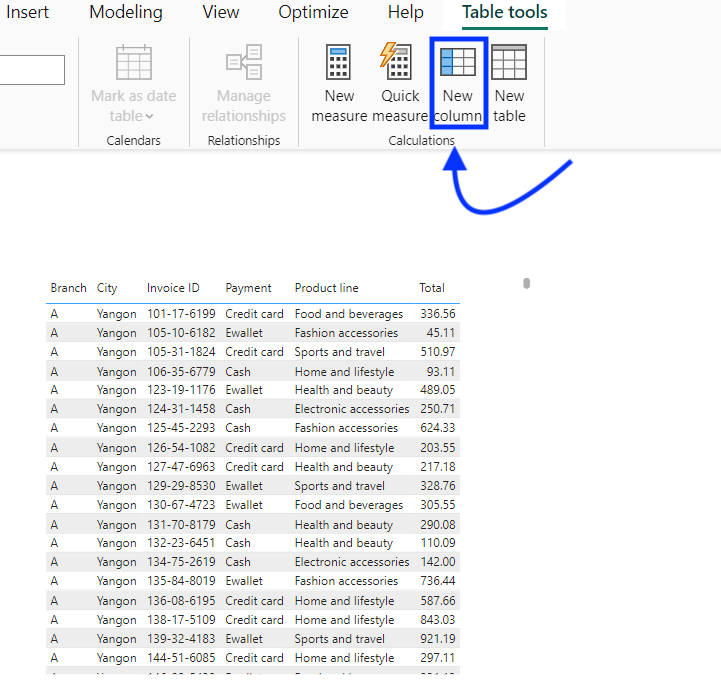
Open the report in Power BI Desktop and select the respective data model. Then, navigate to the Table Tools tab and click Calculations > New Column, as shown below.
Enter the following COUNTIF formula in Power BI for the custom column:
Total Orders by City =
CALCULATE(
COUNTA(‘Sales’[City]),
ALLEXCEPT(‘Sales’, ‘Sales’[City])
)
And press the Enter key to apply it.
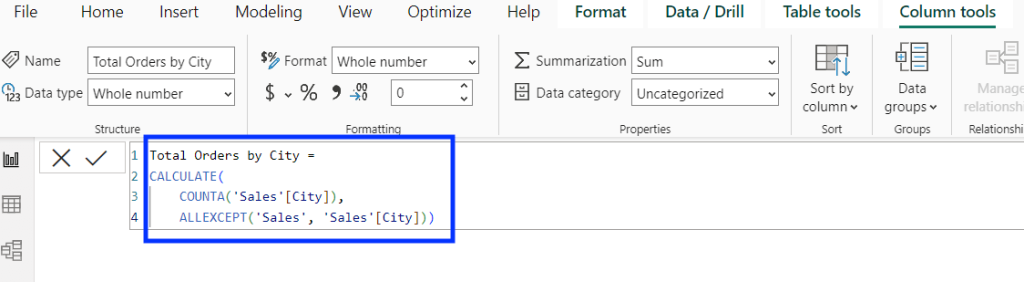
Here’s how the above COUNTIF Power BI formula works:
- COUNTA(‘Sales'[City]): Counts the number of non-blank values in the city column of sales table.
- ALLEXCEPT(‘Sales’, ‘Sales’[City]): Removes all the filters applied to other columns in the sales data table except the city column.
- CALCULATE (…): The CALCULATE function combines the above two functions to calculate the number of non-empty values within the context of the city column (i.e. by considering only the city filter).
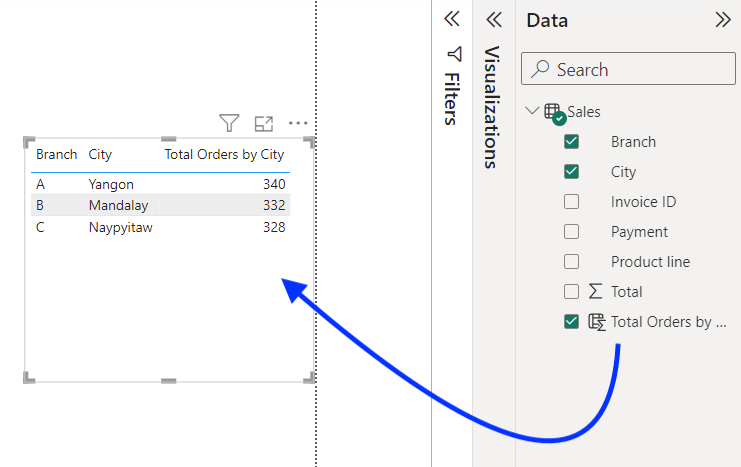
The new calculated column will count all the non-blank values for the city value of the current row. You can create a table or matrix visual using it to get the number of orders for each city.
This was a simple example of how you can apply the Power BI COUNTIF function to count the number of entries based on the value of a single column.
Alternative method to use COUNTIF formula in Power BI
There is more than one way to apply the COUNTIF function in Power BI. You can combine the FILTER and COUNTROWS DAX functions to achieve the same results.
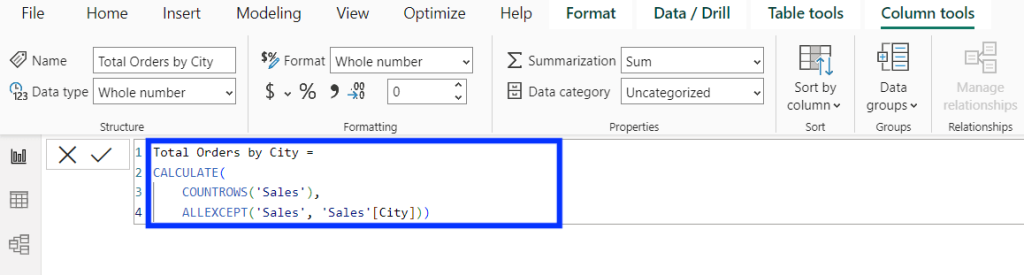
Taking the same previous example, you can use the following DAX formula to create a new column to count the number of orders by city:
Total Orders by City =
CALCULATE(
COUNTROWS(‘Sales’),
ALLEXCEPT(‘Sales’, ‘Sales’[City])
)
Here’s a breakdown of the above formula:
- COUNTROWS(‘Sales’): Counts the number of rows in the sales table.
- ALLEXCEPT(‘Sales’, ‘Sales’[City]): Removes all the filters applied to other columns in the sales table except the city column.
- CALCULATE (…): Modifies the context in which the formula is evaluated by applying the specified filters. This means it counts all rows where the city matches the current row’s city value.
The new calculated column counts the number of orders based on the city column value. You can use it to create a table or matrix visual like we did in the previous example.
How to get your data into Power BI?
Power BI natively supports various data sources to import your data from. You can connect the resources and set up integrations manually.
But there’s a better way. You can use Coupler.io, a data integration and automation platform that can connect 50+ various apps to Power BI and automate the integration with preset connectors.
In this example, we use Coupler.io to load data from Google Sheets into Power BI, but you can do the same for a different data source.
To get started, select the source you need from the dropdown list and click Proceed in the widget below.
Follow the on-screen prompts to connect your data source.
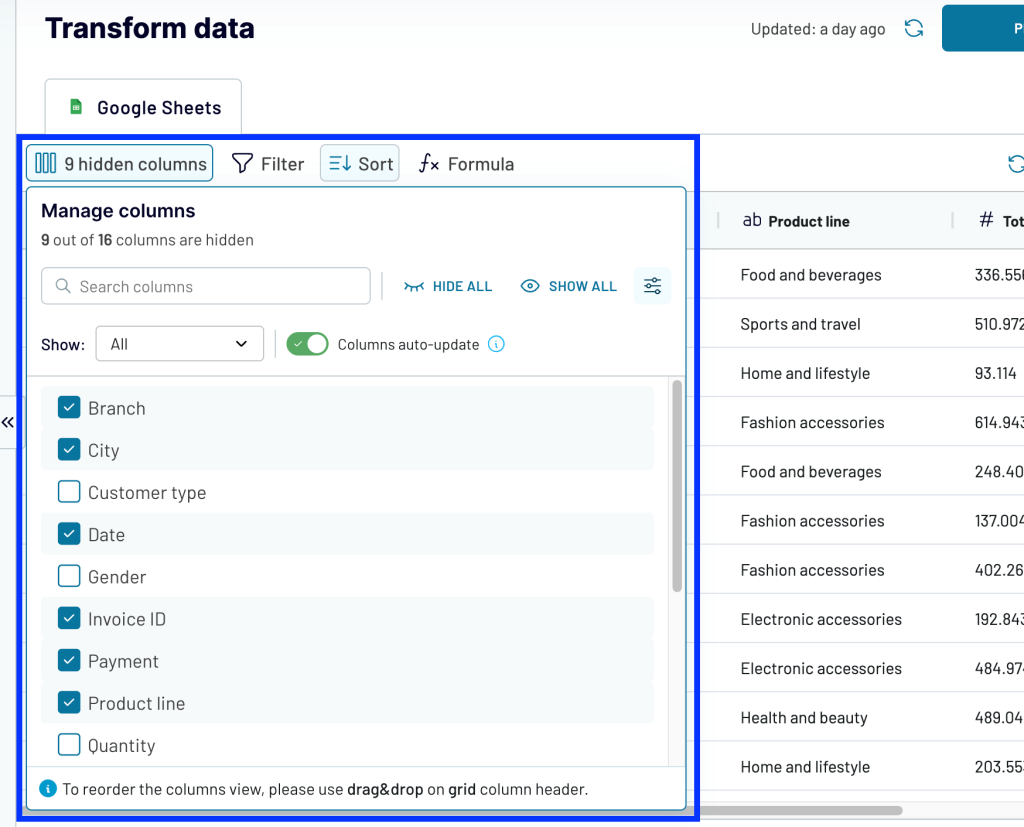
Here you can also transform data and make it ready for Power BI. For example, you can hide unnecessary columns from the data and make reporting in Power BI easier and faster. It also eliminates the need to process data manually through Power Query.
Finally, generate and copy the importer URL and run the importer. After a successful run, you can use the copied URL to load data into Power BI.
Optionally, with Coupler.io, you can automate data refreshes on a specific schedule so that your Power BI reports always stay up-to-date and display the latest data.
Now you know how to get data into PowerBI and use COUNTIF to analyze it. Let’s check some examples.
Example of Power BI COUNTIF using a measure
In Power BI, you can create a new measure to count the rows matching specific criteria. This way, you can achieve results similar to the COUNTIF function.
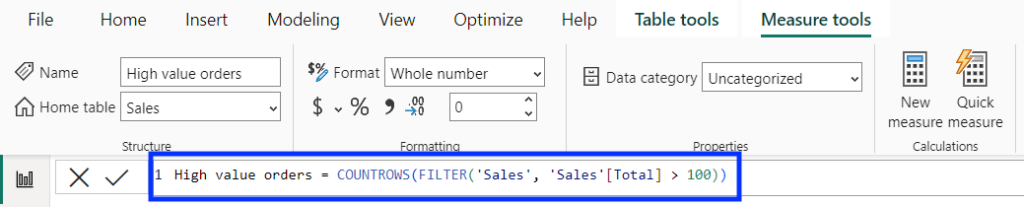
For example, let’s say you want to count the orders with a total of over $100 in the sales table. To do that, create a new measure in Power BI with the following formula:
High value orders = COUNTROWS(FILTER(‘Sales’, ‘Sales’[Total] > 100))
The above Power BI COUNTIF formula combines two functions:
- FILTER: This filters the table based on the provided criteria (which, in this case, is order total over $100).
- COUNTROWS: This counts the number of filtered rows.
It returns the count of rows in the table that matches the specified condition, which you can add to your report through a visual like a card.
Power BI COUNTIF from another table
In Power BI, you can use the RELATEDTABLE function for cross-table COUNTIF.
For example, let’s say you have one more table related to the sales table that contains the membership status of customers.
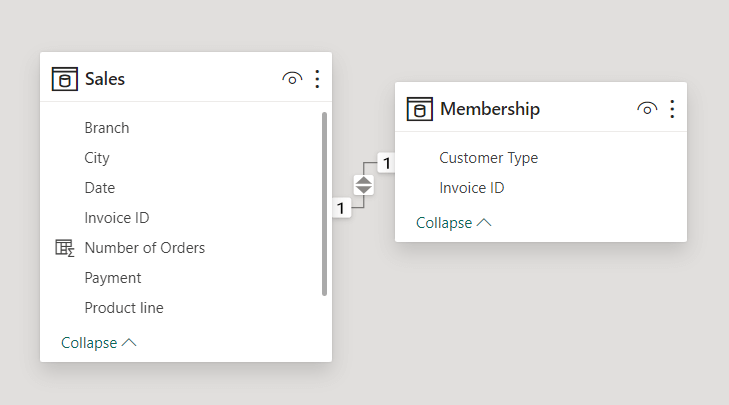
And you want to count the number of rows in the Sales table based on the Membership table. Here’s the DAX COUNTIF formula to do this:
Member Orders = CALCULATE(COUNTROWS(‘Sales), RELATEDTABLE(‘Membership’), Membership[Customer Type] = “Member”)
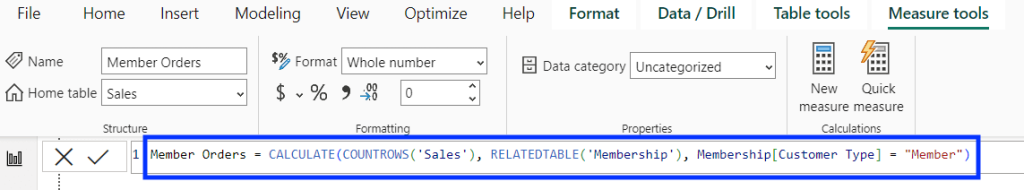
The above Power BI COUNTIF formula uses the RELATEDTABLE function to filter the table using a column from another table. Similarly, you can use FILTER with RELATEDTABLE to implement COUNTIF function from another table using conditions.
COUNTIF greater than 0 in Power BI
Let’s say you want to count the number of orders above the $0 total value (meaning non-free orders.) To do that, you can use the COUNTROWS along with the FILTER function. Here’s the formula:
Column = COUNTROWS(FILTER(‘Sales’, ‘Sales’[Total] > 0))
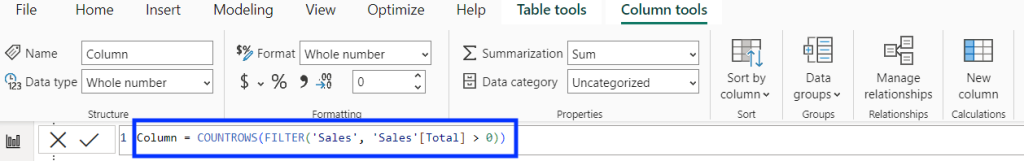
Here, the COUNTROWS function counts the number of rows filtered by the FILTER function, i.e. only the rows with Total value more than 0.
Power BI COUNTIF using multiple columns
Power BI COUNTIF function with multiple columns is possible using FILTER functions with multiple conditions.
In our previous example of a sales table, let’s say you want to count the number of columns that meet two conditions:
- Total value above $100.
- The payment method is “Credit Card.”
You can achieve this by using the following COUNTIF Power BI formula:
Measure = COUNTROWS(FILTER(‘Sales’, ‘Sales’[Total] > 100 && ‘Sales’[Payment] = “Credit Card”))
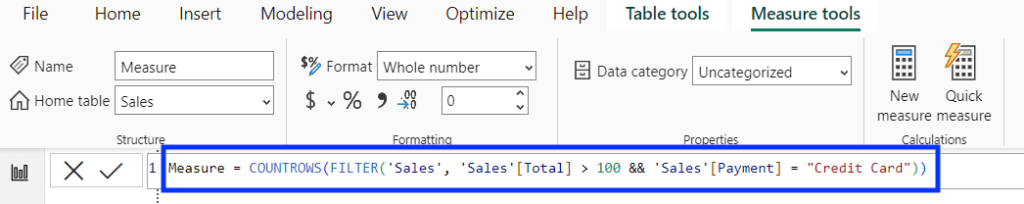
In the above formula, && stands for AND logic. Meaning it will return the number of rows that match both conditions. You can replace the operator with || to use OR logic and count the rows matching either condition.
Advanced tips for using COUNTIF in Power BI
The COUNTIF Power BI tutorials above cover all the basics you need to utilize the function. But here are some tips to go beyond the basics and use the function like a pro.
Use complex logic in Power BI COUNTIF
The logical operators (&& for AND, || for OR) are helpful for the Power BI COUNTIF function with multiple conditions. You can use brackets to logically control the evaluation of these conditions and perform an advanced operation.
For example, consider the following formula:
Countifcolumn = COUNTROWS(FILTER(TableName,(Condition1 && Condition2) ||Condition3))
In the above formula, we’ve grouped Condition1 and Condition2 with an AND operator between them and combined this set of conditions with Condition3 using an OR operator. This means the above formula will count the row only if it meets both Condition1 and Condition2 OR just Condition3.
Power BI COUNTIF measure vs columns
In Power BI, COUNTIF operations can be performed using both measures and columns. But it is essential to know when to use which.
Power BI COUNTIF measures help perform dynamic and aggregated calculations. This means you can create measures to calculate the number of rows matching specific criteria.
On the other hand, Power BI COUNTIF columns are suitable for row-based calculations for static data. The columns are helpful when you want to store the result values in the data models, i.e., new columns are added to the data model. For more information on using functions and other tips, see our Power BI tutorial.
Power BI COUNTIF function: Summary
Even though there is no native COUNTIF formula in Power BI, you can leverage custom DAX formulas to achieve similar results. You can combine functions like CALCULATE, COUNTA, COUNTROWS, and FILTER in Power BI to get precise counts of rows matching conditions.
Lastly, you can use connectors like Coupler.io to add data from additional sources to your reports. You can use it to connect major marketing, sales, and financial applications. Additionally, you can leverage its advanced data transformation and automation features to build data pipelines.
Connect your data source to Power BI with Coupler.io
Get started for free


