Microsoft Power BI date tables stand as indispensable tools for navigating the dimension of time. Date tables in Power BI help users work on various trends, patterns, and changes over various temporal scales. Users can even create custom time intervals based on reporting with specific business needs.
So, how to create a Power BI date table? ?
In this guide, we’ll explore 5 approaches on how to create date table in Power BI. We’ll also discuss the requirements, effective tips, and how to build relationships with other tables with date tables in Power BI.
Let’s begin!
What are Power BI date tables
The Power BI date tables are specialized tables dedicated to managing and organizing a range of dates for data models. These tables contain a range of date-related attributes, such as day, month, quarter, year, etc. You can also calculate columns for fiscal periods like a day of the week and holidays in the Power BI date tables.
The primary purpose of a Power BI date table is to enhance time-based analysis and reporting. You can easily filter, group, and analyze data based on various data models.
How to create a date table in Power BI: Step-by-step guide
Now it’s time to create a date table in Power BI. In this section, we’ll explore 5 distinct approaches to building with dynamic date tables. Thus, you will find the suitable one for different preferences and scenarios.
1. Automating date table with auto date/time option
Auto date/time in Power BI offers quick and easy time intelligence for filtering and grouping in reports. Besides, it’s especially handy for ad hoc model creation, data exploration, and profiling.
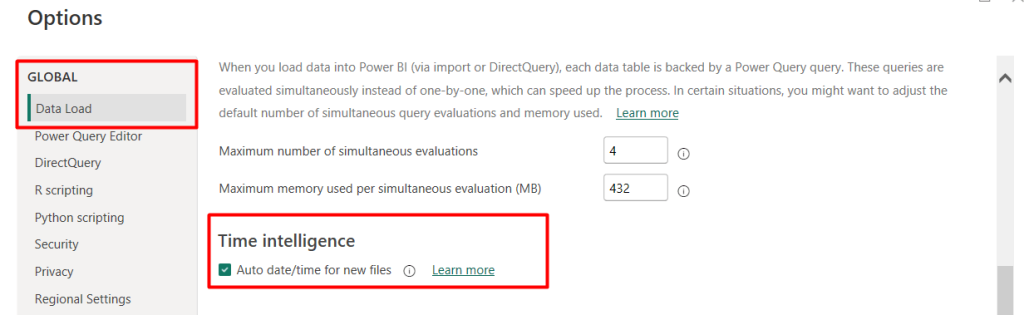
To enable the auto date/time option in Power BI, follow the following steps:
- Go to your Power BI desktop app
- Click File ? “Options and Settings”
- Click “Options”
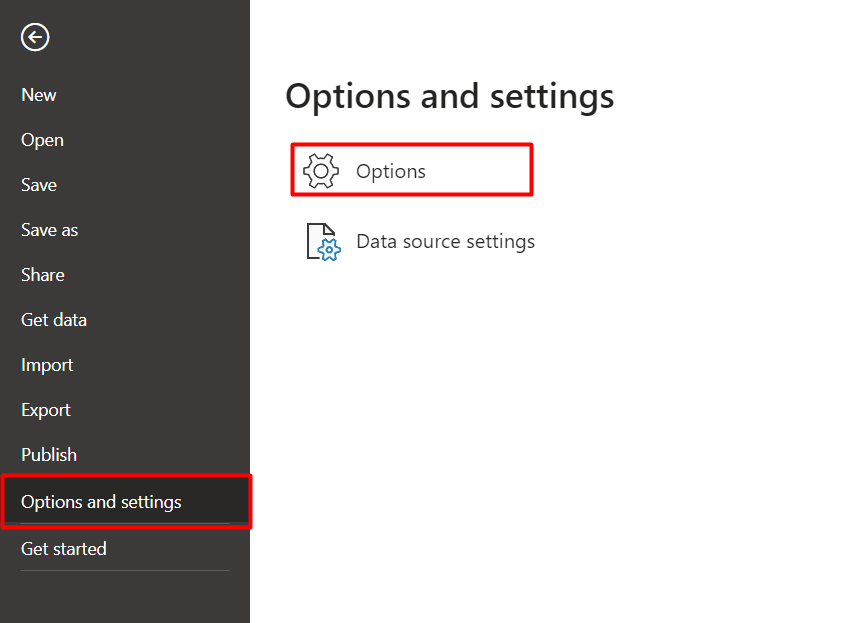
- Navigate to “Time Intelligence”
- Mark the “Auto date/time” option
- Click “Okay”
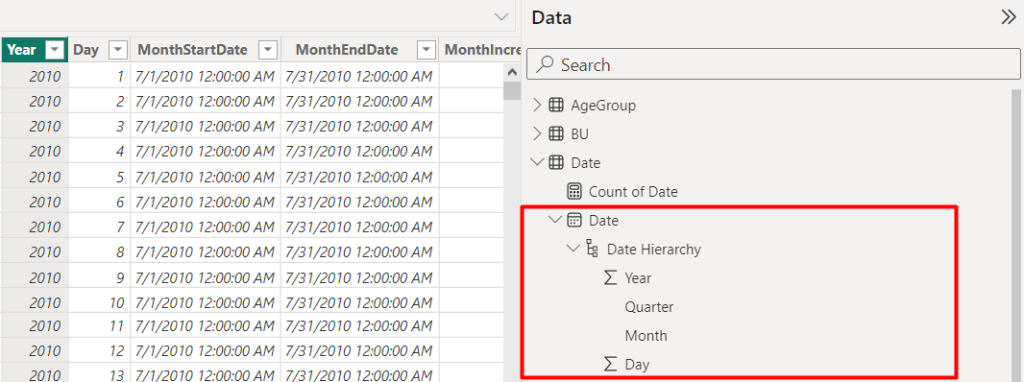
After enabling this option, Power BI automatically creates a hidden date table regarding the date of every data column. However, this hidden date table can be found as an extendable drop-down containing the Date hierarchy columns such as Year, Quarter, Month, and Day.
2. Creating the date table with DAX in Power BI
Another method of creating a date table in Power BI is Data Analysis Expression or DAX. DAX is a library of functions for building expressions and formulas.
Now, one question may have arisen in your mind, when we have an Auto date/time option in Power BI, what’s the need for using another method like DAX? Well, when you use the auto date/time table feature, Power BI creates hidden tables for each date column for the dimension table.
The problem is when you have multiple dimension tables with multiple date columns. Power BI will create multiple hidden date tables. That will increase the space and slow down the report. Also, customization is limited when using an automatically generated date table.
In that case, you can simply use the DAX expression to create a date table. To do so, you can use the CALENDAR and CALENDARAUTO DAX functions. They both result in a single-column table containing the date fields you wanted based on date interval filtering and grouping requirements.
Power BI date table using CALENDAR DAX functions
When you need to define a date range like a starting and ending date, the CALENDAR DAX function is a reliable solution. For example, you have a range of dates, such as the starting and end date of a sales translation.
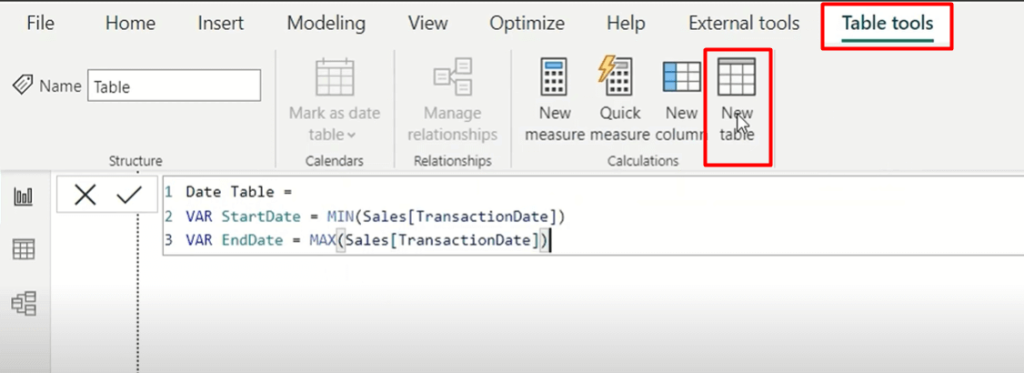
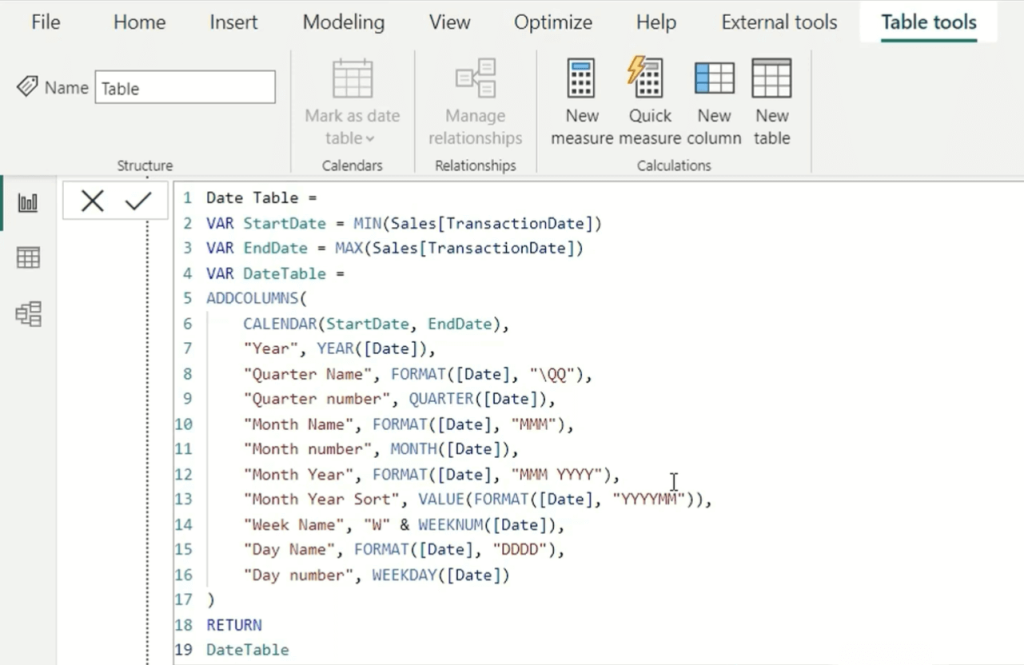
So, let’s see how to create a date table in Power BI using the CALENDAR DAX function:
- Go to your Power BI desktop app
- Click on Power BI “Table tools”
- Create a new table
- Set the name as “Date Table”
- Next, create 2 parameters for start date and end date
Date Table = VAR StartDate = MIN(Sales[TransactionDate])VAR EndDate = MAX(Sales[TransactionDate])
- Next, create a parameter for the DateTable and use the CALENDAR function to find the list of dates of starting date to end date.
VAR DateTable = ADDCOLUMNS( CALENDAR(StartDate, EndDate), "Year", YEAR([Date]), "Quarter Name", FORMAT([Date], "\QQ"), "Quarter number", QUARTER([Date]), "Month Name", FORMAT([Date], "MMM"), "Month number", MONTH([Date]), "Month Year", FORMAT([Date], "MMM YYYY"), "Month Year Sort", VALUE(FORMAT([Date], "YYYYMM")), "Week Name", "W" & WEEKNUM([Date]), "Day Name", FORMAT([Date], "DDDD"), "Day number", WEEKDAY([Date]))RETURNDateTable
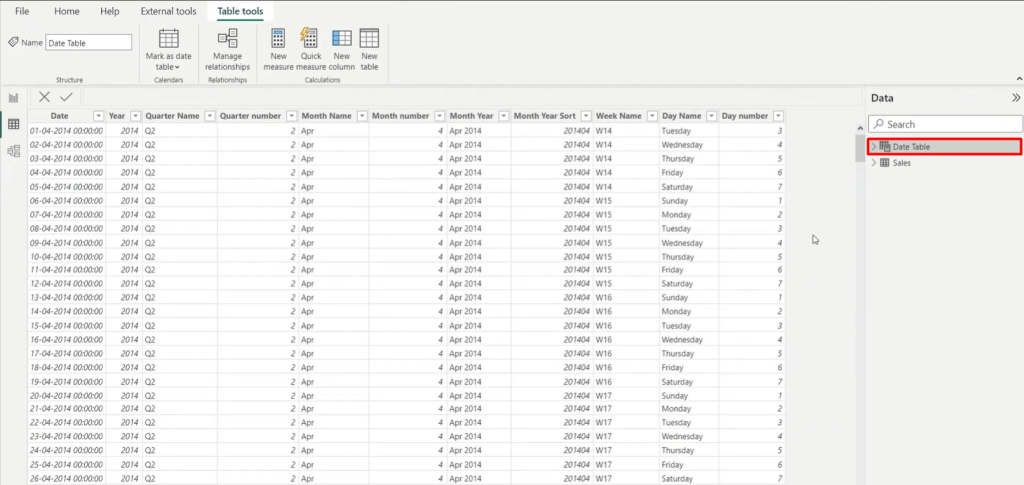
- Next, go to the “Date view” tab, and the created date table is shown here.
Power BI date table using CALENDARAUTO function
This DAX function is convenient when you need to sort all the dates of a data model. You can simply pass a single parameter, it will show the entire date range of your model in the form of a date or calendar table.
One major benefit of using this function is that you don’t need to manually update when extending the data model in the future. It will recalculate the date table parameters like years, months, and days automatically when a data refresh completes.
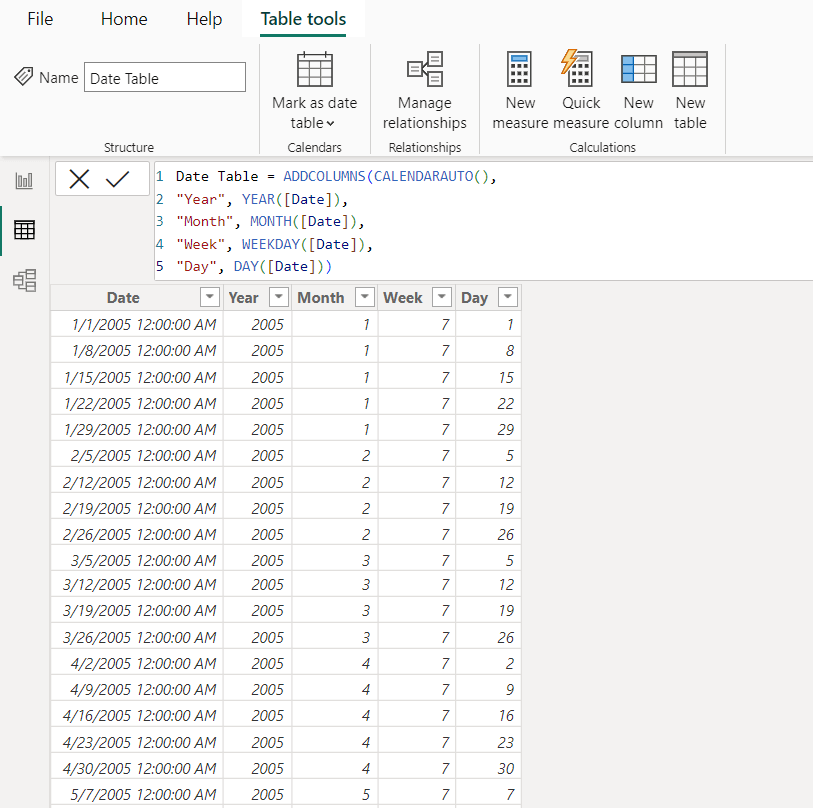
Now, let’s see the step-by-step guide on how to create a Power BI date table using the CALERNDARAUTO function:
- Navigate to Power BI “Table tools”
- Click on “New table”
- Create a new table as “Date Table”
- Use the CALENDARAUTO DAX function in ADDCOLUMNS to make a date table containing the years, months, days, and weekdays, etc.
Date Table = ADDCOLUMNS(CALENDARAUTO(),"Year", YEAR([Date]),"Month", MONTH([Date]),"Week", WEEKDAY([Date]),"Day", DAY([Date]))
3. Dynamic date table generation with Power Query
The next way to create a date table in Power BI is using Power Query. This process is also known as mash-up language or M-Query. You can easily filter, group, and mash-up data from one or more supported data sources using Power Query.
Let’s see the simple steps to create a date table using Power Query in Power BI:
- Go to your Power BI dashboard
- Create or import your data model
- Click on the “Transform Data” button
- Navigate to “Manage Parameters” ? “New parameters”
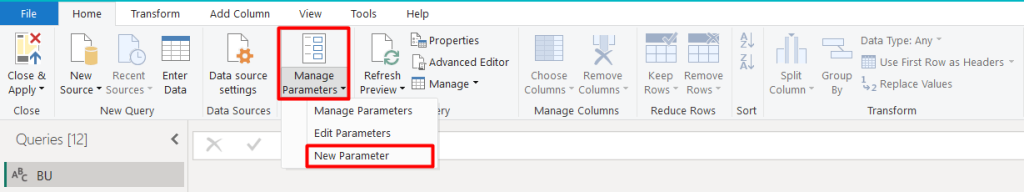
- Add a new parameter as “StartDate”
- Select the type ? Date
- Input the starting date as per your requirement
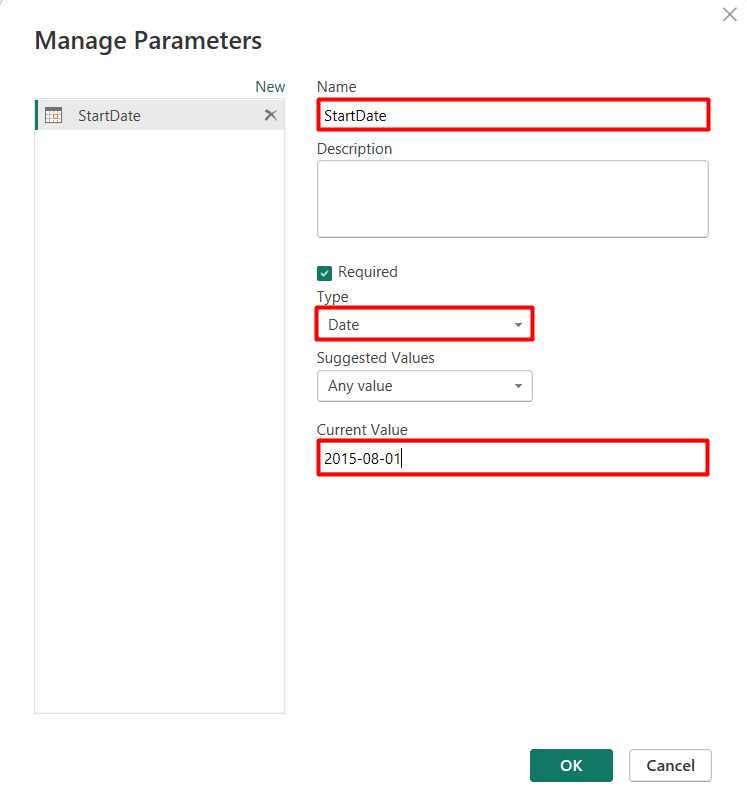
- Following a similar process, create another new parameter named “EndDate”
- Select its type as “Date” and put the desired ending date values for your date table
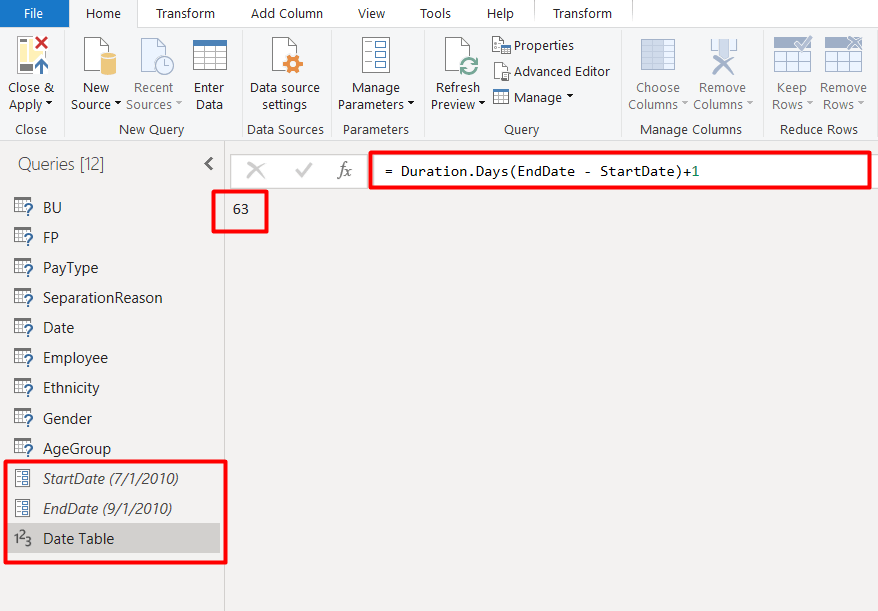
Now, it’s time to create a date table using these 2 parameters. To do so:
- Click on “New Source” ? “Blank Query”
- Set the name as “Date Table”
- Write the function:
fx = Duration.Days(EndDate - StartDate)+1
It will show the total number of days from the starting to end date of the given parameters
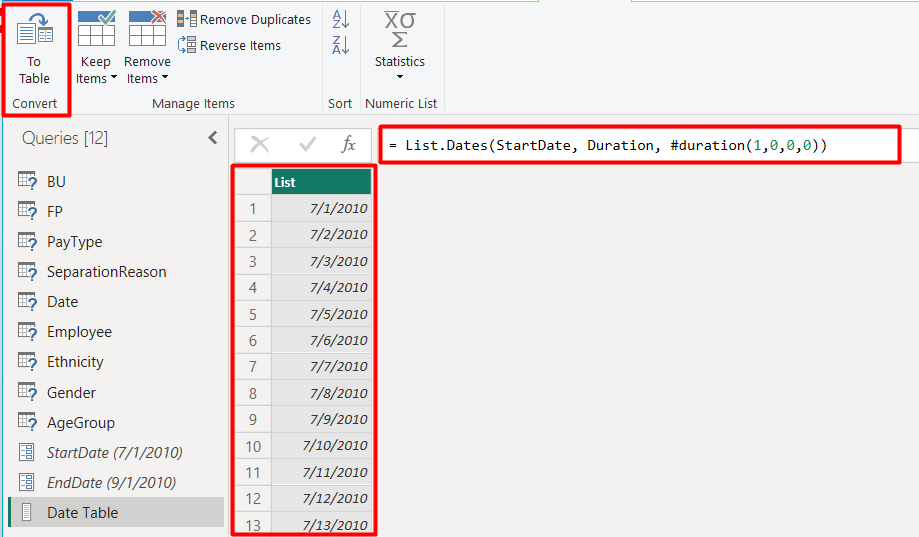
- Rename the source as “Duration” through the advanced editor. After that, write the List function to get the entire list of the dates in one single column. Write the function:
fx = List.Dates(StartDate, Duration, #duration(1,0,0,0))
You can see the simple date table containing the date range in between the given start and ending date. Now, time to convert this list as a date table. Click on the “To Table” option in the left upper corner
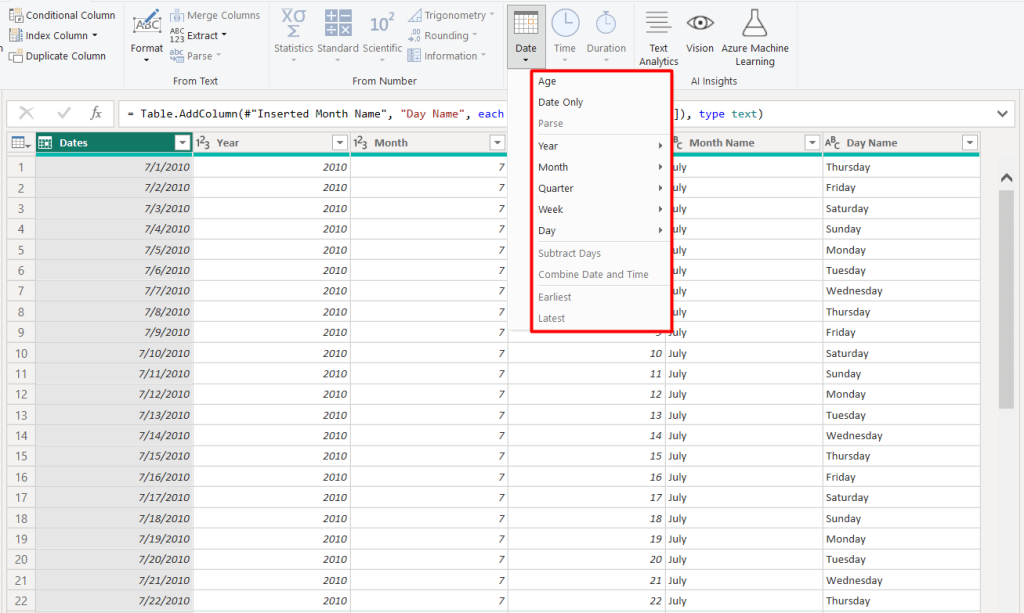
- Rename the column as “Dates” and change the data type to “Date”. Now you can add new columns as per your needs like year, quarter, month, and day.
- To add a new column, click on “Add Column”. Click on “Date” ? select “Year”. Similarly, you can add months, days, etc. to your Power BI date table. You can also be shown them by the week numbers, days of a month, the name of the month, the name of the day, and so on.
4. Connecting Power Query to date dimension table
When you already have a date table in your data source, you can use it as a basis for your model’s date dimension table. A date dimension table contains one record per each day and it can be connected with the date table using the Power Query.
This helps you do complex calculations using time-related factors, like year-to-quarter, or quarter-over-quarter comparisons using a single source. Also, it simplifies the creation of more intuitive visualizations and Power BI reports for end-users.
To connect the Power query to the date dimension table:
- Create a new source as “Blank Query” like the previous method
- Rename the table name as Dim Date table
- Now select the “Advanced Editor” option
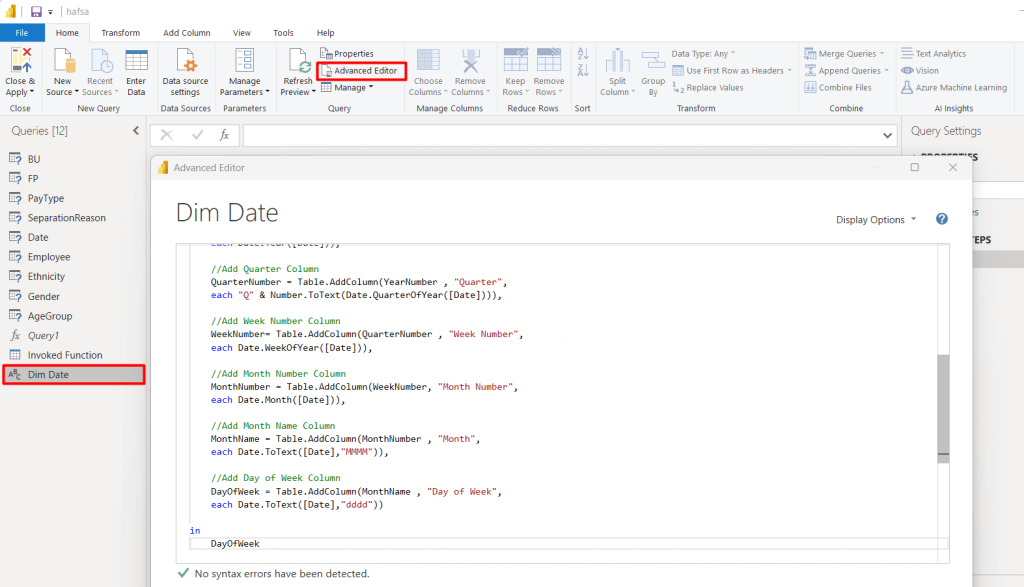
- Write the following Power Query to connect the date dimension table:
(StartDate as date, EndDate as date)=>

let
    //To capture the date range from the parameters
    StartDate = #date(Date.Year(StartDate), Date.Month(StartDate),
    Date.Day(StartDate)),
    EndDate = #date(Date.Year(EndDate), Date.Month(EndDate),
    Date.Day(EndDate)),

    //To get the number of dates that will be required for the table
    GetDateCount = Duration.Days(EndDate - StartDate),

    //To take the count of dates and turn it into a list of dates
    GetDateList = List.Dates(StartDate, GetDateCount,
    #duration(1,0,0,0)),

    //To convert the list into a table
    DateListToTable = Table.FromList(GetDateList,
    Splitter.SplitByNothing(), {"Date"}, null, ExtraValues.Error),

    //To create multiple date attributes from the date column
    //Add Year Column
    YearNumber = Table.AddColumn(DateListToTable, "Year",
    each Date.Year([Date])),

    //To add a Quarter Column
    QuarterNumber = Table.AddColumn(YearNumber , "Quarter",
    each "Q" & Number.ToText(Date.QuarterOfYear([Date]))),

    //To add a Month Number Column
    MonthNumber = Table.AddColumn(WeekNumber, "Month Number",
    each Date.Month([Date])),

    //To add a Month Name Column
    MonthName = Table.AddColumn(MonthNumber , "Month",
    each Date.ToText([Date],"MMM")),

    //To add Day of Week Column
    DayOfWeek = Table.AddColumn(MonthName, "Day of Week",
    each Date.ToText([Date],"ddd"))

in
    DayOfWeek
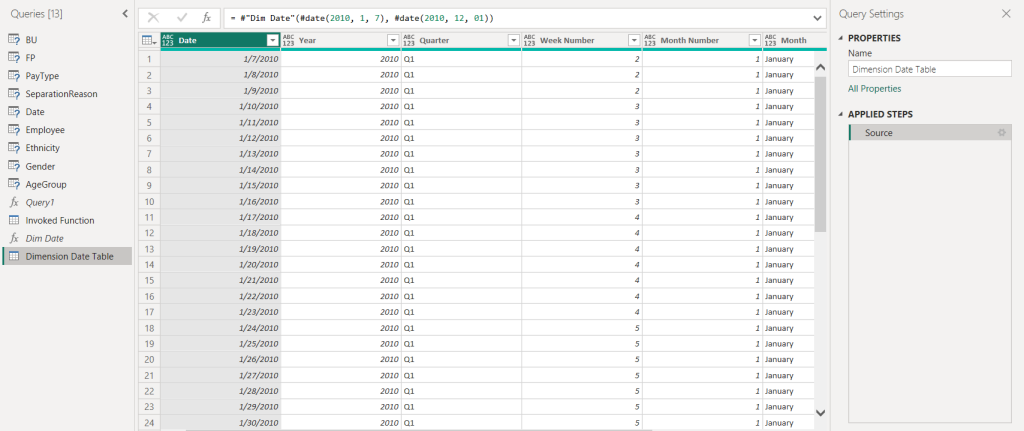
- Click on “Done”. Select the start date and the end date based on your preference
- Click on “Invoke”. And your dimension date table with power query is ready
5. Cloning date tables with DAX in Power BI
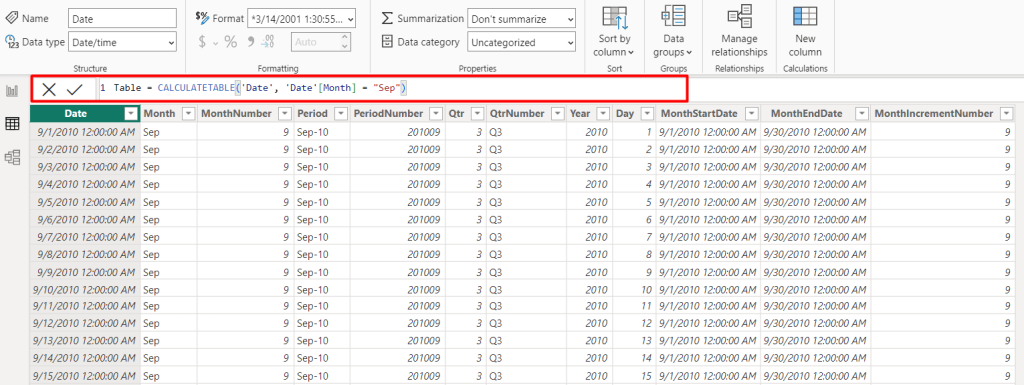
In case when you need a new date table along with the existing one, you can simply clone the date table using a ‘CALCULATETABLE’ DAX expression.
For example, for the ‘Date’ table, we want to create a new clone table for only September (Sep) among months. To do so:
- Select the data model, then click on “New table”
- Write the “CALCULATETABLE” DAX function
fx = Table = CALCULATETABLE('Date', 'Date'[Month] = "Sep")
- Click on tick (?) and you are good to go. A new table containing all data associated with the ‘September’ month will be shown in the new table.
By duplicating/cloning the date table with the DAX function, you don’t need to upload unique values into your new table columns from the data source again. The new date table in Power BI will be created based on the previously loaded data.
How to use date table in Power BI
A date table or Power BI calendar table allows you to organize and analyze dates based on temporal ranges supporting numerous data sources. You can enhance the capabilities of your time intelligence analysis by incorporating a date table into your Power BI report.
You can connect various data sources such as SQL Server, Excel, SharePoint, and others to load data.
However, many marketing and business data sources, like Google Analytics, aren’t supported natively in Power BI. In that case, you can use external reporting automation tools, such as Coupler.io. It supports over 50 data sources, including Google Analytics, Clockify, Calendly, Airtable, Hubspot, Quickbooks, Salesforce, and so on. Just select the app you want to connect to Power BI, click Proceed, and complete 3 simple steps to configure the connection and automatic data refresh.
With your data in Power BI, you can proceed to create a report or an advanced dashboard using Power BI visuals. More on this, you can read in our Power BI Tutorial.
At the same time, the use of date tables in Power BI is quite enhance and below there are only a few cases where calendar tables will be needed.
Also, see how you can join tables in Power BI automatically.
Comparative Analysis
Next, you can use the table of dates to enable year-over-year (YoY), quarter-over-quarter (QoQ), or month-over-month (MoM) comparisons. Besides, you can create custom time periods like fiscal years or custom date ranges using the date table.
In terms of calculating growth rates and variances in the Power BI date table, you can compare performance metrics across different time periods to analyze specific reporting periods.
Data Modeling
Data modeling in Power BI is crucial for establishing a relationship between the primary data table and the date table. You can create calculated columns and measures in Power BI, using the date table to perform time-based calculations and aggregations.
Report Design
With the date model in place, you can design their reports by dragging and dropping fields onto the report canvas. You can make data visualizations such as charts, tables, and maps to convey insights effectively.
In addition, slicers and filters are also integrated into the report to allow you to interactively explore and analyze data across different periods.
Creating relationships between date tables and other tables
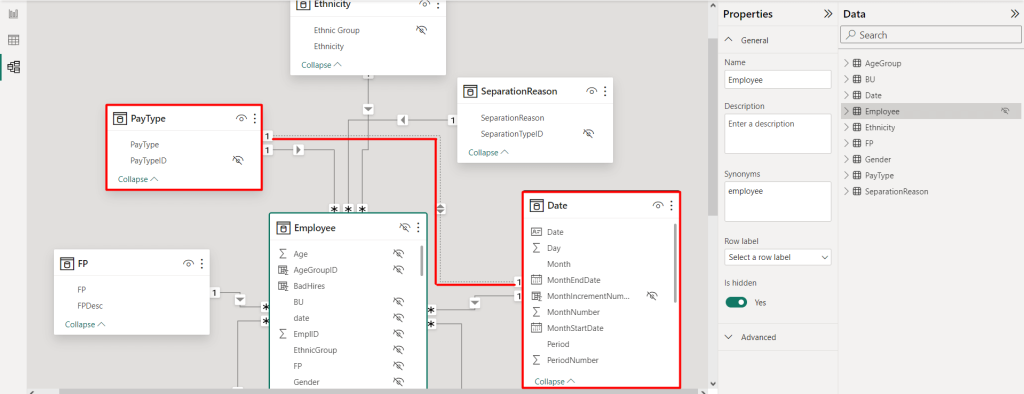
Power BI creates date tables from another table as well as builds relationships with them.
After creating a date table in Power BI, you can establish or modify its relationship with other tables by following the steps below:
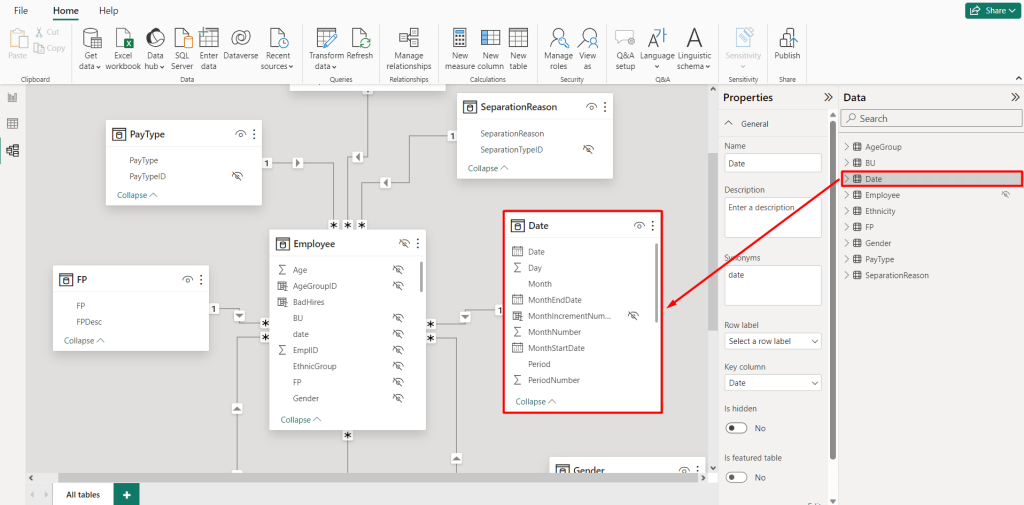
- Open the Power BI desktop, then click on the “Model” view icon in the formula bar. You can manage the relationships between Power BI tables here.
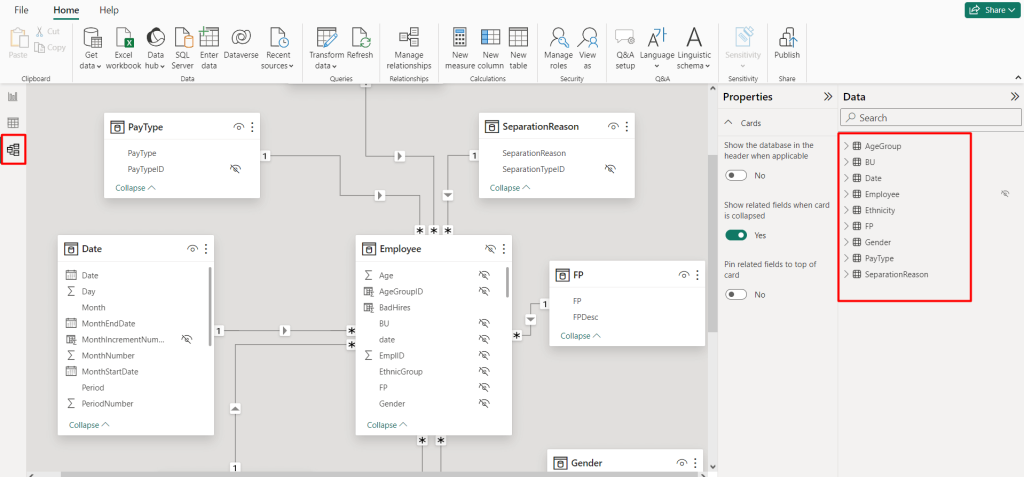
- Click on the table names from the right sidebar and drag the date column into the dashboard to build a relationship with the other corresponding tables.
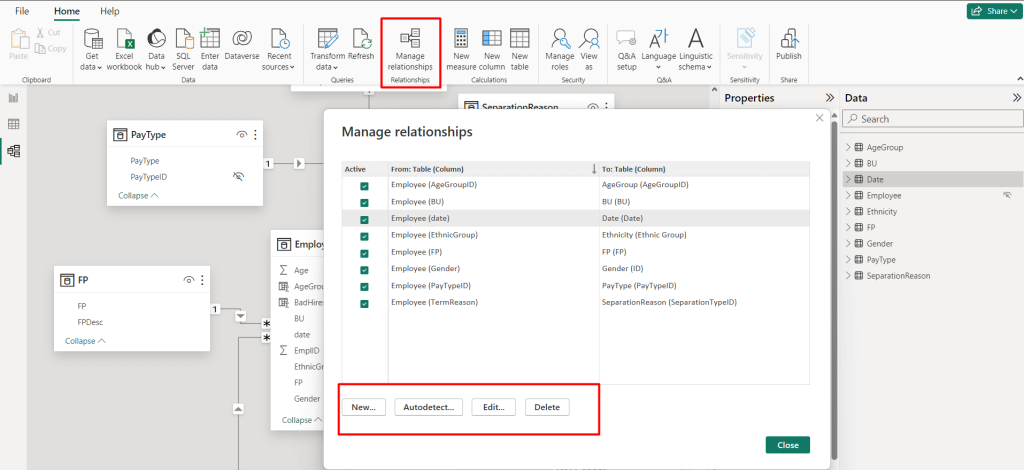
- Or, create relationships by selecting both date columns and using the “Manage Relationship” button. Here you can configure relationship properties such as adding new ones, editing existing ones, or deleting them if necessary.
- To create a new relationship, click on “New”. Now, create a relationship between tables. For this, select a table from the first drop-down option. Here, we’ve selected the “Date” table (in the screenshot).
- Select another table (e.g. PayType) from the second drop-down menu to build a relationship with the date table.
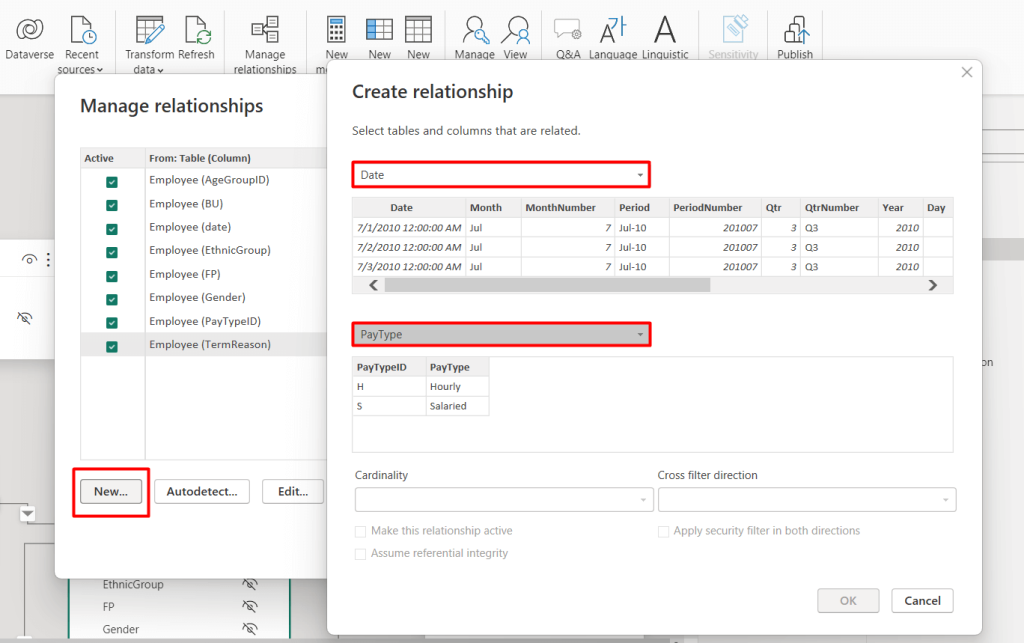
- Now select the columns you want to create a relationship between these 2 tables. Also, define the relationship’s cardinality such as one-to-many or many-to-one. Then, configure the relationship cross-filter direction as both or single, make it active/deactivate, and apply a security folder if required.
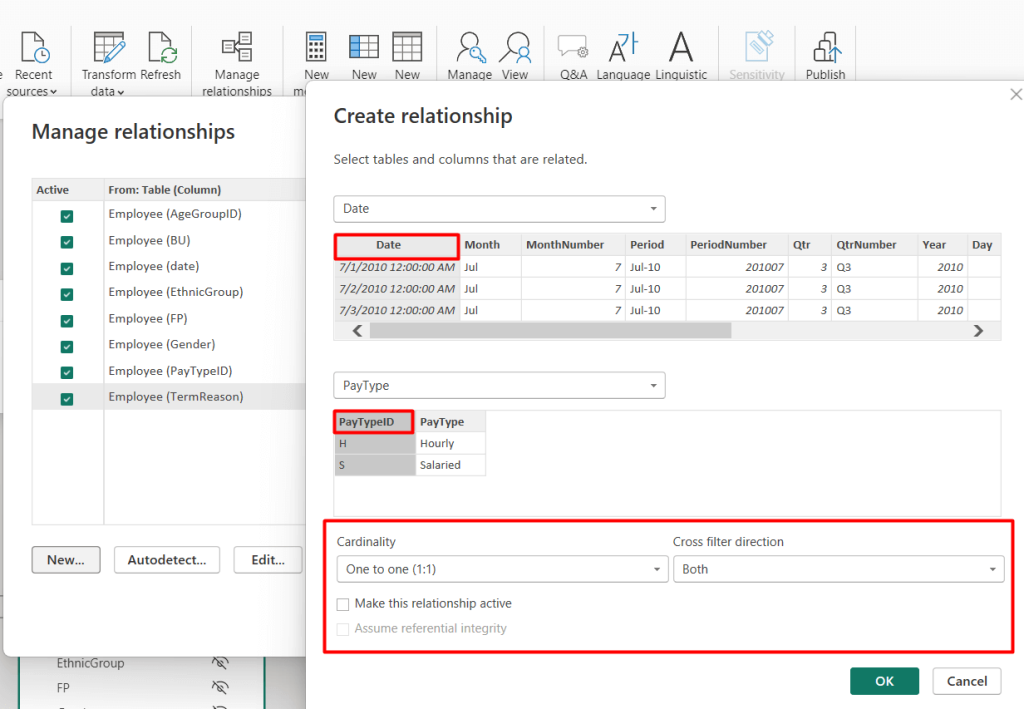
- Finally, click on “OK”. You can see the one-to-one relationship between the ‘Date’ table and the ‘PayType’ table in the Power BI model view.
Essential requirements of a Power BI date table
When creating a date table in Power BI, there are a few important requirements. These requirements serve as a solid foundation for time-based analytics in Power BI.
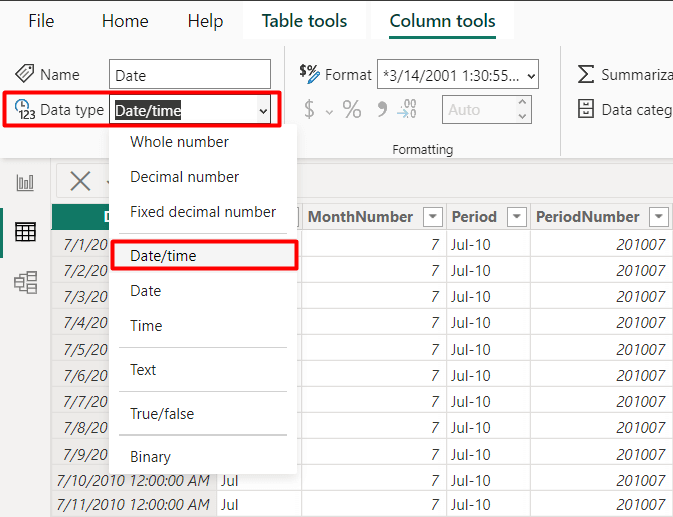
Date column with data type ‘date’
The date table must include a column with a data type of ‘date’ or date/time. Using a ‘date’ data type ensures accurate representation and manipulation of date information in the date table. To do so:
- Click on the column containing the dates
- Click on the “Date type”. It will show a drop-down menu with the categories
- Select the “Date/time” option
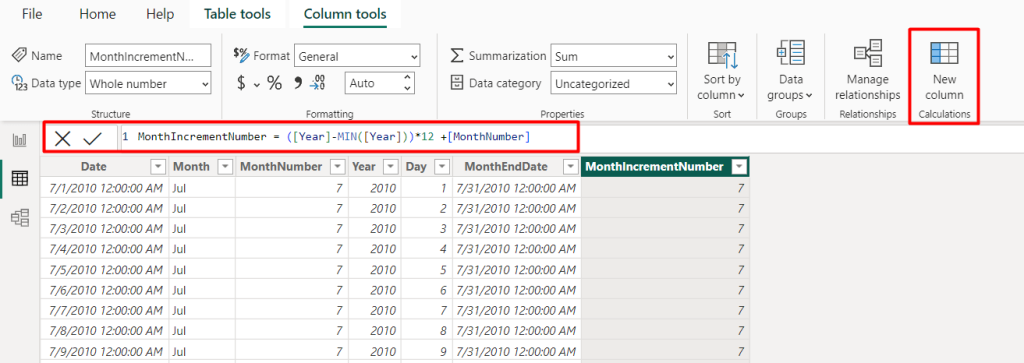
Time intelligence columns
You need to add time intelligence functions to enhance the date table’s functionality for dynamic calculations. You can add date columns for time intelligence functions such as Month-to-Date, MonthStartDate, MonthEndDate, MonthIncrementNumber, Year-to-Date, etc.
For instance, to add MonthIncrementNumber:
- Click on “New column”
- Write a simple function
fx = MonthIncrementNumber = ([Year]-MIN([Year]))*12 +[MonthNumber]
- Click on the tick mark at the left side of the function, and the column will be added to the date table.
No gaps or overlaps
You have to ensure there are no gaps/blanks or overlaps in the date fields. The table should be a continuous sequence of dates without missing or duplicated entries for consistency in calculations.
Complete date range
The date table should cover the entire range of dates present in your dataset. You should ensure it starts from the earliest date to the latest date to support comprehensive time-based analysis.
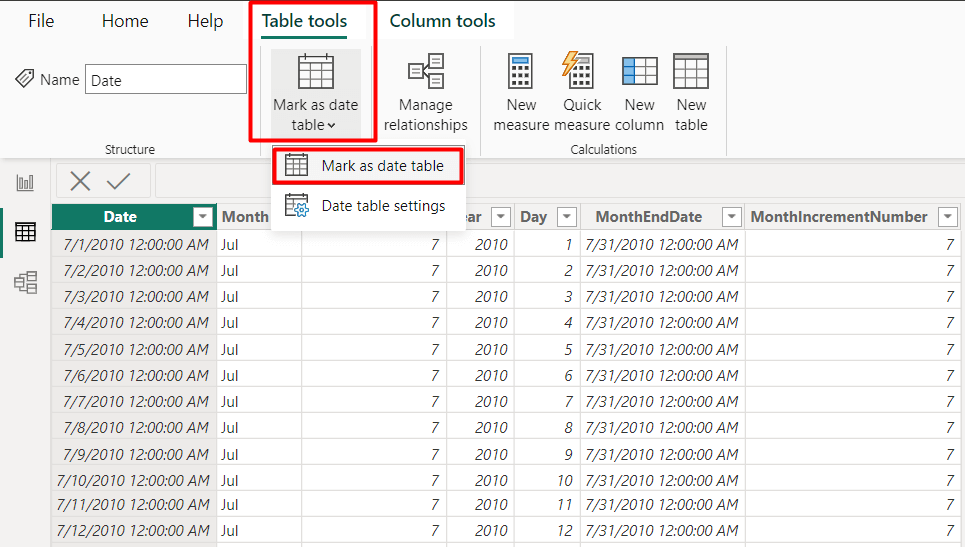
Marked as a date table
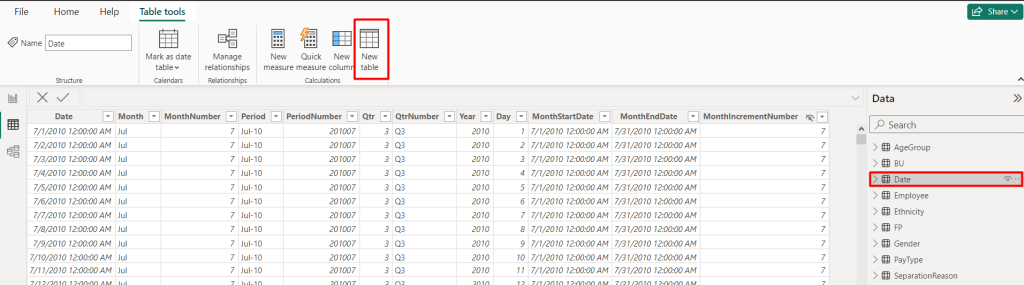
To fully utilize Power BI’s time intelligence features, the date table must be explicitly marked as a date table. This designation informs Power BI that the table contains date-related information.
- After creating the date table in Power BI, go to the “Table tools”.
- Click on “Mark as date table”. It will show a drop-down menu.
- Select “Mark as date table”, and you are good to go.
Best practices for creating dynamic Power BI date tables
Optimal date table design guarantees precise temporal data representation and impactful insights. To create a well-designed date table, you can incorporate these 5 best practices for a streamlined process.
Understand data source characteristics
First of all, analyze your data source e.g. Excel to understand the date values, range, and granularity. This information will help you determine the appropriate periods for your dynamic date table.
Determine dynamic time periods
Identify the dynamic periods relevant to your analysis, such as fiscal years, quarters, months, weeks, etc. Create columns in your date table to represent these periods for easy filtering and grouping in visuals.
Parameterize start and end dates
Implement parameters for start and end dates in your Power BI date table to adapt to changing data scenarios. This allows for flexibility in adjusting the date range without modifying the underlying DAX code.
Incorporate time zone considerations
Consider incorporating time zone adjustments in your date table when you have your data spans of multiple time zones. Ensure that all date-related calculations are consistent across different time zones to avoid discrepancies in your analysis.
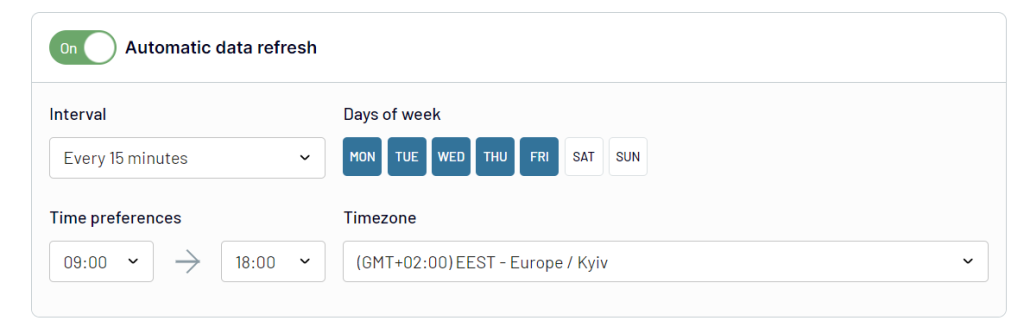
Regular data refresh and update
Schedule regular data refreshes to keep your date table up-to-date. This is crucial for maintaining the accuracy of your time-based analysis, especially when new data is added or existing data is modified. This can be easily done using Coupler.io which allows you to refresh your data as frequently as every 15 minutes!
Can I do without date tables visualization in Power BI
While it’s technically possible to work without date tables in Power BI, date tables significantly enhance the depth and accuracy of your reports. Plus, they are a valuable component in Power BI data modeling.
Moreover, date tables facilitate trend tracking, precise period comparisons, and custom intervals like fiscal years. Also, you can create Power Bi date table with month and year. Besides, using date tables in Power BI can boost calculations with built-in time and business intelligence functions, addressing irregularities and saving time on complex DAX formulas.
Overall, creating Power BI date tables is not just a convenience but a strategic advantage. It helps to understand your data better, ultimately leading to more informed and insightful decision-making.
To learn more about Power BI, check our articles on creating a pivot table in Power BI, RANKX Power BI, and CONCATENATE in Power BI.


