Understanding the difference between the two dates can reveal valuable insights for your business. The DATEDIFF function in Microsoft Power BI is an essential tool for this and is widely used for its ability to handle date calculations. Mastering DATEDIFF offers you the precision needed to turn raw data into strategic actions. This guide shows you how to make the most of this essential tool.
What is the DATEDIFF function in Power BI?
Simply put, the Power BI DATEDIFF function calculates the difference between two dates and returns the result in time units like seconds, minutes, hours, days, weeks, months, quarters, or years.
In data analysis and reporting, DATEDIFF is indispensable for calculating date differences, whether you’re creating calculated columns or setting up dynamic filters in reports.
Where you can use the function
Here are some common scenarios of how DATEDIFF is used across different industries:
- Project Management: Monitor project durations, e.g., from inception to completion.
- Human Resources: Figure out how long employees have been with the company or since their last promotion.
- Sales: Evaluate the time between a customer’s first and last purchases. This can help businesses identify loyal customers and tailor marketing efforts to encourage repeat purchases, ultimately boosting customer retention and sales growth.
- Finance: Calculate the duration of a loan from the start date to the end date. This helps determine the total interest payable over the loan period.
- Inventory: Track how long items stay in stock. This helps identify fast-selling products and improve cash flow.
If you’re an Excel user, the function is called DATEDIFF. While it has similar use, DATEDIFF in Power BI offers more flexibility, allowing you to calculate the difference in more granular units like hours, minutes, and seconds.
DATEDIFF syntax
The DATEDIFF syntax is as follows:
DATEDIFF(<Date1>, <Date2>, <Interval>)
This function expects you to apply these three parameters:
Date1: The start date in datetime format.Date2: The end date in datetime format.Interval: The time unit interval in which you want the difference returned. Specify one of these values in this parameter: SECOND, MINUTE, HOUR, DAY, WEEK, MONTH, QUARTER, or YEAR.
The return value of the DATEDIFF function is an integer. If the Date1 is later than Date2, the result will be negative.
The following table shows a few examples of how to use the DATEDIFF function with different intervals:
| Example formula | Return value |
|---|---|
= DATEDIFF(DATE(2022, 1, 1), DATE(2024, 8, 14), YEAR) | 2 |
= DATEDIFF(DATE(2022, 1, 1), DATE(2024, 8, 14), QUARTER) | 10 |
= DATEDIFF(DATE(2022, 1, 1), DATE(2024, 8, 14), MONTH) | 31 |
= DATEDIFF(DATE(2022, 1, 1), DATE(2024, 8, 14), WEEK) | 137 |
= DATEDIFF(DATE(2022, 1, 1), DATE(2024, 8, 14), DAY) | 956 |
= DATEDIFF(DATE(2024, 8, 14), DATE(2022, 1, 1), DAY) | -956 |
How to use DATEDIFF in Power BI
To start using DAX DATEDIFF in Power BI Desktop, you’ll first need to load your data. By clicking the Get Data button, you can import datasets from various sources and apply the necessary transformations with Power Query. However, if you’re pulling data from cloud marketing platforms like Google Search Console and Facebook Ads, the integration might not be as seamless as you want, as these aren’t natively supported.
This is where Coupler.io comes in handy. As a reporting automation tool, it integrates with over 60 cloud data sources, making data preparation and integration straightforward. Coupler.io not only allows you to calculate date differences and make other data transformations before loading your data into Power BI, but it also lets you set up automatic schedules to refresh your data seamlessly. You can explore these features for free by selecting the data source dropdown below:
Once your data is loaded and prepped using Coupler.io, you’re ready to apply the DATEDIFF function to analyze date differences and uncover valuable insights.
A step-by-step guide to using DATEDIFF in Power BI Desktop
Let’s say you have a SalesOrder table with OrderDate and ShipDate columns. You want to know the gap between the order date and the ship date, as this will help you to optimize the delivery process. Calculating the duration between these two date columns can be done using DATEDIFF.
Here’s how you do it:
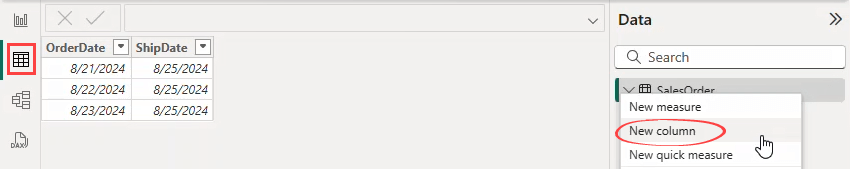
- Click the Table view icon on the left.
- In the Data pane, right-click on the SalesOrder table and select New column to create a new calculated column.
- Move to the formula bar and enter the new column name along with the DATEDIFF formula:
Duration in days = DATEDIFF([OrderDate], [ShipDate], DAY)
- Press Enter, and you’ll see the results.
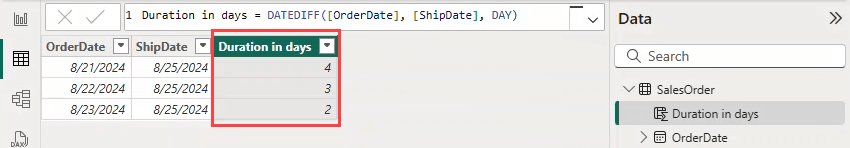
Now, you can see how many days it takes to ship each order. This data can be a valuable addition to your Power BI dashboards.
Please note that only complete intervals will be displayed. If you choose MONTH as the interval, the difference between the two dates must be in separate months for the function to return a value greater than zero.
Power BI DATEDIFF between two columns
To use DATEDIFF between two columns in the same table, simply select the date columns you wish to compare, as well as the interval. We’ve shown how to do this in our previous example:
= DATEDIFF([OrderDate], [ShipDate], DAY)
If you want, you can use fully qualified column names:
= DATEDIFF(SalesOrder[OrderDate], SalesOrder[ShipDate], DAY)
This clarifies which table the columns are from, which is helpful if you have multiple tables with similar names.
Power BI DATEDIFF between two tables
Using DATEDIFF between two tables requires that the tables have a relationship. This step is crucial because it allows the DAX functions to navigate the tables and retrieve the necessary data accurately. If the tables are not related yet, you’ll need to create a relationship first.
Let’s look at the scenarios below to calculate the date difference in days between the order date and the ship date for one-to-one, one-to-many, and many-to-many relationships.
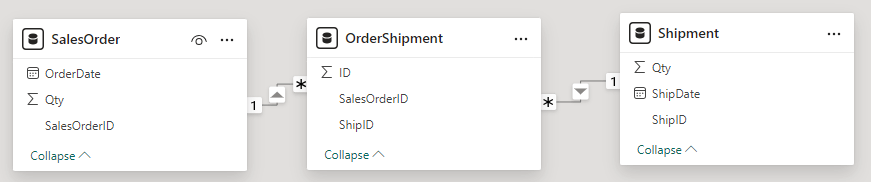
Example 1: One-to-one relationship
A simple example is when you have sales orders and shipments in two separate tables, and each record in the SalesOrder table corresponds to exactly one record in the Shipment table.
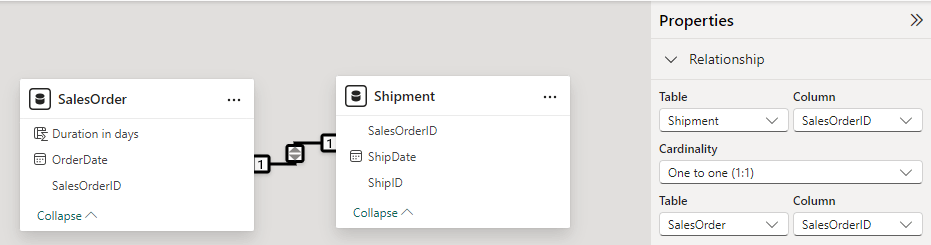
If you want to add the new calculated column in the SalesOrder table, you would use the following formula:
= DATEDIFF(SalesOrder[OrderDate], RELATED(Shipment[ShipDate]), DAY)
Here, the formula uses the RELATED function to fetch the ShipDate from the Shipment table for each corresponding SalesOrderID in the Shipment table.
Example 2: One-to-many relationship
In a one-to-many relationship, each record in one table may correspond to multiple records in the related table. For instance, a single sales order might have multiple shipments due to partial deliveries.
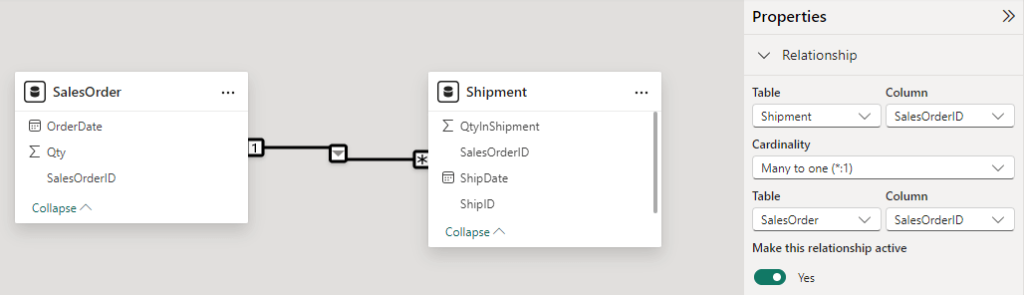
When calculating the date difference, you may want to use the earliest shipping date for each order:
= DATEDIFF(SalesOrder[OrderDate], CALCULATE(MIN(Shipment[ShipDate]), RELATEDTABLE(Shipment)), DAY)
Example 3: Many-to-many relationship
In a many-to-many relationship, things get more complex. Here, both tables can have multiple records related to each other, so you need a relation table.
Let’s say you want to calculate the difference in days between the OrderDate and the earliest ShipmentDate. Here’s the formula you use in a new column in the SalesOrder table:
Days to first shipment =
MINX(
    FILTER(
        OrderShipment,
        OrderShipment[SalesOrderID] = SalesOrder[SalesOrderID]
    ),
    DATEDIFF(
        SalesOrder[OrderDate],
        RELATED(Shipment[ShipDate]),
        DAY
    )
)
In this formula, FILTER is used to identify all related records in the OrderShipment table for each SalesOrderID. MINX then calculates the minimum date difference for these records using the Power BI DATEDIFF function.
DATEDIFF Power BI examples
Here are some practical examples of using the DATEDIFF function in Power BI, demonstrating its versatility in real-world scenarios.
Example 1: Age calculation in years and months
It may be necessary to express the duration in combinations of the various Date elements, such as years and months. This involves extracting different date elements and then recombining them.
The following formula calculates the difference between the BirthDate column and today’s date. It then displays the difference in years and months.
Age = DATEDIFF(Person[BirthDate],TODAY(),YEAR) & " years " & MOD(DATEDIFF(Person[BirthDate],TODAY(),MONTH), 12) & " month"
Result:
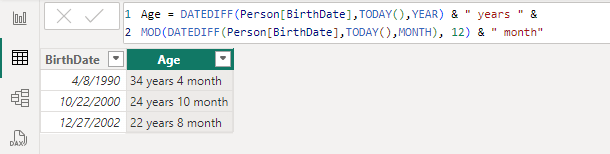
This formula uses the MOD() function to get the remaining months after dividing the total months by 12. It highlights full years and any extra months between the dates.
Note: This method simply counts month boundaries, so January 31 to February 1 counts as one month.
Example 2: Calculating the number of days since an employee’s hire date
Using DAX DATEDIFF combined with the FIRSTDATE function can be very useful in various scenarios. This is especially useful when you want to know how many days have passed since an important date, like when a customer first bought something or how long an employee has been with the company.
In HR analytics, you may need to calculate the number of days an employee has been with the company since their hire date. The following formula does the job:
DaysSinceHire = DATEDIFF(FIRSTDATE(Employees[HireDate]), TODAY(), DAY)
This info can be useful for performance reviews, tenure-based benefits, or understanding employee loyalty.
Example 3: Project timeline calculation in fractions of years
Power BI’s YEARFRAC function calculates year fractions between two dates. However, if you have non-standard year lengths, you can use DATEDIFF to find the number of days between two dates and then divide the result by a custom year length for accuracy.
In project management, a project might span 250 working days, excluding weekends and holidays. To calculate the YEARFRAC with a custom divisor, use the following formula:
ProjectYearFrac = DATEDIFF(Projects[StartDate], TODAY(), DAY) / 250
A custom divisor in the above DATEDIFF formula lets you adjust YEARFRAC for specific project needs, offering more precise insights.
Example 4: Custom working days calculation
The DATEDIFF function can be useful for custom working days calculations, especially when the standard NETWORKDAYS function doesn’t meet specific requirements.
Scenario:
Let’s say you work for a company that operates on a 4-day workweek (Monday to Thursday) and observes specific company holidays that are not standard public holidays. You need to calculate the number of working days between two dates, excluding weekends and company-specific holidays.
Example tables:
- Table:
| StartDate | EndDate |
| 8/1/2024 | 8/8/2024 |
| 1/4/2024 | 2/14/2024 |
| 11/20/2024 | 12/28/2024 |
- Holidays:
| HolidayDate |
| 1/10/2024 |
| 8/6/2024 |
| 12/25/2024 |
To use DATEDIFF for calculating network days based on the above details, here are the steps:
- Create a new measure with the following formula:
WorkingDays =
VAR Date1 = MAX('Table'[StartDate])
VAR Date2 = MAX('Table'[EndDate])
VAR MinDate = MINX({Date1, Date2}, [Value])
VAR MaxDate = MAXX({Date1, Date2}, [Value])
VAR _Calendar = ADDCOLUMNS(EXCEPT(CALENDAR(MinDate,MaxDate), Holidays), "_Weekday", WEEKDAY([Date],2))
RETURN COUNTX(FILTER(_Calendar, [_Weekday] < 5), [Date])
- Use the WorkingDays measure in a visualization. The following screenshot shows the visualization of both tables:
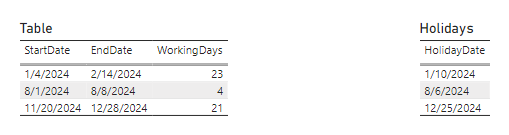
Formula explanation of the DATEDIFF DAX function in the WorkingDays measure:
- The
Date1andDate2variables store the maximum values of theStartDateandEndDatecolumns, respectively. MinDateandMaxDate: These variables ensure that the earliest date comes first, which is crucial for constructing the calendar table._Calendar: This variable constructs a calendar table that includes all dates betweenMinDateandMaxDate, excluding the holidays. It also adds a column,_Weekday, which stores the weekday number (Monday = 1, Sunday = 7) using theWEEKDAYfunction with 2 as the second parameter.- FILTER and COUNTX: The formula filters the
_Calendartable to include only weekdays (Monday to Thursday) and counts the remaining days.
Ready-to-use Power BI dashboard templates
Building Power BI reports from scratch can be complex. It requires time, skill, and patience. That’s why, using ready-made dashboard templates can be a game-changer.
Coupler.io offers a variety of templates tailored to different needs, such as marketing, accounting, and sales. These templates simplify the reporting process, allowing you to focus on analysis rather than setup. Additionally, you’ll find the DATEDIFF function used in the templates, enhancing their functionality by enabling precise date and time calculations.
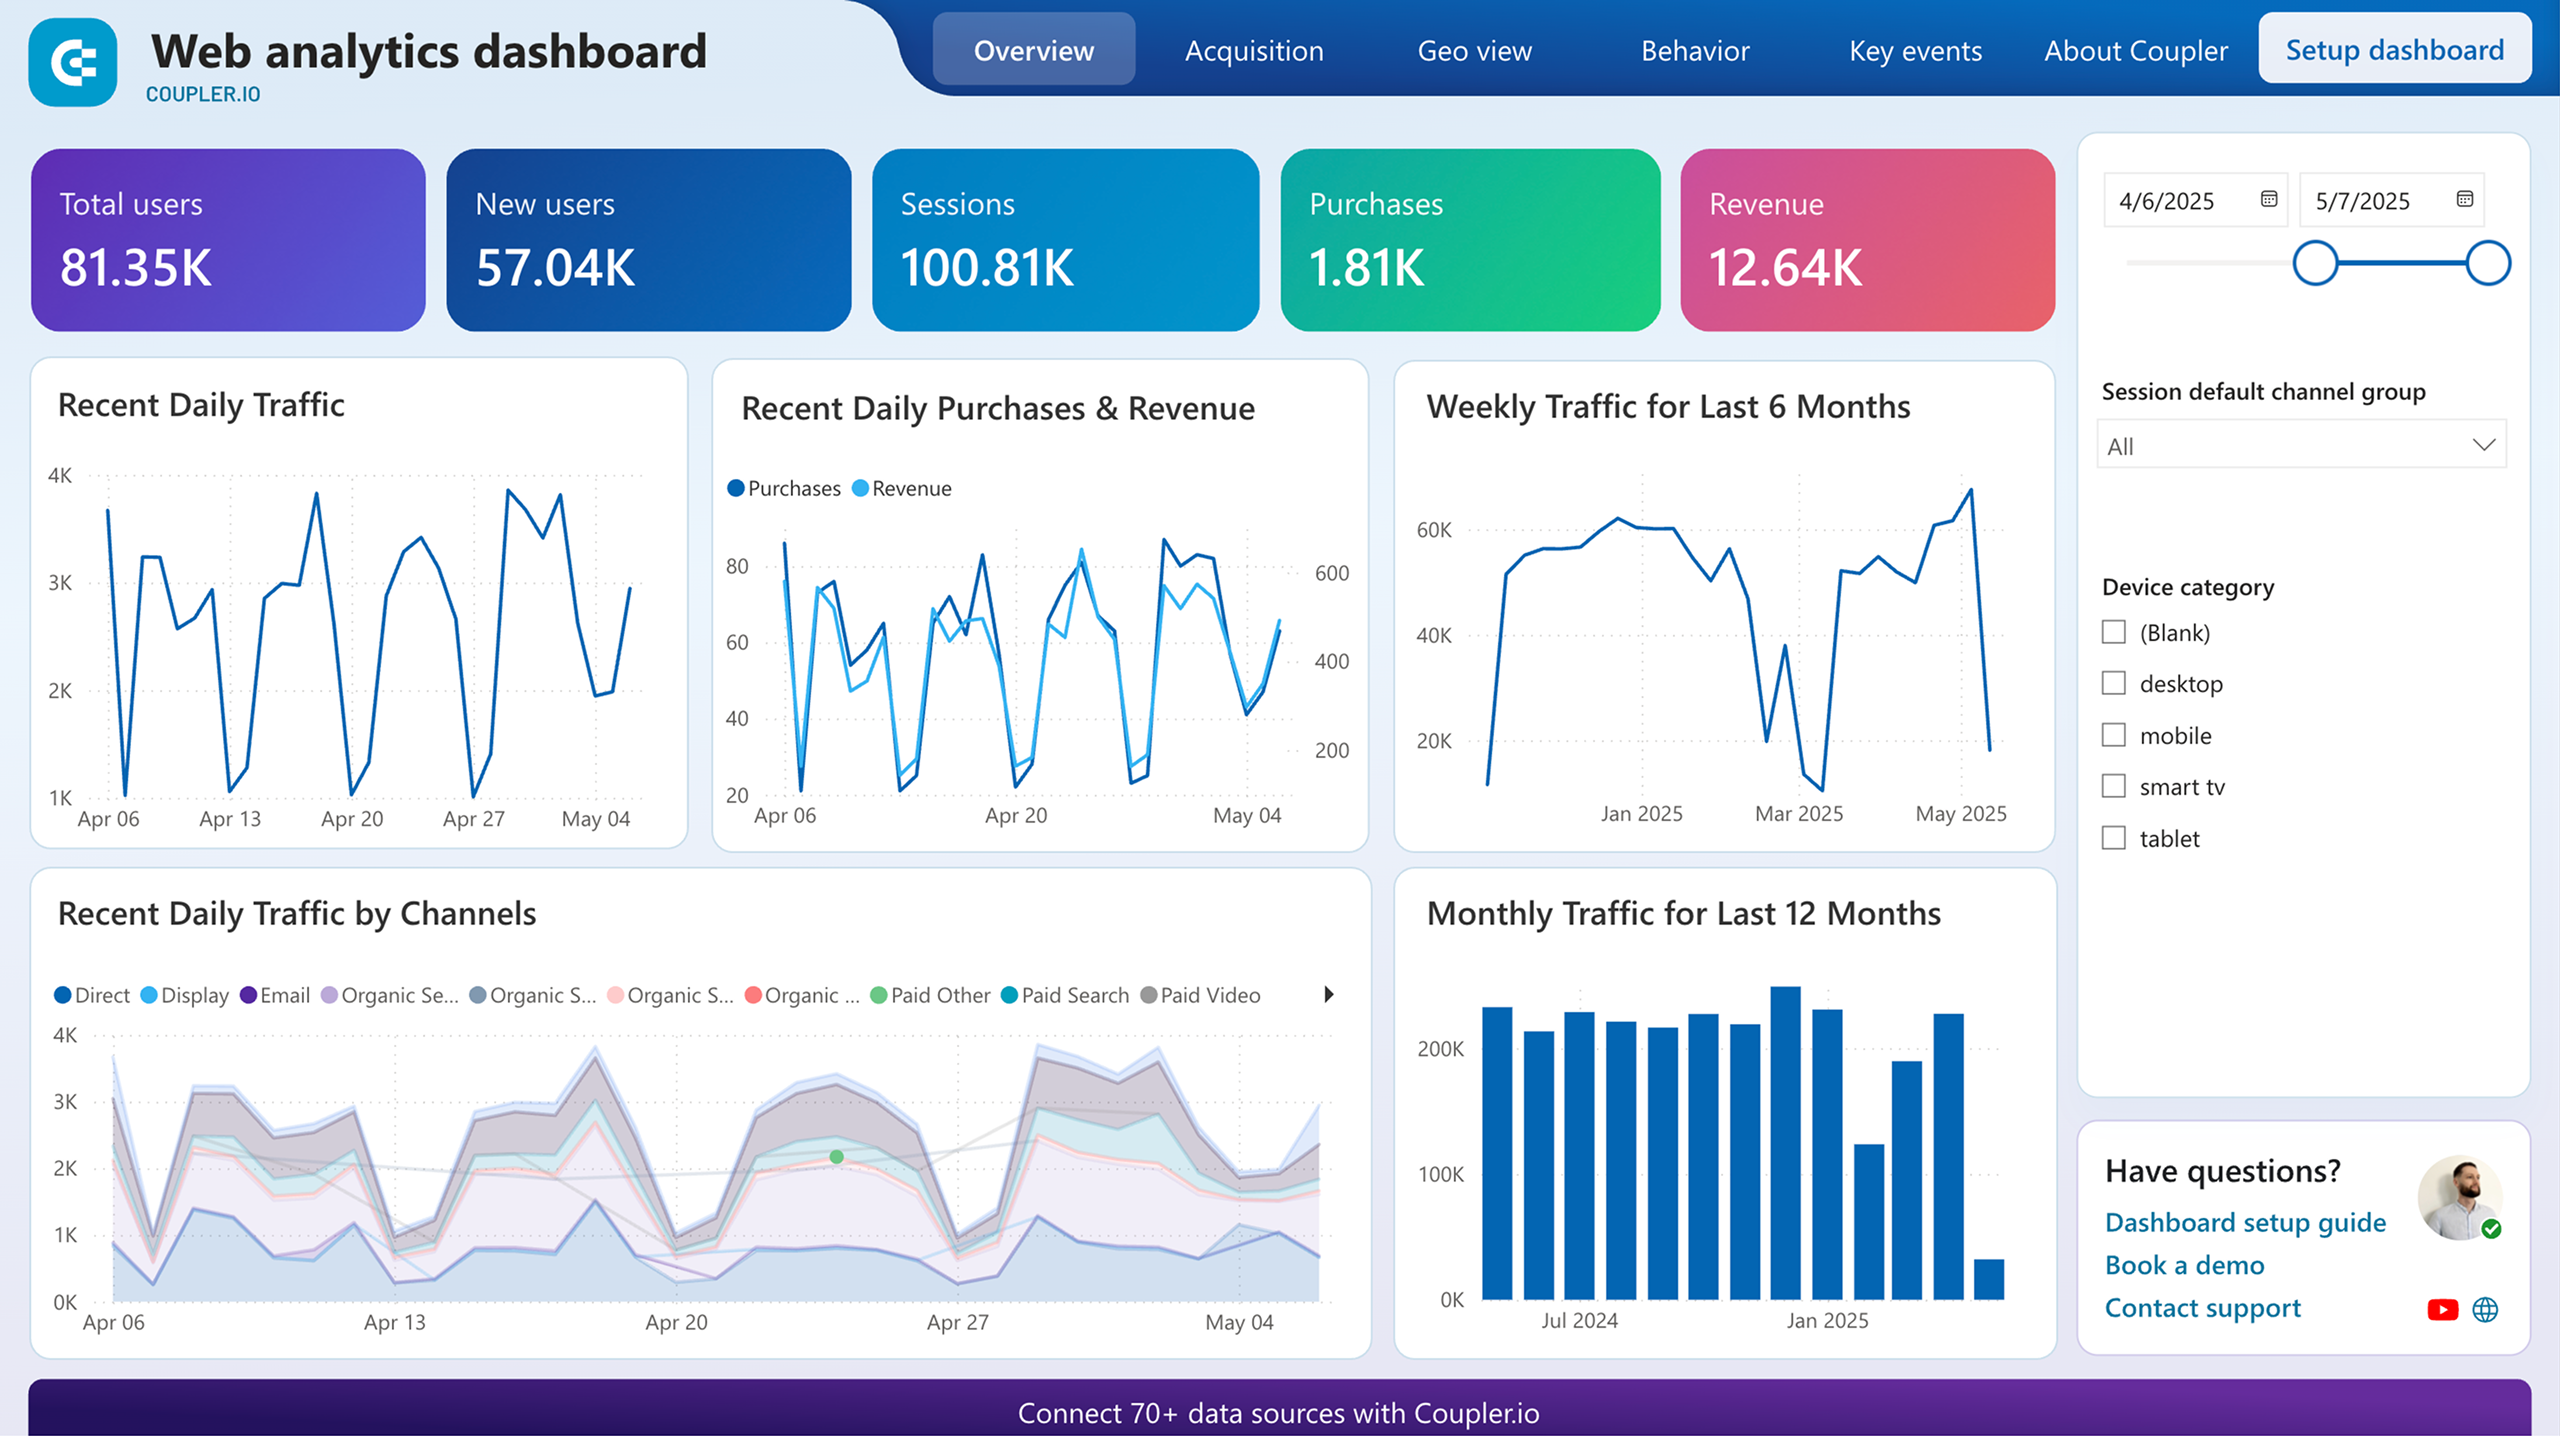
Web analytics dashboard
Discover insights into your website’s traffic acquisition, audience, and conversions with Google Analytics 4 data seamlessly connected to our Power BI dashboard template.


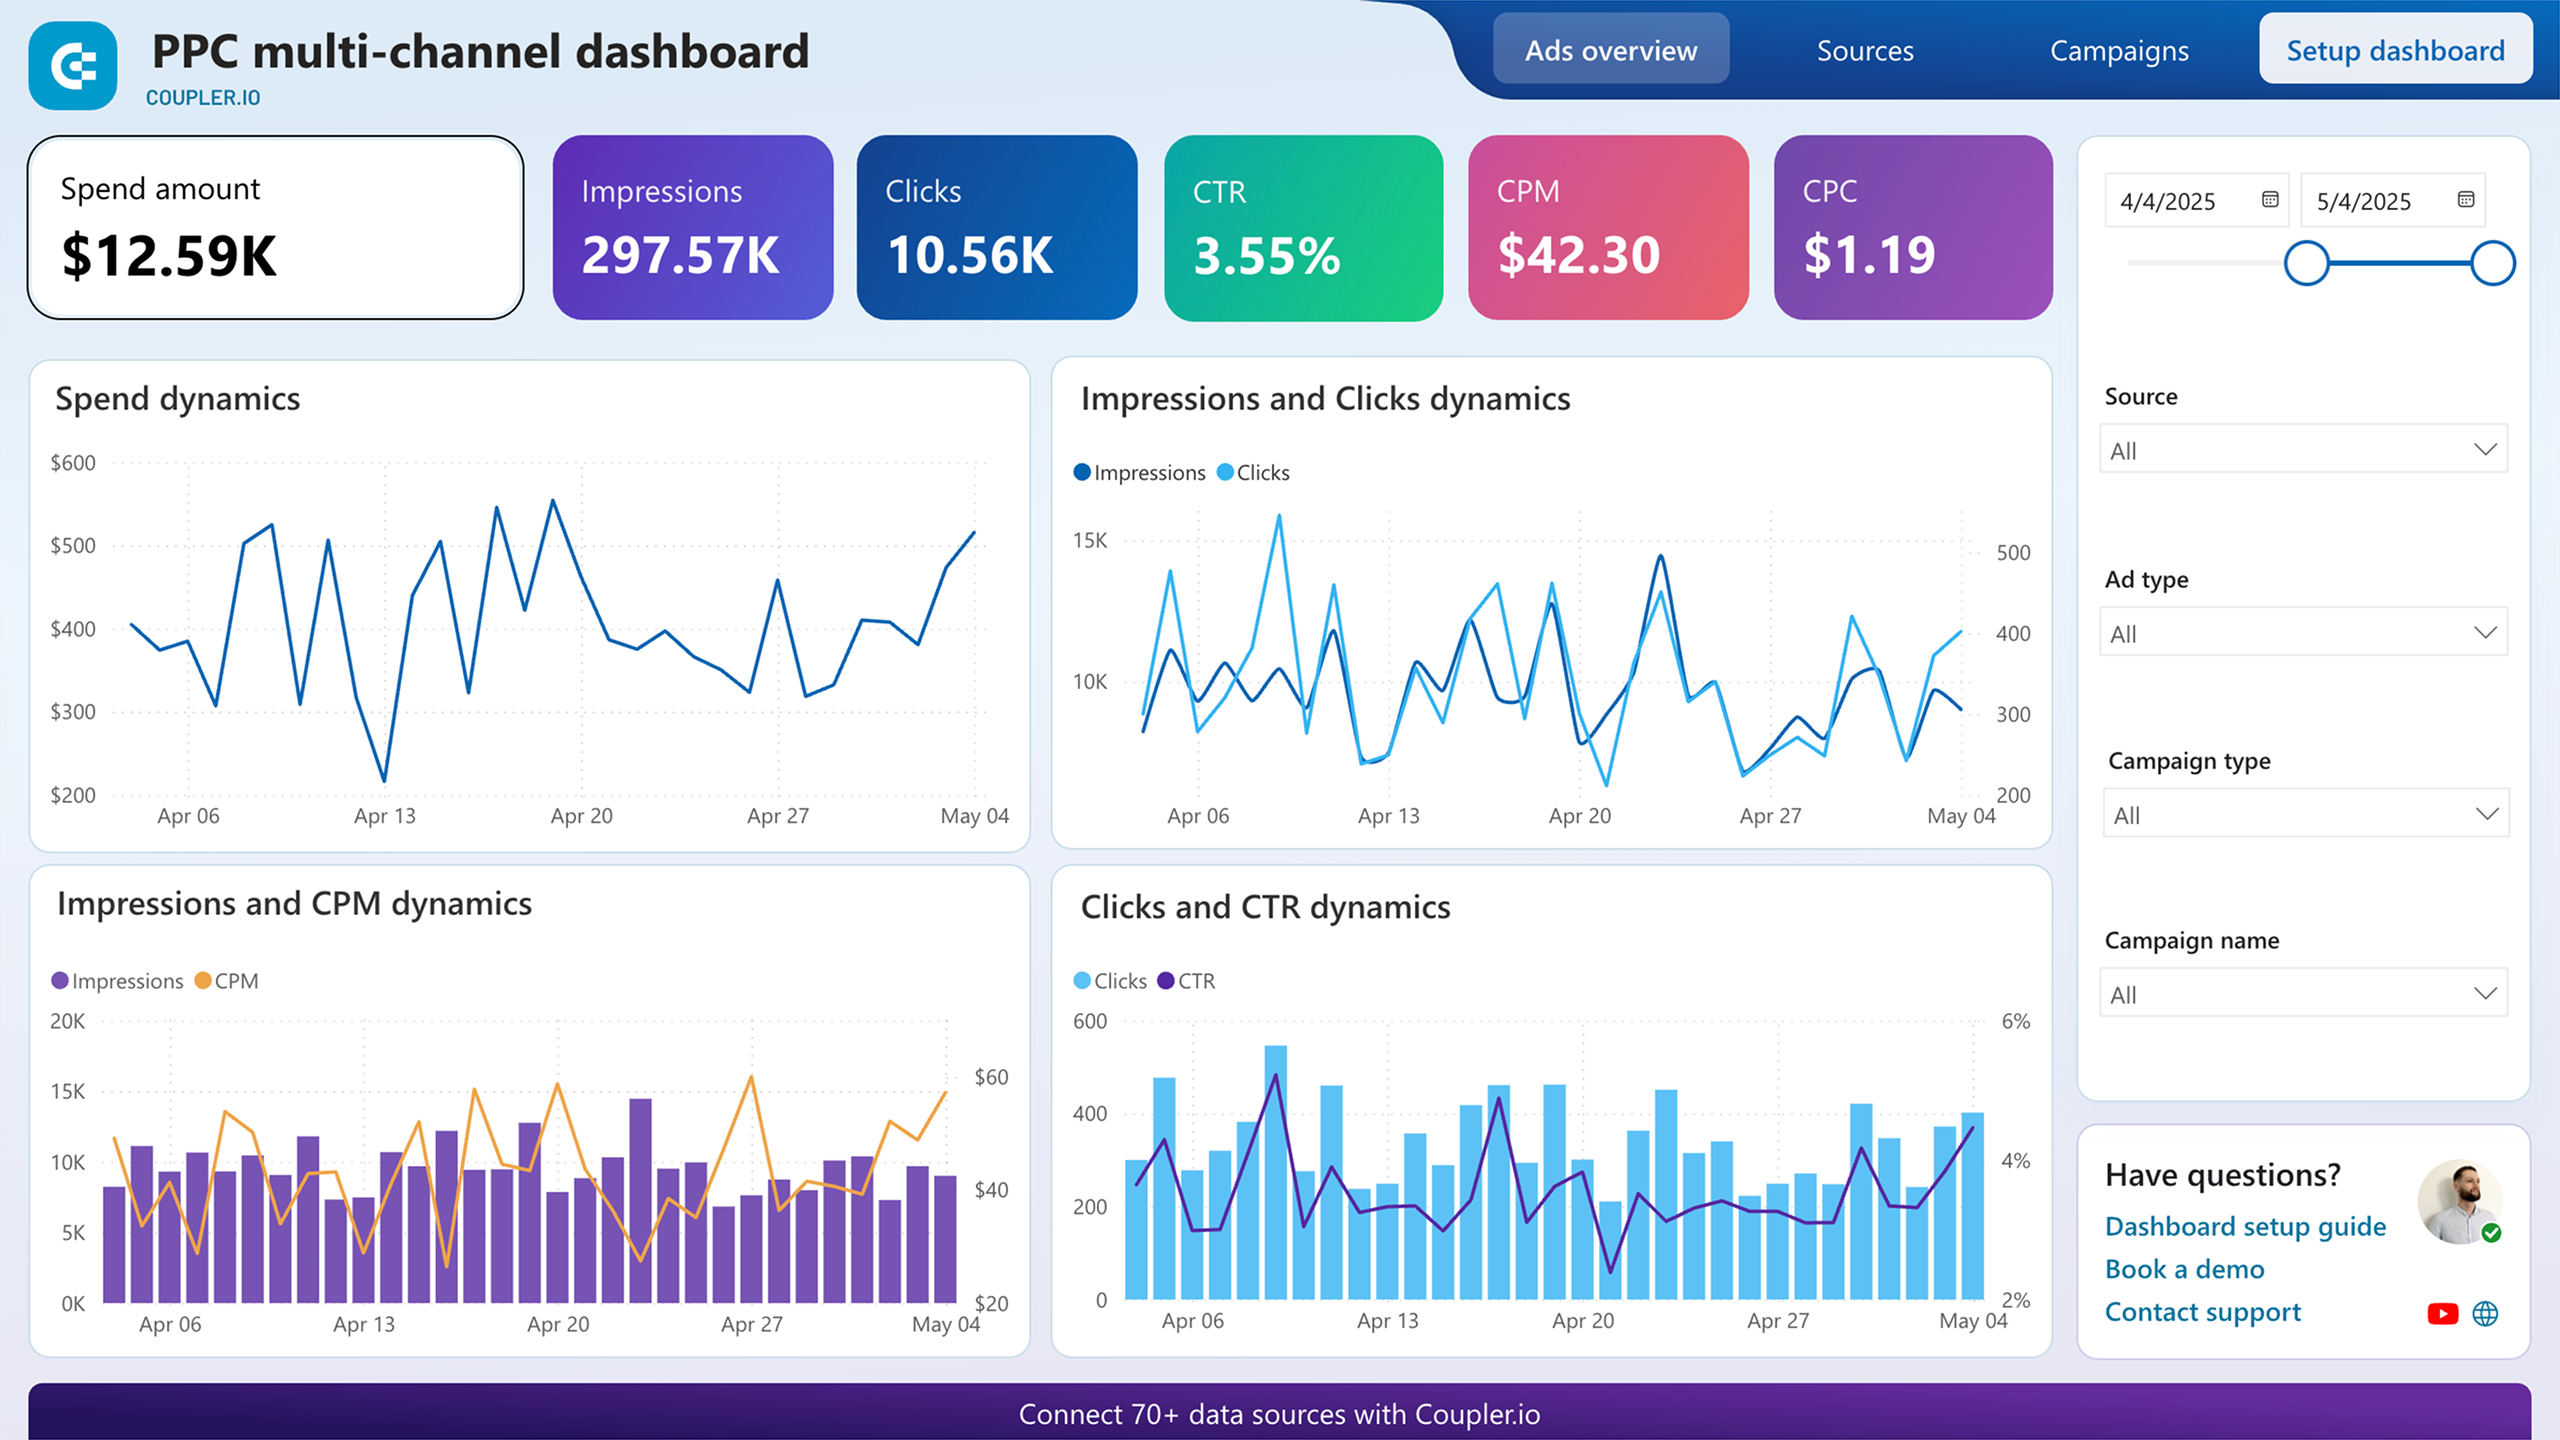
PPC multi-channel dashboard
Utilize a Power BI PPC dashboard for tracking and analyzing your advertising campaigns across multiple platforms.


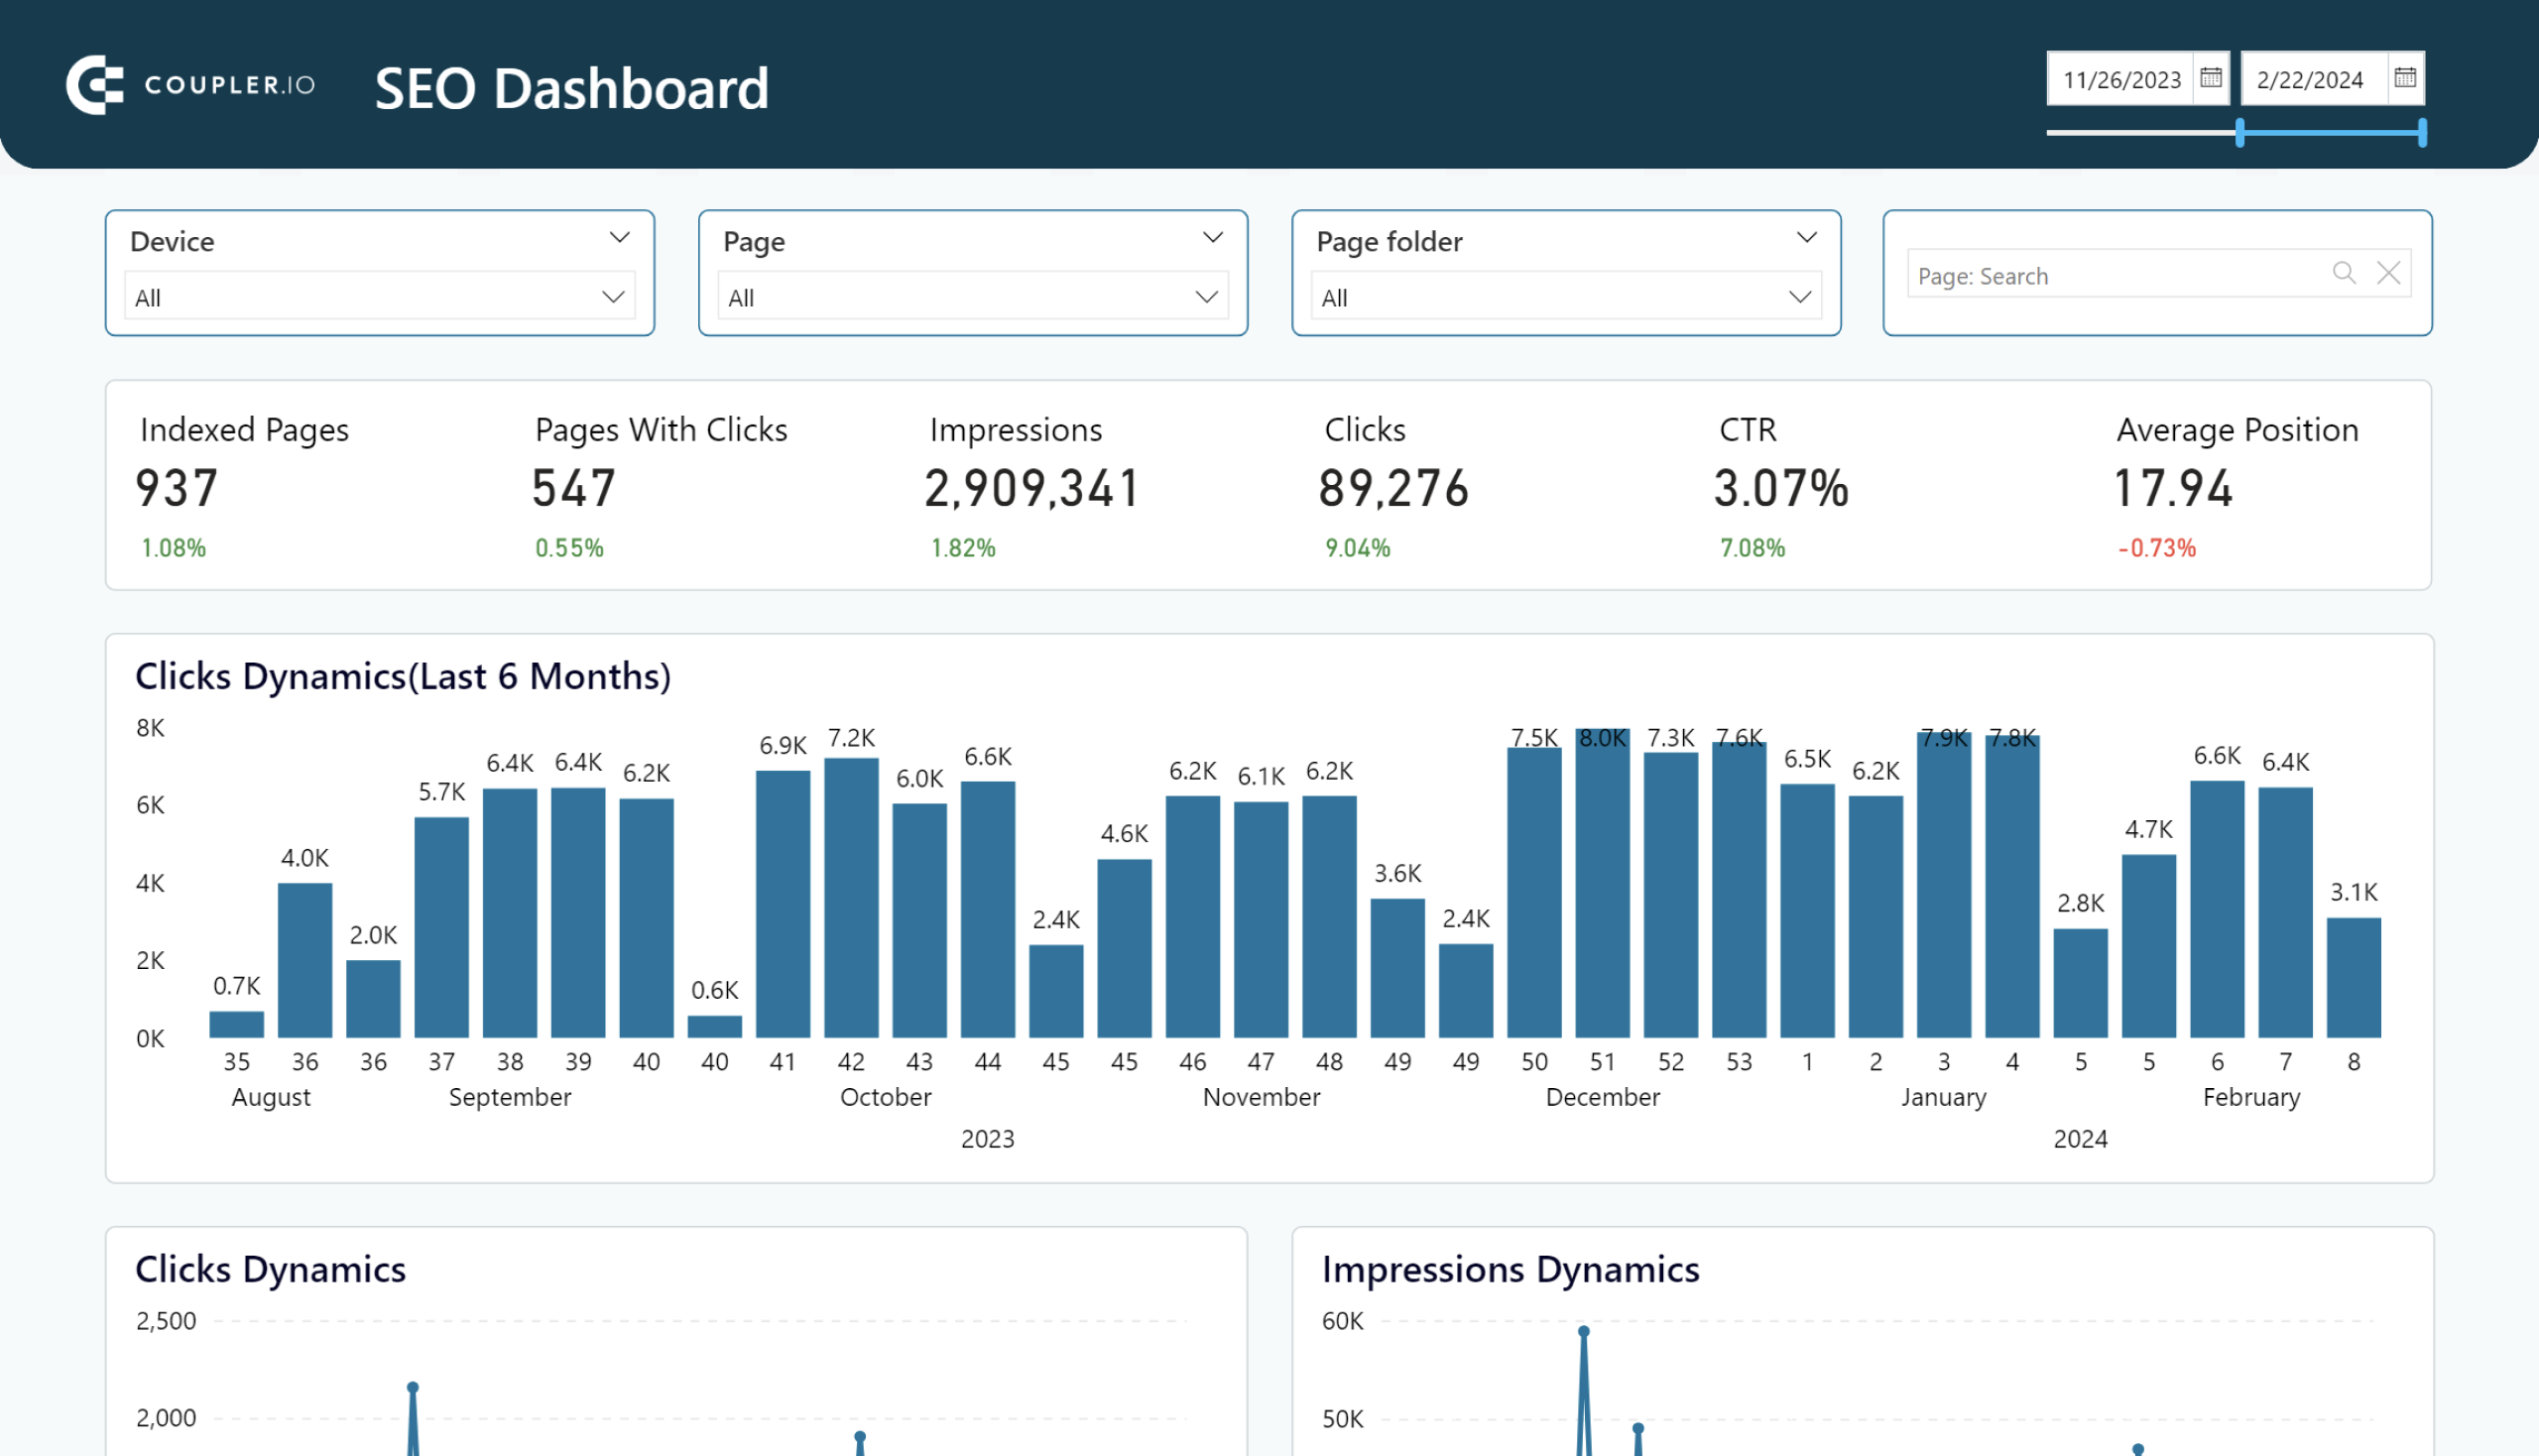
SEO dashboard
Optimize SEO with PowerBI’s dashboard for Google Search Console. Track page rankings, CTRs, and organic traffic efficiently.

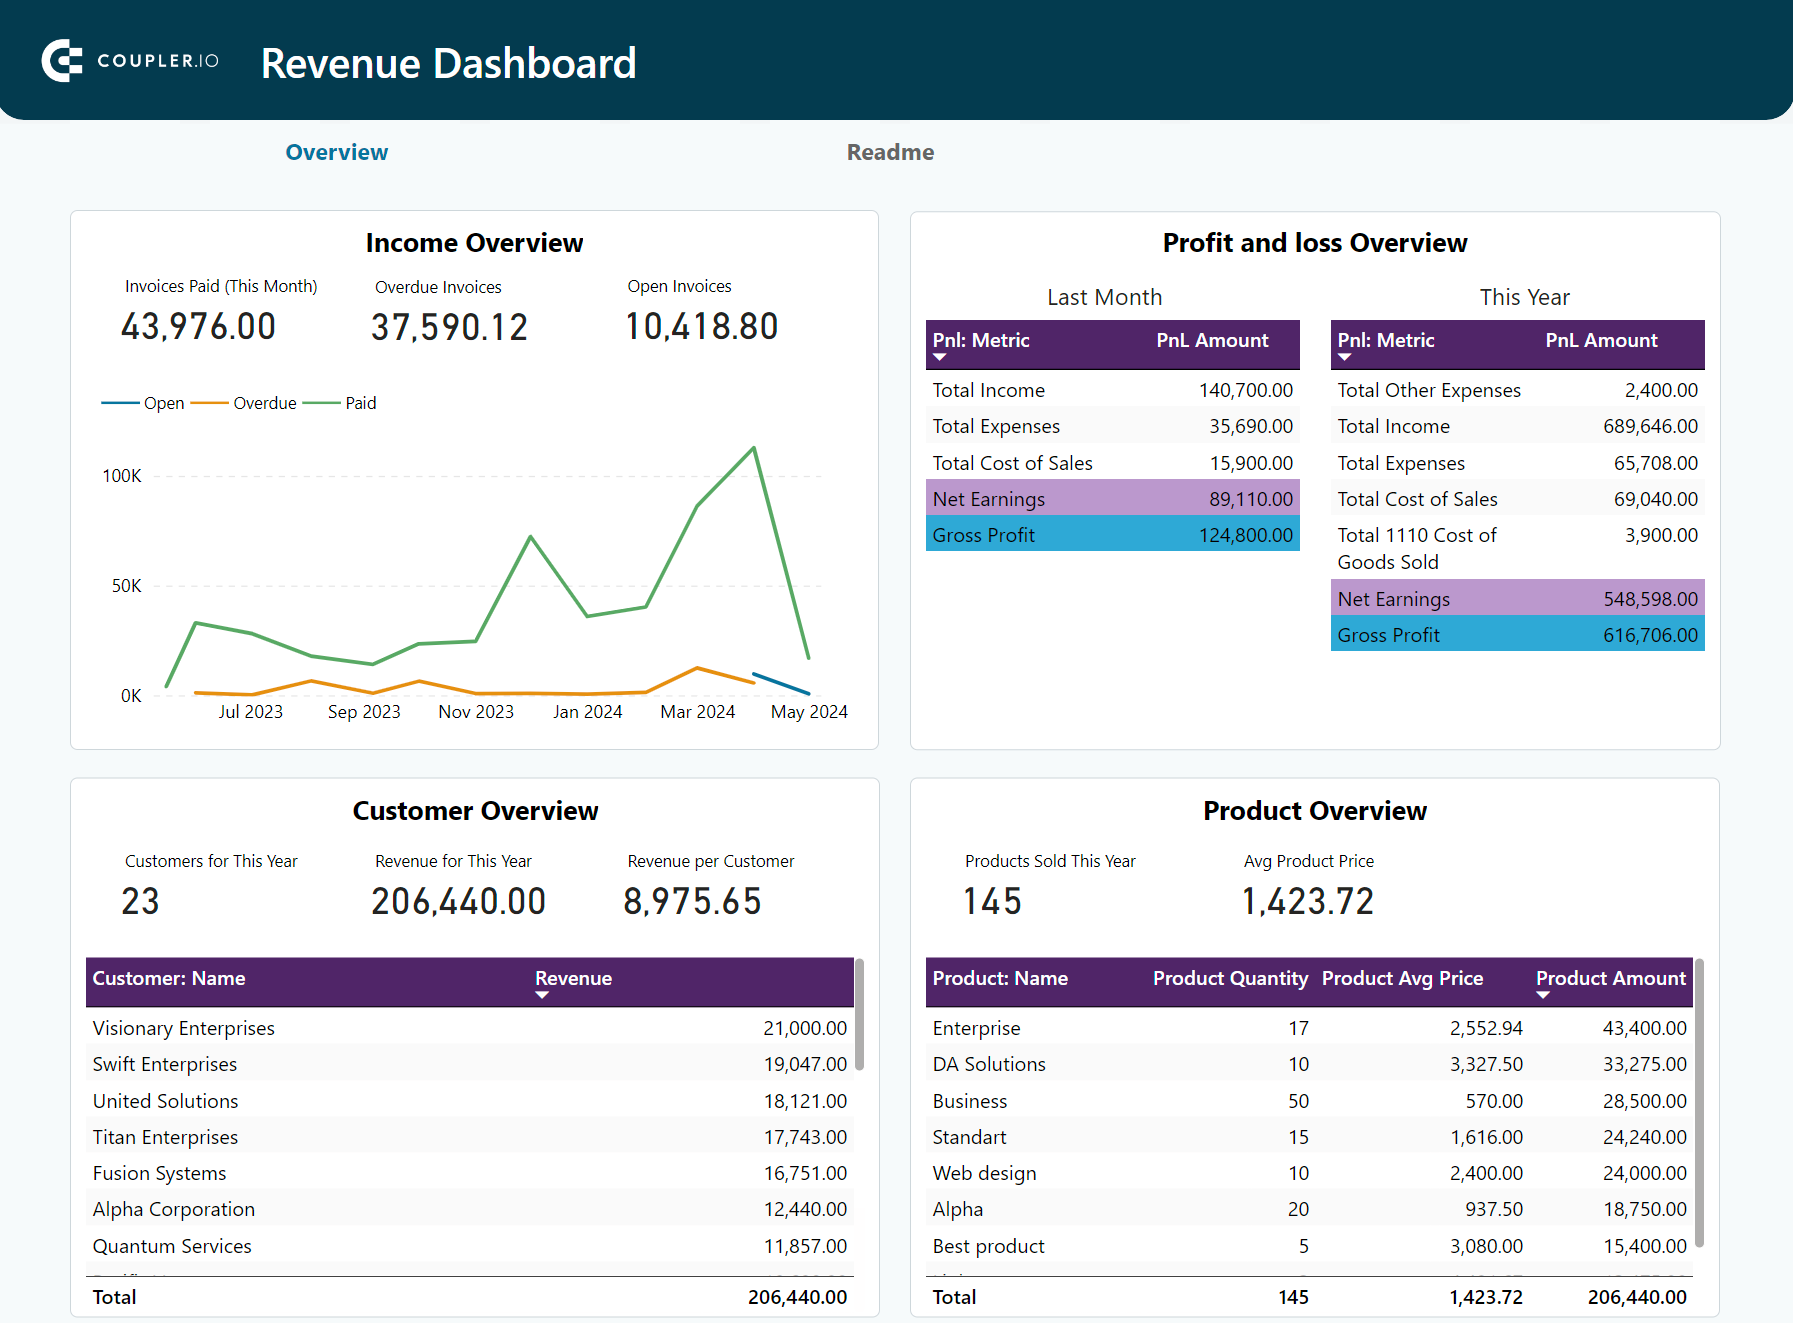
Revenue dashboard for QuickBooks
Monitor your income and expenses on an all-in-one revenue dashboard connected to your QuickBooks Online account.

Master DATEDIFF for advanced reporting in Power BI
We have learned how the DATEDIFF function in Power BI can help calculate the difference between two dates. Whether you’re working on project timelines, tracking customer engagement, or refining business strategies, mastering this function can enhance your data analysis capabilities. Now that you have the know-how, it’s time to take action. Take a deeper dive into your data with Coupler.io’s Power BI dashboard templates. These templates are designed to simplify your reporting process and improve analysis. Start exploring today and unlock a new level of efficiency and insight for your business.
Connect your data sources to Power BI with Coupler.io
Get started for free


