Whether you’re analyzing website traffic, ad performance, or brand awareness, measuring the right things can help you gain valuable insights.
With Power BI, you can create dynamic dashboards that reflect your performance metrics in real time. However, to make the most of its capabilities, a solid understanding of DAX (and DAX functions) is essential for creating custom measures and calculations. Think of it this way:
Your marketing data + DAX functions = insightful KPIs.

What are DAX functions in Power BI?
DAX functions are pre-built formulas in Power BI designed to handle a wide range of analytical tasks. They are categorized into several types, each with a specific purpose, such as aggregation, filtering, and data manipulation.
Many of these functions are also available in Excel because DAX (Data Analysis Expressions) was initially developed with the Power Pivot add-in for Microsoft Excel 2010. However, Power BI includes numerous specialized functions designed specifically for advanced data modeling tasks that Excel doesn’t have.
Through DAX, Power BI allows dynamic filtering within specific calculations. This unique filtering capability gives Power BI an edge over other BI tools, such as Tableau.
It’s also important to note that Power BI has a powerful data model, which is designed to work with multi-system linkage, allowing you to pull and analyze data from multiple systems or sources effectively.
Optionally, you can use Coupler.io to bring data into Power BI easily. This is often more reliable than the built-in methods and it offers features like automatic data updates on the schedule you want. With Coupler.io connector for Power BI, you can pull data from 60+ apps like GA4, Mailchimp, Google Ads, and many more. Try it yourself – select the needed data source in the form below and click Proceed.

You’ll be prompted to create a Coupler.io account for free and then configure the connection to your source app. Follow the instructions to load the data to Power BI and schedule refresh.
Top 10 DAX functions in Power BI for marketers
You’ll find DAX Power BI functions crucial for creating measures and often use them in calculated columns. However, please note that calculated columns don’t always need functions; you may create calculated columns with just simple DAX expressions or constants depending on your needs.
In this section, we’ll show you 10 functions you most likely need for your marketing dashboard. While you can use Power BI DAX functions for calculated columns, the examples here are specific for creating measures.
You can find the 10 functions listed here in our SEO dashboard template, which uses data from Google Search Console.
SEO dashboard for Google Search Console in Power BI

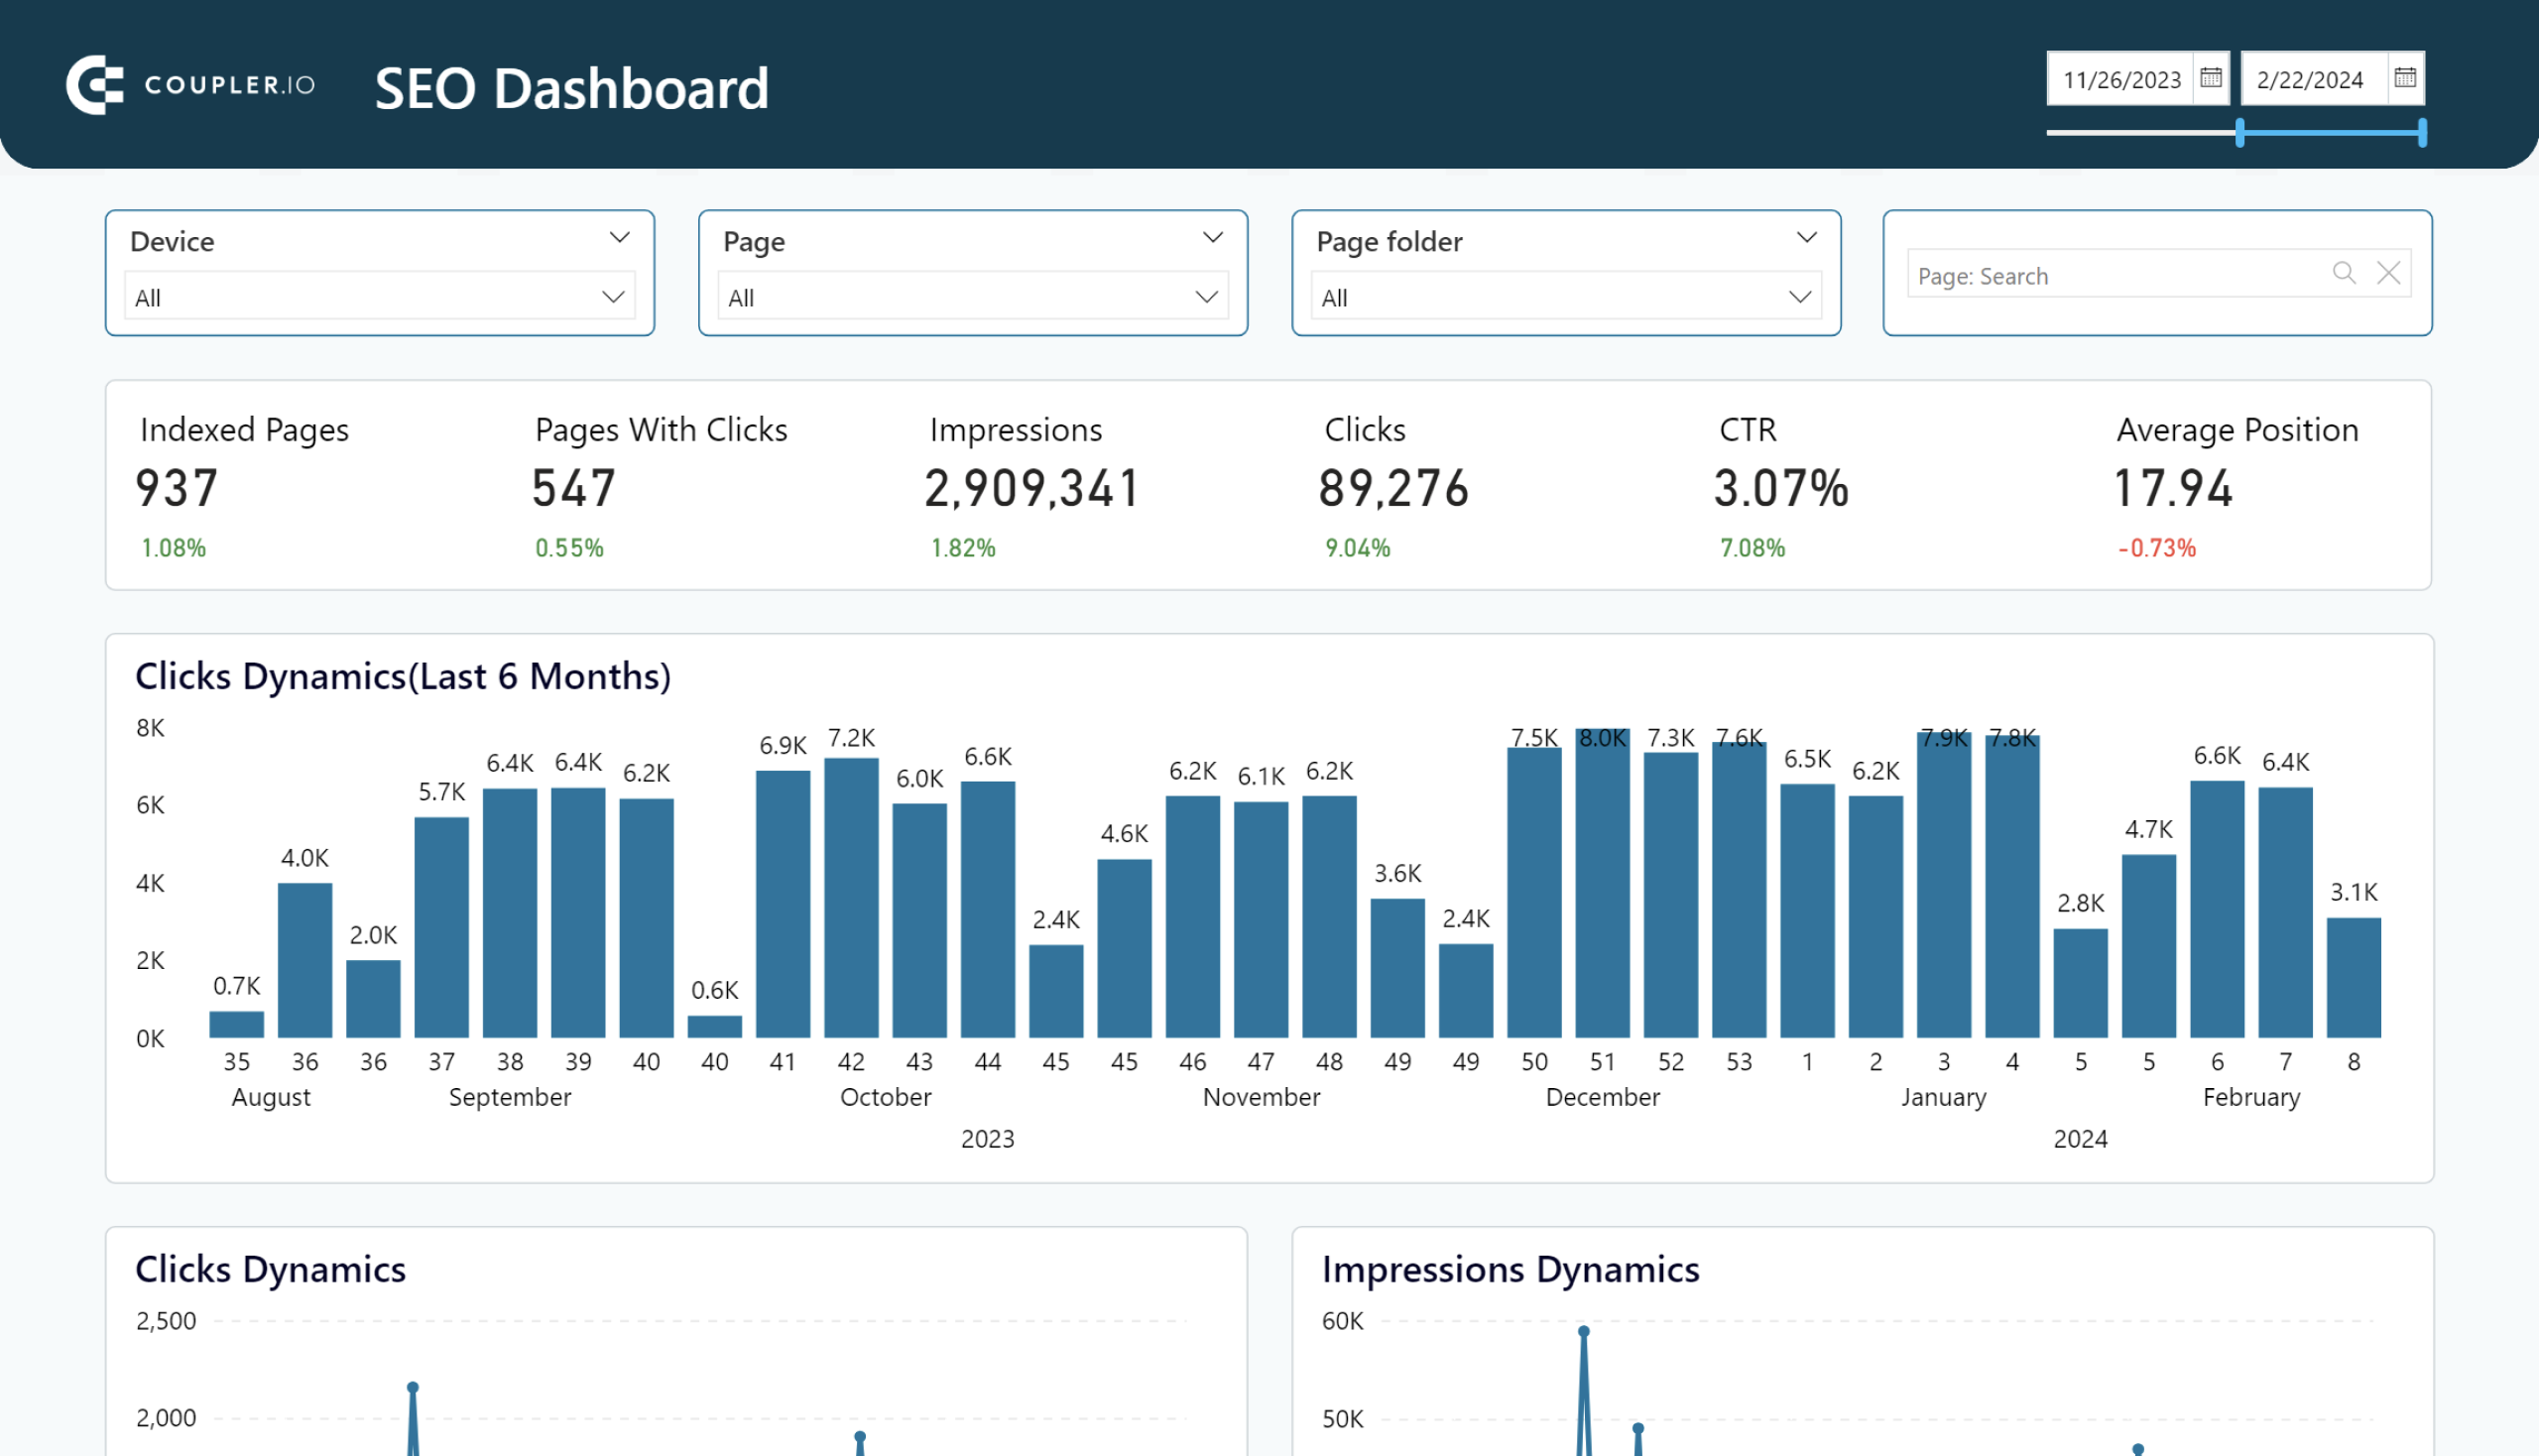
SEO dashboard for Google Search Console in Power BI
Preview dashboardFunction #1: SUM
The SUM(<column>) function is used to add up all the numbers in a column.
In marketing, you can use it to calculate metrics such as total clicks, total impressions, total ad spend, or any other cumulative metric.
There are two ways to use SUM in Power BI measures:
- Implicit measure: By dragging a numerical field from your data into a visualization. Power BI will sum up the values in that field by default if no other aggregation type is specified.
- Explicit measure: By writing a DAX formula. Some benefits of doing this are for reusability or flexibility, such as if you want to modify the aggregation logic or add filters.
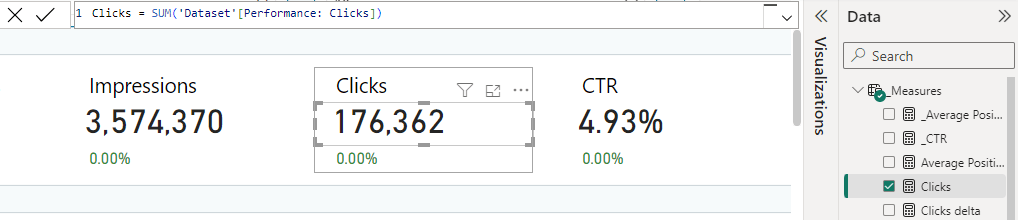
Example 1: Clicks and Impressions
In our SEO dashboard, the Clicks measure shows the number of times our page links were clicked on. It’s created “implicitly” by dragging the Performance: Clicks field to a chart. However, if you want, you can also define the measure explicitly using the SUM function with formula
= SUM('Dataset'[Performance: Clicks])

Note: If you’re new to DAX functions, you’ll find the steps on how to write them in a later section of this article.
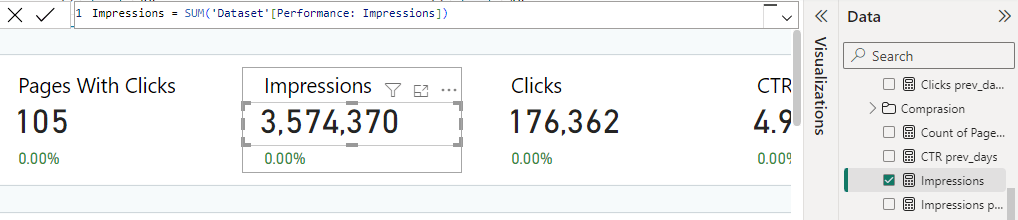
Similar to Clicks, the Impressions measure is created “implicitly” by dragging the Performance: Impressions field to a chart. Again, you can also define it explicitly with this formula:
= SUM('Dataset'[Performance: Impressions])
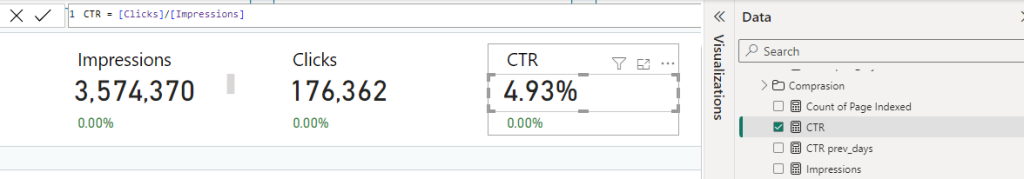
Example 2: Clicks-through rate (CTR)
The CTR is one of several metrics used in website traffic analytics to assess the effectiveness of your organization’s SEO strategy in attracting and retaining visitors.
To measure the CTR, use the formula: total clicks / total impressions. Here’s an example of this from our SEO dashboard:
= SUM('Dataset'[Performance: Clicks])/SUM('Dataset'[Performance: Impressions])
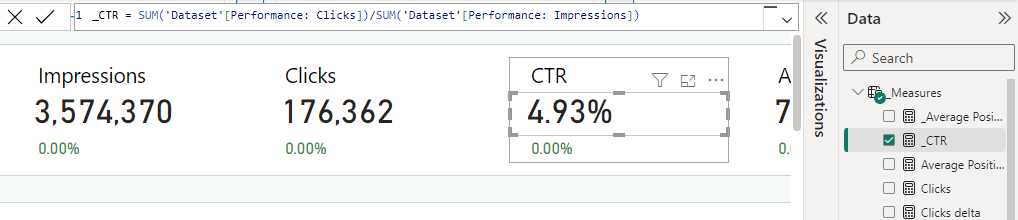
The first part of the formula sums up all the click values from the Performance: Clicks column. Similarly, the second part sums up all the impression values. The division operator (/) is used to divide the total clicks by the total impressions.
For the CTR formula, you can also reuse the Clicks and Impressions measures from Example 1. The formula is:
= [Clicks]/[Impressions]

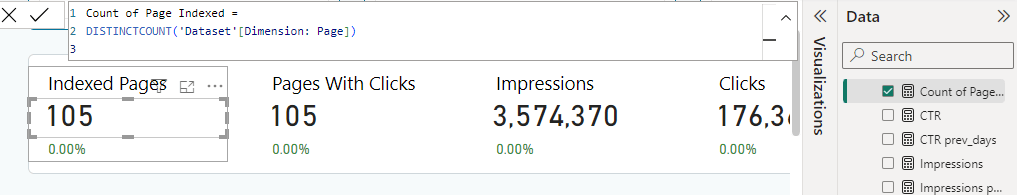
Function #2: DISTINCTCOUNT
The DISTINCTCOUNT(<column>) function counts the number of distinct values in a column.
In marketing, it can be useful for calculating metrics like the number of unique visitors, unique pages they visited, and distinct keywords.
Example:
In our SEO dashboard, we show the number of indexed pages by counting the distinct values from the Dimension: Page column.
= DISTINCTCOUNT('Dataset'[Dimension: Page])

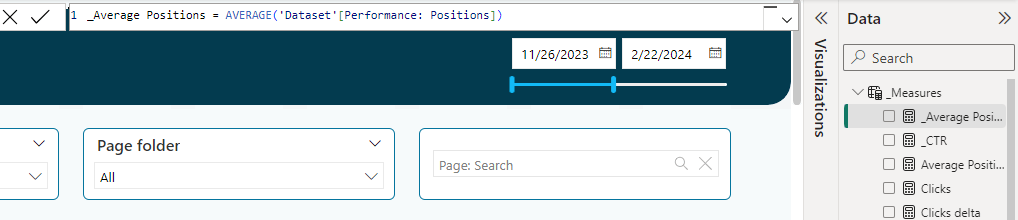
Function #4: AVERAGE
The AVERAGE(<column>) function is used to find the mean of a set of numbers.
In marketing, it can be used to calculate the average cost per click (CPC), average session duration, average bounce rates over a period, and other average values.
Example
The following formula is used in the _Average Positions measure. It shows the average values in the Performance: Positions column from the Dataset table.
= AVERAGE('Dataset'[Performance: Positions])
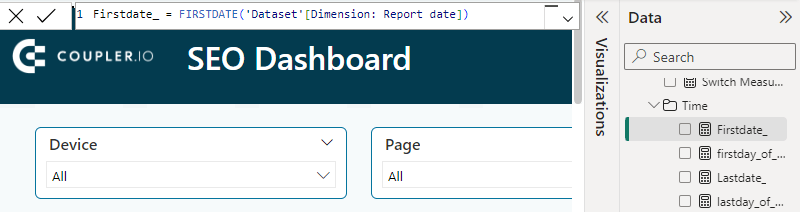
Function #5: FIRSTDATE and LASTDATE
The FIRSTDATE(<dates>) and LASTDATE(<dates>) functions return the first and last dates in the current context for the specified date column. These functions are ideal for time-based analyses where you need the first and last dates within a specific filtered period.
Example 1: Earliest report date
The following formula for the Firstdate_ measure finds the earliest report date in the dataset for the current context.
= FIRSTDATE('Dataset'[Dimension: Report date])

Example 2: Latest report date
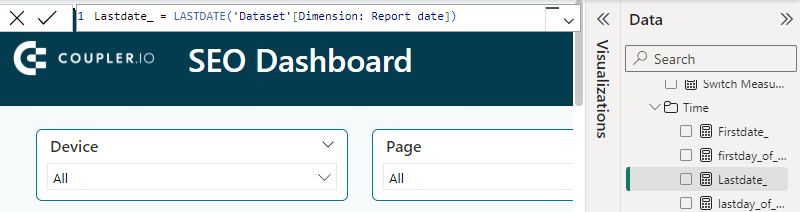
The following formula for the Lastdate_ measure finds the latest report date in the dataset for the current context.
= LASTDATE('Dataset'[Dimension: Report date])
Note: While the MIN and MAX functions can achieve similar outputs, FIRSTDATE and LASTDATE are specifically tailored for context-sensitive scenarios often required in time intelligence and reporting. This makes them more suitable for dynamic date calculations within filtered contexts.
Function #6: DATEDIFF
The DATEDIFF(<StartDate>, <EndDate>, <Interval>) calculates the difference between a start date and an end date. The return value can be in seconds, hours, days, weeks, months, quarters, or years.
In marketing, this function can be used, for example, to calculate the duration of marketing campaigns and track the days it takes to respond to leads.
Example
We use the DATEDIFF function for the firstday_of_comparison_ measure in our SEO dashboard with the following formula:
= [lastdate_]-(DATEDIFF([firstdate_],[lastdate_],DAY)+1)-(DATEDIFF([firstdate_],[lastdate_],DAY)+1)+1

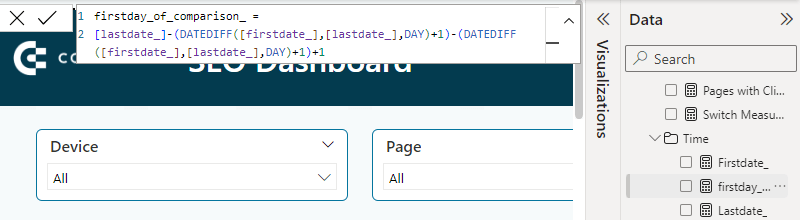
Focusing on the DATEDIFF([firstdate_], [lastdate_], DAY) function, you can see that it calculates the number of days between [firstdate_] and [lastdate_].
Function #7: DATESBETWEEN
The DATESBETWEEN(<Dates>, <StartDate>, <EndDate>) returns a table with a single column of dates within the specified start and end dates. It’s an elegant filtering function we can use within a lot of DAX formulas to create measures.
Example
We have the Impressions prev_days measure that uses the DATESBETWEEN function within its formula:
= CALCULATE(SUM('Dataset'[Performance: Impressions]),
    DATESBETWEEN('Dataset'[Dimension: Report date], [firstday_of_comparison_], [lastday_of_comparison_])
)

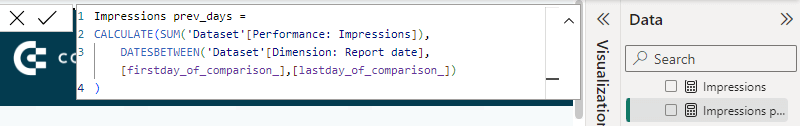
The DATESBETWEEN function returns a table that includes all the dates between firstday_of_comparison_ and lastday_of_comparison_.
Then, the CALCULATE function sums up the values in the Performance: Impressions column for the dates included in the DATESBETWEEN function’s results.
Function #8: ALL
The ALL(TableNameOrColumnName) function returns all the rows in a table or all the values in a column, ignoring any filters that might have been applied.
It’s important to note that ALL is not a standalone function; rather, it works in conjunction with other functions as part of an aggregate calculation.
Example
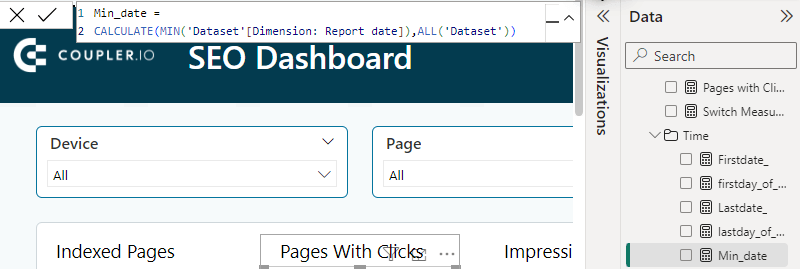
The following formula for our Min_date measure calculates the minimum report date in the dataset, ignoring any applied filters by using the function ALL('Dataset').
= CALCULATE(MIN('Dataset'[Dimension: Report date]),ALL('Dataset'))

Function #9: IF
The IF(<condition>, <value_if_true>[, <value_if_false>]) checks a condition and returns one value when TRUE and another when FALSE.
Example
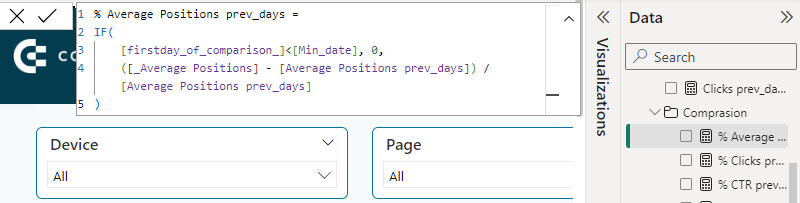
We have the % Average Positions prev_days measure that checks if the first day of the comparison is earlier than the minimum date. If true, it returns 0; otherwise, it calculates the percentage change in average positions. The formula uses IF as follows:
= IF(
    [firstday_of_comparison_]<[Min_date], 0,
    ([_Average Positions] - [Average Positions prev_days]) / [Average Positions prev_days]
)

Function #10: DIVIDE
The DIVIDE(<devidend>, <divisor> [,<alternateresult>]) function performs division similarly to the divide operator (/).
However, while the divide operator returns an error when dividing by zero, the DIVIDE function returns BLANK by default. You can also specify an alternate result for the function to return instead of BLANK.
It’s recommended that you use the DIVIDE function whenever the divisor is an expression that could return zero. In examples when the divisor is not 0, the divide operator will perform better because it will avoid unnecessary checking.
In our SEO dashboard, we use a DIVIDE function to calculate the Clicks Growth percentage.

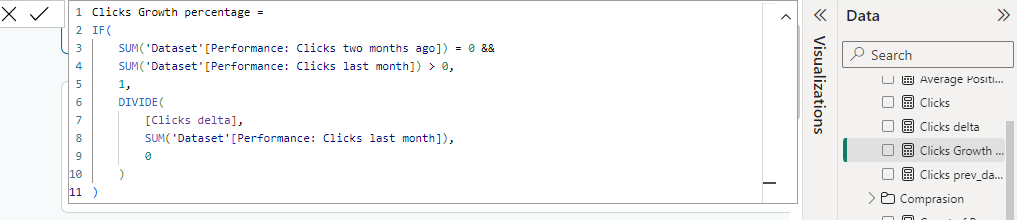
Please pay attention to the following snippet, which is part of the formula:
DIVIDE(
  [Clicks delta],
  SUM('Dataset'[Performance: Clicks last month]),
  0
)
The expression performs division efficiently and elegantly, returning 0 if the total number of last month’s clicks is zero.
The missing #3: CALCULATE function in Power BI
I’m sure you’re an attentive reader who has noticed that our list lacks function number 3. The thing is that, being the most important function in creating DAX measures, CALCULATE deserves a separate section to talk about.
CALCULATE is similar to the Excel SUMIF/SUMIFS functions but more powerful. It lets you take any aggregate function, not just limited to COUNT, SUM, or AVERAGE. You might want something like MAXIF, MINIF, or STDEVIF in Excel. With CALCULATE, you can make a version of these functions quickly. Moreover, you can use CALCULATE in pivot tables as part of a measure. While with SUMIF, you can’t.
What does CALCULATE do in Power BI?
The CALCULATE function evaluates an expression in a modified filter context.
To make it easier to understand, let’s have a look at an example to show how CALCULATE can help you.
Note: We use Microsoft’s Contoso Sales Sample file for Power BI. If you want, you can download the file and open it using Power BI Desktop. We assume you have the basics of Power BI and DAX.
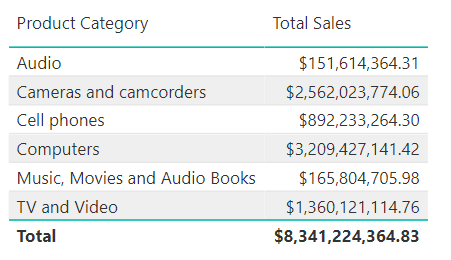
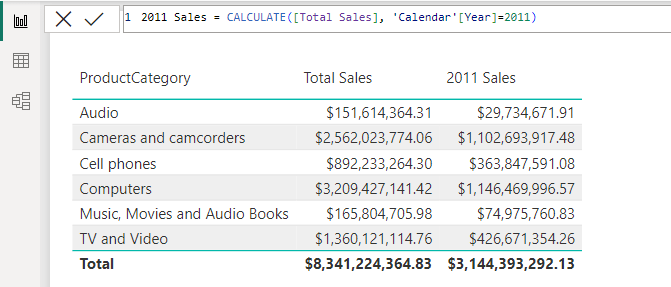
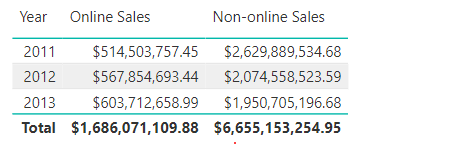
Let’s say you’ve created a table showing the total sales by product category as follows:

Then, for each product category, you want to show the total sales for 2011. You aim to compare this with the total sales from all the years and want this information displayed next to the Total Sales column. Moreover, you want the total sales for 2011 not to be affected by a slicer or any filter being used by the visual:

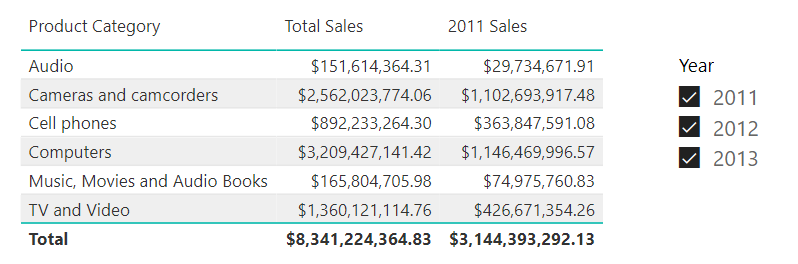
In this case, you need to apply different filter contexts for different measures in the same visual. This is where CALCULATE can help you.
Power BI CALCULATE syntax
Here is the DAX syntax for Power BI CALCULATE:
CALCULATE(<expression>[, <filter1> [, <filter2> [, ...]]])
The DAX CALCULATE function has two parameters or arguments:
<expression>is what you want to evaluate. This can be a DAX expression that is constructed using an aggregate function or a measure that defines an expression.<filter>: These are the conditions you want to apply to your data. You can include as many filters as needed.
Examples:
=CALCULATE(SUM(Sales[SalesAmount]),'Calendar'[Year]=2011)
=CALCULATE([Total Sales],'Calendar'[Year]=2011,Geography[RegionCountryName]="United States")
More on the filter parameter:
- You can also use <, >, <=, >=, and <> operators in the
<filter>. - CALCULATE accepts multiple filters that are combined in an AND logical statement. If you require an OR statement, you can use the “||” operator or the “OR()” style. Example:
=CALCULATE([Total Sales], 'Calendar'[Year]=2011 || 'Calendar'[Year]=2012)
=CALCULATE([Total Sales], OR('Calendar'[Year]=2011,'Calendar'[Year]=2012))
How to CALCULATE in Power BI: Step by step
To use CALCULATE in Power BI, first open Power BI Desktop.
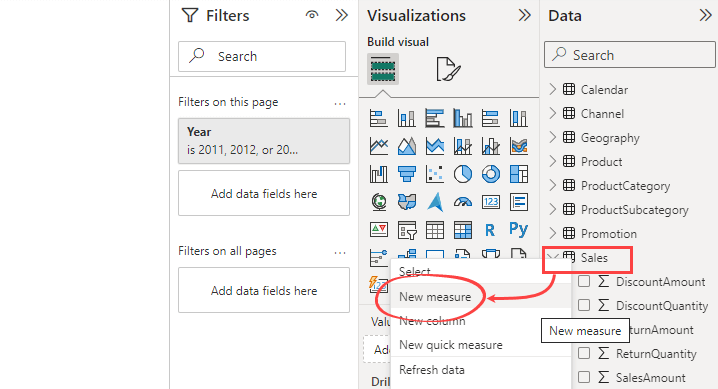
Then, on the Data pane on the right, select the table where you want to add a new measure. Right-click on the table, and select New measure. In our case, we add it to the Sales table:

On the formula bar, type a measure name and specify the formula. For example, here’s a simple CALCULATE function using SUM to find the total sales for 2011:
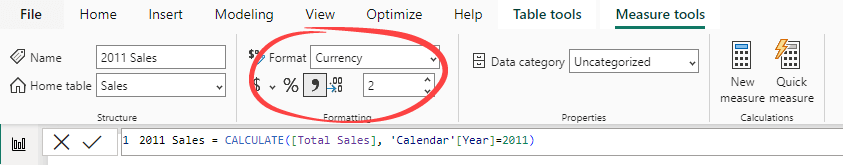
2011 Sales = CALCULATE(SUM(Sales[SalesAmount]), 'Calendar'[Year]=2011)
If you don’t like the long syntax, you can first define a Total Sales measure with this formula: SUM(Sales[SalesAmount]). Thus, your 2011 Sales measure would be:
2011 Sales = CALCULATE([Total Sales], 'Calendar'[Year]=2011)
Next, you can change how your measure looks in the Measure tools tab. For instance, you can display it to use currency with 2 decimal places, as shown below:

Power BI CALCULATE function in action
We’ll use the formula we just created in a visualization. For example, we create a table displaying product categories and two measures: Total Sales and our new 2011 Sales measure, which is always filtered for 2011.

Here are three key points about the formula:
- We use a measure named [Total Sales] in the
<expression>argument. You can also use any formula that could define a measure, likeSUM(Sales[SalesAmount]). - For the
<filter>argument, we don’t put 2011 in quotes because the Year column is in a number data type. If it were text, we’d have to write ="2011". - We only use one
<filter>in this example, but you can use as many as you need in one CALCULATE formula.
How the CALCULATE Formula in Power BI works
Now that we’ve used CALCULATE in a measure and displayed it in a table, let’s examine how this function works. Let’s say you add a slicer that filters the table for the year 2013. The CALCULATE formula in Power BI will override this existing filter and show the sales for 2011 instead.
This is because the <filter> arguments in CALCULATE are evaluated during the “filter” phase of measure calculation. They change the filter context given by the visual. This happens before these filters are applied to the source tables and before the calculation phase starts.

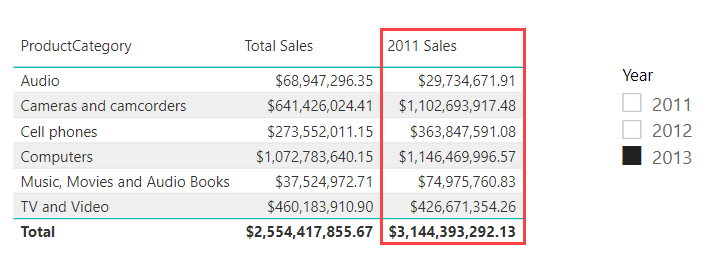
In addition, we can see that the filter in the CALCULATE formula Power BI adds a new layer to the filter context. The new filter (Year = 2011) is added on top of the existing one (ProductCategory). The result will be the intersection of these two filters, showing sales for each product category in the year 2011.
In conclusion, the CALCULATE function in Power BI helps you manipulate the context of your data calculations, giving you more control over your data analysis.
Some useful Power BI CALCULATE examples
We’ve been using the [2011 Sales] measure as a sample to demonstrate how CALCULATE works. However, it might not look very useful.
So, let’s move on to other use cases that are more applicable.
How to use CALCULATE in Power BI to compare sales based on store types
In our Consoso Sales data, we have four different store types: Catalog, Online, Reseller, and Store.
You may want to compare your Online Sales with other types. To do this, you can create two measures with the following formulas:
Online Sales = CALCULATE([Total Sales], Stores[StoreType] = "Online")

Non-online Sales = CALCULATE([Total Sales], Stores[StoreType] <> "Online")
Result:

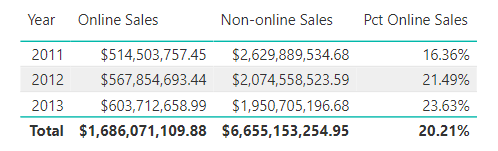
Staying on the practical path, let’s check the percentage of our total sales that are made up by online sales.
Pct Online Sales = [Online Sales] / [Total Sales]
Result:

How to use CALCULATE in Power BI to calculate % growth
In this example, we’re going to calculate the % growth of sales from the year 2011.
To do this, we need to use our existing measure that always tells us how many sales were made in 2011.
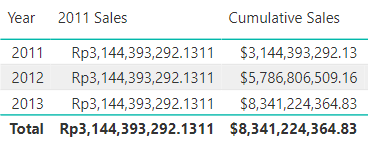
2011 Sales = CALCULATE([Total Sales], 'Calendar'[Year]=2011)
Also, a measure to get cumulative sales since 2011:
Cumulative Sales = CALCULATE([Total Sales], FILTER( ALLSELECTED('Calendar'[Year]), 'Calendar'[Year] <= MAX('Calendar'[Year])))
Result:

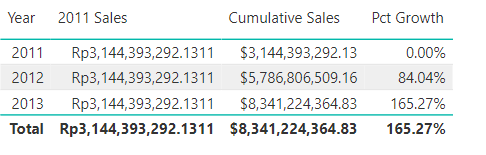
Then, we’ll add a measure that tells us the % growth in sales since 2011:
Pct Growth = DIVIDE([Cumulative Sales]-[2011 Sales],[2011 Sales])
Result:

Must-know basic DAX functions in Power BI
Other basic functions that may be useful are the common aggregation functions like MIN, MAX, and COUNT. Here are brief explanations about each of them:
- MIN: Returns the smallest value in a column.
Example:MIN('Dataset'[Dimension: Report date])
- MAX: Returns the largest value in a column.
Example:MAX('Dataset'[Dimension: Report date])
- COUNT: Returns the number of values in a column.
Example:COUNT('Dataset'[Dimension: Site URL])
Additionally, iterator functions such as SUMX, MINX, and AVERAGEX perform row-by-row operations and are extremely powerful for calculating more complex metrics.
Advanced DAX functions in Power BI for in-depth insights
Some other advanced functions that may also be useful for in-depth insights include SWITCH and SELECTEDVALUE.
- SWITCH: This function evaluates an expression against a list of values and returns the corresponding result. A common use of SWITCH is to replace multiple nested IF statements by setting the expression to TRUE.
Here’s a simple example of SWITCH we use in our SEO template:
SWITCH(TRUE(),
    V = "Impressions", SUM('Dataset'[Performance: Impressions]),
    SUM('Dataset'[Performance: Clicks])
)
The function evaluates whether the variable V is equal to Impressions and returns the sum of the Performance: Impressions column. Otherwise, it returns the sum of the Performance: Clicks column.
- SELECTEDVALUE: Returns the value currently selected in a column that has been filtered down to one distinct value only. If no single value is selected, it can return an alternate result specified by the user.
Syntax: SELECTEDVALUE(<columnName>[, <alternateResult>]).
This function is particularly useful for creating dynamic reports where users can interact with filters and slicers.
An example of its usage in our dashboard is to update visuals accordingly based on the Impressions/Clicks button selected by users. You can find the Switch Measure (Impressions/Clicks) that uses the SELECTEDVALUE in conjunction with SWITCH(TRUE) we explained previously.
Switch Measure (Impressions/Clicks) =
VAR V = SELECTEDVALUE('Selection filter(Impressions/Clicks)'[Value1])
RETURN
SWITCH(TRUE(),
V="Impressions",SUM('Dataset'[Performance: Impressions]),
SUM('Dataset'[Performance: Clicks])
)
The SELECTEDVALUE gets the value from the 'Selection filter(Impressions/Clicks)' table. After that, the SWITCH function performs checking and returns the correct result, which could be the total impressions or clicks.
Types of DAX functions in Power BI
Microsoft organizes DAX functions in Power BI into several types:
| Function | Description |
|---|---|
| Aggregation functions | Return a single value from calculating all rows in a column or table. These functions are essential for summarizing data. Common examples include SUM, AVERAGE, MAX, MIN, COUNT, COUNTROWS, DISTINCTCOUNT, and iterator functions like SUMX, AVERAGEX, and COUNTX. |
| Math and trig functions | Perform mathematical operations. Examples include ABS, DIVIDE, RAND, ROUND, and SQRT. |
| Logical functions | Allow you to apply conditional logic to your data. Examples include IF, IFERROR, AND, OR, NOT, COALESCE, SWITCH, FALSE, and TRUE. |
| Date and time functions | Handle date and time data in your models. Many of these functions are similar to Excel’s date and time functions. However, DAX functions use a datetime data type and can take values from a column as an argument. Examples include NOW, DAY, DATE, MONTH, and YEAR. |
| Text functions | Manipulate string data. Common examples include CONCATENATE, LEFT, RIGHT, SEARCH, LEN, LOWER, TRIM, and REPLACE. |
| Filter functions | Some of the most complex and powerful functions in DAX, differing greatly from Excel functions. These functions let you manipulate data context to create dynamic calculations. Examples include ALL, CALCULATE, FILTER, and LOOKUPVALUE. |
| Time intelligence functions | Create calculations that use built-in knowledge about calendars and dates, enabling meaningful comparisons across time periods. Common examples include DATEADD, DATESBETWEEN, FIRSTDATE, LASTDATE, and TOTALYTD. |
| Financial functions | Used in formulas that perform financial calculations. These functions are similar to financial functions used in Microsoft Excel. Examples: PRICE, RATE, and PMT. |
| Information functions | Determine whether a certain condition is met and return information about the value. For example, the ISERROR function returns TRUE if the value you reference contains an error. Other examples include ISBLANK, ISNUMBER, and CONTAINS. |
| Statistical functions | Calculate values related to statistical distributions and probability. Common examples include MEDIAN, RANKX, and LINESTX. |
| Relationship functions | Manage and utilize relationships between tables. Examples include RELATED, RELATEDTABLE, and USERELATIONSHIP. |
| Parent and child functions | Manage data presented as a parent/child hierarchy. Examples include PATH, PATHITEM, and PATHLENGTH. |
| Table manipulation functions | Return a table or manipulate existing tables. Examples of this include ADDCOLUMNS, SUMMARIZE, and SELECTCOLUMNS. |
| Other functions | Perform other actions that cannot be defined by any of the categories. Examples include TOJSON, BLANK, and ERROR. |
For comprehensive information on the Power BI DAX functions list, along with detailed syntax and examples of each function, you can visit the DAX function reference.
How to write DAX functions in Power BI
The syntax is relatively easy to understand, following familiar patterns like Excel formulas. However, the logic behind the calculations can be quite challenging for beginners.
If you’re just getting started, this tutorial provides a simple guide that includes the steps for creating DAX formulas, along with an explanation of the syntax and operators. Writing DAX Power BI functions proficiently takes practice, so take your time learning it ?
Step by step of writing DAX functions
Using our SEO dashboard template, let’s say you want to create a measure that summarizes the total clicks. Here, we’ll use the SUM function. The steps are as follows:
- In the Data pane on the right, select the table to which you want to add a new measure. Then, right-click and select New measure.

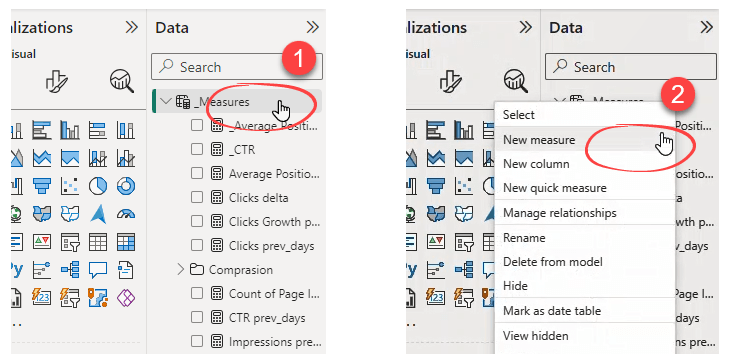
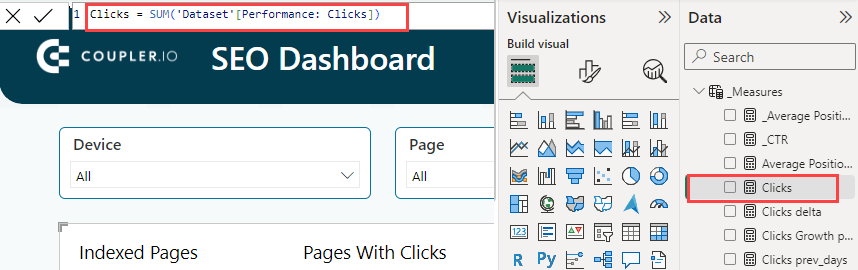
- In the formula bar, type the measure name and DAX formula. Let’s call the new measure Clicks. As we sum the Performance: Clicks column from the Dataset table, type
Clicks = SUM('Dataset'[Performance: Clicks])and press Enter. The new measure will be added to your data model:

Syntax
A function can be part of a formula. A DAX formula itself always starts with an equal sign (=), followed by any expression that can include elements like functions, operators, constants, or references to columns or tables.
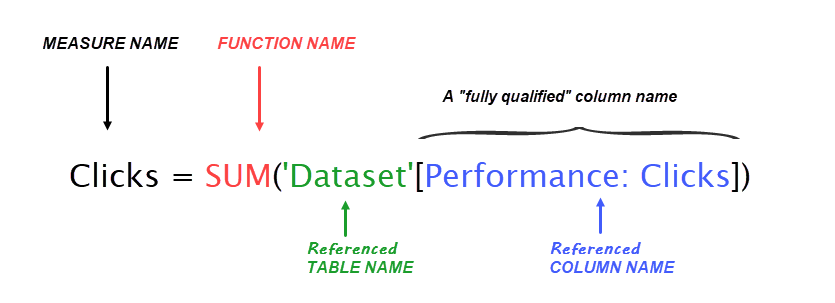
Here’s the breakdown of the previous Clicks formula piece by piece:

Explanation:
- The syntax starts with the measure name. Please note that you can use spaces, such as Total Clicks. The measure name must always be in brackets when referenced in formulas.
- After the measure name, an equal sign indicates the start of a DAX formula.
- The function SUM is used with the argument
'Dataset'[Performance: Clicks]inside parentheses. It uses a fully qualified column name: table name followed by column name in brackets. Please note that single quotes are optional for table names without spaces but necessary for table names that contain spaces (E.g.,'Dataset Table').
Some important notes related to functions:
- Calculated columns don’t always use functions, but measures do.
- Most Power BI DAX functions need one or more arguments/parameters, but some don’t—like PI, TODAY, and NOW. However, you must still use parentheses to show no arguments are needed. For example, type NOW(), not NOW.
- You can nest functions within other functions.
- DAX has several functions that return tables. You typically use these tables as input for other functions that need tables as input.
Operators
DAX operators are often used within functions to perform various calculations and logical operations. The different types of operators in DAX are: arithmetic, comparison, text, and logical operators.
- Arithmetic operators: Performs basic mathematical operations.
| Operator | Description | Example |
|---|---|---|
| + | Addition | 2+3 |
| – | Subtraction | 8-4 |
| * | Multiplication | 4*2 |
| / | Division | 9/3 |
| ^ | Exponentiation | 2^3 |
- Comparison operators: Compares values and returns TRUE or FALSE.
| Operator | Description | Example |
|---|---|---|
| = | Equal to | [Currency] = “USD” |
| == | Strict equal to | [Currency] == “USD” |
| > | Greater than | [Order Quantity] > 40 |
| < | Less than | [Order Quantity] < 5 |
| >= | Greater than or equal to | [Unit Price] >= 1000 |
| <= | Less than or equal to | [Unit Price] <= 50 |
| <> | Not equal to | [Category] <> “Bikes” |
- Text concatenation operator: Combines text strings.
| Operator | Description | Example |
|---|---|---|
| & | Concatenates strings | [City] & ” ” & [State] |
- Logical operators: Performs conditional checking.
| Operator | Description | Example |
|---|---|---|
| && | Creates an AND condition between two logical expressions | ([Currency] = “USD”) && ([Order Quantity] > 10) |
| || | Creates an OR condition between two logical expressions | ([Currency] = “USD”) || ([Country] = “US”) |
| IN | Creates a logical OR condition based on a given list in curly brackets | ([Category] IN {“Bikes”, “Accessories”, “Components”}) |
Create self-updating marketing reports in Power BI with Coupler.io
While most marketers can analyze data, reporting is a different thing. Reporting may take just as much skills and time as analyzing data.
A Gartner report shows that marketing leaders struggle in using data for effective reporting and decision-making. In fact, displaying real-time information in the dashboards is often blocked by technical issues surrounding the data.
Coupler.io can help. This reporting automation solution lets you connect 60+ cloud sources to Power BI and schedule automatic data refresh. It supports marketing and analytics apps like Facebook Ads, TikTok Ads, and Google Search Console — which Power BI doesn’t.
Try it yourself – select the required data source in the form below and then click Proceed. You’ll be offered to create a free Coupler.io account and then configure the connections following the in-app instructions.
As an added benefit, Coupler.io offers free dashboard templates to save you time. The templates in Power BI come equipped with DAX functions to display most key marketing metrics. You can also customize them by modifying existing measures or adding your own to meet your specific reporting needs.
Make data-driven decisions with confidence with DAX functions & Coupler.io’s dashboard templates
As we’ve explored, DAX functions in Power BI are indispensable tools for marketers looking to make data-driven decisions. These functions help streamline and enhance your marketing analysis, from calculating complex metrics to generating insightful reports.
But why stop there? With Coupler.io and its array of dashboard templates, you can harness the full potential of these powerful DAX functions to optimize your digital marketing and SEO strategies. The templates not only save you time but also ensure you always have accurate, up-to-date insights.
Be sure to transform your marketing reporting. Start using DAX functions with our dashboard templates today and see the difference they can make in your data analysis ?
Connect your cloud apps to Power BI with Coupler.io
Get started for free